Embed Size (px)
Citation preview

Journal of Engineering Geology Volume XLIII, Nos. 1 & 2
A bi-annual Journal of ISEG June-December 2018
48
Stability assessment of high cut slopes in soft rocks -A case study, Dubai
Shatnawi, Mohammad K.
Ahmed, Mohd J.
Musthafa, K. Mohammed
Jacob, Kurian
Nadeem, Kashif
Arab Centre for Engineering Studies, Dubai, UAE
Abstract
The proposed project clean coal fired power plant of 4×600 MW is located Dubai, UAE. The project besides the main structures for a typical gas based thermal plant, includes the construction of a pump house. The pump house foundations involve the deepest, over 18 m of excavation, generating high cut slopes. The stability of these high cut slopes has a definite bearing on the short term safety and performance of the structures in the project. The excavated slopes has silty sandy shallow overburden layer, below which distinctly to partially weathered sandstone is noticed up to a depth range of 6.0m to 18.00m thick followed by Siltstone reach to the toe depth. As very weak rock with obliterated discontinuities/ joints exposed in the sections may behave typically as a soil mass .Weathered rock mass is also noticed up to a depth below 7 m also. The rock mass is sub-horizontally bedded with two joints set only. To provide the design engineers with the required measures to design stable cut slope angle vis-à-vis slope protection measures to enhance the stability and safety of the cut slopes, the stability assessment study was taken-up during construction. The stability of the excavation slope was evaluated systematically to advise/ suggest any preventive measures to be taken including protection. The paper deals with the systematic evaluation and analysis carried out using geo-techniques like geologic mapping, terrestrial photography, stereographic/ Kinematic admissibility checks and analytical checks using specialist software programmes. Key words: Cut slopes, geologic mapping, terrestrial photography, kinematic admissibility check, analytical check, slope protection.
1. Introduction:
In order to reduce substantially the carbon emissions and implement the Dubai Clean Energy Strategy 2050, the govt. is working on major projects to diversify the energy mix and manage the demand for electricity. The energy mix plan to be generated is targeted for 25 % of solar power, 7% from nuclear, 7% from clean coal and 61% from gas by 2030. The case study project is a clean coal fired power plant of 4×600 MW. The site location is located in Dubai-U.A.E. The excavation of the site has generated the cut slopes of +18.0m height. 2. Geology of Dubai:
The ancient shallow sea, ‘The Tethys’, once covering the whole region of UAE, rose and fell, influenced by major world climatic changes, and deposited sediments for at least 500 million years (from Cambrian age onwards). The layers of rocks, at places several kilometers thick, were thus formed in pockets of this ancient sea-bed. In general, in UAE the Palaeozoic basement rocks are overlain by the Mesozoic to tertiary sedimentary rocks, and later overlain by the volcanics and the continental shelf sediments. Cutting
Journal of Engineering Geology
A bi-annual Journal of ISEG
deep into the sedimentary series, erosion has exposed the deformed and thrusted ancient and volcanic rocks which are well exposed within the NNE Mountains of Eastern UAE and the Musandam peninsula of northern Oman. The Dubai area is mostly occupied by the Tertiary rocks which were deposited in a shallow shelf platform environment.
The rock formations noticed in Dubai area are mostly the mid to upper Tertiary sediments of Berzman formations, consisting of an interbedded sequence of carbonate rich arenaceous, argillaceous and rudaceous/ conglomeratic rocks. Underlying a silty, soil cover of 2 – 11 m depththin interbeds of siltstone are noticedargillaceous/ calcisiltites with interbeds of polymictic conglomeratesgravel size clasts of gabbros, chert, sandstones and carbonate rocksthick evaporate- gypsum beds associated with clays and mudstones are noticed beyond a depth of 80 – 100 m. These are continental shelf deposits with a depositional
Journal of Engineering Geology
annual Journal of ISEG
49
deep into the sedimentary series, erosion has exposed the deformed and thrusted ancient and volcanic rocks which are well exposed within the NNE –
of Eastern UAE and the Musandam peninsula of northern Oman. The Dubai area is mostly occupied by the Tertiary rocks which were deposited in a shallow shelf
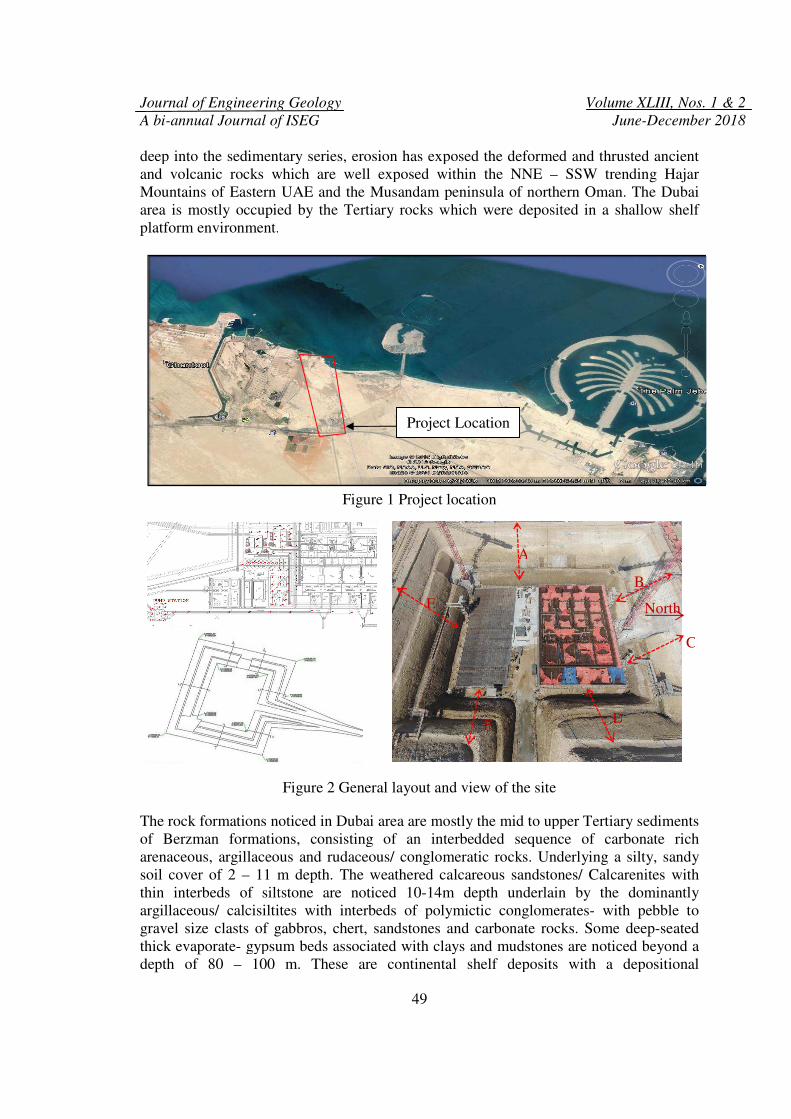
Figure 1 Project location
Figure 2 General layout and view of the site
The rock formations noticed in Dubai area are mostly the mid to upper Tertiary sediments of Berzman formations, consisting of an interbedded sequence of carbonate rich arenaceous, argillaceous and rudaceous/ conglomeratic rocks. Underlying a silty,
11 m depth. The weathered calcareous sandstones/ Calcarenites with thin interbeds of siltstone are noticed 10-14m depth underlain by the dominantly argillaceous/ calcisiltites with interbeds of polymictic conglomerates
el size clasts of gabbros, chert, sandstones and carbonate rocksgypsum beds associated with clays and mudstones are noticed beyond a 100 m. These are continental shelf deposits with a depositional
Project Location
A
E
F
Volume XLIII, Nos. 1 & 2
June-December 2018
deep into the sedimentary series, erosion has exposed the deformed and thrusted ancient – SSW trending Hajar
of Eastern UAE and the Musandam peninsula of northern Oman. The Dubai area is mostly occupied by the Tertiary rocks which were deposited in a shallow shelf
The rock formations noticed in Dubai area are mostly the mid to upper Tertiary sediments of Berzman formations, consisting of an interbedded sequence of carbonate rich arenaceous, argillaceous and rudaceous/ conglomeratic rocks. Underlying a silty, sandy
he weathered calcareous sandstones/ Calcarenites with underlain by the dominantly
argillaceous/ calcisiltites with interbeds of polymictic conglomerates- with pebble to el size clasts of gabbros, chert, sandstones and carbonate rocks. Some deep-seated
gypsum beds associated with clays and mudstones are noticed beyond a 100 m. These are continental shelf deposits with a depositional
North
B
C
D

Journal of Engineering Geology Volume XLIII, Nos. 1 & 2
A bi-annual Journal of ISEG June-December 2018
50
environment similar to the present day environment with frequent sea migrations/ eustatic changes, deserts and the weathered products of the weak tertiary rocks. The frequent sea level changes with harsh climatic conditions have given rise to the surficial sabkah deposits during the quaternary times on wards along the coast lines.
3. Site Specific Geology:
The site located in Dubai- U.A.E is characterized by a gently undulating terrain. The ground elevations in the study area are around 4.5±1m. The excavated slopes consist of 0.5 – 3.0 m thick sand overburden layer, below which distinctly to partially weathered (Gr.III/ II) is noticed up to a depth range of 6.0m to 18.00m thick (locally highly weathered reddish brown) followed by slightly weathered (Gr.II) Siltstone to reach of toe depth. Wide Pockets of intensely jointed/ fractured rock mass is seen distributed on the cut slope. Weathered rock mass is also noticed up to a depth below 7 m also. In general the ground water table at the site was 2-3m below existing ground. Extensive dewatering by pumping was resorted for handling the seepages. The mapping included cut slopes based on terrestrial photography, characterization of the slopes on photo-mosaics. Details of the slopes like lithology/ rock type, contact zones, joint traces, weak seams/ veins, fractured zones, over break zones, etc. were marked over the photo mosaics using the AUTOCAD programme, for cut slope. Typical output is shown below
Figure 3 Geological section along slopes
4. Joint data collection:
The discontinuity data azimuthal directions, dip amount, dip direction and joint/ surface
parameters were measured from the cut slopes by global or scan line method, with the
help of the geological compass, Schmidt’s hammer etc. The data collected from each
slope location were analyzed using DIP-6 software. The major joint sets were identified

Journal of Engineering Geology Volume XLIII, Nos. 1 & 2
A bi-annual Journal of ISEG June-December 2018
51
and are shown below in the table 1. The output of rose diagram and great circle is shown
Figure 4.
Table 1
Summary of discontinuity / Joints set (from Dip 6 analysis)
Sl.
N
o
Join
t Set
Dip
Directio
n
Dip
Amoun
t
Dip
Surfac
e
Joint
Fillin
g
Spacin
g
(cm)
Persistenc
e
(m)
Apertur
e
(mm)
Weatherin
g
1 J1 132 34 Rg& P1
Si 20-50 2.0 Tg-op III/II
2 J2 29 18 Rg-Un Si 20-50 2.0 Tg II
Rose diagram
Pole Diagram with great circle
Figure 4 site specific Plots of joint data analysis (DIPs 6)
At this site, the strength parameters (c & Ø) of the intact rock mass and along the joint planes were considered based on the experience & available lab test results.
5. Sampling:
Core samples were collected from over eight (08) locations covering all types of material/ rock for testing in the laboratory at ACES Lab. The samples were wrapped with cling film and waxed properly at site before transportation to the laboratory. 6. Lab Testing:
In order to determine the physical properties and shear strength parameters of rock samples, laboratory tests were performed on the core samples. Rock Shear tests (on selected rock samples) from cores were carried out to assess the shear strength parameters. The typical procedure is illustrated in below fig 4 was followed for sample preparation and testing.

Journal of Engineering Geology Volume XLIII, Nos. 1 & 2
A bi-annual Journal of ISEG June-December 2018
52
Figure 5 Schematic display of direct shear test for intact rock mass& rock joints
7. Methodology of Analysis:
1. Empirical method:
Kinematic admissibility checks with identification of potential wedges and joint
set combinations using DIPS 6 programme.

Journal of Engineering Geology Volume XLIII, Nos. 1 & 2
A bi-annual Journal of ISEG June-December 2018
53
2. Analytical method:
� Stability checks of the potential planes (by empirical method) using Rockplane, Swedge, for a FoS of 1.5 for potential cut slope.
� sigmaW programme was used for circular failure condition
3. Protection Measures:
Identification of the required protection or stabilization measures if required.
8. Empirical method:
The dominant joint sets were plotted on the wolf’s stereo net, lower hemisphere to identify potential modes of failure (plane, wedge etc.) and check the stability of the proposed cut slopes. The following data was used for the empirical analysis with Dips 6 programme for the 4
slopes:
� The azimuth and dip amount of the two identified joint sets (see table 1)
� The existing cut slope direction and angle of 45o (i.e. 1H: 1V).
� Average angle of internal friction (tanΦ) of 30o.
� The lateral limit of 20o.
The results of the empirical analysis using Dips 6 software are presented below.
Stereogram Plane Stereogram Wedge
Figure 6 site specific Plots of kinematic admissibility check (DIPs 6) for North Slope
The output are summarized in below table

Journal of Engineering Geology Volume XLIII, Nos. 1 & 2
A bi-annual Journal of ISEG June-December 2018
54
Table 2 Summary of Kinematic admissibility checks for all slopes
Cut-Slope Slope Angle
(deg)
Type of Kinematic Analysis performed
Planar Wedge Flexural Toppling
North Slope
45
X X X
East Slope � X X
South Slope X X X
West Slope X X X
Note: X - no failure ; � – potential
Based on the kinematic analysis, set J-1 (132/34) is identified to be potential for planar mode of failure on the East slope. 9. Analytical Checks
The checks were performed using Rock science program (RocPlane & SWedge) software
using the following parameters. The analysis shows a FoS = 1.08. Blocks may cause
small Plane failures, which are manifested at site. No potential wedge blocks were
identified in the check or noticed on the slopes. Since the slopes are temporary in nature
the above FoS is considered to be acceptable.
Figure 7 Site specific Plane Failure (Roc Plane analysis)
As very weak rock with obliterated discontinuities/ joints exposed in the site sections may behave typically as a soil mass, hence the global stability with the concept of circular failure was also checked. A 2D analysis (Morgenstern –Price method) for local and global cases was performed using Slope/W- a FE based software (www.geo-slope.com). The analytical checks were performed for both static and dynamic (g=0.15) cases.
The following parametric values were used for the analytical checks:

Journal of Engineering Geology Volume XLIII, Nos. 1 & 2
A bi-annual Journal of ISEG June-December 2018
55
Table 3 Parameters used for Analytical checks
Parameter Unit Value Remarks
� Cut slope angle…………... � Cut slope height………….. � Density…………………… � Cohesion…………………. � Friction angle……………. � E- Modulus……………...
Deg M t/m3
t/m2
Deg. MPa
45 5-7 / 18 1.80/ 2.20 2/ 7 33/ 35/ 27 100
Bench/ slope sand / rock Sandstone / Siltstone Sand /Sandstone / Siltstone Weathered sandstones & top soil.
The output of analysis for slope is shown below:
Local (1st bench 5-7m) - output Global >17m- Output
Static Dynamic Static Dynamic
Figure 8 Output of analysis for slope using Slope W
The summary of the analysis is shown below in the table 4
Table 4 Summary of Factor of Safety for each section
Section
ID
Factor of Safety
Static Condition Dynamic Condition
Local
Global
Local
Global 1st
Bench
(5-7m)
2nd
Bench
(7m)
Combination
of 1st& 2nd
Bench
(>10m)
1st
Bench
(5-7m)
2nd
Bench
(7m)
Combination
of 1st& 2nd
Bench
(>10m)
A 3.062 2.440 2.512 2.149 2.612 2.084 2.116 1.809
B 2.848 1.809 2.432 2.076 2.413 1.552 2.045 1.758
C 2.464 2.169 2.211 1.749 2.097 1.871 1.873 1.488
D 2.676 2.250 2.203 1.980 2.336 1.936 1.880 1.690
E 2.223 2.702 2.253 1.904 1.934 2.308 1.923 1.623
F 2.737 2.599 2.030 2.035 2.343 2.222 2.542 1.716
Sandstone
Siltstone

Journal of Engineering Geology Volume XLIII, Nos. 1 & 2
A bi-annual Journal of ISEG June-December 2018
56
10. Conclusion& Recommendations:
The study optimized/ minimized the slope protection measures. The temporary cut slopes
were safe. The recommended measures were scaling of the loose, overhanging blocks and
proper channelization of the seepages with toe drains.
References:
1. ACES (2010). Geotechnical investigation report No. SS/18- 000016 dated 10th
April’18, slope stability analysis for pump station, Dubai 2. Emad. Y. Sharif & Mohd. J. Ahmed (2010). Engineering Geology of Dubai 3. British Geological survey (2006). Geology and Geophysics of United Arab
Emirates, vol.2 & 4. 4. Duncan C. Wyllie (1999). Foundations on Rock (2nd Edition), E & FN Spon. 5. Hoek. E and Bray. J. W. (1999). Rock Slope Engineering (Revised third edition)
Institution of Mining and Metallurgy, U.K.