Embed Size (px)
Citation preview

Journal of Geography and Geology; Vol. 4, No. 2; 2012 ISSN 1916-9779 E-ISSN 1916-9787
Published by Canadian Center of Science and Education
48
Stability of Rock Slopes along Raidah Escarpment Road, Asir Area, Kingdom of Saudi Arabia
Ahmed M. Youssef 1,3, Norbert H. Maerz2 & Abdulla A. Al-Otaibi3 1 Geology Deprtment, Faculty of Science, Sohag University, Egypt 2 Program Head, Geological Engineering, Missouri University of Science and Technology, Rolla, MO, USA 3 Geological Hazards Department, Applied Geology Sector, Saudi Geological Survey, Jeddah, KSA
Correspondence: Ahmed M. Youssef, Geology Deprtment, Faculty of Science, Sohag University, Egypt; Geological Hazards Department, Applied Geology Sector, Saudi Geological Survey, P.O. Box 54141, Jeddah 21514, KSA. Tel: 966-568-448-782. E-mail: [email protected]
Received: April 1, 2012 Accepted: April 19, 2012 Online Published: May 18, 2012
doi:10.5539/jgg.v4n2p48 URL: http://dx.doi.org/10.5539/jgg.v4n2p48
Abstract
The Raidah Escarpment road is located north west of Abha city, Asir region, Kingdom of Saudi Arabia. This escarpment road represents an important corridor in the area which connects different villages and tourist resorts with each other. The total length of this road section is about 9 km which passes through a highly mountainous area. The road also passes through areas of different geological hazards (rock, debris flow, soil, and weathered zones). The different environmental factors (e.g. intensive rainy summer), variable geological and structural elements (weak rocks, slide debris weak soils, shear zones, and faults) difficult road characteristics (narrow roads with tight horizontal andvertical curvature) and various human activities in the area make the road susceptible to frequent slope failures (rockfalls, rock sliding, debris flow, soil slides, and raveling) from time to time. This paper deals with the evaluation of the stability of the rock cuts along the Raidah escarpment road using two methods including a structural controlled method and a raveling type method.
Raidah escarpment rock cuts have been classified into sixty nine stations which were investigated and subsequently rated. Results of this study indicated that: (1) Based on the structiural control mode of failures, it was found that 12 stations are potentially unstable due to planar, wedge, and toppling failures, and out of them five stations have a major impact on the road in the event of failure, including stations 11, 17, 20, 31, and 40. (2) According to the Modified Colorado Rockfall hazard rating system, it was found that 13, 12, 13, 17, and 49 stations are of high, high to moderate, moderate, moderate to low, and low hazard. On the other hand, it was found that 13, 11, 11, and 69 stations have a high, high to moderate, moderate, and low impact on the road in the case of failure. (3) According to the field simulation tests it was found that 6 stations potentially show highly problems from rolling and bouncing rocks. However, out of these sites it was found that only 4 stations have a high impact on the road due to rolling and bouncing. (4) the areas that are impacted by the debris flows have been mapped and determined. Finally, different recommendations and remediation methods have been discussed to minimise the impact of problimatic sites.
Keywords: slope stability, raidah escarpment, rating systems, structural controlled sliding, KSA
1. General Background of the Raidah Area
The Raidah area is a mountainous terrain and it is located in the Asir region on the western side of the Kingdom of Saudi Arabia (KSA) (Figure 1). Many highways have been constructed in the Asir reigon, and these roads and highways traverse through topographically challenging terrain which in many cases requires the construction of significant rock cuts. Many of these rock cuts were constructed using uncontrolled blasting techniques and/or mechanical excavation, resulting in highly unstable slopes that are highly irregular and contain numerous weak zones. Even slopes cut using newer pre-split blasting techniques deteriorate over time as a consequence of the harsh climate of the area. This climate is typified by periods of significant precipitation in summer that act as a triggering factor for deteriorating the rock cuts, and consequently develop areas of high risk for rock/soil slides and rockfalls. The Raidah escarpment road is located in the south west of the Asir region (Figure 1). This road was designed and constructed by the Department of Transportation in KSA. There are different situations along
www.ccsenet.org/jgg Journal of Geography and Geology Vol. 4, No. 2; 2012
49
the road that cut through the area such as rock cuts, block in matrix, and debris flow. These require ongoing maintenance to allow them to perform as designed during the intitial construction.
Figure 1. Location map of Asir region and the study area
The village of Raidah lies adjacent to the Asir Mountains National Park. Located on the steep slope below Jabal Sawdah, and covering only 14 sq km, Raidah Park is managed by Saudi Wildlife Commission , with public access possible for educational groups. This unique area is home to nine of the ten indigenous bird species of Saudi Arabia, including the Arabian red-legged partridge, Arabian serin, Arabian waxbill, Asir magpie, Philby’s rock partridge, South Arabian wheatear, and Yemen warbler. Other birds that were recorded here are Arabian woodpecker, Barbary falcon, Kestrel, Long-legged buzzard, Shikra (African sparrowhawk) and the short-toed eagle (www.ncwcd.gov.sa/english/raydah.aspx).
2. General Background of the Raidah Escarpment Road
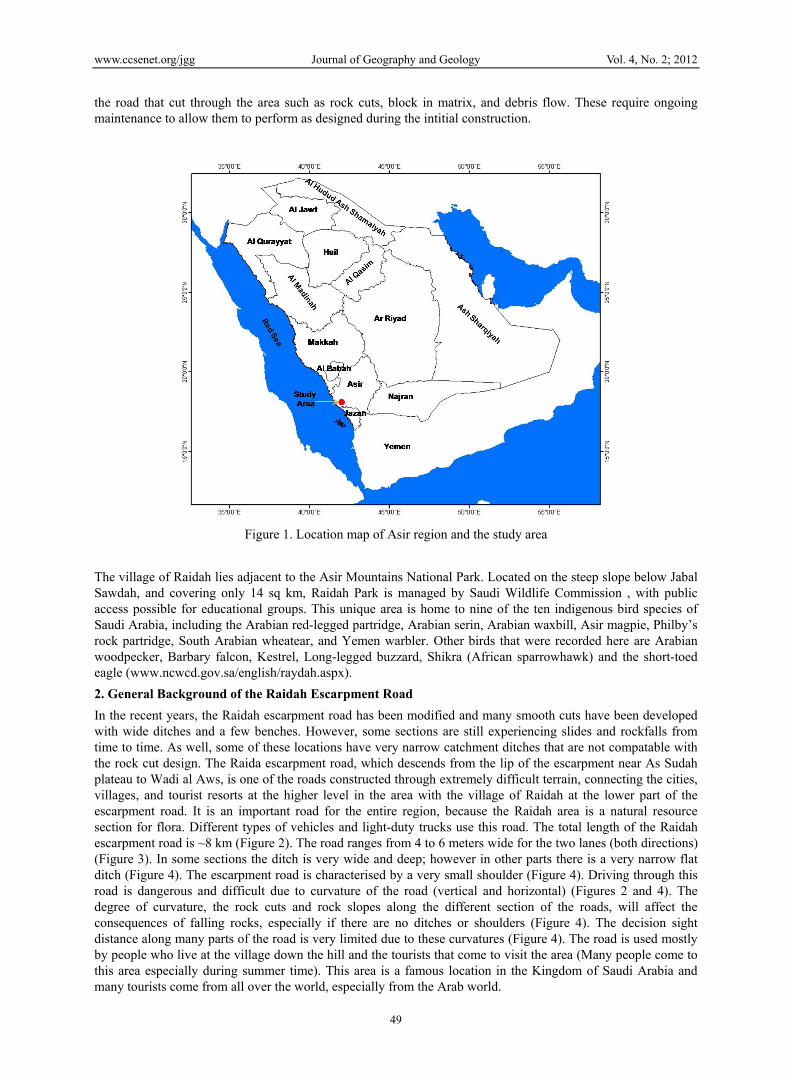
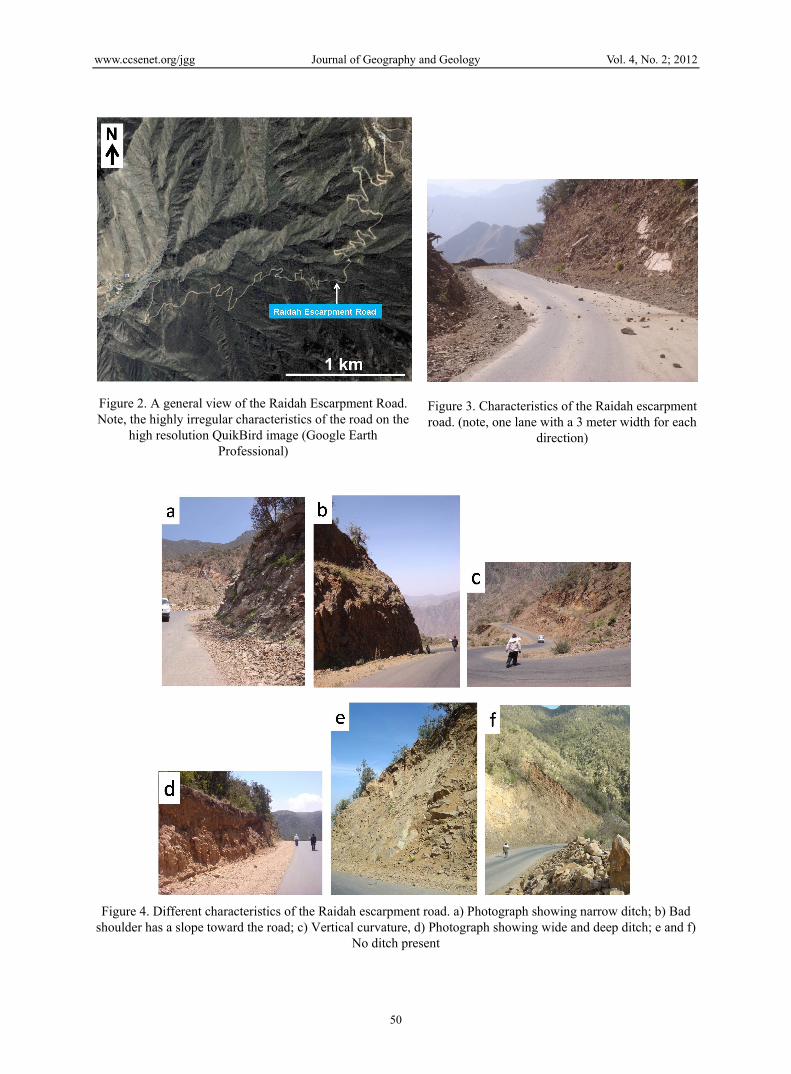
In the recent years, the Raidah escarpment road has been modified and many smooth cuts have been developed with wide ditches and a few benches. However, some sections are still experiencing slides and rockfalls from time to time. As well, some of these locations have very narrow catchment ditches that are not compatable with the rock cut design. The Raida escarpment road, which descends from the lip of the escarpment near As Sudah plateau to Wadi al Aws, is one of the roads constructed through extremely difficult terrain, connecting the cities, villages, and tourist resorts at the higher level in the area with the village of Raidah at the lower part of the escarpment road. It is an important road for the entire region, because the Raidah area is a natural resource section for flora. Different types of vehicles and light-duty trucks use this road. The total length of the Raidah escarpment road is ~8 km (Figure 2). The road ranges from 4 to 6 meters wide for the two lanes (both directions) (Figure 3). In some sections the ditch is very wide and deep; however in other parts there is a very narrow flat ditch (Figure 4). The escarpment road is characterised by a very small shoulder (Figure 4). Driving through this road is dangerous and difficult due to curvature of the road (vertical and horizontal) (Figures 2 and 4). The degree of curvature, the rock cuts and rock slopes along the different section of the roads, will affect the consequences of falling rocks, especially if there are no ditches or shoulders (Figure 4). The decision sight distance along many parts of the road is very limited due to these curvatures (Figure 4). The road is used mostly by people who live at the village down the hill and the tourists that come to visit the area (Many people come to this area especially during summer time). This area is a famous location in the Kingdom of Saudi Arabia and many tourists come from all over the world, especially from the Arab world.
www.ccsenet.org/jgg Journal of Geography and Geology Vol. 4, No. 2; 2012
50
Figure 2. A general view of the Raidah Escarpment Road. Note, the highly irregular characteristics of the road on the
high resolution QuikBird image (Google Earth Professional)
Figure 3. Characteristics of the Raidah escarpment road. (note, one lane with a 3 meter width for each
direction)
Figure 4. Different characteristics of the Raidah escarpment road. a) Photograph showing narrow ditch; b) Bad shoulder has a slope toward the road; c) Vertical curvature, d) Photograph showing wide and deep ditch; e and f)
No ditch present
www.ccsenet.org/jgg Journal of Geography and Geology Vol. 4, No. 2; 2012
51
The current study has embarked on a comprehensive evaluation of the stability of all cuts and slopes along Raidah escarpment road, with a major objetcive to identify the most hazard zones so that an appropriate mitigative measures can be initiated for the potentially dangerous cuts/slopes. This has been accomplished through an application of different methodologies and techniques to evaluate these cuts/slopes. The current paper focuses on the evaluation of the stability of the cuts/slopes along the Raidah Escarpment road. The main objectives of the current study include:
1) Determination of the characteristics of the rock mass using the RocLab® program (Rocscience, 2002);
2) Assessment of the stability of the sliding and toppling failures using the kinematic method (RockPack III®) (Watts, 2003);
3) Assessment of the stability according to the kinetic method;
4) Evaluation the raveling failures using the Rockfall hazard rating system;
5) Evaluation the rolling and bouncing mechanism using Rockfall simulation program;
6) Determination and mapping of the debris flow channels; and,
7) Identification of the most critical areas for failure problems and subsequently suggesting of the most suitable techniques for remediation.
3. Slope Stability Hazards
3.1 Overview of Previous Research
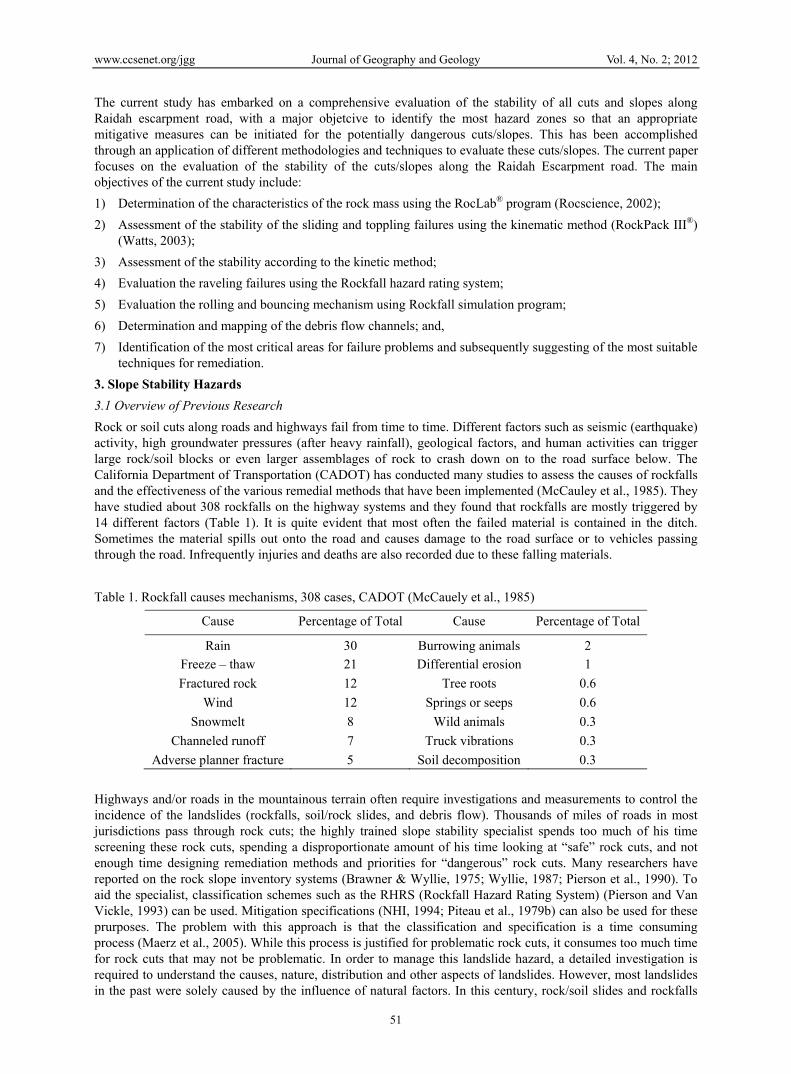
Rock or soil cuts along roads and highways fail from time to time. Different factors such as seismic (earthquake) activity, high groundwater pressures (after heavy rainfall), geological factors, and human activities can trigger large rock/soil blocks or even larger assemblages of rock to crash down on to the road surface below. The California Department of Transportation (CADOT) has conducted many studies to assess the causes of rockfalls and the effectiveness of the various remedial methods that have been implemented (McCauley et al., 1985). They have studied about 308 rockfalls on the highway systems and they found that rockfalls are mostly triggered by 14 different factors (Table 1). It is quite evident that most often the failed material is contained in the ditch. Sometimes the material spills out onto the road and causes damage to the road surface or to vehicles passing through the road. Infrequently injuries and deaths are also recorded due to these falling materials.
Table 1. Rockfall causes mechanisms, 308 cases, CADOT (McCauely et al., 1985)
Cause Percentage of Total Cause Percentage of Total
Rain 30 Burrowing animals 2
Freeze – thaw 21 Differential erosion 1
Fractured rock 12 Tree roots 0.6
Wind 12 Springs or seeps 0.6
Snowmelt 8 Wild animals 0.3
Channeled runoff 7 Truck vibrations 0.3
Adverse planner fracture 5 Soil decomposition 0.3
Highways and/or roads in the mountainous terrain often require investigations and measurements to control the incidence of the landslides (rockfalls, soil/rock slides, and debris flow). Thousands of miles of roads in most jurisdictions pass through rock cuts; the highly trained slope stability specialist spends too much of his time screening these rock cuts, spending a disproportionate amount of his time looking at “safe” rock cuts, and not enough time designing remediation methods and priorities for “dangerous” rock cuts. Many researchers have reported on the rock slope inventory systems (Brawner & Wyllie, 1975; Wyllie, 1987; Pierson et al., 1990). To aid the specialist, classification schemes such as the RHRS (Rockfall Hazard Rating System) (Pierson and Van Vickle, 1993) can be used. Mitigation specifications (NHI, 1994; Piteau et al., 1979b) can also be used for these prurposes. The problem with this approach is that the classification and specification is a time consuming process (Maerz et al., 2005). While this process is justified for problematic rock cuts, it consumes too much time for rock cuts that may not be problematic. In order to manage this landslide hazard, a detailed investigation is required to understand the causes, nature, distribution and other aspects of landslides. However, most landslides in the past were solely caused by the influence of natural factors. In this century, rock/soil slides and rockfalls
www.ccsenet.org/jgg Journal of Geography and Geology Vol. 4, No. 2; 2012
52
became more common due to the effects of anthropogenic activities such as road cuts, construction of large infrastructures, and quarries.
Piteau (1979a) mentioned that predictive methods such as limiting equilibrium analysis are of little use where the primary structure of the rock is sub-horizontal bedding, and the secondary structure is sub-vertical joints. Rock slope instability is caused by many factors, some of them are related to unfavorable discontinuities, adverse groundwater, excavation methods (poor blasting practices during original construction or reconstruction), climatic conditions, weathering and tree levering (Brawner, 1994).
3.2 Slope Stability Hazards along the Raidah Escarpment Road
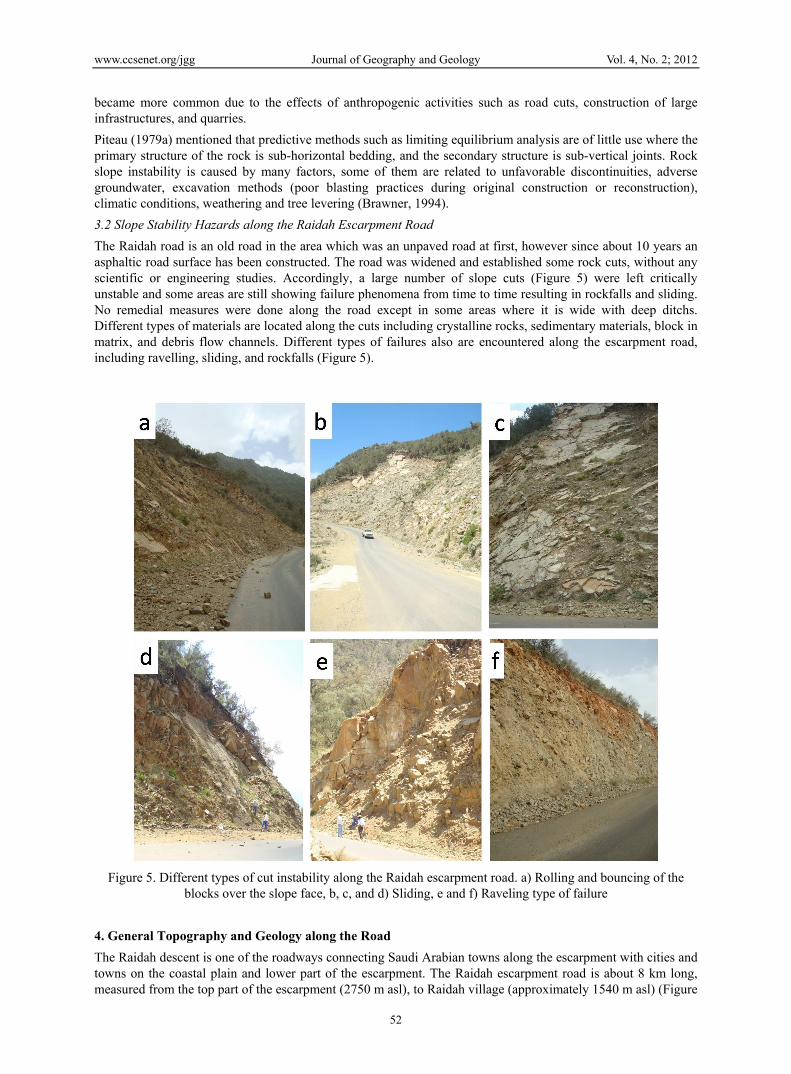
The Raidah road is an old road in the area which was an unpaved road at first, however since about 10 years an asphaltic road surface has been constructed. The road was widened and established some rock cuts, without any scientific or engineering studies. Accordingly, a large number of slope cuts (Figure 5) were left critically unstable and some areas are still showing failure phenomena from time to time resulting in rockfalls and sliding. No remedial measures were done along the road except in some areas where it is wide with deep ditchs. Different types of materials are located along the cuts including crystalline rocks, sedimentary materials, block in matrix, and debris flow channels. Different types of failures also are encountered along the escarpment road, including ravelling, sliding, and rockfalls (Figure 5).
Figure 5. Different types of cut instability along the Raidah escarpment road. a) Rolling and bouncing of the blocks over the slope face, b, c, and d) Sliding, e and f) Raveling type of failure
4. General Topography and Geology along the Road
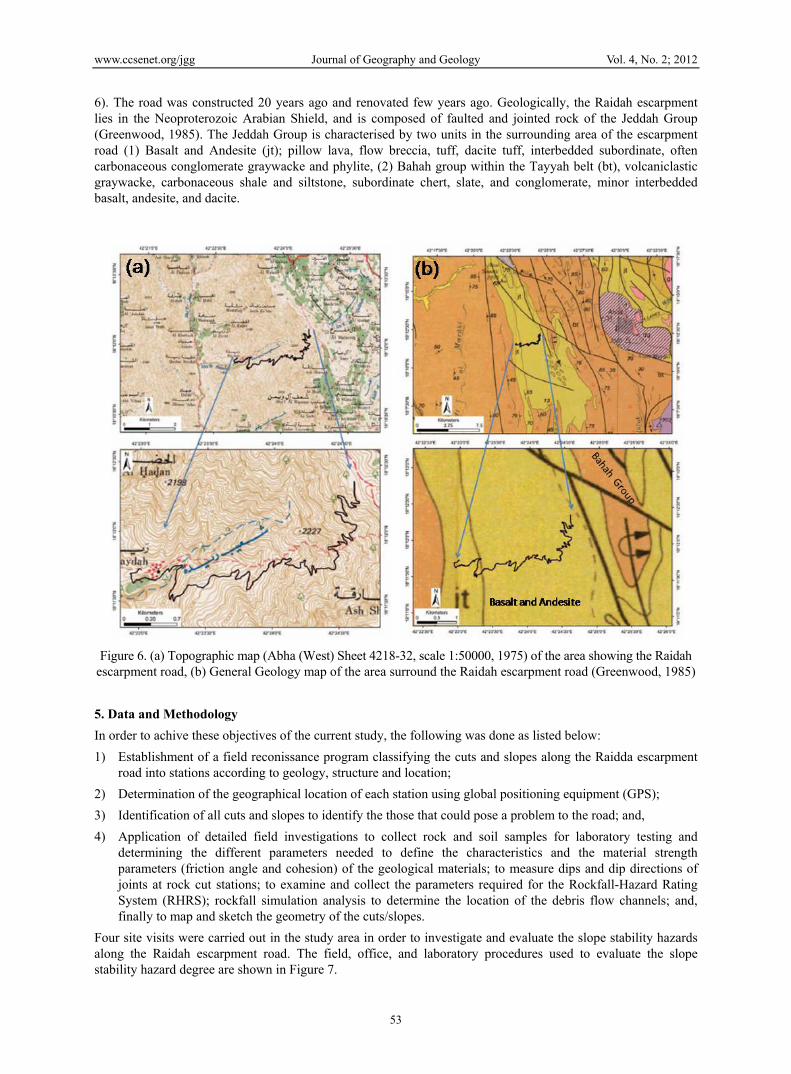
The Raidah descent is one of the roadways connecting Saudi Arabian towns along the escarpment with cities and towns on the coastal plain and lower part of the escarpment. The Raidah escarpment road is about 8 km long, measured from the top part of the escarpment (2750 m asl), to Raidah village (approximately 1540 m asl) (Figure
www.ccsenet.org/jgg Journal of Geography and Geology Vol. 4, No. 2; 2012
53
6). The road was constructed 20 years ago and renovated few years ago. Geologically, the Raidah escarpment lies in the Neoproterozoic Arabian Shield, and is composed of faulted and jointed rock of the Jeddah Group (Greenwood, 1985). The Jeddah Group is characterised by two units in the surrounding area of the escarpment road (1) Basalt and Andesite (jt); pillow lava, flow breccia, tuff, dacite tuff, interbedded subordinate, often carbonaceous conglomerate graywacke and phylite, (2) Bahah group within the Tayyah belt (bt), volcaniclastic graywacke, carbonaceous shale and siltstone, subordinate chert, slate, and conglomerate, minor interbedded basalt, andesite, and dacite.
Figure 6. (a) Topographic map (Abha (West) Sheet 4218-32, scale 1:50000, 1975) of the area showing the Raidah escarpment road, (b) General Geology map of the area surround the Raidah escarpment road (Greenwood, 1985)
5. Data and Methodology
In order to achive these objectives of the current study, the following was done as listed below:
1) Establishment of a field reconissance program classifying the cuts and slopes along the Raidda escarpment road into stations according to geology, structure and location;
2) Determination of the geographical location of each station using global positioning equipment (GPS);
3) Identification of all cuts and slopes to identify the those that could pose a problem to the road; and,
4) Application of detailed field investigations to collect rock and soil samples for laboratory testing and determining the different parameters needed to define the characteristics and the material strength parameters (friction angle and cohesion) of the geological materials; to measure dips and dip directions of joints at rock cut stations; to examine and collect the parameters required for the Rockfall-Hazard Rating System (RHRS); rockfall simulation analysis to determine the location of the debris flow channels; and, finally to map and sketch the geometry of the cuts/slopes.
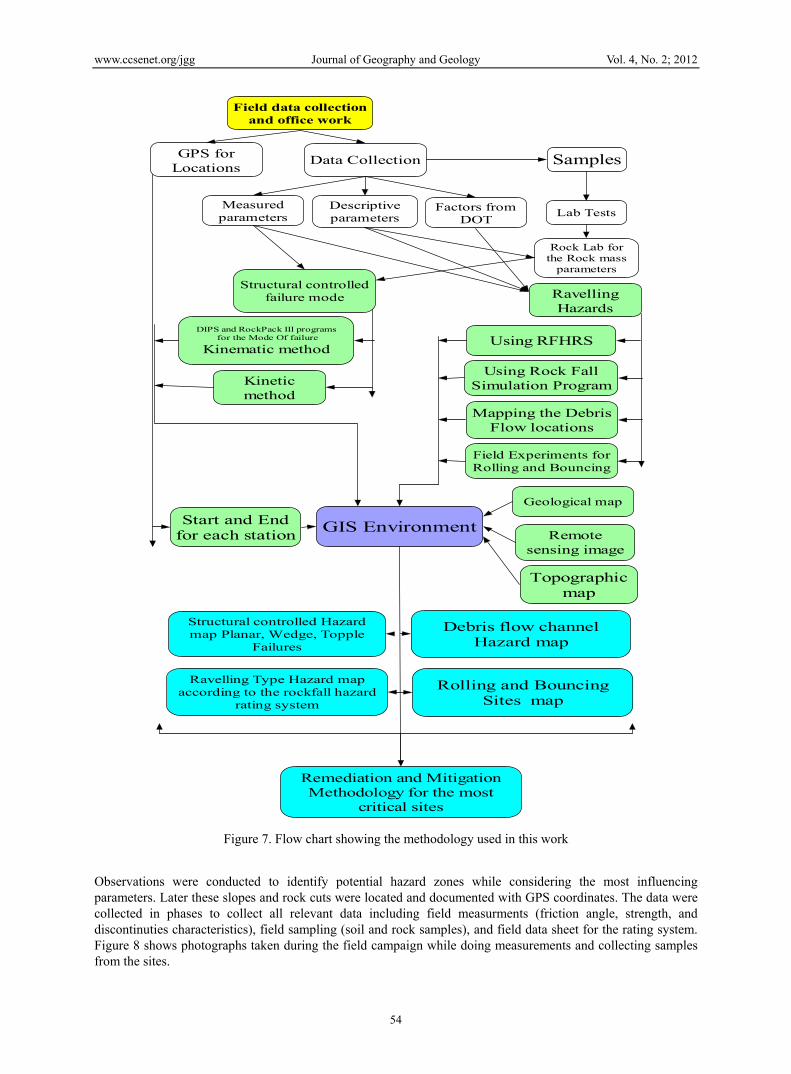
Four site visits were carried out in the study area in order to investigate and evaluate the slope stability hazards along the Raidah escarpment road. The field, office, and laboratory procedures used to evaluate the slope stability hazard degree are shown in Figure 7.
www.ccsenet.org/jgg Journal of Geography and Geology Vol. 4, No. 2; 2012
54
GPS forLocations
Field data collectionand office work
Data Collection
Factors fromDOT
Measuredparameters Lab Tests
GIS Environment
Structural controlled Hazardmap Planar, Wedge, Topple
Failures
Descriptiveparameters
Structural controlledfailure mode
Rock Lab forthe Rock mass
parameters
RavellingHazards
Start and Endfor each station
Samples
Debris flow channelHazard map
Ravelling Type Hazard mapaccording to the rockfall hazard
rating system
Geological map
Remotesensing image
Topographicmap
DIPS and RockPack III programs for the Mode Of failure
Kinematic method
Kineticmethod
Using RFHRS
Using Rock FallSimulation Program
Mapping the DebrisFlow locations
Field Experiments forRolling and Bouncing
Rolling and BouncingSites map
Remediation and MitigationMethodology for the most
critical sites
Figure 7. Flow chart showing the methodology used in this work
Observations were conducted to identify potential hazard zones while considering the most influencing parameters. Later these slopes and rock cuts were located and documented with GPS coordinates. The data were collected in phases to collect all relevant data including field measurments (friction angle, strength, and discontinuties characteristics), field sampling (soil and rock samples), and field data sheet for the rating system. Figure 8 shows photographs taken during the field campaign while doing measurements and collecting samples from the sites.
www.ccsenet.org/jgg Journal of Geography and Geology Vol. 4, No. 2; 2012
55
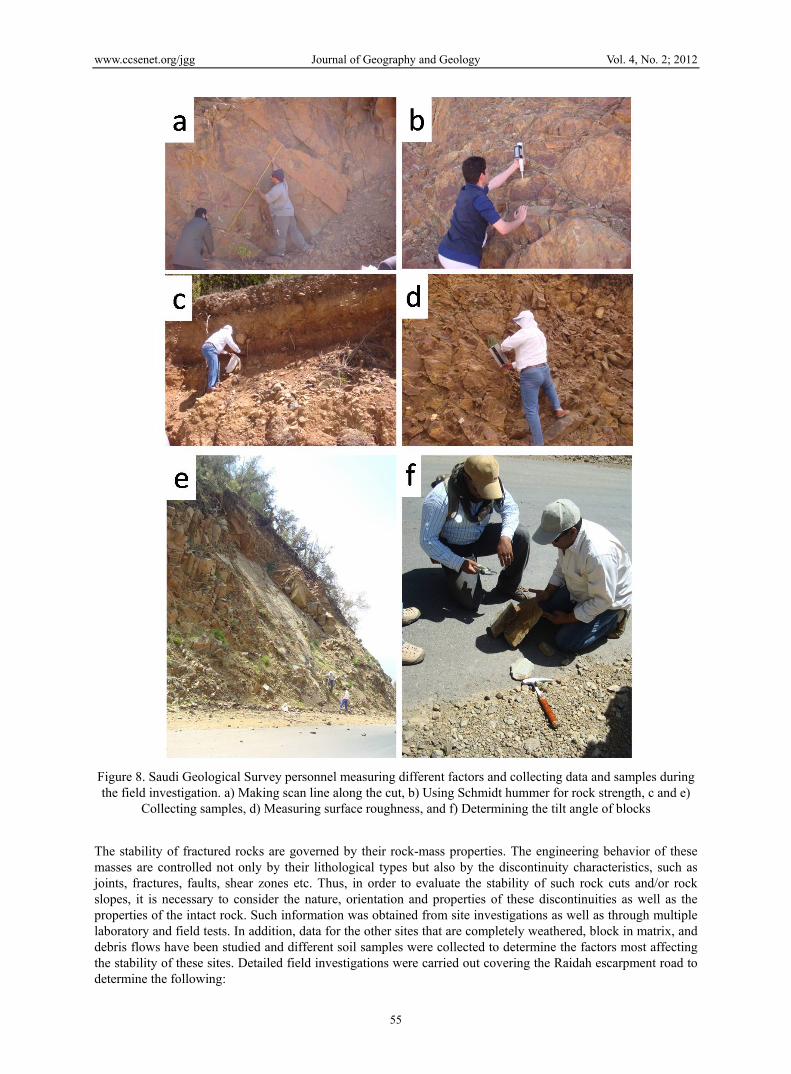
Figure 8. Saudi Geological Survey personnel measuring different factors and collecting data and samples during the field investigation. a) Making scan line along the cut, b) Using Schmidt hummer for rock strength, c and e)
Collecting samples, d) Measuring surface roughness, and f) Determining the tilt angle of blocks
The stability of fractured rocks are governed by their rock-mass properties. The engineering behavior of these masses are controlled not only by their lithological types but also by the discontinuity characteristics, such as joints, fractures, faults, shear zones etc. Thus, in order to evaluate the stability of such rock cuts and/or rock slopes, it is necessary to consider the nature, orientation and properties of these discontinuities as well as the properties of the intact rock. Such information was obtained from site investigations as well as through multiple laboratory and field tests. In addition, data for the other sites that are completely weathered, block in matrix, and debris flows have been studied and different soil samples were collected to determine the factors most affecting the stability of these sites. Detailed field investigations were carried out covering the Raidah escarpment road to determine the following:
www.ccsenet.org/jgg Journal of Geography and Geology Vol. 4, No. 2; 2012
56
1) Geology and structure mapping;
2) Road track and the rock cut stations; and,
3) Evaluation for each station.
During field investigations, different types of data have been collected for each station. The following is a brief description of the different types of parameters collected from each station:
1) Data related to:
a. Rock and material types (The main rock and material types at each station have been identified and investigated);
b. Compressive strength (In general, the uniaxial compressive strength (UCS) of the rock material is calculated as the mean strength of the unweathered rock;
c. The joint-wall compressive strength (JCS), (the compressive strength of the natural joint surface);
d. Fracture (Discontinuity) spacing (The spacing between adjacent discontinuities controls the size of the individual block of rock that govern the stability of rock slopes). It is usually obtained by measuring the fracture frequency, which is the number of discontinuities per meter length. The fracture spacing is the inverse value of the fracture frequency;
e. The soil matrix strength for the block in matrix type;and
f. Soil type filling the jointed rocks and as well as the in block in matrix;
2) Data related to the structural controlled failure mechanism which includes dip and dip direction of the discontinuties; and,
3) Data related to the rockfall hazard rating systems (Modified Colorado rockfall rating system (Russell, et al. 2008).
6. Results and Discussions
6.1 Raidah Escarpment Road Stations
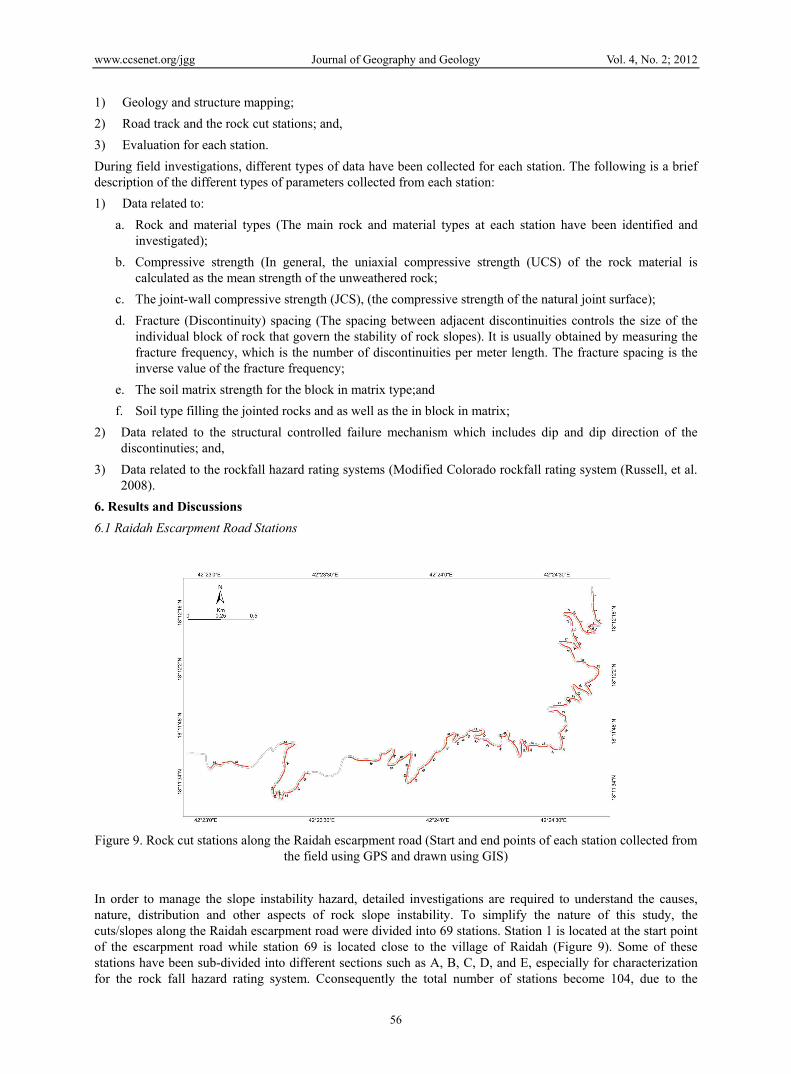
Figure 9. Rock cut stations along the Raidah escarpment road (Start and end points of each station collected from the field using GPS and drawn using GIS)
In order to manage the slope instability hazard, detailed investigations are required to understand the causes, nature, distribution and other aspects of rock slope instability. To simplify the nature of this study, the cuts/slopes along the Raidah escarpment road were divided into 69 stations. Station 1 is located at the start point of the escarpment road while station 69 is located close to the village of Raidah (Figure 9). Some of these stations have been sub-divided into different sections such as A, B, C, D, and E, especially for characterization for the rock fall hazard rating system. Cconsequently the total number of stations become 104, due to the
www.ccsenet.org/jgg Journal of Geography and Geology Vol. 4, No. 2; 2012
57
sub-division of intial stations. Each station has been investigated to determine its characteristics (geometry of the cuts, geometry of the road, shoulder, ditch, and the degree of the stability using different techniques). In addition, rock and soil samples were collected to determine the physical and mechanical characteristics of these cuts/slopes.
6.2 Laboratory Data Analysis
Samples were collected from the field to determine the physical and the geotechnical parameters as follow:
Twenty soil samples were collected from the stations especially from the filling materials between joints and shear zones as well as from the soil matrix in stations that are characterized by the presence of block in matrix. These soil samples were used to determine the strength parameters such as cohesion and friction angle using soil direct shear test, the data shows that the friction angle ranges from 15 to 35º while the cohesion ranges from 1 to 60 Mpa; and,
1) Rock samples that were collected in the field from 33 stations for physical and mechanical properties were analyzed, showing density ranges from 2.67 to 2.9 gm/cm3, porosity ranges from 1.12 to 6.9 %, void ratio ranges from 0.01 to 0.1, absorption ranges from 0.39 to 3.44 % and uniaxial compressive strength (UCS) ranges from 55.6 to 155.3 Mpa. The data indicate that the strength parameters especially the friction angle ranges from 30º to 64º.
6.3 Evaluation of the Stability Due to Structural Controlled
6.3.1 Kinematic Analysis
Most slope failures can be classified into one of four categories depending on the geometrical and mechanical nature of the discontinuities and the conditions of the rock masses which includes Circular, Planar, Wedge, and Toppling failures. In many areas the discontinuities are oriented in such a way that they contribute to create wedge, planar, or toppling failures.
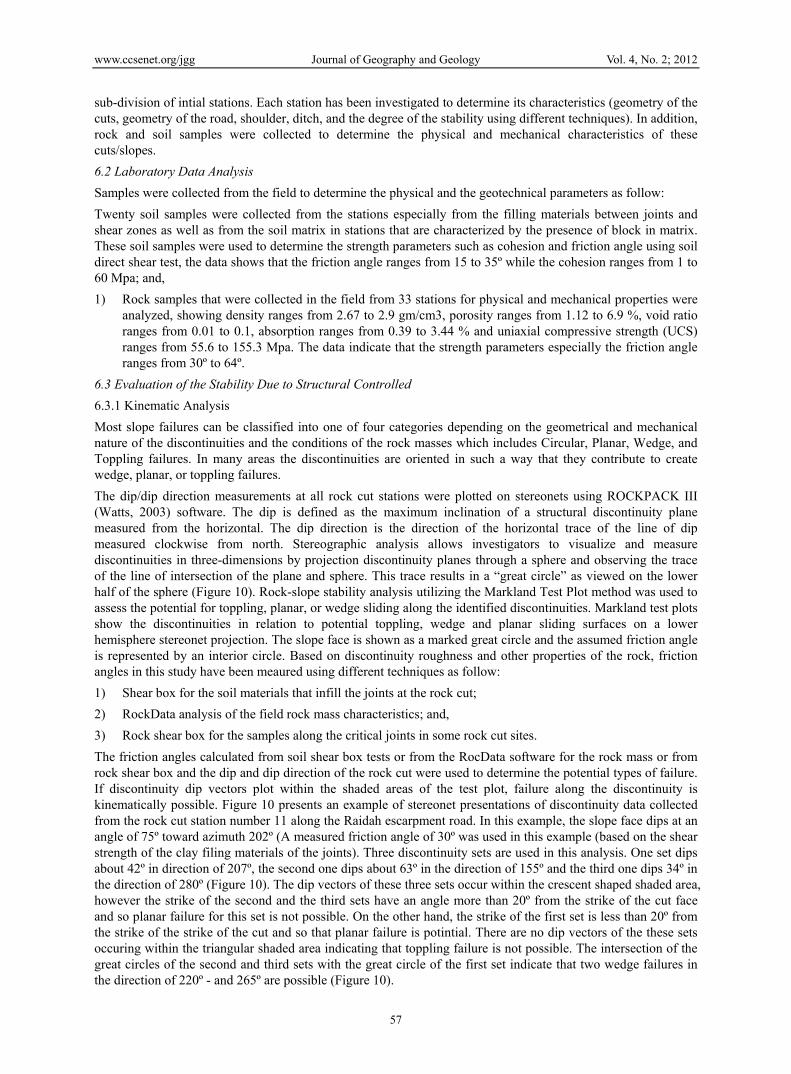
The dip/dip direction measurements at all rock cut stations were plotted on stereonets using ROCKPACK III (Watts, 2003) software. The dip is defined as the maximum inclination of a structural discontinuity plane measured from the horizontal. The dip direction is the direction of the horizontal trace of the line of dip measured clockwise from north. Stereographic analysis allows investigators to visualize and measure discontinuities in three-dimensions by projection discontinuity planes through a sphere and observing the trace of the line of intersection of the plane and sphere. This trace results in a “great circle” as viewed on the lower half of the sphere (Figure 10). Rock-slope stability analysis utilizing the Markland Test Plot method was used to assess the potential for toppling, planar, or wedge sliding along the identified discontinuities. Markland test plots show the discontinuities in relation to potential toppling, wedge and planar sliding surfaces on a lower hemisphere stereonet projection. The slope face is shown as a marked great circle and the assumed friction angle is represented by an interior circle. Based on discontinuity roughness and other properties of the rock, friction angles in this study have been meaured using different techniques as follow:
1) Shear box for the soil materials that infill the joints at the rock cut;
2) RockData analysis of the field rock mass characteristics; and,
3) Rock shear box for the samples along the critical joints in some rock cut sites.
The friction angles calculated from soil shear box tests or from the RocData software for the rock mass or from rock shear box and the dip and dip direction of the rock cut were used to determine the potential types of failure. If discontinuity dip vectors plot within the shaded areas of the test plot, failure along the discontinuity is kinematically possible. Figure 10 presents an example of stereonet presentations of discontinuity data collected from the rock cut station number 11 along the Raidah escarpment road. In this example, the slope face dips at an angle of 75º toward azimuth 202º (A measured friction angle of 30º was used in this example (based on the shear strength of the clay filing materials of the joints). Three discontinuity sets are used in this analysis. One set dips about 42º in direction of 207º, the second one dips about 63º in the direction of 155º and the third one dips 34º in the direction of 280º (Figure 10). The dip vectors of these three sets occur within the crescent shaped shaded area, however the strike of the second and the third sets have an angle more than 20º from the strike of the cut face and so planar failure for this set is not possible. On the other hand, the strike of the first set is less than 20º from the strike of the strike of the cut and so that planar failure is potintial. There are no dip vectors of the these sets occuring within the triangular shaded area indicating that toppling failure is not possible. The intersection of the great circles of the second and third sets with the great circle of the first set indicate that two wedge failures in the direction of 220º - and 265º are possible (Figure 10).
www.ccsenet.org/jgg Journal of Geography and Geology Vol. 4, No. 2; 2012
58
Figure 10. The analysis used in the study for each station along the Raidah escarpment road: (a) Field photograph at station 11 showing the planar joints dips toward the road and other two sets, (b) Markland Test
plot showing the main sets, friction angle, and rock cut face plotted in RockPack III (note that there is no toppling failure however a planar and wedge failures are possible as the plot vector and the intersection between
different planes are located in the critical zone)
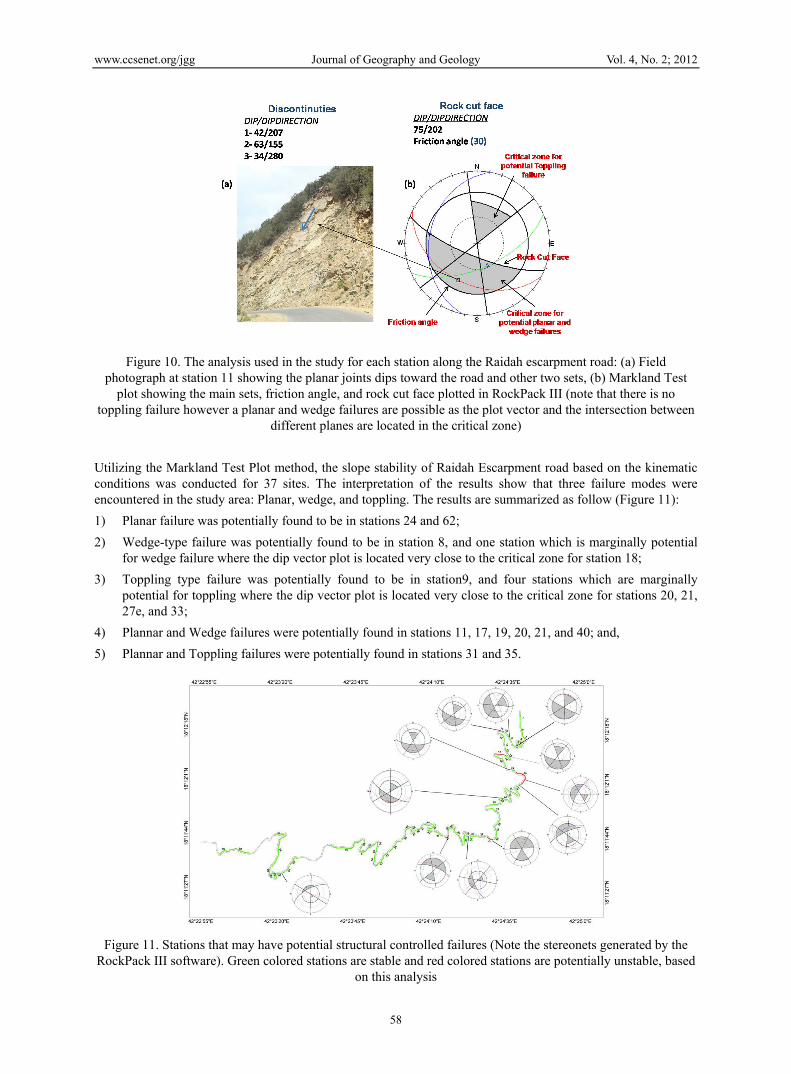
Utilizing the Markland Test Plot method, the slope stability of Raidah Escarpment road based on the kinematic conditions was conducted for 37 sites. The interpretation of the results show that three failure modes were encountered in the study area: Planar, wedge, and toppling. The results are summarized as follow (Figure 11):
1) Planar failure was potentially found to be in stations 24 and 62;
2) Wedge-type failure was potentially found to be in station 8, and one station which is marginally potential for wedge failure where the dip vector plot is located very close to the critical zone for station 18;
3) Toppling type failure was potentially found to be in station9, and four stations which are marginally potential for toppling where the dip vector plot is located very close to the critical zone for stations 20, 21, 27e, and 33;
4) Plannar and Wedge failures were potentially found in stations 11, 17, 19, 20, 21, and 40; and,
5) Plannar and Toppling failures were potentially found in stations 31 and 35.
Figure 11. Stations that may have potential structural controlled failures (Note the stereonets generated by the RockPack III software). Green colored stations are stable and red colored stations are potentially unstable, based
on this analysis
www.ccsenet.org/jgg Journal of Geography and Geology Vol. 4, No. 2; 2012
59
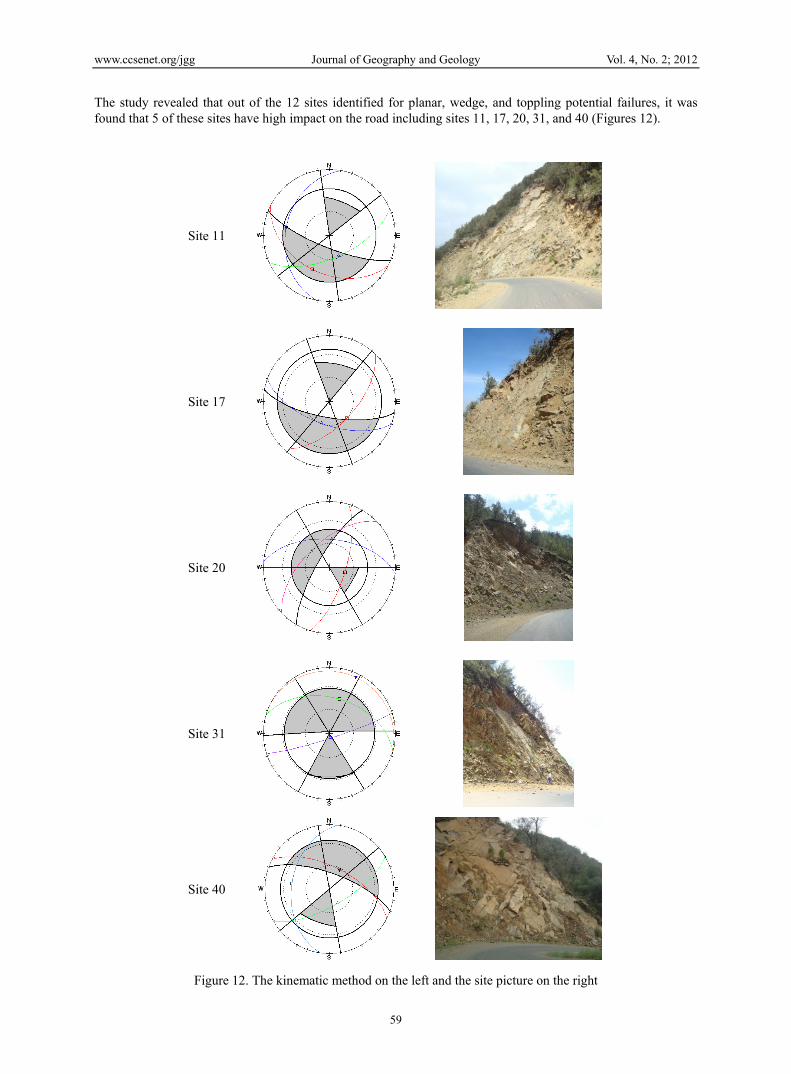
The study revealed that out of the 12 sites identified for planar, wedge, and toppling potential failures, it was found that 5 of these sites have high impact on the road including sites 11, 17, 20, 31, and 40 (Figures 12).
Site 11
Site 17
Site 20
Site 31
Site 40
Figure 12. The kinematic method on the left and the site picture on the right
www.ccsenet.org/jgg Journal of Geography and Geology Vol. 4, No. 2; 2012
60
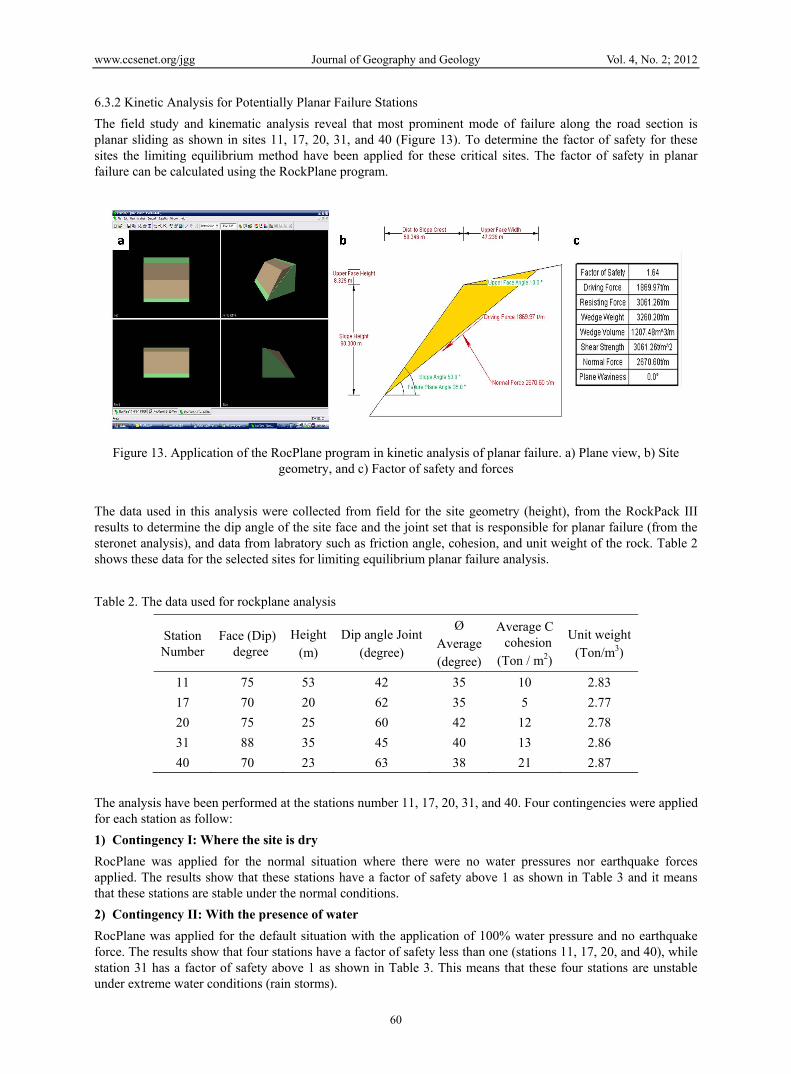
6.3.2 Kinetic Analysis for Potentially Planar Failure Stations
The field study and kinematic analysis reveal that most prominent mode of failure along the road section is planar sliding as shown in sites 11, 17, 20, 31, and 40 (Figure 13). To determine the factor of safety for these sites the limiting equilibrium method have been applied for these critical sites. The factor of safety in planar failure can be calculated using the RockPlane program.
Figure 13. Application of the RocPlane program in kinetic analysis of planar failure. a) Plane view, b) Site geometry, and c) Factor of safety and forces
The data used in this analysis were collected from field for the site geometry (height), from the RockPack III results to determine the dip angle of the site face and the joint set that is responsible for planar failure (from the steronet analysis), and data from labratory such as friction angle, cohesion, and unit weight of the rock. Table 2 shows these data for the selected sites for limiting equilibrium planar failure analysis.
Table 2. The data used for rockplane analysis
Station Number
Face (Dip) degree
Height (m)
Dip angle Joint(degree)
Ø Average(degree)
Average C cohesion(Ton / m2)
Unit weight (Ton/m3)
11 75 53 42 35 10 2.83
17 70 20 62 35 5 2.77
20 75 25 60 42 12 2.78
31 88 35 45 40 13 2.86
40 70 23 63 38 21 2.87
The analysis have been performed at the stations number 11, 17, 20, 31, and 40. Four contingencies were applied for each station as follow:
1) Contingency I: Where the site is dry
RocPlane was applied for the normal situation where there were no water pressures nor earthquake forces applied. The results show that these stations have a factor of safety above 1 as shown in Table 3 and it means that these stations are stable under the normal conditions.
2) Contingency II: With the presence of water
RocPlane was applied for the default situation with the application of 100% water pressure and no earthquake force. The results show that four stations have a factor of safety less than one (stations 11, 17, 20, and 40), while station 31 has a factor of safety above 1 as shown in Table 3. This means that these four stations are unstable under extreme water conditions (rain storms).
www.ccsenet.org/jgg Journal of Geography and Geology Vol. 4, No. 2; 2012
61
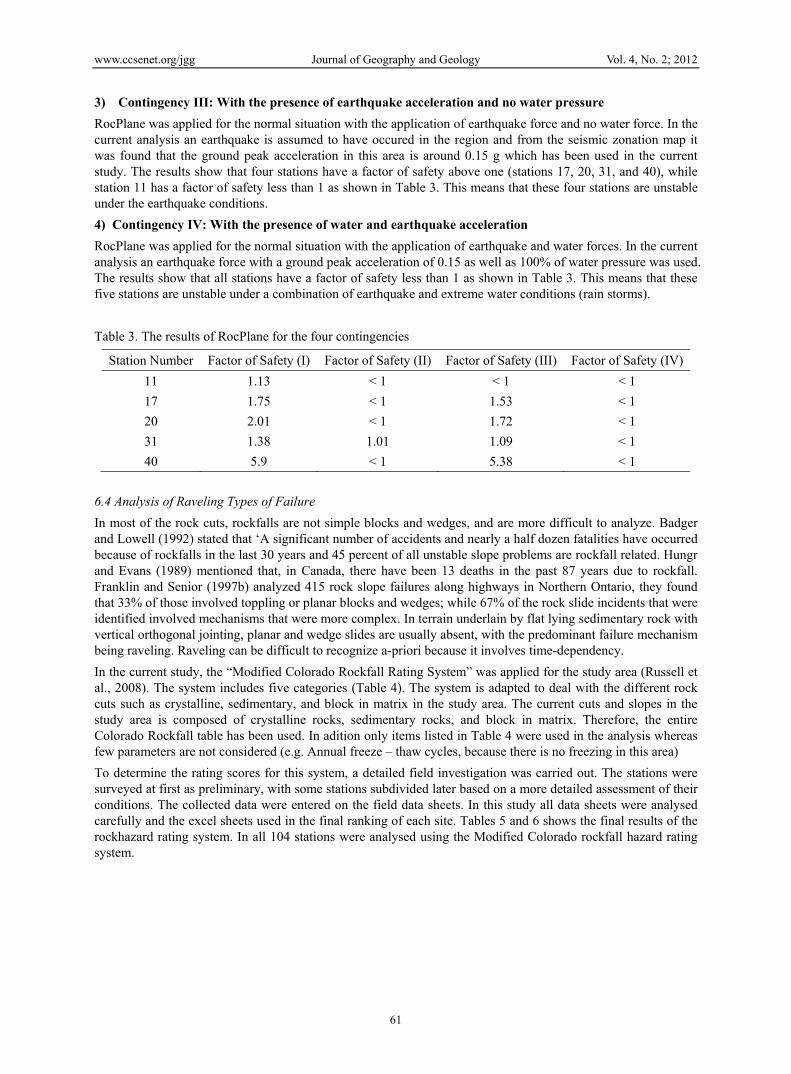
3) Contingency III: With the presence of earthquake acceleration and no water pressure
RocPlane was applied for the normal situation with the application of earthquake force and no water force. In the current analysis an earthquake is assumed to have occured in the region and from the seismic zonation map it was found that the ground peak acceleration in this area is around 0.15 g which has been used in the current study. The results show that four stations have a factor of safety above one (stations 17, 20, 31, and 40), while station 11 has a factor of safety less than 1 as shown in Table 3. This means that these four stations are unstable under the earthquake conditions.
4) Contingency IV: With the presence of water and earthquake acceleration
RocPlane was applied for the normal situation with the application of earthquake and water forces. In the current analysis an earthquake force with a ground peak acceleration of 0.15 as well as 100% of water pressure was used. The results show that all stations have a factor of safety less than 1 as shown in Table 3. This means that these five stations are unstable under a combination of earthquake and extreme water conditions (rain storms).
Table 3. The results of RocPlane for the four contingencies
Station Number Factor of Safety (I) Factor of Safety (II) Factor of Safety (III) Factor of Safety (IV)
11 1.13 < 1 < 1 < 1
17 1.75 < 1 1.53 < 1
20 2.01 < 1 1.72 < 1
31 1.38 1.01 1.09 < 1
40 5.9 < 1 5.38 < 1
6.4 Analysis of Raveling Types of Failure
In most of the rock cuts, rockfalls are not simple blocks and wedges, and are more difficult to analyze. Badger and Lowell (1992) stated that ‘A significant number of accidents and nearly a half dozen fatalities have occurred because of rockfalls in the last 30 years and 45 percent of all unstable slope problems are rockfall related. Hungr and Evans (1989) mentioned that, in Canada, there have been 13 deaths in the past 87 years due to rockfall. Franklin and Senior (1997b) analyzed 415 rock slope failures along highways in Northern Ontario, they found that 33% of those involved toppling or planar blocks and wedges; while 67% of the rock slide incidents that were identified involved mechanisms that were more complex. In terrain underlain by flat lying sedimentary rock with vertical orthogonal jointing, planar and wedge slides are usually absent, with the predominant failure mechanism being raveling. Raveling can be difficult to recognize a-priori because it involves time-dependency.
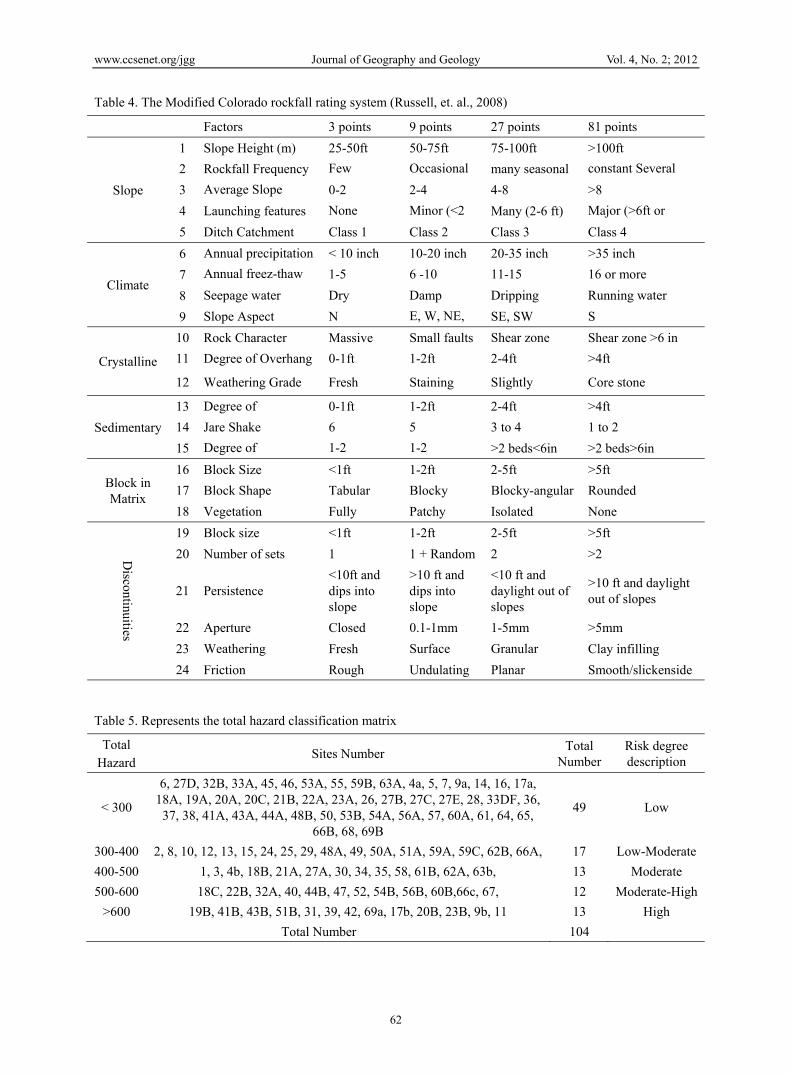
In the current study, the “Modified Colorado Rockfall Rating System” was applied for the study area (Russell et al., 2008). The system includes five categories (Table 4). The system is adapted to deal with the different rock cuts such as crystalline, sedimentary, and block in matrix in the study area. The current cuts and slopes in the study area is composed of crystalline rocks, sedimentary rocks, and block in matrix. Therefore, the entire Colorado Rockfall table has been used. In adition only items listed in Table 4 were used in the analysis whereas few parameters are not considered (e.g. Annual freeze – thaw cycles, because there is no freezing in this area)
To determine the rating scores for this system, a detailed field investigation was carried out. The stations were surveyed at first as preliminary, with some stations subdivided later based on a more detailed assessment of their conditions. The collected data were entered on the field data sheets. In this study all data sheets were analysed carefully and the excel sheets used in the final ranking of each site. Tables 5 and 6 shows the final results of the rockhazard rating system. In all 104 stations were analysed using the Modified Colorado rockfall hazard rating system.
www.ccsenet.org/jgg Journal of Geography and Geology Vol. 4, No. 2; 2012
62
Table 4. The Modified Colorado rockfall rating system (Russell, et. al., 2008)
Factors 3 points 9 points 27 points 81 points
Slope
1 Slope Height (m) 25-50ft 50-75ft 75-100ft >100ft
2 Rockfall Frequency Few Occasional many seasonal constant Several
3 Average Slope 0-2 2-4 4-8 >8
4 Launching features None Minor (<2 Many (2-6 ft) Major (>6ft or
5 Ditch Catchment Class 1 Class 2 Class 3 Class 4
Climate
6 Annual precipitation < 10 inch 10-20 inch 20-35 inch >35 inch
7 Annual freez-thaw 1-5 6 -10 11-15 16 or more
8 Seepage water Dry Damp Dripping Running water
9 Slope Aspect N E, W, NE, SE, SW S
Crystalline
10 Rock Character Massive Small faults Shear zone Shear zone >6 in
11 Degree of Overhang 0-1ft 1-2ft 2-4ft >4ft
12 Weathering Grade Fresh Staining Slightly Core stone
Sedimentary
13 Degree of 0-1ft 1-2ft 2-4ft >4ft
14 Jare Shake 6 5 3 to 4 1 to 2
15 Degree of 1-2 1-2 >2 beds<6in >2 beds>6in
Block in Matrix
16 Block Size <1ft 1-2ft 2-5ft >5ft
17 Block Shape Tabular Blocky Blocky-angular Rounded
18 Vegetation Fully Patchy Isolated None
Discontinuities
19 Block size <1ft 1-2ft 2-5ft >5ft
20 Number of sets 1 1 + Random 2 >2
21 Persistence <10ft and dips into slope
>10 ft and dips into slope
<10 ft and daylight out of slopes
>10 ft and daylight out of slopes
22 Aperture Closed 0.1-1mm 1-5mm >5mm
23 Weathering Fresh Surface Granular Clay infilling
24 Friction Rough Undulating Planar Smooth/slickenside
Table 5. Represents the total hazard classification matrix
Total Hazard
Sites Number Total
Number Risk degree description
< 300
6, 27D, 32B, 33A, 45, 46, 53A, 55, 59B, 63A, 4a, 5, 7, 9a, 14, 16, 17a, 18A, 19A, 20A, 20C, 21B, 22A, 23A, 26, 27B, 27C, 27E, 28, 33DF, 36, 37, 38, 41A, 43A, 44A, 48B, 50, 53B, 54A, 56A, 57, 60A, 61, 64, 65,
66B, 68, 69B
49 Low
300-400 2, 8, 10, 12, 13, 15, 24, 25, 29, 48A, 49, 50A, 51A, 59A, 59C, 62B, 66A, 17 Low-Moderate
400-500 1, 3, 4b, 18B, 21A, 27A, 30, 34, 35, 58, 61B, 62A, 63b, 13 Moderate
500-600 18C, 22B, 32A, 40, 44B, 47, 52, 54B, 56B, 60B,66c, 67, 12 Moderate-High
>600 19B, 41B, 43B, 51B, 31, 39, 42, 69a, 17b, 20B, 23B, 9b, 11 13 High
Total Number 104
www.ccsenet.org/jgg Journal of Geography and Geology Vol. 4, No. 2; 2012
63
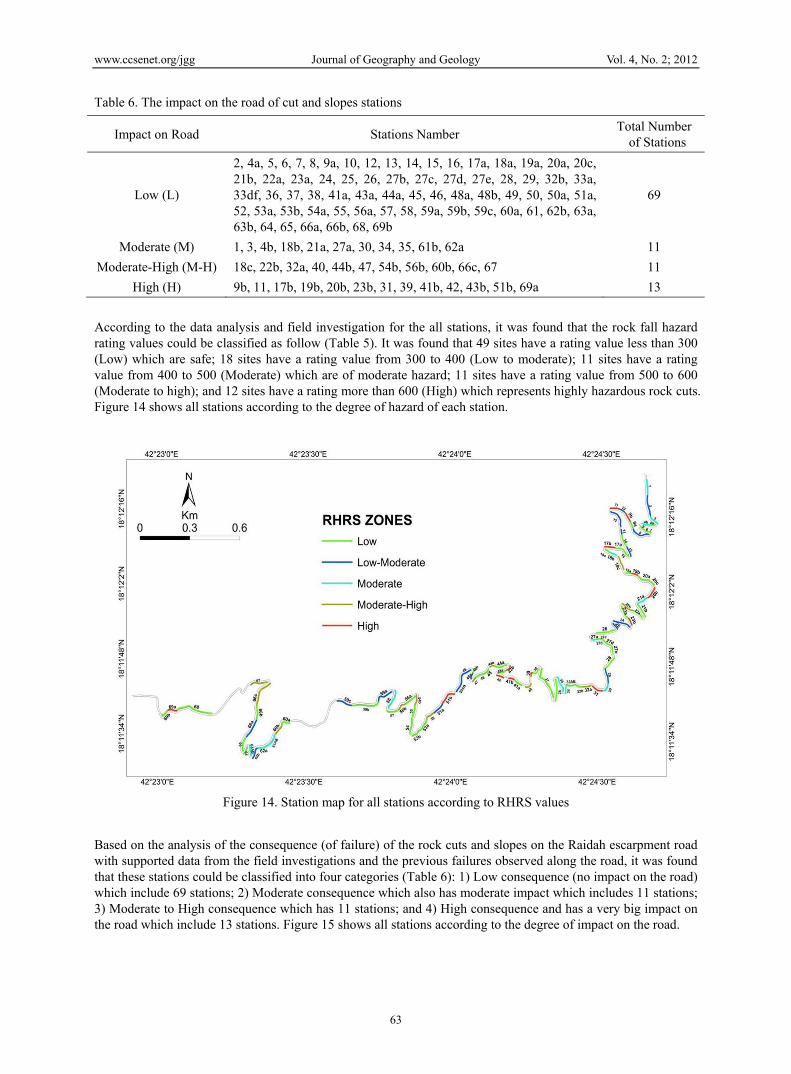
Table 6. The impact on the road of cut and slopes stations
Impact on Road Stations Namber Total Number of Stations
Low (L)
2, 4a, 5, 6, 7, 8, 9a, 10, 12, 13, 14, 15, 16, 17a, 18a, 19a, 20a, 20c, 21b, 22a, 23a, 24, 25, 26, 27b, 27c, 27d, 27e, 28, 29, 32b, 33a, 33df, 36, 37, 38, 41a, 43a, 44a, 45, 46, 48a, 48b, 49, 50, 50a, 51a, 52, 53a, 53b, 54a, 55, 56a, 57, 58, 59a, 59b, 59c, 60a, 61, 62b, 63a, 63b, 64, 65, 66a, 66b, 68, 69b
69
Moderate (M) 1, 3, 4b, 18b, 21a, 27a, 30, 34, 35, 61b, 62a 11
Moderate-High (M-H) 18c, 22b, 32a, 40, 44b, 47, 54b, 56b, 60b, 66c, 67 11
High (H) 9b, 11, 17b, 19b, 20b, 23b, 31, 39, 41b, 42, 43b, 51b, 69a 13
According to the data analysis and field investigation for the all stations, it was found that the rock fall hazard rating values could be classified as follow (Table 5). It was found that 49 sites have a rating value less than 300 (Low) which are safe; 18 sites have a rating value from 300 to 400 (Low to moderate); 11 sites have a rating value from 400 to 500 (Moderate) which are of moderate hazard; 11 sites have a rating value from 500 to 600 (Moderate to high); and 12 sites have a rating more than 600 (High) which represents highly hazardous rock cuts. Figure 14 shows all stations according to the degree of hazard of each station.
Figure 14. Station map for all stations according to RHRS values
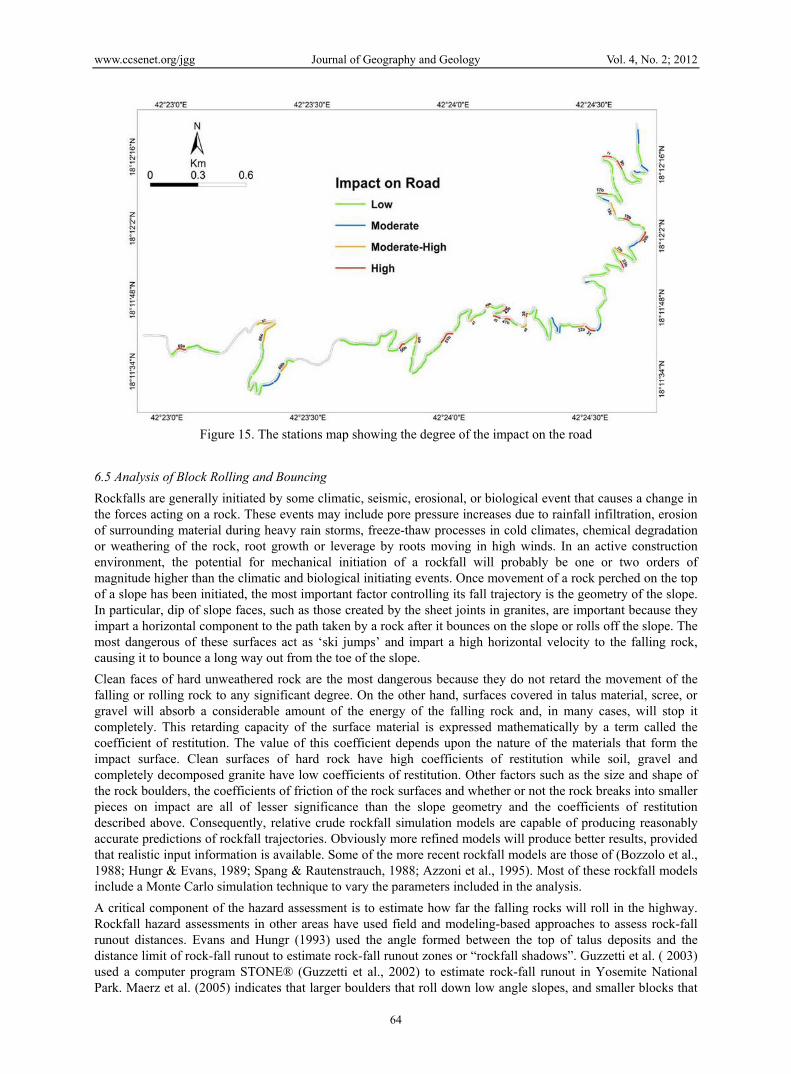
Based on the analysis of the consequence (of failure) of the rock cuts and slopes on the Raidah escarpment road with supported data from the field investigations and the previous failures observed along the road, it was found that these stations could be classified into four categories (Table 6): 1) Low consequence (no impact on the road) which include 69 stations; 2) Moderate consequence which also has moderate impact which includes 11 stations; 3) Moderate to High consequence which has 11 stations; and 4) High consequence and has a very big impact on the road which include 13 stations. Figure 15 shows all stations according to the degree of impact on the road.
www.ccsenet.org/jgg Journal of Geography and Geology Vol. 4, No. 2; 2012
64
Figure 15. The stations map showing the degree of the impact on the road
6.5 Analysis of Block Rolling and Bouncing
Rockfalls are generally initiated by some climatic, seismic, erosional, or biological event that causes a change in the forces acting on a rock. These events may include pore pressure increases due to rainfall infiltration, erosion of surrounding material during heavy rain storms, freeze-thaw processes in cold climates, chemical degradation or weathering of the rock, root growth or leverage by roots moving in high winds. In an active construction environment, the potential for mechanical initiation of a rockfall will probably be one or two orders of magnitude higher than the climatic and biological initiating events. Once movement of a rock perched on the top of a slope has been initiated, the most important factor controlling its fall trajectory is the geometry of the slope. In particular, dip of slope faces, such as those created by the sheet joints in granites, are important because they impart a horizontal component to the path taken by a rock after it bounces on the slope or rolls off the slope. The most dangerous of these surfaces act as ‘ski jumps’ and impart a high horizontal velocity to the falling rock, causing it to bounce a long way out from the toe of the slope.
Clean faces of hard unweathered rock are the most dangerous because they do not retard the movement of the falling or rolling rock to any significant degree. On the other hand, surfaces covered in talus material, scree, or gravel will absorb a considerable amount of the energy of the falling rock and, in many cases, will stop it completely. This retarding capacity of the surface material is expressed mathematically by a term called the coefficient of restitution. The value of this coefficient depends upon the nature of the materials that form the impact surface. Clean surfaces of hard rock have high coefficients of restitution while soil, gravel and completely decomposed granite have low coefficients of restitution. Other factors such as the size and shape of the rock boulders, the coefficients of friction of the rock surfaces and whether or not the rock breaks into smaller pieces on impact are all of lesser significance than the slope geometry and the coefficients of restitution described above. Consequently, relative crude rockfall simulation models are capable of producing reasonably accurate predictions of rockfall trajectories. Obviously more refined models will produce better results, provided that realistic input information is available. Some of the more recent rockfall models are those of (Bozzolo et al., 1988; Hungr & Evans, 1989; Spang & Rautenstrauch, 1988; Azzoni et al., 1995). Most of these rockfall models include a Monte Carlo simulation technique to vary the parameters included in the analysis.
A critical component of the hazard assessment is to estimate how far the falling rocks will roll in the highway. Rockfall hazard assessments in other areas have used field and modeling-based approaches to assess rock-fall runout distances. Evans and Hungr (1993) used the angle formed between the top of talus deposits and the distance limit of rock-fall runout to estimate rock-fall runout zones or “rockfall shadows”. Guzzetti et al. ( 2003) used a computer program STONE® (Guzzetti et al., 2002) to estimate rock-fall runout in Yosemite National Park. Maerz et al. (2005) indicates that larger boulders that roll down low angle slopes, and smaller blocks that
www.ccsenet.org/jgg Journal of Geography and Geology Vol. 4, No. 2; 2012
65
bounce down steeper slopes are the most likely to reach the highway.
Field investigation reveals that there are some sites that have rolling and bouncing impacts on the road. The field investigation (field rolling and bouncing experiments) and simulation tests (using computer program) have been done along some different sites. It was found that most of the selected sites have a high impact on rolling and or bouncing effects.
6.5.1 Field Simulation Analysis (Experimental Procedure)
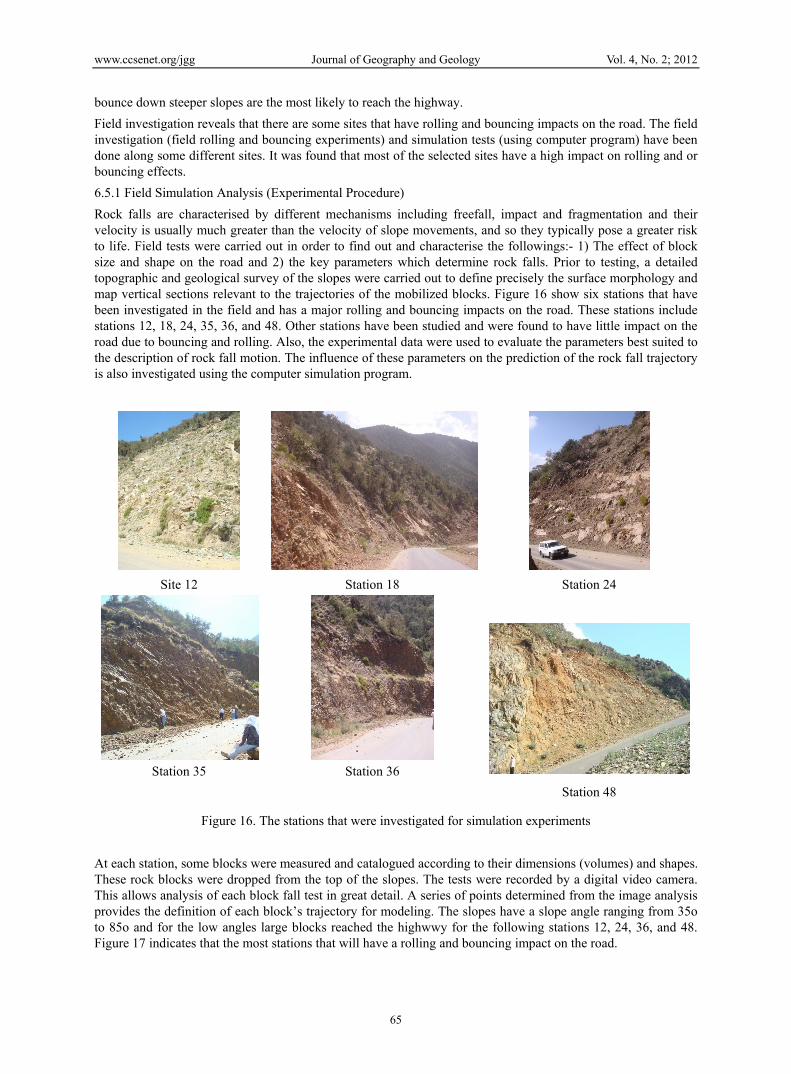
Rock falls are characterised by different mechanisms including freefall, impact and fragmentation and their velocity is usually much greater than the velocity of slope movements, and so they typically pose a greater risk to life. Field tests were carried out in order to find out and characterise the followings:- 1) The effect of block size and shape on the road and 2) the key parameters which determine rock falls. Prior to testing, a detailed topographic and geological survey of the slopes were carried out to define precisely the surface morphology and map vertical sections relevant to the trajectories of the mobilized blocks. Figure 16 show six stations that have been investigated in the field and has a major rolling and bouncing impacts on the road. These stations include stations 12, 18, 24, 35, 36, and 48. Other stations have been studied and were found to have little impact on the road due to bouncing and rolling. Also, the experimental data were used to evaluate the parameters best suited to the description of rock fall motion. The influence of these parameters on the prediction of the rock fall trajectory is also investigated using the computer simulation program.
Site 12 Station 18
Station 24
Station 35
Station 36
Station 48
Figure 16. The stations that were investigated for simulation experiments
At each station, some blocks were measured and catalogued according to their dimensions (volumes) and shapes. These rock blocks were dropped from the top of the slopes. The tests were recorded by a digital video camera. This allows analysis of each block fall test in great detail. A series of points determined from the image analysis provides the definition of each block’s trajectory for modeling. The slopes have a slope angle ranging from 35o to 85o and for the low angles large blocks reached the highwwy for the following stations 12, 24, 36, and 48. Figure 17 indicates that the most stations that will have a rolling and bouncing impact on the road.
www.ccsenet.org/jgg Journal of Geography and Geology Vol. 4, No. 2; 2012
66
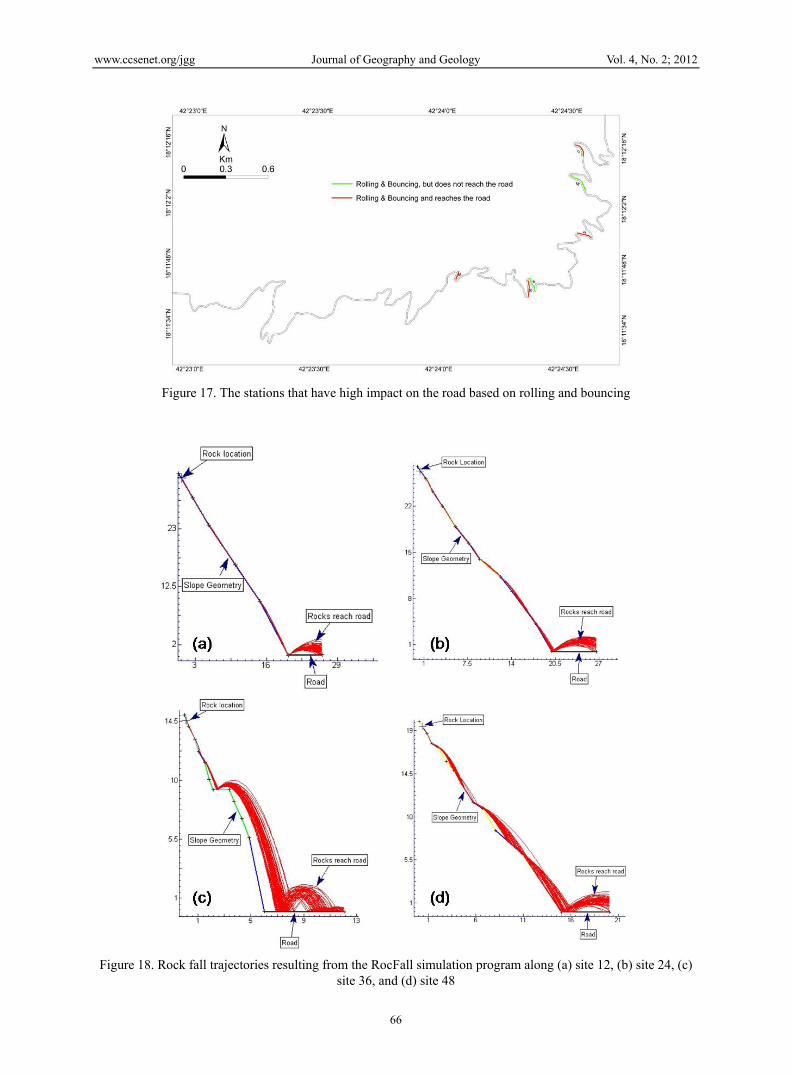
Figure 17. The stations that have high impact on the road based on rolling and bouncing
Figure 18. Rock fall trajectories resulting from the RocFall simulation program along (a) site 12, (b) site 24, (c) site 36, and (d) site 48
www.ccsenet.org/jgg Journal of Geography and Geology Vol. 4, No. 2; 2012
67
CRSP® (Colorado Rockfall Simulation Program (Jones et al., 2000)), was used for estimating runout. The simulation has been done for stations 12, 24, 36, and 48. The location of the unstable rocks were visually determined in the cuts, and their geometry was measured and used as inputs into the simulation. The topography of the cut/slope is shown in Figure 16. The CRSP results are shown in Figure 18. Rockfall simulation analysis shows that most of the falling rocks will bounce and roll far enough to reach the highway. This may cause a serious hazard for the vehicles especially with the presence of horizontal and vertical curves which does not allow enough time for the driver to react. An interesting example shown in Figure 18, demonstratsthat the falling materials will hit the rock cut or the pavement area and bounce to the roadway. The data of the stations 12, 24, 36, and 48 indicates that most or all the falling rocks will reach the highway especially in the areas where there is no ditch present.
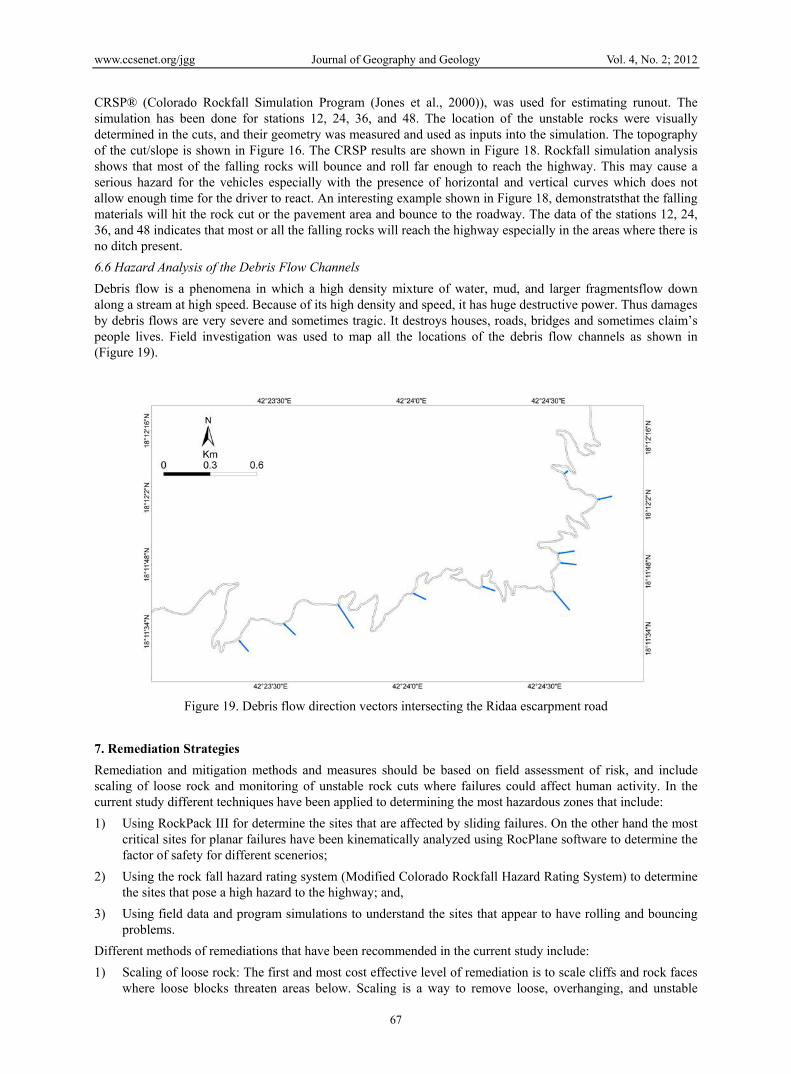
6.6 Hazard Analysis of the Debris Flow Channels
Debris flow is a phenomena in which a high density mixture of water, mud, and larger fragmentsflow down along a stream at high speed. Because of its high density and speed, it has huge destructive power. Thus damages by debris flows are very severe and sometimes tragic. It destroys houses, roads, bridges and sometimes claim’s people lives. Field investigation was used to map all the locations of the debris flow channels as shown in (Figure 19).
Figure 19. Debris flow direction vectors intersecting the Ridaa escarpment road
7. Remediation Strategies
Remediation and mitigation methods and measures should be based on field assessment of risk, and include scaling of loose rock and monitoring of unstable rock cuts where failures could affect human activity. In the current study different techniques have been applied to determining the most hazardous zones that include:
1) Using RockPack III for determine the sites that are affected by sliding failures. On the other hand the most critical sites for planar failures have been kinematically analyzed using RocPlane software to determine the factor of safety for different scenerios;
2) Using the rock fall hazard rating system (Modified Colorado Rockfall Hazard Rating System) to determine the sites that pose a high hazard to the highway; and,
3) Using field data and program simulations to understand the sites that appear to have rolling and bouncing problems.
Different methods of remediations that have been recommended in the current study include:
1) Scaling of loose rock: The first and most cost effective level of remediation is to scale cliffs and rock faces where loose blocks threaten areas below. Scaling is a way to remove loose, overhanging, and unstable
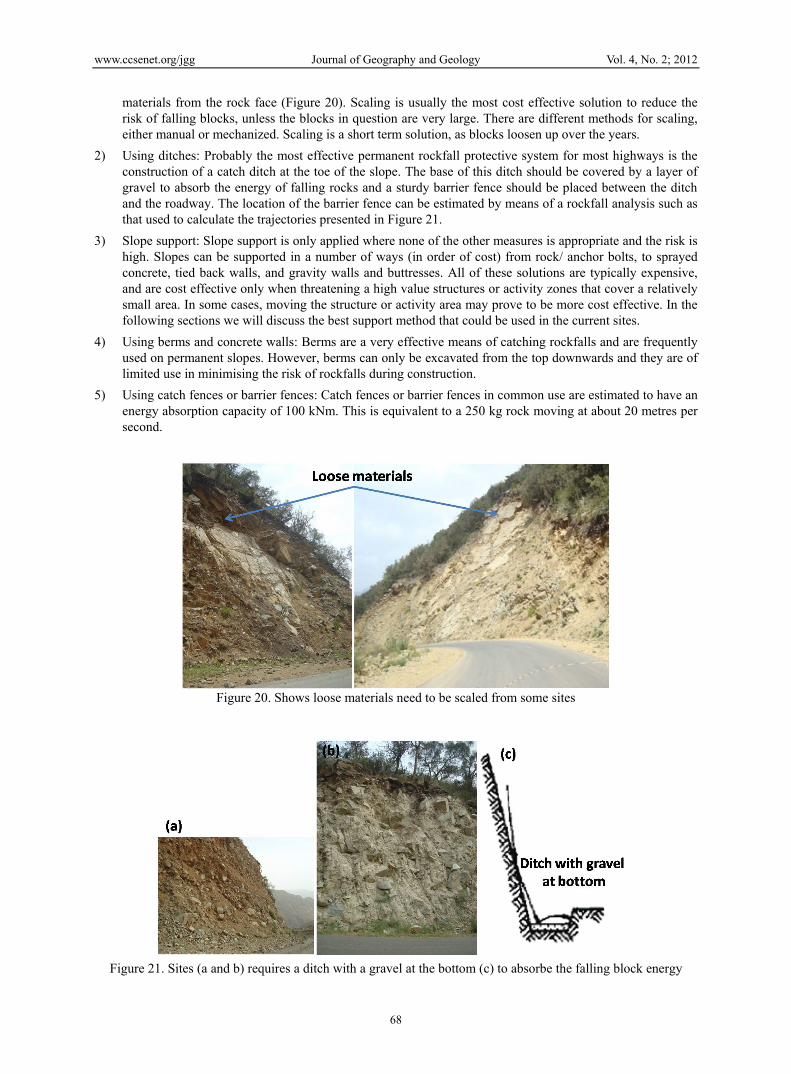
www.ccsenet.org/jgg Journal of Geography and Geology Vol. 4, No. 2; 2012
68
materials from the rock face (Figure 20). Scaling is usually the most cost effective solution to reduce the risk of falling blocks, unless the blocks in question are very large. There are different methods for scaling, either manual or mechanized. Scaling is a short term solution, as blocks loosen up over the years.
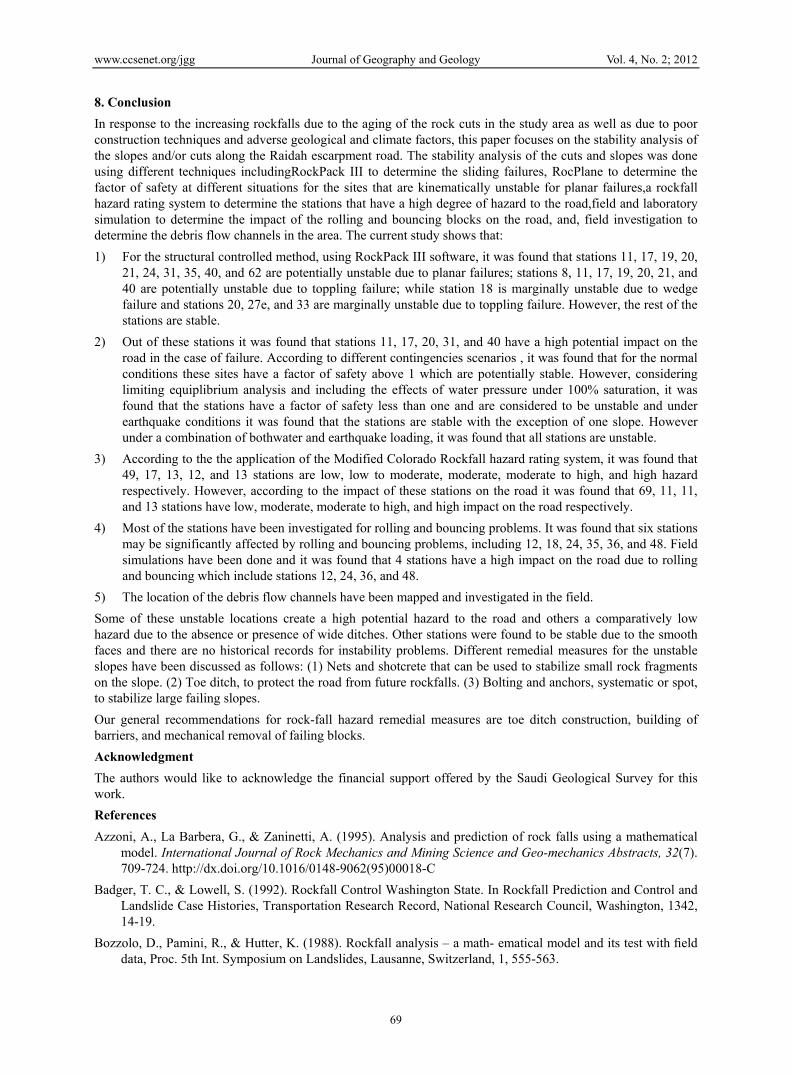
2) Using ditches: Probably the most effective permanent rockfall protective system for most highways is the construction of a catch ditch at the toe of the slope. The base of this ditch should be covered by a layer of gravel to absorb the energy of falling rocks and a sturdy barrier fence should be placed between the ditch and the roadway. The location of the barrier fence can be estimated by means of a rockfall analysis such as that used to calculate the trajectories presented in Figure 21.
3) Slope support: Slope support is only applied where none of the other measures is appropriate and the risk is high. Slopes can be supported in a number of ways (in order of cost) from rock/ anchor bolts, to sprayed concrete, tied back walls, and gravity walls and buttresses. All of these solutions are typically expensive, and are cost effective only when threatening a high value structures or activity zones that cover a relatively small area. In some cases, moving the structure or activity area may prove to be more cost effective. In the following sections we will discuss the best support method that could be used in the current sites.
4) Using berms and concrete walls: Berms are a very effective means of catching rockfalls and are frequently used on permanent slopes. However, berms can only be excavated from the top downwards and they are of limited use in minimising the risk of rockfalls during construction.
5) Using catch fences or barrier fences: Catch fences or barrier fences in common use are estimated to have an energy absorption capacity of 100 kNm. This is equivalent to a 250 kg rock moving at about 20 metres per second.
Figure 20. Shows loose materials need to be scaled from some sites
Figure 21. Sites (a and b) requires a ditch with a gravel at the bottom (c) to absorbe the falling block energy
www.ccsenet.org/jgg Journal of Geography and Geology Vol. 4, No. 2; 2012
69
8. Conclusion
In response to the increasing rockfalls due to the aging of the rock cuts in the study area as well as due to poor construction techniques and adverse geological and climate factors, this paper focuses on the stability analysis of the slopes and/or cuts along the Raidah escarpment road. The stability analysis of the cuts and slopes was done using different techniques includingRockPack III to determine the sliding failures, RocPlane to determine the factor of safety at different situations for the sites that are kinematically unstable for planar failures,a rockfall hazard rating system to determine the stations that have a high degree of hazard to the road,field and laboratory simulation to determine the impact of the rolling and bouncing blocks on the road, and, field investigation to determine the debris flow channels in the area. The current study shows that:
1) For the structural controlled method, using RockPack III software, it was found that stations 11, 17, 19, 20, 21, 24, 31, 35, 40, and 62 are potentially unstable due to planar failures; stations 8, 11, 17, 19, 20, 21, and 40 are potentially unstable due to toppling failure; while station 18 is marginally unstable due to wedge failure and stations 20, 27e, and 33 are marginally unstable due to toppling failure. However, the rest of the stations are stable.
2) Out of these stations it was found that stations 11, 17, 20, 31, and 40 have a high potential impact on the road in the case of failure. According to different contingencies scenarios , it was found that for the normal conditions these sites have a factor of safety above 1 which are potentially stable. However, considering limiting equiplibrium analysis and including the effects of water pressure under 100% saturation, it was found that the stations have a factor of safety less than one and are considered to be unstable and under earthquake conditions it was found that the stations are stable with the exception of one slope. However under a combination of bothwater and earthquake loading, it was found that all stations are unstable.
3) According to the the application of the Modified Colorado Rockfall hazard rating system, it was found that 49, 17, 13, 12, and 13 stations are low, low to moderate, moderate, moderate to high, and high hazard respectively. However, according to the impact of these stations on the road it was found that 69, 11, 11, and 13 stations have low, moderate, moderate to high, and high impact on the road respectively.
4) Most of the stations have been investigated for rolling and bouncing problems. It was found that six stations may be significantly affected by rolling and bouncing problems, including 12, 18, 24, 35, 36, and 48. Field simulations have been done and it was found that 4 stations have a high impact on the road due to rolling and bouncing which include stations 12, 24, 36, and 48.
5) The location of the debris flow channels have been mapped and investigated in the field.
Some of these unstable locations create a high potential hazard to the road and others a comparatively low hazard due to the absence or presence of wide ditches. Other stations were found to be stable due to the smooth faces and there are no historical records for instability problems. Different remedial measures for the unstable slopes have been discussed as follows: (1) Nets and shotcrete that can be used to stabilize small rock fragments on the slope. (2) Toe ditch, to protect the road from future rockfalls. (3) Bolting and anchors, systematic or spot, to stabilize large failing slopes.
Our general recommendations for rock-fall hazard remedial measures are toe ditch construction, building of barriers, and mechanical removal of failing blocks.
Acknowledgment
The authors would like to acknowledge the financial support offered by the Saudi Geological Survey for this work.
References
Azzoni, A., La Barbera, G., & Zaninetti, A. (1995). Analysis and prediction of rock falls using a mathematical model. International Journal of Rock Mechanics and Mining Science and Geo-mechanics Abstracts, 32(7). 709-724. http://dx.doi.org/10.1016/0148-9062(95)00018-C
Badger, T. C., & Lowell, S. (1992). Rockfall Control Washington State. In Rockfall Prediction and Control and Landslide Case Histories, Transportation Research Record, National Research Council, Washington, 1342, 14-19.
Bozzolo, D., Pamini, R., & Hutter, K. (1988). Rockfall analysis – a math- ematical model and its test with field data, Proc. 5th Int. Symposium on Landslides, Lausanne, Switzerland, 1, 555-563.
www.ccsenet.org/jgg Journal of Geography and Geology Vol. 4, No. 2; 2012
70
Brawner, C. O. (1994). Rockfall Hazard Mitigation Methods, Participant Workbook, NHI Course No. 13219. U.S. Department of Transportation, Federal Highway Administration, Publication No. FHWA SA-93-085.
Brawner, C. O., & Wyllie, D. C. (1975). Rock Slope Stability on Railway Projects. In Proc., American Railway Engineering Association Regional Meeting, Vancouver, B. C., American Railway Engineering Association, Washington, D.C., 8 pp.
Evans, S. G., & Hungr, O. (1993). The assessment of rockfall hazard at the base of talus slopes. Canadian Geotechnical Journal, 30, 620-636. http://dx.doi.org/10.1139/t93-054
Franklin, J. A., & Senior, S. A. (1997b). Rockfall Hazards – Strategies for detection, assessment, and remediation: Proceedings International Symposium on Engineering Geology and The Environment, Athens, Greece, pp. 657-663.
Greenwood, W. R. (1985). Geological map of Abha quadrangle, sheet 18F, Minestry of Petroleum and Mineral Resources, Jeddah, Saudi Arabia, GM-75C, scale 1:250,000.
Guzzetti, F., Crosta, G., Detti, R., et al. (2002). STONE; A computer program for the three-dimensional simulation of rock-falls. Computers and Geosciences, 28(9), 1079-1093. http://dx.doi.org/10.1016/S0098-3004(02)00025-0
Guzzetti, F., Reichenbach, P., & Wieczorek, G. F. (2003). Rockfall hazard and risk assessment in the Yosemite Valley, California, USA. Natural Hazards and Earth System Sciences, European Geophysics Union, 3, 491-503.
Hungr, O., & Evans, S. G. (1989). Engineering aspects of Rockfall hazard in Canada. Geological Survey of Canada, Open File 2061, 102 pp.
Jones, C. L., Higgins, J. D., & Andrew, R. D. (2000). Colorado rockfall simulation program, version 4.0: Colorado Department of Transportation, Denver, Colo., 127 p.
Maerz, N. H., Youssef, A., & Fennessey, T. W. (2005). New Risk–Consequence Rockfall Hazard Rating System for Missouri Highways Using Digital Image Analysis. Environmental & Engineering Geoscience, 11(3), 229-249. http://dx.doi.org/10.2113/11.3.229
McCauley, M. L., Works, B. W., & Naramore. S. A. (1985). Rockfall Mitigation. Report FHWA/CA/TL-85/12. FHWA, U. S. Department of Transportation, 147 pp.
NHI (National Highway Institute). (1994). Rock Fall Hazard Mitigation. Publication No. FHWA SA-93-085.
Pierson, L. A., & Van Vickle, R. (1993). Rockfall Hazard Rating System – Participants’ Manual: FHWA Report – FHWA-SA-93-057, 102 pp.
Pierson, L. A., Davis, S. A., & Van Vickle, R. (1990). Rockfall Hazard Rating Systems Implementation Manual. Federal Highway Administration (FHWA) Report FHWA, US Dept. of Transportation.
Piteau, D. R. (1979a). Engineering geology considerations and basic approach to rock slope stability analysis for highways. Part A., Rock Slope Engineering Reference Manual: FHWA Report – FHWA-TS-79-208, 78 pp.
Piteau, D. R., & Associates Ltd. (1979b). Rock Slope Engineering Reference Manual. Part E: Rock Slope Stabilization, Protection and Warning-Instrumentation Measures and Related Construction Considerations. Publication No. F.
Rocscience, RocLab – Program. (2002). For determining rock mass strength parameters using the Hoek-Brown failure criterion, Rocscience Inc., Toronto.
Rocscience, RocPlane – Program. (2001). For evaluating the geometry and planar sliding stability in rock slopes, Rocscience Inc., Toronto.
Russell, C. P., Santi, P., & Humphrey, J. D. (2008). Modification and statistical analysis of the Colorado Rockfall Hazard Rating System: Report No. CDOT-2008-7, 139 pp.
Spang, R. M., & Rautenstrauch, R. W. (1988). Empirical and mathematical approaches to rock fall prediction and their practical applications. Proc. 5th International Symposium on Landslides, Lusanne, 2, 1237-1243.
Watts, C. F. (2003). User's Manual Rockpack III for Windows, Rock Slope Stability Computerized Analysis Package, Part One - Stereonet Analyses, C.F. Watts & Associates.
Wyllie, D. C. (1987). Rock slope inventory system. In Proc., Federal Highway Administration Rockfall Mitigation Seminar, FHWA Region 10, Portland, Oreg., 25 pp.