1
Use of a Machine Learning Algorithm in the Prediction of Extreme Rainfall Events Mark Klein NOAA/NWS/Weather Prediction Center, College Park, MD A’ Forecast Challenge WPC’s Excessive Rainfall Outlooks (EROs) show the potential for rainfall to produce flash flooding over the CONUS for the Day 1-3 period. Forecasters review copious data to create the forecast. Summary of Results SSEO Probability of QPF exceeding FFG Need a tool to synthesize model guidance Machine Learning Technique Developed at Colorado State University and evaluated during three years of WPC’s Flash Flood and Intense Rainfall experiments, a prediction system trained using Random Forests predicts the probability that a 1- or 2-year ARI will be exceeded within 40km of a point during a 24-hour period (in line with WPC’s ERO spatial and temporal definition). Random Forest Prediction system An ensemble of 1000 decision trees, each with a deterministic outcome aggregated to produce a forecast probability Trained for eight climatologically distinct CONUS regions using nearly 11 years of 00Z GEFS Reforecast initializations from January 2003 – August 2013 Verification data: Stage IV QPE, CCPA, and flash flood Local Storm Reports (LSRs) Predictors include: QPF, CAPE and CIN, Precipitable Water, Mean Sea Level Pressure, 2-meter temperature and mixing ratio, 10-meter winds References Herman, G.R. and R.S. Schumacher (2018): Money Doesn’t Grow on Trees, but Forecasts Do: Forecasting Extreme Precipitation with Random Forests. Monthly Weather Review, 146, 1571-1600. Herman, G.R. and R.S. Schumacher (2018b): ‘Dendrology’ in Numerical Weather Prediction: What Random Forests and Logistic Regression Tell Us About Forecasting Extreme Precipitation. Monthly Weather Review, 146, 1785-1812. Using machine learning, employ a probabilistic forecast methodology based on the prediction of rainfall exceeding climatological average recurrence intervals (ARIs). ARIs: Better corresponds to actual impacts than fixed thresholds Do not bias toward climatologically wetter regions Product Evaluation: May, 2019 -April, 2020 Forecast Products Several versions of the model are running operationally at WPC using the GEFS Reforecast (GEFS/R) and 00Z/12Z runs of the operational GEFS (GEFS/O). Yearly changes based on feedback from FFaIR experiments. Future Work East of the Rockies, spatial coverage of risk areas for the 2017 and 2019 model versions matched reasonably well to WPC forecasts. The 2018 model has a considerable high bias The 2019 model improved the high frequency bias found over the Rockies in the 2017 and 2018 versions The 2017 and 2019 models were calibrated with respect to the WPC ERO probability thresholds for the Marginal, Slight, and Moderate categories for both Day 2 and 3 Greater spatial coverage of the 2018 model resulted in relatively poor calibration to the risk categories; this version has since been discontinued Brier scores and area under ROC indicate that CSU-MLP performs on par or better than WPC’s ERO. This is particularly true of the 2019 model version. Extend outlooks to Day 4-7 as first guess fields for (proposed) longer-range WPC EROs Incorporate updated 2020 model version into verification statistics Develop machine learning algorithms focused on short-fuse events to support WPC’s Metwatch desk Retrain model for GEFv12 upgrade Project Goals 1. Derive a forecast technique that can: a. Combine QPF and multiple relevant atmospheric ingredients into a probabilistic forecast b. Correct for numerical model timing and displacement biases c. Run within WPC’s computational framework 2. Create an operational “recommender or “first guess” for WPC’s ERO Conceptual Approach 24-hour precipitation average recurrence intervals over the CONUS CONUS Regions Predictor influence by region Left to right: QPF, CAPE, CIN, PW, 2m T, 2m Q, 10m U/V, PMSL Predictor Influence QPF most predictive of ARI exceedances for most areas of the CONUS Precipitable water more predictive than QPF over the Northern Plains and Midwestern regions CAPE and QPF nearly equally predictive over the Southwest (monsoonal convection) 2017 model 2018 model 2019 model WPC Day 2 ERO Verification 2017 Version Trained on exceedance of 1-year ARI Verification: Stage IV only FFaIR Feedback Spatial coverage generally too low Probabilities low-biased except in Southwest Day 2 GEFS 24-hour ERO first guess valid 12Z July 23, 2019 2018 Version Trained on exceedance of 1-year ARI and/or flash flood LSRs Verification: Stage IV, CCPA, LSRs FFaIR Feedback Spatial coverage too broad High bias, especially in central/northern Plains and Rockies 2019 Version Trained on exceedance of 1- or 2- year ARI (ROCK/SW/NGP) and/or flash flood LSRs Verification: CCPA and LSRs FFaIR Feedback Overall better areal coverage and bias than 2017/2018 models 24-hour QPF valid 8/7/19 850 hPa Winds/PW MUCAPE Boundary layer moisture wind/convergence/PMSL Frequency Plots Day 3 Slight Risk Forecasts from WPC and GEFS 2017 model 2018 model 2019 model WPC ERO Verification Metrics Brier skill scores Area under ROC Fractional coverage of observed flooding* within categorical risk areas *Observed flooding/flash flooding area is derived using the following data sets: Stage IV QPE exceeding 1/3/6 hour flash flood guidance Stage IV QPE exceeding the 24-hour 5- year average recurrence interval NWS Local Storm Reports USGS gauge observations Day 2 Range of ERO threshold probabilities MDT 20-50% Day 3 Results within ERO ranges are well- calibrated Bulk Brier Score Bulk Area Under ROC

SSEO Probability of QPF exceeding FFG Use of a Machine

  • Upload
    others

  • View
    3

  • Download
    0

Embed Size (px)

Citation preview

Use of a Machine Learning Algorithm in the Prediction of Extreme Rainfall Events

Mark KleinNOAA/NWS/Weather Prediction Center, College Park, MD

A’

A’ A A’

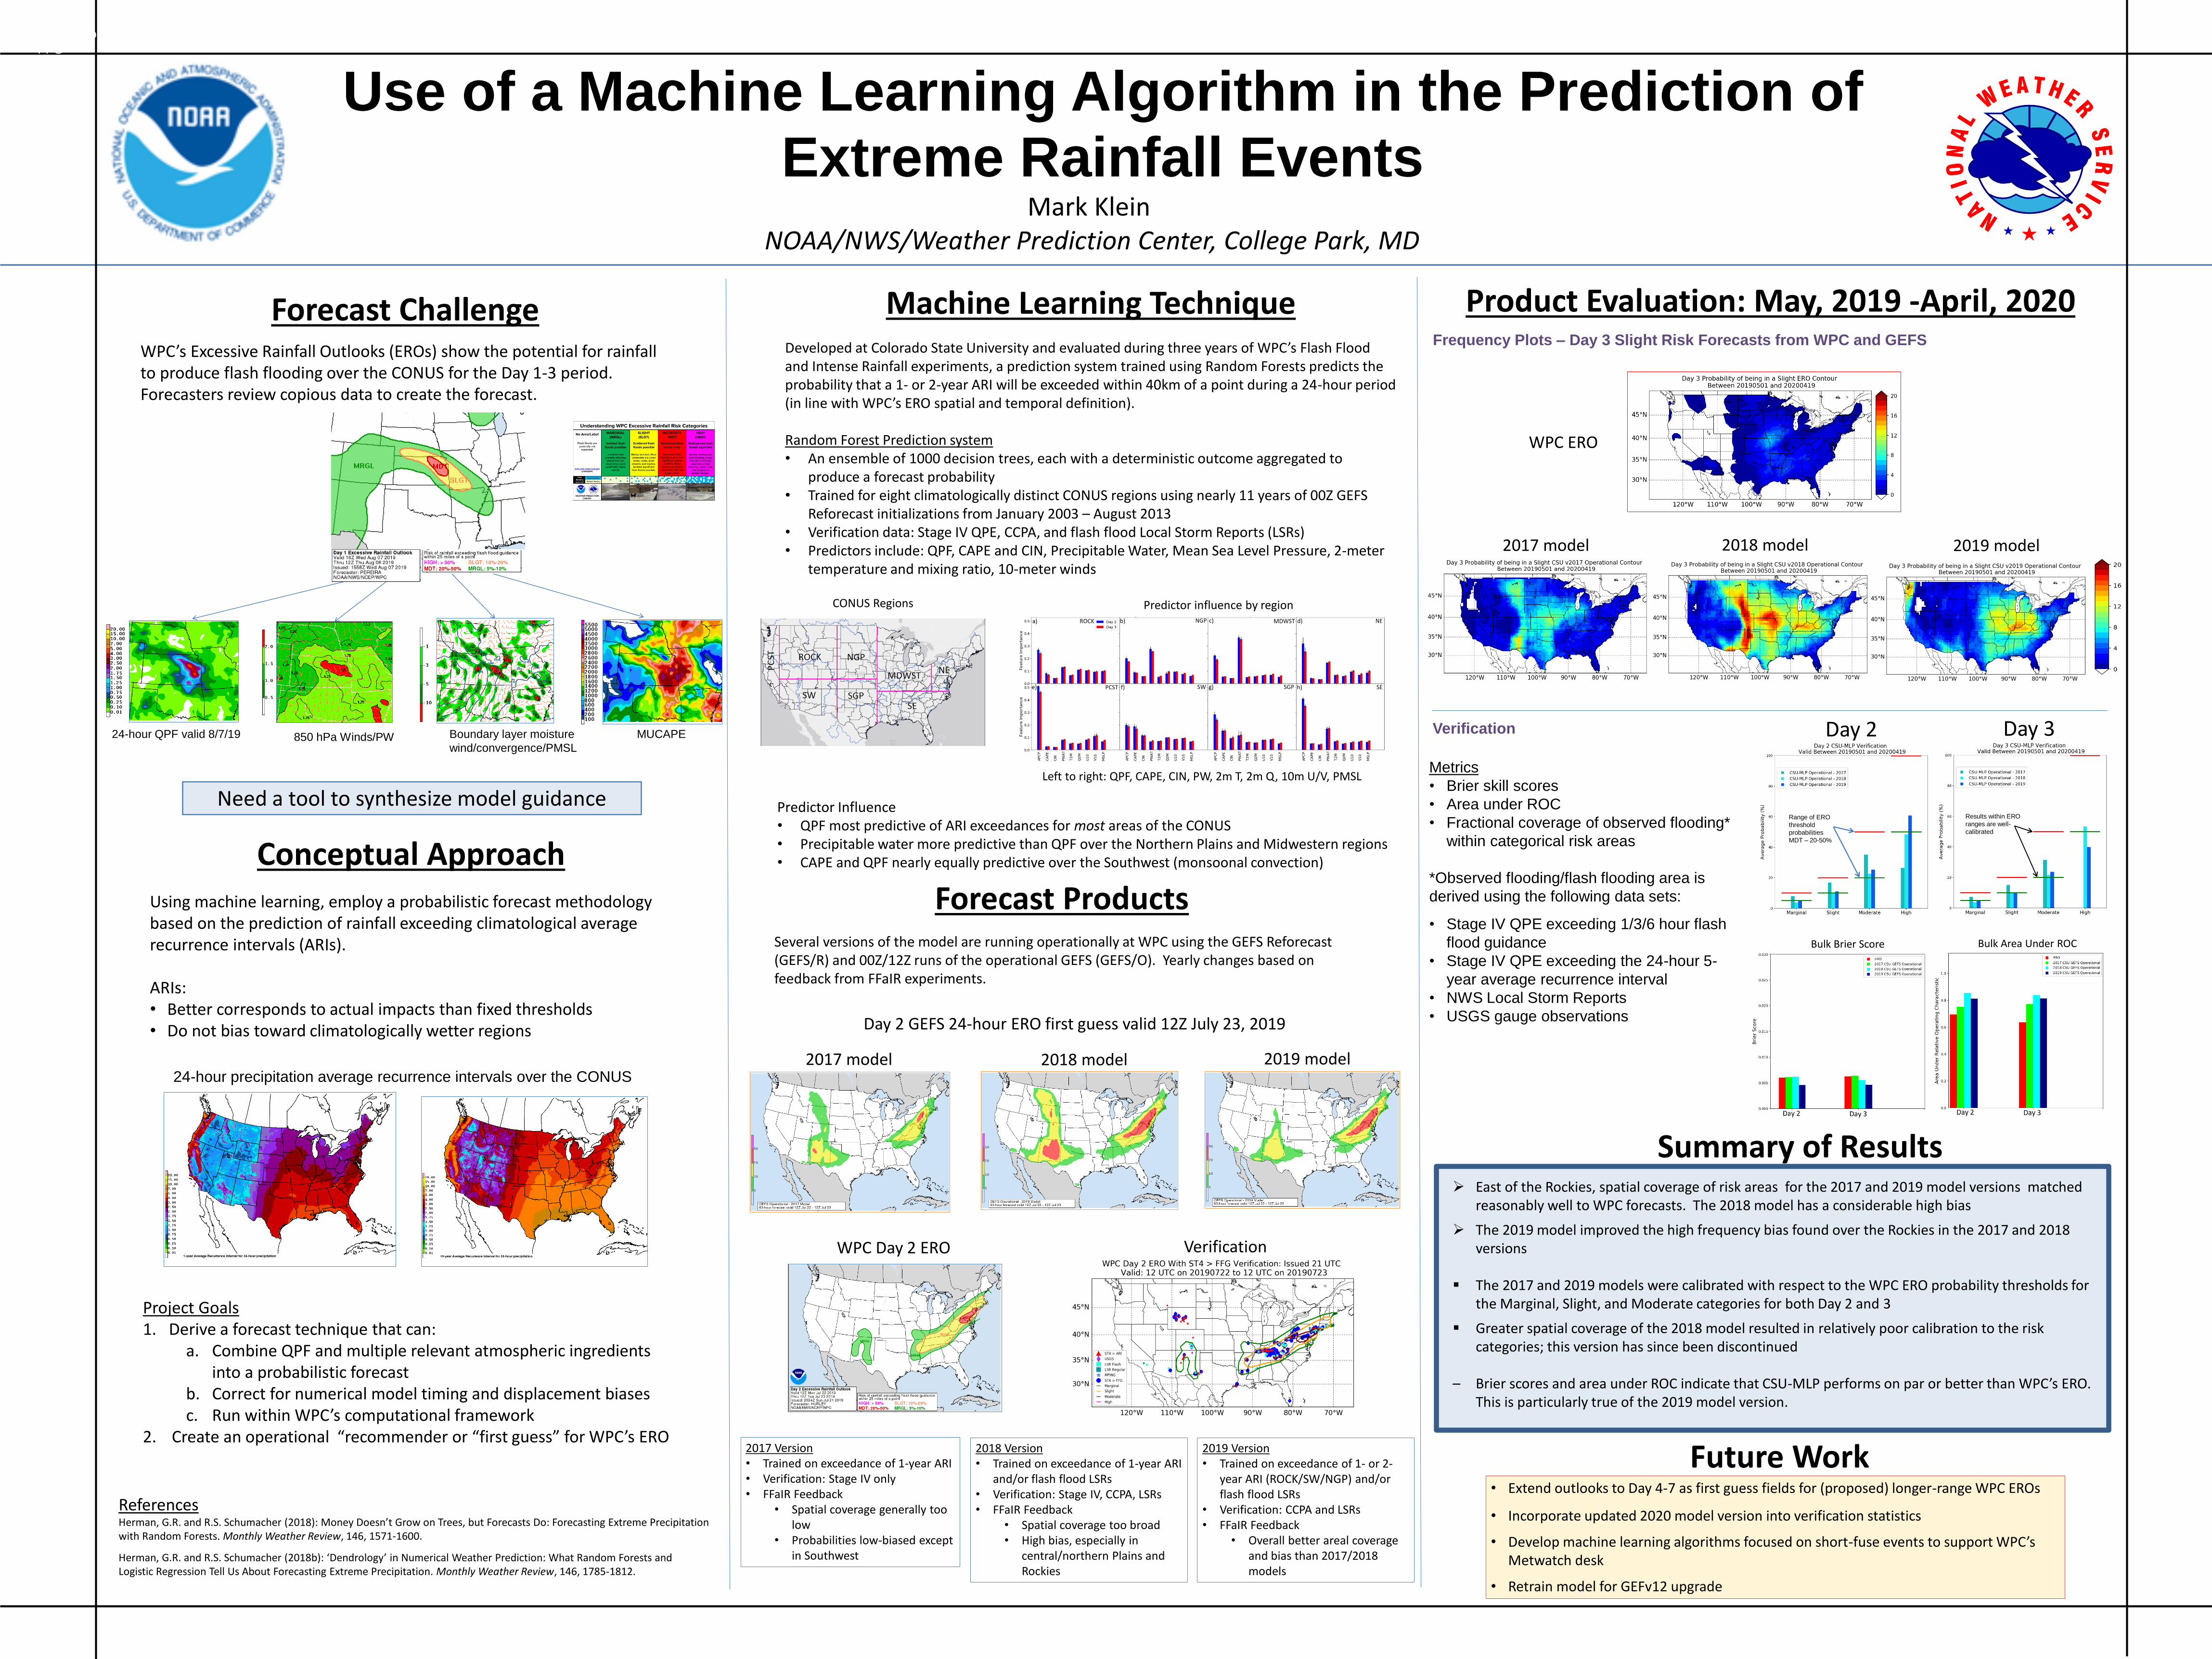
Forecast ChallengeWPC’s Excessive Rainfall Outlooks (EROs) show the potential for rainfall to produce flash flooding over the CONUS for the Day 1-3 period. Forecasters review copious data to create the forecast.

Summary of Results

SSEO Probability of QPF exceeding

FFG

Need a tool to synthesize model guidance

Machine Learning TechniqueDeveloped at Colorado State University and evaluated during three years of WPC’s Flash Flood and Intense Rainfall experiments, a prediction system trained using Random Forests predicts the probability that a 1- or 2-year ARI will be exceeded within 40km of a point during a 24-hour period (in line with WPC’s ERO spatial and temporal definition).

Random Forest Prediction system• An ensemble of 1000 decision trees, each with a deterministic outcome aggregated to

produce a forecast probability• Trained for eight climatologically distinct CONUS regions using nearly 11 years of 00Z GEFS

Reforecast initializations from January 2003 – August 2013• Verification data: Stage IV QPE, CCPA, and flash flood Local Storm Reports (LSRs)• Predictors include: QPF, CAPE and CIN, Precipitable Water, Mean Sea Level Pressure, 2-meter

temperature and mixing ratio, 10-meter winds

ReferencesHerman, G.R. and R.S. Schumacher (2018): Money Doesn’t Grow on Trees, but Forecasts Do: Forecasting Extreme Precipitation with Random Forests. Monthly Weather Review, 146, 1571-1600.

Herman, G.R. and R.S. Schumacher (2018b): ‘Dendrology’ in Numerical Weather Prediction: What Random Forests and Logistic Regression Tell Us About Forecasting Extreme Precipitation. Monthly Weather Review, 146, 1785-1812.

Using machine learning, employ a probabilistic forecast methodology based on the prediction of rainfall exceeding climatological average recurrence intervals (ARIs).

ARIs:• Better corresponds to actual impacts than fixed thresholds• Do not bias toward climatologically wetter regions

Product Evaluation: May, 2019 -April, 2020

Forecast ProductsSeveral versions of the model are running operationally at WPC using the GEFS Reforecast (GEFS/R) and 00Z/12Z runs of the operational GEFS (GEFS/O). Yearly changes based on feedback from FFaIR experiments.

Future Work

East of the Rockies, spatial coverage of risk areas for the 2017 and 2019 model versions matched reasonably well to WPC forecasts. The 2018 model has a considerable high bias

The 2019 model improved the high frequency bias found over the Rockies in the 2017 and 2018 versions

The 2017 and 2019 models were calibrated with respect to the WPC ERO probability thresholds for the Marginal, Slight, and Moderate categories for both Day 2 and 3

Greater spatial coverage of the 2018 model resulted in relatively poor calibration to the risk categories; this version has since been discontinued

– Brier scores and area under ROC indicate that CSU-MLP performs on par or better than WPC’s ERO. This is particularly true of the 2019 model version.

• Extend outlooks to Day 4-7 as first guess fields for (proposed) longer-range WPC EROs

• Incorporate updated 2020 model version into verification statistics

• Develop machine learning algorithms focused on short-fuse events to support WPC’s Metwatch desk

• Retrain model for GEFv12 upgrade

Project Goals1. Derive a forecast technique that can:

a. Combine QPF and multiple relevant atmospheric ingredients into a probabilistic forecast

b. Correct for numerical model timing and displacement biasesc. Run within WPC’s computational framework

2. Create an operational “recommender or “first guess” for WPC’s ERO

Conceptual Approach

24-hour precipitation average recurrence intervals over the CONUS

CONUS Regions Predictor influence by region

Left to right: QPF, CAPE, CIN, PW, 2m T, 2m Q, 10m U/V, PMSL

Predictor Influence• QPF most predictive of ARI exceedances for most areas of the CONUS• Precipitable water more predictive than QPF over the Northern Plains and Midwestern regions• CAPE and QPF nearly equally predictive over the Southwest (monsoonal convection)

2017 model 2018 model 2019 model

WPC Day 2 ERO Verification

2017 Version• Trained on exceedance of 1-year ARI• Verification: Stage IV only• FFaIR Feedback

• Spatial coverage generally too low

• Probabilities low-biased except in Southwest

Day 2 GEFS 24-hour ERO first guess valid 12Z July 23, 2019

2018 Version• Trained on exceedance of 1-year ARI

and/or flash flood LSRs• Verification: Stage IV, CCPA, LSRs• FFaIR Feedback

• Spatial coverage too broad• High bias, especially in

central/northern Plains and Rockies

2019 Version• Trained on exceedance of 1- or 2-

year ARI (ROCK/SW/NGP) and/or flash flood LSRs

• Verification: CCPA and LSRs• FFaIR Feedback

• Overall better areal coverage and bias than 2017/2018 models

24-hour QPF valid 8/7/19 850 hPa Winds/PW MUCAPEBoundary layer moisture

wind/convergence/PMSL

Frequency Plots – Day 3 Slight Risk Forecasts from WPC and GEFS

2017 model 2018 model 2019 model

WPC ERO

Verification

Metrics

• Brier skill scores

• Area under ROC

• Fractional coverage of observed flooding*

within categorical risk areas

*Observed flooding/flash flooding area is

derived using the following data sets:

• Stage IV QPE exceeding 1/3/6 hour flash

flood guidance

• Stage IV QPE exceeding the 24-hour 5-

year average recurrence interval

• NWS Local Storm Reports

• USGS gauge observations

Day 2

Range of ERO

threshold

probabilities

MDT – 20-50%

Day 3

Results within ERO

ranges are well-

calibrated

Bulk Brier Score Bulk Area Under ROC