Embed Size (px)
Citation preview
,.,,-
1-,,...
Ssc-139
ON EFFECTS OF CARBON AND MANGANESE CONTENT
AND OF GRAIN SIZE ON DYNAMIC STRENGTH
PROPERTIES OF MILD STEEL
by
J. M. Krafft
and
A, M. Sullivan
SHIP STRUCTURE COMMITTEE
i --
-—
SHIP STRUCTURE COMMITTEE
MEMBER AGENCIES: ADDRESS CORRESPONDENCE To:
BUREAU OF SHIPS, DEP’I’, OF NAVY SECRETARY
MILITARY SEA TRANSPORTATION SERVICE, DEFY. OF NAVV-.
SHIP STRUCTURE COMMIT’WE
UNITED STATES COAST GUARD, TREASURY DEPT. U. S, COAST GUARD HEADQUARTERS
MARITIME ADMINISTRATION, DEPT. OF COMMERCE WASHINGTON 2E, D, G.
AMERICAN BUREAU OF SHIPPING .—December 27, 1961
I--
Dear Sk
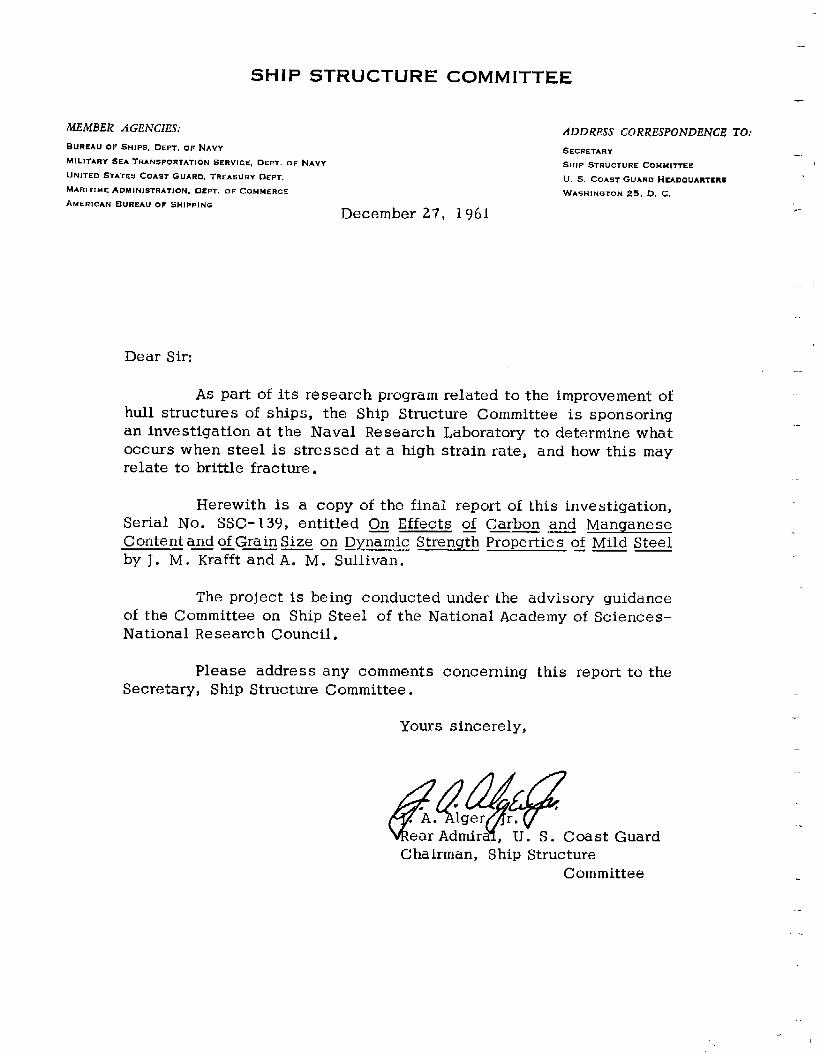
As part of its research program related to the improvement ofhull structures of ships, the Ship Structure Committee is sponsoringan investigation at the Naval Research Laboratory to determine whatoccurs when steel is stressed at a high strain rate, and how this mayrelate to brittle fracture.
Herewith is a copy of the final report of this investigation,Serial No. SSC- 139, entitled On Effects of Carbon and ManganeseContent and of Grain Size on Dyn;mic Strenq= Properti=of Mild Steel.—— ——by J. M. Krafft and A. M. Sullivan.
-— —
The project is being conducted under the advisory guidanceof the Committee on Ship Steel of the National Academy of Sciences–National Research Council.
Please address any comments concerning this report to theSecretary, Ship Structure Committee.
Yours sincerely,. .
—
Chairman, Ship StructureCommittee
Serial No. SSC-139
Final Reportof
Project SR- 142.
to the
SHIP STRUCTURE COMMITTEE
ON EFFECTS OF CARBON AND MANGANESE CONTENT AND OFGRAIN SIZE ON DYNAMIC STRENGTH PROPERTIES OF MILD STEEL
by
J. M. Krafft and A. M. Sullivan
U. S. Naval Research LaboratoryWashington, D. C.
under
Bureau of ShipsDepartment of the NavyIndex No. NS-011-078
transmitted through
Committee on Ship SteelDivision of Engineering and Industrial Research
National Academy of Sciences-National Research Council
under
Department of the NavyBureau of Ships Contract NObs-84321
Index No. S-R 009 03 01 Task 2004
Washington, D. C.National Academy of Sciences-National Research Council
December 27, 1961
ABSTRACT
The exceptiormiiy low ductilityof mild steei when separatedby
arapidly moving crack maybe attribute din part to its plasti,c flow strain-
rate sensitivity. The elevation in yield strength under conditions of rap-
idly rising stress adjacent to the crack tip suppresses formation of the
energy-absorbing plastic zone. Variation in composition, particularly of
carbon and manganese content which affect the notched bar impact tran-
sition temperature, should also affect strain-rate sensitivity if this de-
scription is applicable. To test this proposition materials, with these
elements and grain size varied, were subjected to rapid uniaxial compres -
sion. Both impact and a free-piston gunpowder-pressurized machine
were used to obtain dynamic stress-strain curves at room temperature,
The general trends in yield point strain-rate sensitivity are found in
agreement with effects of composition on the Charpy transition tempera-
ture. A good correlation is found to exist between the parameter k, found
from the grain size dependency of dynamic upper yield strength, and the
transition temperature expectancy for given composition. Plastic flow
stress, at given high strain rate, can be correlated with free path in fer-
rite better than with ferrite grain size.
—
.
Introduction . .
Specimen Mater’
. . . . . . . . . . . . . . .
al and Size . . . . . . . .
Test Apparatus and Methods . . . . . . .
Presentation of Basic Data . . . . . . . .
Discus sion . . . . . . . . . . . . . . . . . .
Correlation with Fracture Performance .
Conclusions . . . . . . . . . . . . . . . . . .
Acknowledgments . . . . . . . . . . . . . .
Reference s . . . . . . . ..~. . . . . . . .
. . . . . .
. . . . . .
. . . . . .
. . . . . .
. . . . . .
. . . . . .
. . . . . .
. . . . . .
. . ...”
. . . . .
. . . . .
. . . . .
. . . . .
. . . . .
. . . . .
. . . . .
. . . . .
. . ..O
. .
. .
. .
. .
,.
. .
. .
. .
. .
EXE
1
3
8
11
19
22
25
26
26
SR-142 PROJECT ADVISORY COMMITTEE
“Strain Rate and Fracture”
for the
COMMITTEE ON SHIP STEEL
Chairman:
J. R. Low, Jr.Metallurgy Research UnitResearch Laboratory, General Electric Company
Members:
C. S. BarrettInstitute for the Study of MetalsUniversity of Chicago
J. H. BechtoldManager, Metallurgy DepartmentWestinghouse Research Laboratories, Churchill Boro
L. S. DarkenAssistant Directorj Fundamental Research LaboratoryU. S. Steel Corporation
Maxwell GensamerProfessor of MetallurgySchool of MinesColumbia University
INTRODUCTION
-.
-.
—
An understanding of the basic processes of fracture has been the
long term objective of this study of flow properties in metals at high
rates of strain. During fracture, the energy required for separation is
almost totally utilized in the plastic deformation of a volume of material
immediately adjacent to the fracture path. This deformed zone, in turn,
resists fracture propagation so the two are seen to be closely interrelated.
Many fractures become catastrophic only after the crack begins to run rap-
idiy. Any plastic deformation associated with it must also be rapid. To
understand and describe the high speed fracture process, the plastic flow
properties at high rates of strain must be considered, when these differ
from the so-called static properties.
This reasoning supports the experimental evidence that material
toughness decreases when high strain rate conditions increase yield and
flow strength. Correlation of the static and dynamic flow properties of a
mild steel reported by Manjoinel with the absorbed energy values of both
slow notch bend and Charpy impact tests from the work of Mailander2 is
pertinent. Comparing the slow speed tests it seems plausible to associate
the decrease in fracture energy at temperatures below 00 C with the corre-
sponding increase in flow strength. At the strain aging temperature, again
fracture energy drops and may be associated with the rise in flow strength.
Under dynamic conditions of loading where flow stress elevation occurs at
higher temperatures, the Charpy energy minima shift correspondingly.
In reality a spectrum of strain levels is included in the crack envi-
ronment and should infiuence the energy used in plastic flow. At low tem-
peratures, for example, the upper or delayed yield strength is markedly
greater than the flow strength and markedly more sensitive to strain rate as
well. In this region the upper yield strength, rather than the flow stress,
may largely control the extent of plastic deformation and thus account for
the relatively marked drop in Charpy energy. The work of Hall et als has
“ 2-
show-n that in mild steel plates recoverable strains adjacent to a rap-
idly running crack are found which are several times the static yield
strain values. There can be little doubt that the yield strength eleva-
tion, which is clearly a measure of the delayed yield effect, operates
to permit such stress levels to exist without plastic flow. Diminution
of the size of the crack-tip-associated plastic zone as a consequence
of the increased elastic constraint is reasonably associated with the
brittleness of this material.
Models for fracturing of, ductile materials have always included
some influence of yield and/or flow properties. Ludwig’s hypothesis
of a yield or flow stress, reaching a “fracture stress” as a condition
for crack growth is of historical interest.4 This analogy, though POS -
sibly of use for very ductile fracture of materials possessing no distinct
flaws or cracks, is not too helpful in describing brittle fracture. In the
fracture mechanics developed by Irwin5 resistance to crack growth or
fracture to.ughne ss is expressed in terms of crack stress-field intensity
required to propagate the crack. Not unlike the Ludwig hypothesis,
this fracture strength parameter is compared to a tensile strength parame-
ter as a measure of brittleness. Thus a crack-tip-associated plastic
zone is successfully dimensioned as a function of the ratio of this stress
intensity parameter for unstable fracture to the yield stress. This char-
acterization of plastic zone size is necessarily somewhat arbitrary as,1”.experimental measures of any fracture toughness parameter inherently re-
flect the energy contribution of the plastic zone. Toughness measured
for conditions of maximum elastic constraint, such as in thick sections
of material, should be most suitable.
There are notable cases for which fracture toughness can be re-
duced ,essentially independently of the yield strength. Marked reduction
in crack-tip-associated plastic deformation is then observed. IrI fracture
of a sheet or plate the extent of the shear lip is a qualitative index of the
plastic flow associated with the crack.6 A subnormal size of this lip is
—. ..-.
-3-
—
-...
---
—
strikingly evident in cases in which the fracture toughness is reduced.
Fatigue cracks, where because of localized plastic upset the crack
grows with very low crack extension force or applied stress, are char-
acterized by the negligible plastic flow that accompanies thern.7
When the requirement for crack extension force is reduced by chemical
action such as stress corrosion effects, abnormally small shear lips
are observed. 8 A most striking instance of this effect is seen when
damagi,ng salts2 such as those of mercury on aluminum, are applied to
a crack. g Heavy plates of ordinarily tough material can then be broken
by hand after which practically no trace of shear lip is seen on the frac-
ture surface, even though without the salts the shear lip wodd cover
the specimen thickness.
If yield stress increases without change in fracture toughness,
.— as might be the case in going to high crack speeds in a rate sensitive
material, then the plastic zone size and its energy absorption must de-
crease. This effect is thought to characterize rapid fracture brittleness
of mild steel since this material has long been noted for high strain-rate
sensitivity. The role of this sensitivity in the fracture process has been
evaluated by studying the effect of reduced temperature on pl.ast.ic flow
properties and then assuming an equivalence between reduced tempera-
ture arid increased strain rate. A more direct approach is followed in this
paper where, at a given temperature, the loading and strain rate are varied.
to provide direct measure of strain-rate sensitivity. The modification of
this sensitivity with changes in manganese content and grain size permits
correlation with Charpy notched bar impact test properties of si,milar ma-
terials.
SPECIMEN MATERIAL AND SIZE
.-
The tests were intended to include combinations of three levels of
carbon content (roughly O. 1, 0.2 and 0. 37,) and three of manganese (0. 3,
0.6andl. OYO). Particulars of this set, with the exception of unavailable
-4”
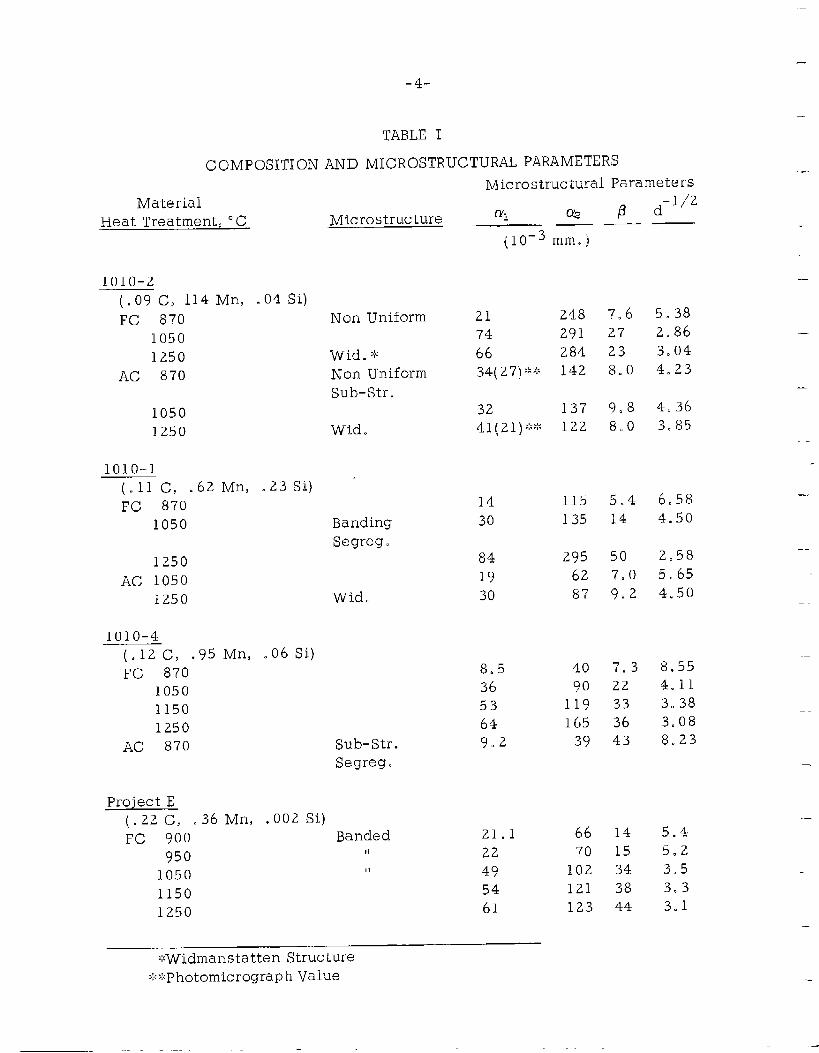
TABLE I
COMPOSITION AND MICROSTRUCTURAL PARAMETERS
MaterialHeat Treatment, 0C
1010-2(.09C, l14Mnj .04Si)FC 870
10501250
Ac 870
10501250
1010-1(.11 c, .62 Mn, .23 Si)Fc 870
1050
1250Ac 1050
1250
1010-4(.12c, .95Mn, .06Si)Fc 870
105011501250
AC 870
Microstructure
Non Uniform
Wide i<Non UniformSub-Str.
Wid .
BandingSegreg.
Wid,
Sub-Str.Segrego
Project E(.22 c, .36 Mn, .002 Si)Fc 900 Banded
950 11
1050 II
11501250
Micro structural Parameters
Bd-1 /2
al @
(10-3 mm. )
21 248 7.6 5.3874 291 27 2.86
66 284 23 3.04
34( 27) ‘:C’: 142 8.0 4.23
32 137 9.8 4.3641(21)’:”:: 122 8oo 3.85
14 115 5.4 6.5830 135 14 4.50
84 295 50 2.5819 62 7.0 5.65
30 87 9.2 4.50
8,53653649.2
40 7.3 8.5590 22 4.11
119 33 3.38165 36 3.08
39 43 8.23
21.1 66 14 5.422 70 15 5.249 102 34 3.554 121 38 3.361 123 44 3.1
;kWidmanstatten Structure~!=>kphotomicrograph Value
—
.
—
—
—,
—
.—
—
-L
.—
—
.-
.
—
.
,—
.-
,.—
-. .
.—
-—
,—
-.
—.
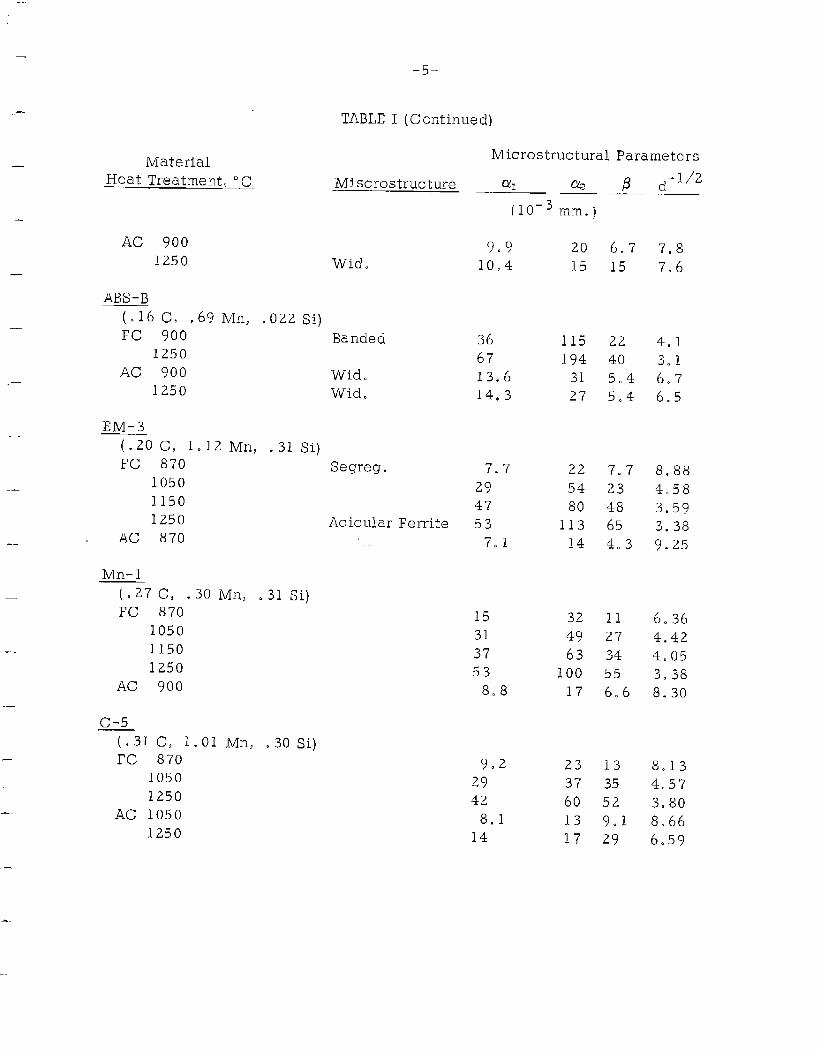
MaterialHeat Treatment, 0C
-5-
TABLE I (Continued)
Microstructural Parameters
Microstructure cil B ~“1/2@ — _(10-3 mm,)
Ac 9001250 Wid.
ABS-B(.16c, .69 Mn, .022 Si)FC 900 Banded
1250Ac 900 Wid.
1250 Wid.
9.9 20 6.7 7.810,4 15 15 7.6
36 115 22 4.167 194 40 3.113.6 31 ,5.4 6.714.3 27 5.4 6.5
EM-3(.20C, 1.12Mn, .31Si)FC 87o Segrega 7.7
1050 291150 471250 Acicular Ferrite 53
AC 870 7.1
Mn- 1(.27C, .30Mn, .31Si)FC 870 15
1050 311150 371250 53
AC 900 868
c-5(.31C, l. OIMrI, .30Si)FC 870 9.2
1050 291250 42
AC 1050 8.11250 14
22 7.7 8“8854 23 4.5880 48 3.59
113 65 3.3814 4.3 9.25
32 11 6.3649 27 4.4263 34 4.05
100 55 3.3817 6.6 8.30
23 13 8.1337 35 4.5760 52 3.8013 9.1 8,6617 29 6.59
-6-
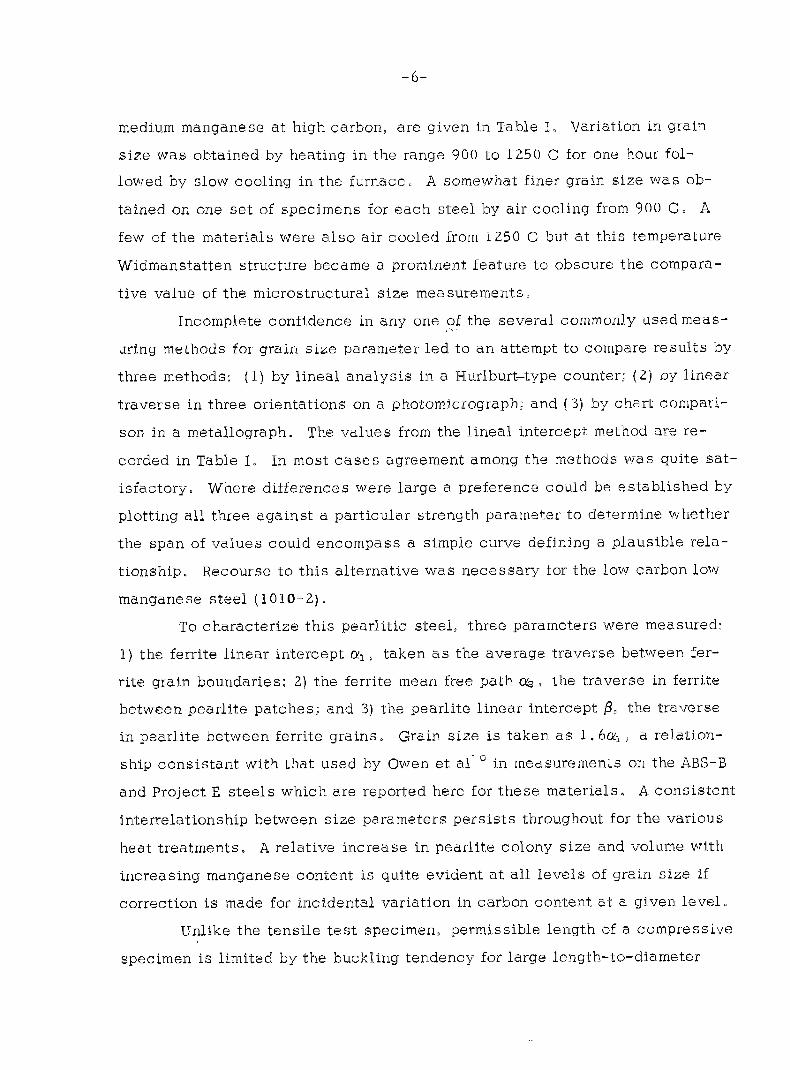
medium manganese at high carbon, are given in Table 1.. Variation in grain
size was obtained by heating in the range 900 to 1250 C for one hour fol-
lowed by slow cooling in the furnace. A somewhat finer grain size was ob-
tained on one set of specimens for each steel by air cooling from 900 C. A
few of the materials were also air cooled from 1250 C but at this temperature
Widrmnstatten structure became a prominent feature to obscure the compara-
tive value of the microstructural size measurements.
Incomplete confidence in any one ,of the several commonly used meas-
uring methods for grain size parameter led to an attempt to compare results by
three methods: (1) by lineal analysis in a Hurlburt–type counter; (2) by linear
traverse in three orientations on a photornicrograph; and ( 3) by chart compari-
son in a metallograph. The values from the lineal intercept method are re-
corded in Table 1. In most cases agreement among the methods was quite sat-
isfactory. Where differences were large a preference could be established by
plotting all three against a particular strength parameter to determine whether
the span of values could encompass a simple curve defining a plausible rela-
tionship. Recourse to this alternative was necessary for the low carbon 10TA7
manganese steel ( 1010-2).
To characterize this pearlitic steel, three parameters were measured:
1) the ferrite linear intercept al , taken as the average traverse between fer-
rite grain boundaries; 2) the ferrite mean free path %, the traverse in ferrite
between pearlite patches; and 3) the pearlite linear intercept ~, the traverse
in pearlite between ferrite grains. Grain size is taken as 1. 6al , a relation-
ship consistent with that used by Owen et all 0 in measurements on the ABS-B
and Project E steels which are reported here for these materials. A consistent
interrelationship between size parameters persists -throughout for the various
heat treatments. A relative increase in peariite colony size and volume with
increasing manganese content is quite evident at all levels of grain size if
correction is made for incidental variation in carbon content at a given level.
Unlike the tensile test specimen, permissible length of a compressive
specimen is limited by the buckling tendency for large length-to-diameter
—
.-=
,-.
—
—
—..
—.
,—
—,
.
—
.
-—
.
.—
-7-
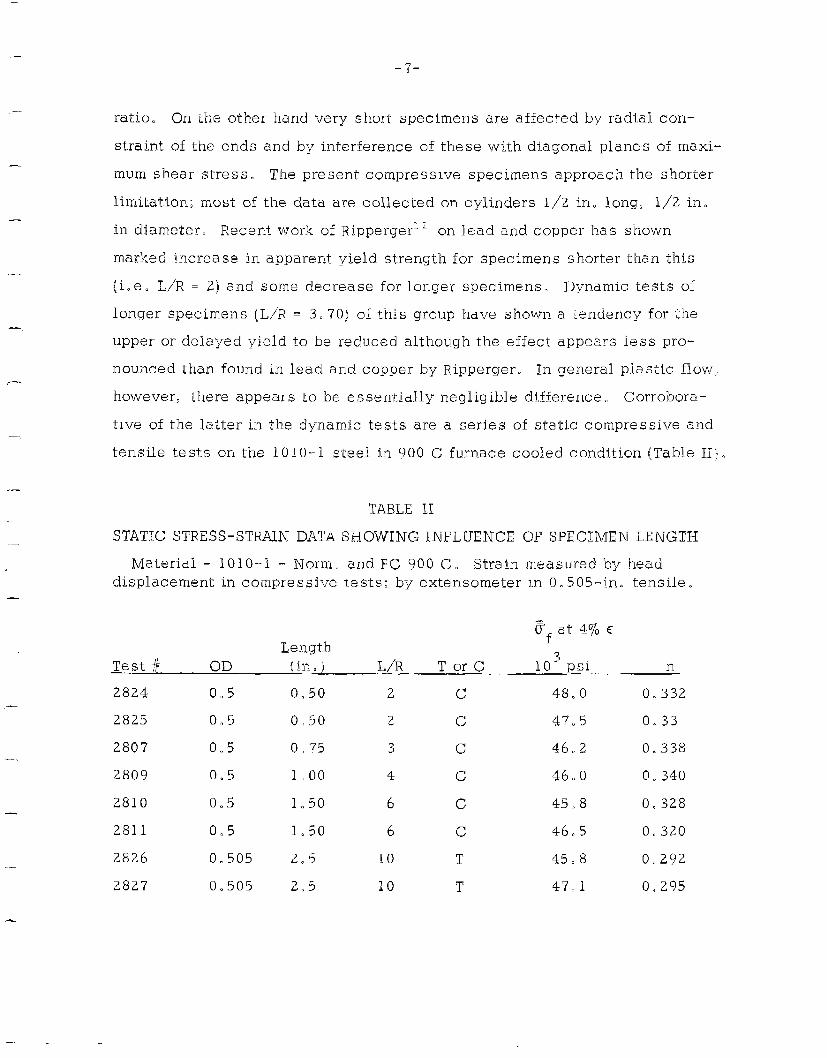
raticl“ On the other hand very short specimens are affected by radial
stra, int of the ends and by interference of these with diagonal planes
con-
of maxi-
mum shear stress. The present cornpress~ve specimens approach the shorter
limitation; most of the data are collected on cylinders 1/2 in. long, 1/2 in,,
in diameter. Recent work of Rippergerl ~ on lead and, copper has shown
marked increase i,n appare,nt yield strength for specimens shorter than this
(i,, e. L/R = 2] and some decrease for longer specimens. Dynamic tests of
longer specimens (L/’R = 3. 70j of this group have shown a tendency for the
upper or d,elayed yjeld to be reduced although the effect appears less pro-
nounced than found in lead and copper by Ripperger. In general plastj.c flow.,
however, there appears to be essentia~ly negligible difference,, Corrobora-
tive of the latter in the dynamic tests are a series of static compressive and
tensile tests on the 1010-1 steel in 900 C furnace cooled condition (,Table 11) .
TABLE H
STATIC STRESS-STIWN DATA SHOWING INFLUENCE OF SPECIMEN lXNGTH
Material - 1010-1 - Norm, and FC 900 C. Strain measured by headdisplacement in compress~ve tests; by extensometer m O,,.505 -in,,, tensile.
EL at 4qo c
Length1
Test ~ OD {in. ) L/’R Tor C 1031A n
2824
2825
2807
2809
2810
2811
2826
2827
0“5 0.50
0,>5 0,50
0<>5 0, ’75
0.5 1,,00
0.5 1.50
0.5 1..50
0.505 2.5
0.505 2.5
2
2
3
4
6
6
10
10
c
c
c
c
c
c
T
T
48.0
47>5
46<>2
46>0
45.8
46<>5
45.8
47.1
0.332
0,33
0.338
0.340
0.328
0.320
0.292
0.295
Here only slight
strain hardening
-8-
decrease in the flow stress at 470 true strain and in the
rate (exponent ~ ) are noted. That the tensile specimen
should show appreciably lower n (about 1370) is in the direction expected—
for the reduction of end constraint effects. In view of these results, com-
parative values of the yield and flow strength measurements on cornpres-
sive specimens of the same L/R ratio would seem assured. There is good
indication that absolute values of these strength parameters would not
vary markedly with larger L/R ratio.
Although bar
ing and strain rates,
TEST APPARATUS AND METHODS
impact methods provide the highest permissible load-
ordy a limited speed range is available. To increase
range at the lower speed end, a gas-pressure actuated loader was employed.
Since both machines and data reduction procedures have been analyzed in
some detail elsewhere 2 only a brief description -will be provided here.
Intermediate Speed Gas Driven Testing Machine
Illustrated in Fig. 1 is the gas driven machine as well as typical
oscillograms of load and head displacement versus time and, versus each
other. Briefly, a pressure source is provided by burning a selected charge
of rifle powder in a primed case. The case is chambered within a breech
block with its open end abutting an orifice hole. The breech block is threaded
into one end of a thick walled steel case which serves as a cylinder for the
piston and a rigid loading frame for the specimen. The piston, 1.5 in. in di-
a.meter, abuts the breech block at the start of
the gas entering from the orifice. The load is
strain gages applied longitudinally to a short,
interposed between piston and specimen. For
in Fig. 1, the specimen extends the sectional
the test and is forced away by
weighed with wire resistance
hard- steel anvil rod which is
compression tests, illustrated
form of
in. diameter circle) and is fixed at the other end by a
into the loading frame cylinder.
the wei.ghi,ng anvil ( 1/2-
base which is threaded
— —
.. .,
,.-.
—
—
-...
.—
,.-
,—
—
-.
--
-.
“ ,’1 !“
-9-
‘b(6’*&F&4c,~.$ -%. .,’
!,’
CYLINDH? STRES$ ‘GASE PISTON
STRAINANVIL
+
BEAM‘,\<<’_<”
~,,,,~ ,!
!’1, ‘,’/” $ .,,: ,,,:7?!!
,! ,j,,;~,~ {’, ~,,~,’ ~!’ \ ,,!,,, ,,, \,,,\,;, !!’!” !. ,,, ‘,’ \
tiq~r%e
,\\ ‘,’) ‘-””:= - J . .,,’>1
...——- ;:,., ______ __!, —. -..,. ,__... ,. _’
“’, ~’ ,T”‘!!, ,,, >,).~,,\\’\ \,, ,.,1 ,,, . .... .... .-” -’
~,, *+
,,
PRIMEDI G’bN ORlhCE\.‘! )),,
CASE Pt)WDER’G~/lMBER “SPECIMEN
!)”\!! !’ ‘,!
$$ <,’‘, ’,! ,,
,!’,.’ ,,”‘: ! ,,‘,,,,, ;!, !
‘!,!, ,,,!,
W!, “!
!,,
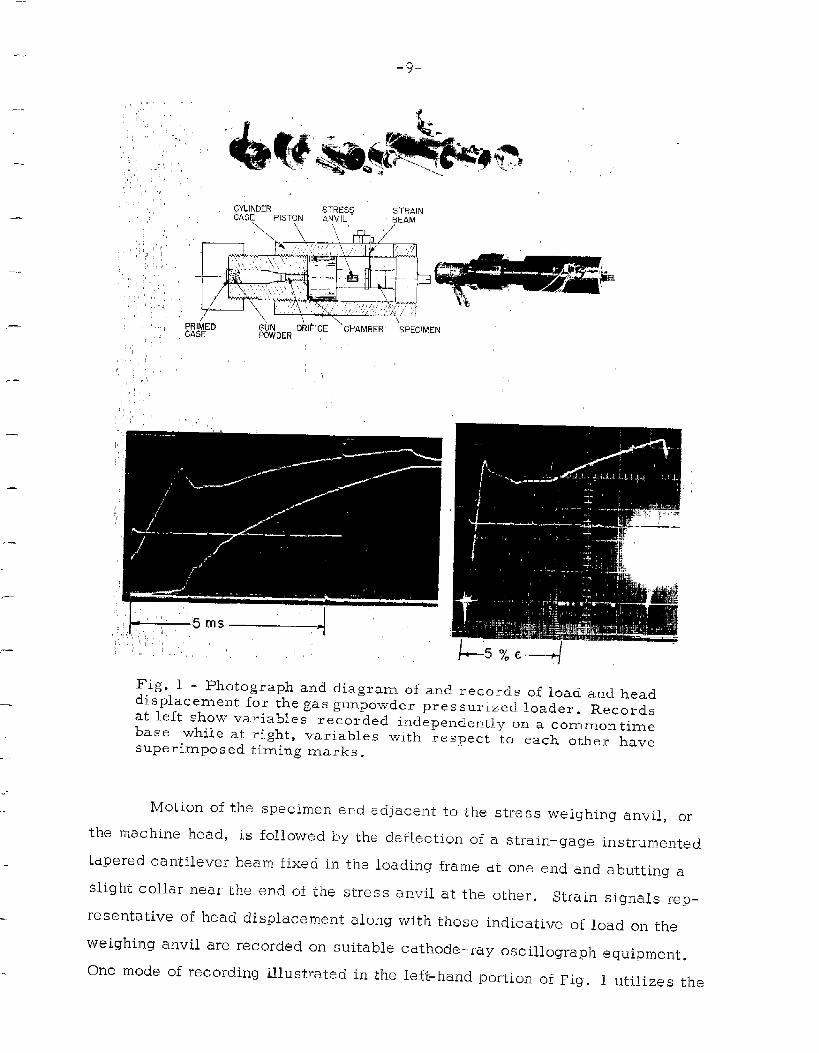
Fig. 1 - Photograph and diagram of and records of load and headdisplacement for the gas gunpowder pres surized loader. Recordsat left show variables recorded independently on a common timebase while at right, variables with respect to each other havesuperimpose ed timing marks .
Motion of the specimen end adjacent to the stress weighing anvil, or
the machine head, is followed by the deflection of a strain-gage instrumented
tapered cantilever beam fixed in the loading frame at one end and abutting a
slight collar near the end of the stress anvil at the other.Strain signals rep-
resentative of head displacement along with those indicative of load on the
weighing anvil are recorded on suitable cathode-ray oscillograph equipment.
One mode of recording illustrated in the left-hand portion of Fig. 1 utilizes the
-1o-
,,, !,”” !“,“
1,’ !’
,) !,’,— ,—. —
_“. _—~ ~ .+m A.—
——BAR+jjl#~ E],
sPEcIMEN,. .,---, “,-
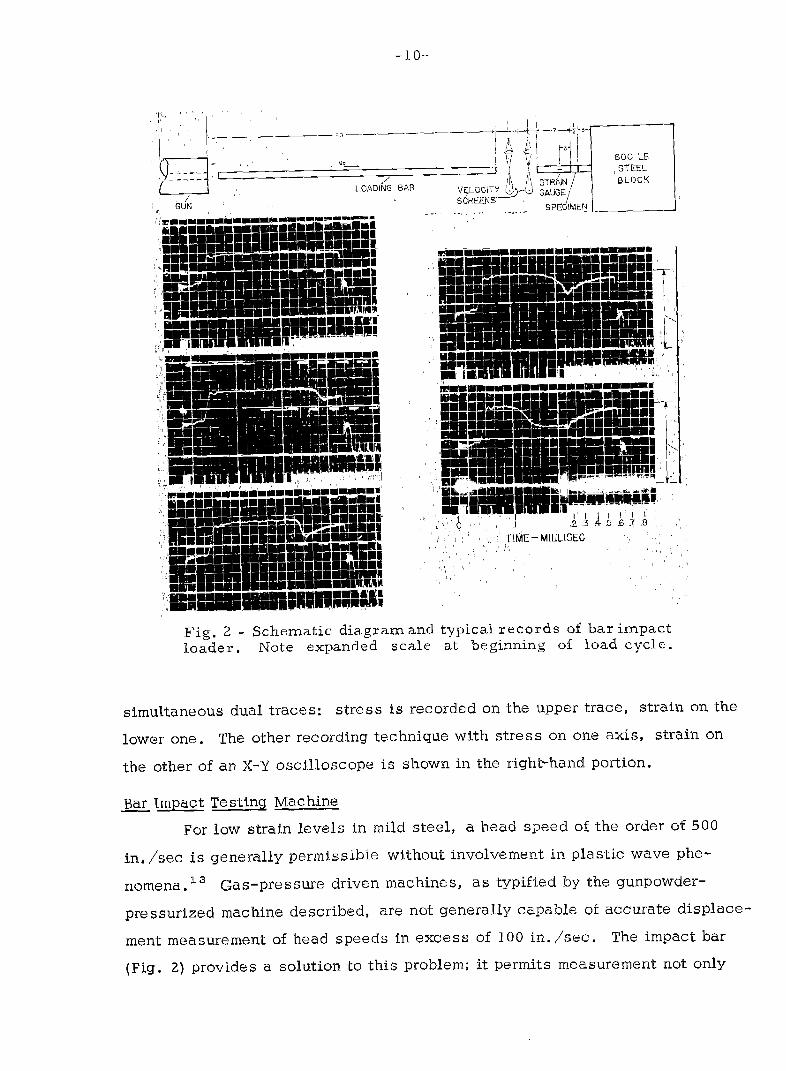
Fig. 2 - Schematic diagram and typical records of bar impactloader. Note expanded scale at beginning of load cycle.
simultaneous dual traces: stress is recorded on the upper trace, strain on the
lower one. The other recording technique with stress on one axis, strain on
the other of an X-Y oscilloscope is shown in the right-hand portion.
Bar Impact Testing Machine
For low strain levels in mild steel, a head speed of the order of 500
in. /see is generally permissible without involvement in plastic wave phe-
nomena. 13 Gas-pressure driven machines, as typified by the gunpowder–
pressurized machine described, are not generaUy capable of accurate displace-
ment measurement of head speeds in excess of 100 in. /see. The impact bar
(Fig. 2) provides a solution to this problem; it permits measurement not only
---
-. .
..-
—
,.-
,.-
—
—
—
,-
of yield delay but also of sl,ress during post-yield flow as a, function of time,
strain, a~d strain rate, Basically the bar ~mpact system is powered. by a
free, ln~tially unstressed bar of length LB = 60 in, , and is accelerated to a
constant longitudinal velocity v . If this initial velocity is reduced to zero,o
as by collision with a rigid “infinite-mass” anvil, a srrain wave of amplitude
vo/c is introduced that travels away from the impact surface with elastic bar-
wave velocity c. The pressure corresponding to the strain wave amplitude re-
mains on the impact surface until a wave of unloading returns from the opposite
end at time 2 LB/c after impact,,
To use this constant pressure, a specimen of bar diameter {~/2 in. ) is
interposed between the colliding bar and the anvil mass ~~VVhi.le the specimen
remains elastic, a loading stress predictable from the strik. ?,,ngvelocity is ap-
plied. When the specimen yields, the bar-front velocity increases from zero
to that allowed by the plastic compression of the specimen. The rate of con-
vergence between bar and anvil— or average strain rate in the specimen-is
directly proportional to the amount by which the stress predicted from the
striking velocity is reduced. This stress can be measured with wire strain
gages on an elastic bar adjacent to the specimen. A single stress-time meas-
urement thus provides a measure of both stress- and strain–rate versus time ,
With numerical integration to obtain the strain, a stress-strain relationship at
rather high strain rates is available to extend the data available with the gas-
actuated machine.
PRESENTATION OF BASIC DATA
IrI static stress-strain curves of mild steel,, although either upper or
lower yield stress can be used. as a measure of strength, the Jower is the more
reliable. The converse is true of the dynamic test. Here the lower yield is
characterized by neither constant stress nor constant strain. Moreover, it rep-
resents a combination of effects of rate sensitivities of both the upper yield
and of general plastic flow, sensitivities which are of different value and ap -
-12-
parently not simply related. 14 Consequently, dynamic yield initiation is
best characterized, by the upper yield point.
The differing loading patterns inherent in the w70 types of machines
prior to yield initiation require a basis for comparison,, In the gas loader,
a linearly increasing load (with time) is provi, ded, by a roughly constant flow
of gas through the restrictive orif~ce,, On the other hand the bar impact pro-
vides a suddenly applied constant pressure prior to yield. Comparison of
data in the form of a yield stress vs. loading rate with yield stress vs. de-
lay time is possible with the cumulative damage-type criterion suggested
in an earlier paper. 15 This involves an assumption that damage culminating
in establishment of gross yield accrues at a rate inversely proportional to
the delay time (for given stress level). With exper~ mentally determined de-
lay time, the yield point can be predicted for various high loading rates.
For the data presented here this has been done for elastic loading rates {i. e.
dO/dt/Ej! of 2 and 20/sec. These rates appropriately result in accrual of
the gross part of the “damage” at stress levels for which experimental data
are available; that is, in the delay time range 10-600 microsec. Character-
izing the yield strength elevation in terms of stress rate rather than delay
time is preferred here as representing more closely the realistic condition
of rising stress in the vicinity of an advancing crack. The stress is not in-
stantly applied to material as it is approached, by a rapi,dly a dvanci.ng crack
tip, but rises rapidly at a roughly uniform rate.
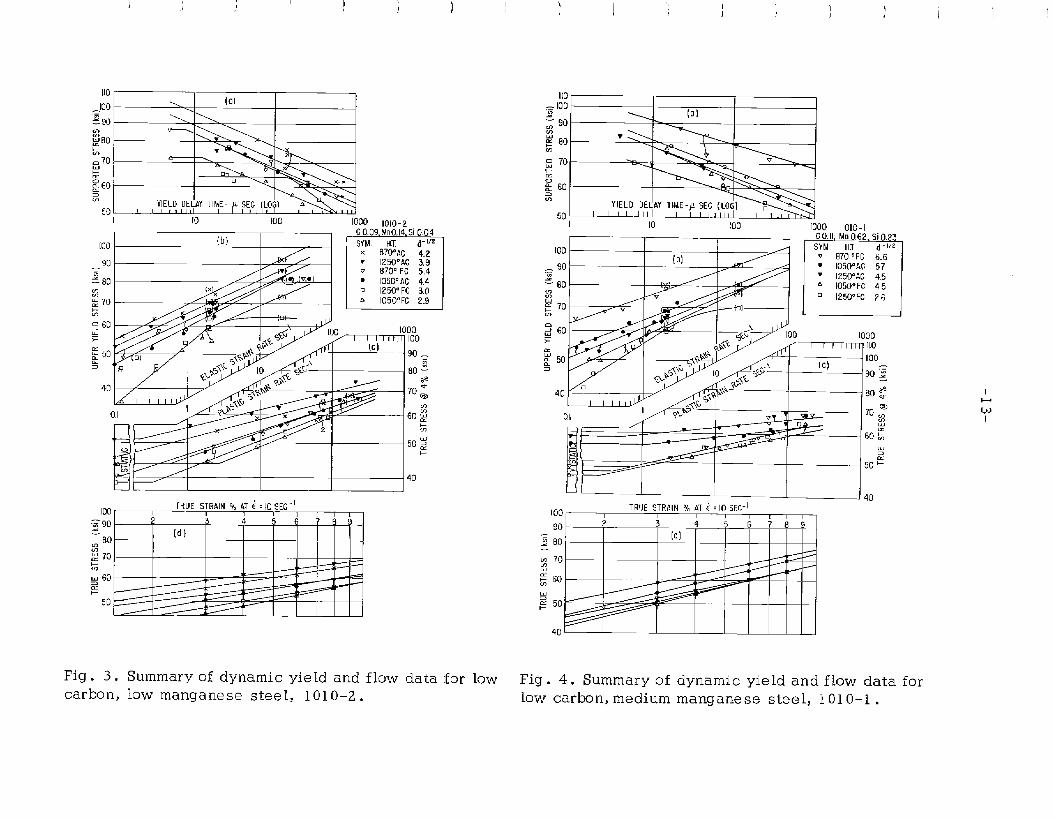
The two measures of yield initiation rate sensitivity are presented
for each steel composition in separate graphs. The delay time for constant
stress applied with the pressure bar is designated (a) in F~gs,, 3—1 O. The
yield stress as a function of elastic strain rate prior to yield is designated
(b); these curves are extended by the yield strength values predicted from
the delay time data (i,, e. curve (a) at elastic loading rates of 2 and 20/see).
All grain sizes resulting from the various heat treatments are represented on
a single plot for a given composition,,
Plastic flow properties are characterized in two ways. Data from the
—.
) ,,
1[0
_loo \ (aj.-=90 \. \,- — ‘..
+a&A2&s[0 100 1000 1010-2
-----/----
/ ---- ., /=’ 50:
/+
/
I J
I(I3 -TRUE STRAIN O/. AT i :10 sEG-l
1 1 1 1 1 1~ 90 2 3 4 5 6 709
~ 00[d)
g 70zm 60? .d
Fig. 3. Summary of dynamic yie Id and flow data for lowcarbon, low manganese steel, iOl 0-2.
==i
v
*I ‘-’-%YIELD OE/AY TIME-u SEC (LOGI.———,-50 I I I I I I 1111 Ii I I 11111 I 1 1 r
\
&_
Fig . 4. Summary of dynamic yie Id and flow data forlow carbon, medium manganese steel, 1010-1.
I I100 [0)%90 x I
1
I
I I I
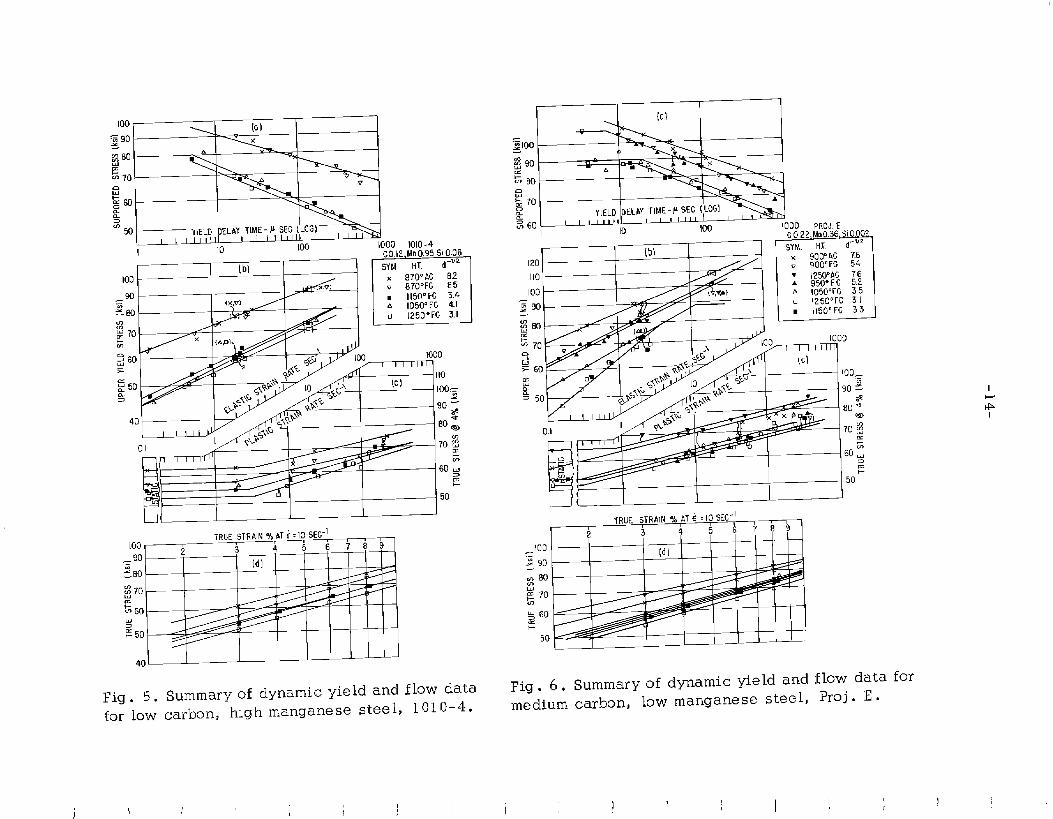
Fig. 5. Summary of dynamic yie Id and flow dataFig. 6. Summary of dynamic yield and flow data for
for Low carbon, high manganese steel, 1010-4.medium carbon, low manganese steel, proj . E .
1\
) II ,1 I
_[oo L (0!
.-290 vfi ~. xm Dz
70zz~ 60~ 1
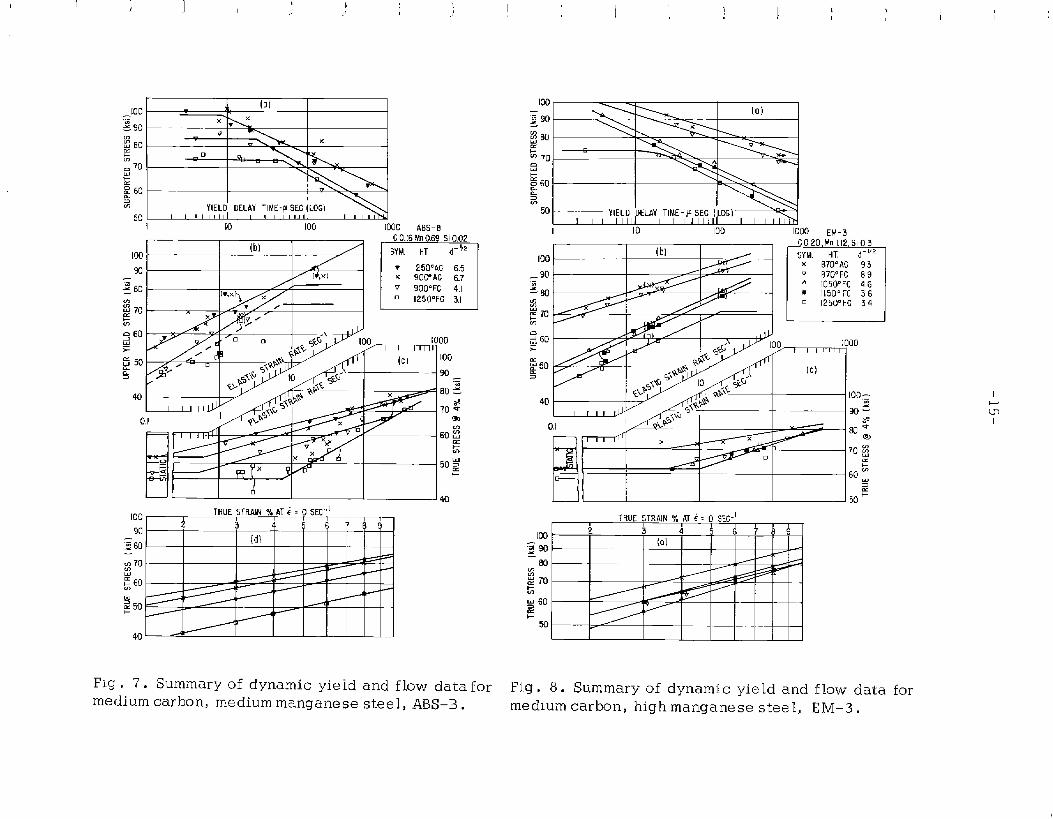
YIELO DELAY TIME-F SEC (LOG)50 1 1 1 1 1Ill 1 ! 1 1 1 1111 1 1 1 111
10 100 [000 ABS-BC 0.16 Mm0.69 Si 0.02
100(b)
/
“ m
5YM. HT ~- !2
93 T 1250aAC 6.5[+x) x 90ffAG 6.7.-
: 80 v[r,x]
900”FG 4.1U) u 1250”FG 3,1~ 70z~ 60~*~ 50% .—
40
0,1
E
I--II h 140100 TRUE STRAW % AT; =10 SEC-l
I
90~ 3 4 $ 6 7 ?
EM(d}
I I I I I I
1 “, !
TRUE STRAIN % AT i = IO SEC-l, 1 I 1
to2 3 6 789
(d] 4 5~w
80zg 70z <
g 60a+
50
Ii’
Fig . 7. Summary of dynamic yield and flow data for Fig. 8. Summary of dynamic yield and flow data formedium carbon, medium manganese steel, ABS–B. medium carbon, high manganese steel, EM-3.
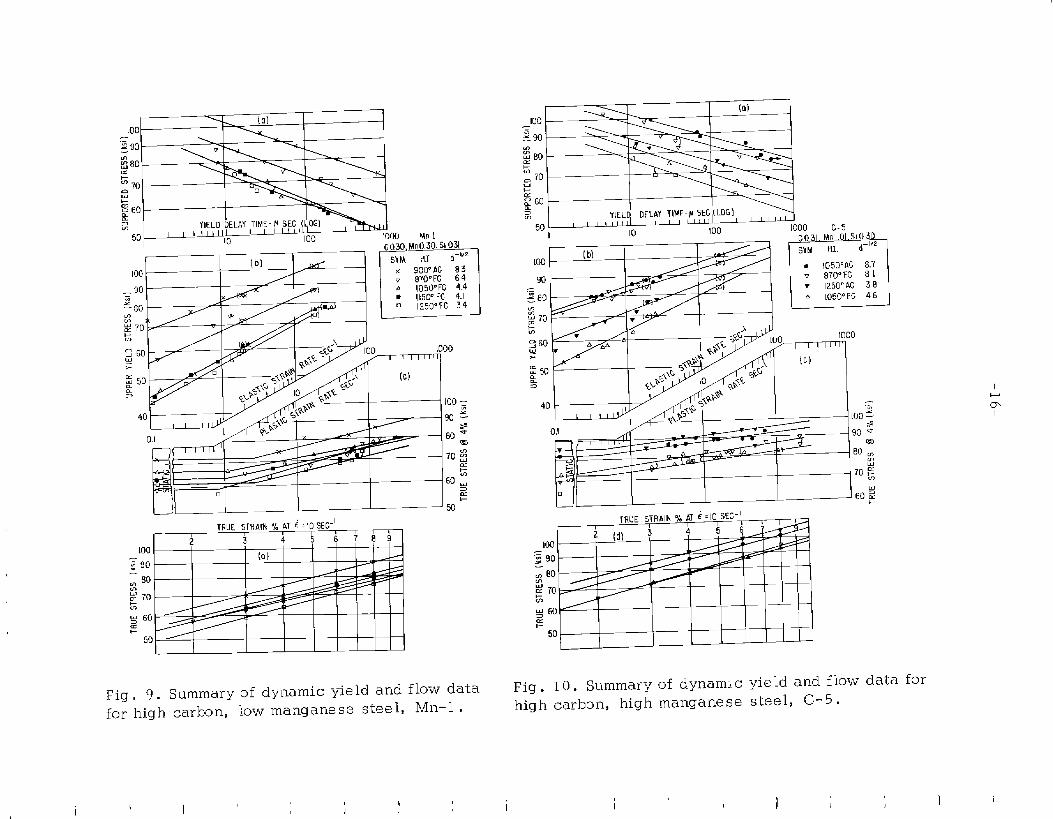
Fig . 9. Summary of dynamic yield and flow datafor high carkmn, low manganese steel, Mn-1 .
Fig . 10. Summary of dynamic yield and flow data forhigh carbon, high manganese steel, C-5 .
\ I I
...
—
-.
.
.
. . .
—.
..
.---
-.
—.
-.
-.
—
-17-
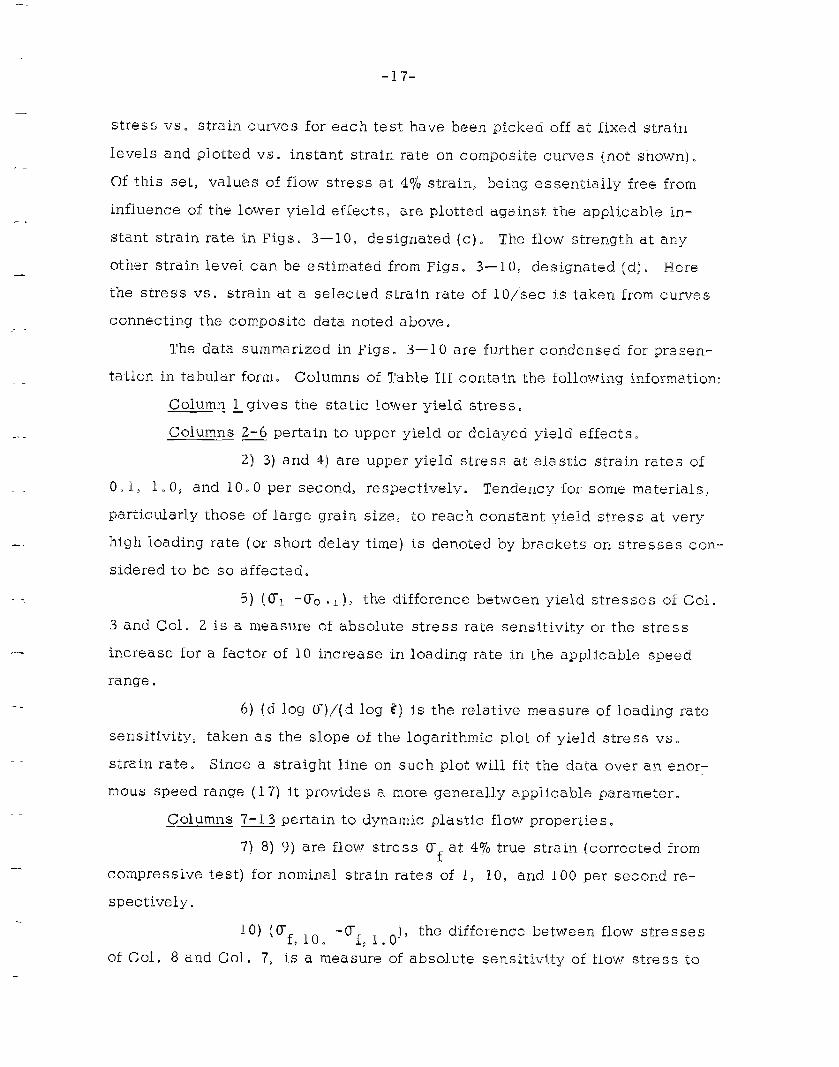
stress vs. strain curves for each test have been picked off at fixed strain
levels and plotted vs. instant strain rate on composite curves (not shown) .
Of this set, values of flow stress at 4L70strain, being essentially free from
influence of the lower yield effects, are plotted against the applicable in-
stant strain rate in Figs. 3–10, designated {c). The flow strength. at any
other strain level can be estimated from Figs. 3—1 0, designated
the stress vs. strain at a selected strain rate of 10\’sec is taken
connecting the composite data noted above,
(d),, Here
from curves
The data summarized in Figs. 3—1 O are further condensed for presen-
tation in tabular form. Columns of Table III contain the following information:
Column ~ gives the static lower yield stress.
Columns 2-6 pertain to upper yield or delayed yield effects.
2) 3) and 4) are upper yield stress at elastic strain rates of
0.1, 1.0, and 10.0 per second, respectively. Tendency for some materials,
particularly those of large grain size, to reach constant yield stress at very
high loading rate (or short delay time) is denoted by brackets
sidered to be so affected.
5) ( UI -00. ~), the difference between yield
on stresses con-
stresses of Cola
3 and col. 2 is a measure of absolute
increase for a factor of 10 increase in
range.
6) (d log ~)/(d log i)
stress rate sensitivity or th,e stress
loading rate in the applicable speed
is the relative measure of loading rate
sensitivity, taken as the slope of the logarithmic plot of yield stress vs.
strain rate. Since a straight line on such plot will fit the data over an enor-
mous speed range ( 17) it provides a more generaUy applicable parameter.
Columns 7-13 pertain to dynamic plastic flow properties.
7) 8) 9) are flow stress of at 47o true strain (corrected from
compressive test) for nominal strain rates of 1, 10, and 100 per second re-
spectively.
of Col. 8 and
10) (mf lo -Uf ~ o), the difference between flow stresses. .
CO1. 7, ii a rneas~re of absolute sensitivity of flow stress to
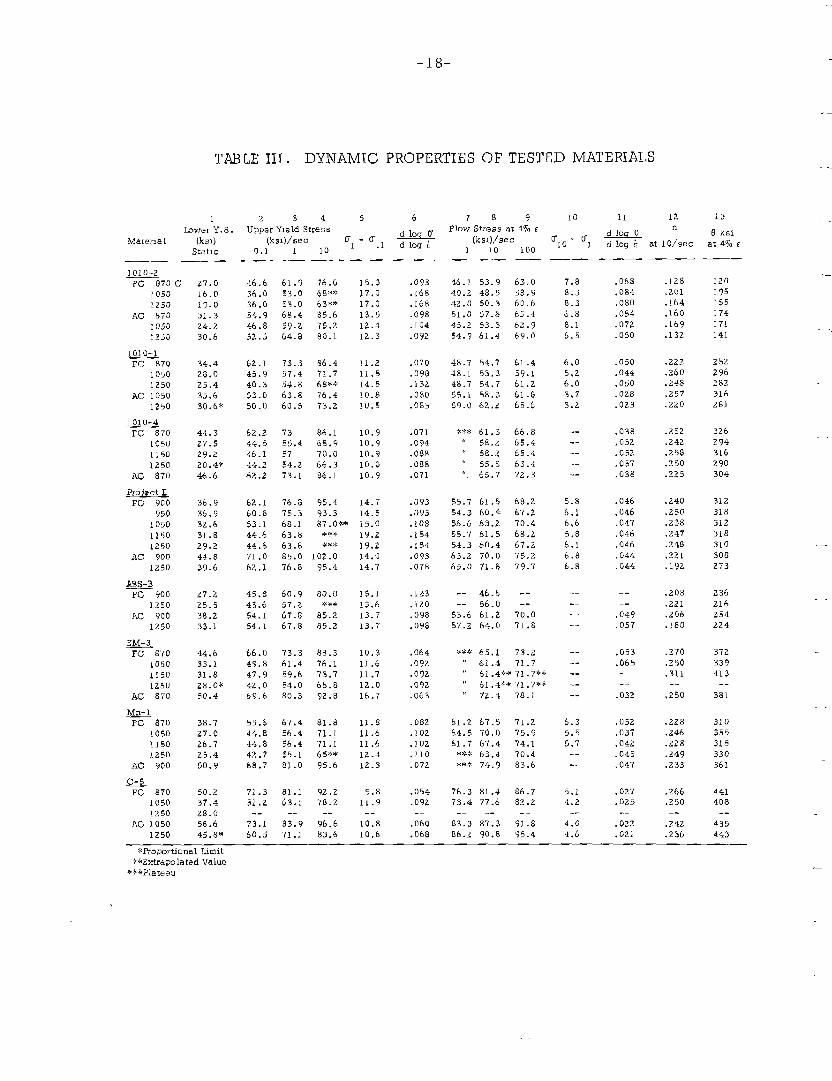
-18-
TABLE III. DYNAMIC PROPERTIES OF TESTED MATERIALS
1 2 3 4 5 6Iawer Y.s. Upper Yle~d Stress
MaTer~al (!CS1) (ksl)/sec o- -ud loq 0’
Static 0.1 1d log :
10 1.1
.— — .—1010-2
FC 870 C 27.0
1050
1250
AC 870
1050
1250
1010-1FC 870
1050
1250
AC 1050
1250
1010-4
Fc 870
1050
1150
1250
AC 870
Pro je ct E
FC 900
950
1050
1150
1250
Ac 900
1250
&3J-J
FC 900
1250
AC 900
1250
~
PC 870
io50
1150
1Z50
AC 870
~
FC 870
1050
1150
1250
AC 900
~
FC 870
1050
1250
AC 1050
1250
16.019.0
31.3
z4.2
30.6
34.4
28.0
25.4
35.6
30.6+
44.3
27.5
29. Z
20.4*
46.6
36.9
36.9
3z.6
31.8
Z9. Z
44.8
39.6
z7.2
25.5
38.2
33.1
44.6
33.1
31.8
28.0*
50.4
38.7
Z7. O
26.7
25.4
50.9
50.2
37.4
z8. O
58.6
45.8*
46.6 61.9 76.636.0 53.0 6 8>)>,<
36.0 53.0 63W
54.9 68.4 85.6
46..S 59.2 75. Z
52.5 64.8 80.1
62.1 73.3 %6.4
45.9 57.4 71.7
40.3 54.8 68**
53.0 63.8 76.4
50.0 60.5 73.2
62.2 73 86.1
44.5 55.4 68.9
46.1 57 70.0
44.2 54. Z 66.3
62.2 73.1 86.1
62.1 76.8 95,4
60.8 75.3 93.3
53.1 68.1 87.0+*
44.6 63.8 *,?*
44.6 63.8 >%*,>
71.0 85,0 102.0
6z.1 76.8 95.4
45.8 60.9 80.0
43.6 57.2 ***
54.1 67.8 85.2
54.1 67.8 85.2
66.0 73.3 88.3
49.8 61.4 76.1
47.9 59.6 73.7
4Z. O 54,0 66.8
69.6 80.3 qz. B
55.6 67.4 81.8
44.8 56.4 71.1
44.8 56.4 71.1
42.7 55.1 65**
68.7 81.0 95.6
71.3 81.1 92,2
51.2 63.1 78. Z-- -- —-
73.1 83.9 96.6
60.5 71.1 83.6
15.3
17.0
17.0
13.5
12.4
12.3
11. z
11.5
14.5
10.8
10.5
10.9
10.9
10.9
10.0
10.9
14.7
14.5
15.0
19.2
19.2
14.0
14.7
15.1
13.613.7
i3.7
10.3
11.6
11.7
12.0
16.7
11.8
11.6
11.6
lz.4
12.3
9.8
11.9
10.8
10.6
.093
.168
.168
.098
.104
.09Z
.070
.098
.132
.080
.083
.071
.094
.088
.088
.071
.093
.093
.108
.154
.194
.093
.078
.123
.120
.098
.098
.064
.092
.092
.092
.063
.082
.1OZ
.102
.110
.072
.054
.092-—
.060
.068
78 9
Flow Stress at 4% c
(ksl)/sec
1 10 100.— —
46.1 53.9 63.0‘40. z 48.5 58.9
4Z. O 50.3 60.6
51.0 57.8 65.4
45. Z 53.3 6z,7
54.9 61.4 69.0
48.7 54.7 61.4
48.1 53.3 59.1
48.7 54.7 61.2
55.1 58.3 61.8
59.0 62.2 65.6
~K>:t* 61.3 66.8,, 58.2 65.4,, 58.2 65.4,1 55.5 63.4,, 65.7 7Z.3
55.7 61,5 68.2
54.3 60.4 67.2
56.6 63.2 70.4
55.7 61.5 68.2
54.3 60.4 67. z
63. z 70.0 75,2
65.0 71.8 79.7
-- 46.6 --.— 56.0 --
53.6 61.2 70.0
57. z 64.0 71.8
e*i< 65.1 73. Z,, 61.4 ?1.7“ 61,4<w 7~.7%*
“ 61.4,t* 71.7**,, 72.4 78.1
61.2 67.5 71. Z
64.5 70.0 75.9
61.7 67.4 74.1
%,%* 63,4 70.4**>% 74.9 83.6
76.3 81.4 86.7
73.4 77.6 82.2-— -- --
83.3 87.3 91.8
86. z 90.8 95.4
10 11 12
d loq Un
o.-m
10 1 d log : at 10/sec
—.
7,88.38.36.88.16.5
6.05.Z6.03.73.2
---—-—--.-
5,86.16,65.86.16.86.8
-—-—---.
-—--------
6.35,55.7
----
5,14.Z
--
4.04.6
.068
.084
.080
.054
.072
.050
.050
.044
.050
. Ozs
.0Z3
.038
,05Z
.052
.057
.038
.046
.046
.047
.046
.046
.044
.044
--
--
.049
.057
.053
.065-—
--
.032
.05Z
.037
.042
.045
.047
.027
.025
.—
.0Z2
.021
.128
.Zol
.164
,160
.169
.132
.Z22
.260
.248
.257
.220
.Z5Z
.Z4Z
.258
.250
.Z25
.240
.250
.238
.247
.z48
,z21
.192
.208
.Z21
.z06
.180
.270
.250
.311--
,250
.Z28
.Z46
.z28
.Z49
.233
.Z66
.250
.242
.z36
13
B ksi
at 4% c
120
195
155
174
171
141
252
296
Z8Z
316
Z81
326
294
316
Z90
304
31Z
318
312
31s
310
308
Z73
Z 36
216
254
2Z4
372
339
413-—
381
310
355
315
330
361
441
408--
435
443
-—
—
—
-.
.
-19-
a factor of 10 change in strain rate in the applicable speed range.
1 1) (d log Df),;’(d log t) is the relative measure of flow
stress-strain rate sensitivity.
12) n is the strain hardening exponent or slope of the
logarithmic plot of true stress vs. true strain (adiabatic) . Assuming
constant n (for strains less than 10%) the stress-strain curve can be rep-
resented by ~ = K8n, where ~ is true stress, K is a constant and ~ is the
true strain.
13) @ is the tangent modulus or slope of the nominal com-
pressive stre ss–strain curve at 47’0 strain. It can be related to n through
the expression
6=~(n/fi -1).
The strain hardening exponent n, listed in Table 111 for each log
O-1og E curve (d), permits reconstruction of the stress vs. strain rela-
tionship at a 10/see strain rate . Stress- strain curves at other strain rates
may be reconstructed by displacing this curve in graph (d) by a constant
stress increment equal to that occurring at the de sired strain rate and the
10/see strain rate shown in graph (c) . A characteristic of constant 6 or
tangent moclulus is found in many body–centered cubic metals~G su,ch as
the mild steel employed when temperature rather than strain rate is varied.
Thus it is not surprising that this constant @ situation is found
ize the stress-strain curves resulting from varied strain rate.
DISCUSSION
to character-
An important feature of the dynamic behavior of mild steel is the
enormous elevation of the upper yield point. Compared to the plastic flow
elevation, not only is the rate sensitivity nearly dou,ble, but the threshold
speed for the appearance of this sensitivity is lower. Since concepts of
fracture mechanics also suggest dominance of the yield elevation effect,
correlations with fracture behavior might well be attempted with parameters
-.
-20-
100, 0.1CARBON SERIES 0.2 CARBON SERIES 0.3 CARBON SERIES1~~ ) 1
80YLJ(n
O 60_
1010-2CO.09% ( ]:volues
Mn O 14%from phdom(crcqraph ~~
/Si 0.04% / 0’
—
~ //
#-H /wl/,w
v
1,0/ sEC X4x)
//●
o,IISEC
1> I I I 1 I
_ 1010-1c 0.11%
— MnO.62%
:’io’zY’”
~L ,~, ,
// A
0
ABS-BC O 16%Mn 0.69%Si 0,02%
/
: /:.;’
>’ ‘://
/ -1-1 I I I I I I I
I II I
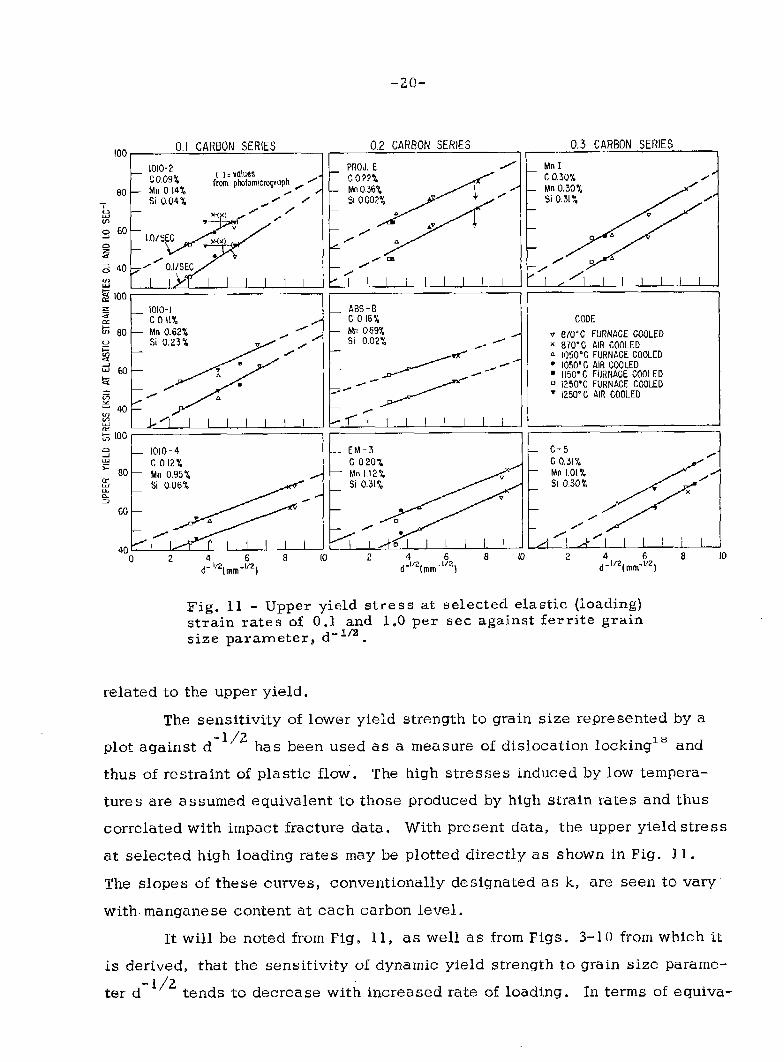
related to
I?ig. 11 - Upper yield stress at selected elastic (loading)strain rates of O.:l~znd 1.0 per sec against ferrite grainsize parameter$ d .
the upper yield.
The sensitivity of lower yield strength to grain size represented by a- 1/2
plot against d has been used as a measure of dislocation lockingl E and
thus of restraint of plastic flow. The high stresses induced by low tempera-
tures are assumed equivalent to those produced by high strain rates and thus
correlated with impact fracture data. With present data, the upper yield stress
at selected high loading rates may be plotted directly as shown in Fig. 11.
The slopes of these curves, conventionally designated as k, are seen to vary
with. manganese content at each carbon level.
It will be noted from Fig. 11, as well as from Figs.
is derived, that the sensitivity of dynamic yield strength to
ter d-’/2 tends to decrease with increased rate of loading.
3-10 from which it
grain size parame-
In terms of equiva-
-21-
. .
...—
-.
g 100, I I I I I I I I Iw + +
80&
+ x n70 x x ~ —
60— ~. ~ +“ = ~ ~ — —AA (v— ~ 80
7 Wv
50 +■
400.I “IOG 0.2%C 0.3“IOC~ 1010-2 A E x Mn-1
30 v 1010-1 ● ABS-B
A 1010-1 ❑ EM-3 -1-G-5
20300 200 100 80 60 50 40 30 20 10
FREE PATH IN FERRITE-~2 (10’3mml
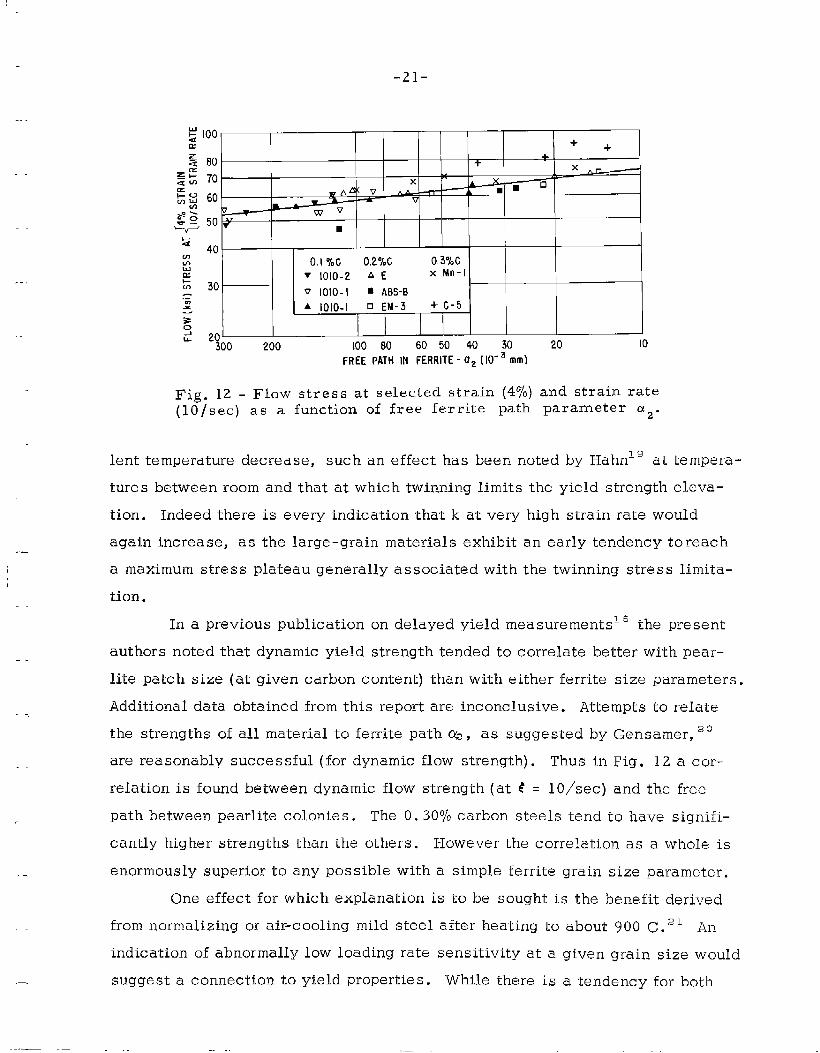
Fig. 12 - Flow stress at selected strain (4yo) and strain rate(10/see) as a function of free ferrite path parameter az.
an early tendency toreach
the twinning stress limita -
lent temperature decrease, such an effect has been noted by Hahnig at tempera-
tures between room and that at which twinning limits the yield strength eleva-
tion. Indeed there is every indication that k at very high strain rate would
again increase, as the large-grain materials exhibit
a maximum stress plateau generally associated with
tion.
In a previous publication on delayed yield measurements G the present
authors noted that dynamic yield strength tended to correlate better with pear–
lite patch size (at given carbon content) than with either ferrite size parameters.
Additional data obtained from this report are inconclusive. Attempts to relate
the strengths of all material to ferrite path % , as suggested by Gensamer, 20
are reasonably successful (for dynamic flow strength). Thus in Fig. 12 a cor-
relation is found between dynamic flow strength (at t = 10/see) and the free
path between pearlite colonies. The O. 30!70 carbon steels tend to have signifi-
cantly higher strengths than the others. However the correlation as a whole is
enormously superior to any possible with a simple ferrite grain size parameter.
One effect for which explanation is to be sought is the benefit derived
from normalizing or air-cooling mild steel after heating to about 900 C.21 An
indication of abnormally low loading rate sensitivity at a given grain size would
suggest a connection to yield properties. While there is a tendency for both
.—” —.. -. . .—.
-22-
900 c and 1250 C air-cooled steel to exhibit a slightly lower ratio of
dynamic to static yield stre SS, no definite correlation has been e stab-
lished. An effect of fracture toughness rather than yield strength sen-
sitivity variation with normalization is suggested.
CORRELATION WITH FRACTURE PERFORMANCE
Charpy notch bar impact tests have demonstrated satisfactory
correlation with service performance in mild ship plate if comparison is
made at a low energy level, Although a sharper notch would be preferred,
the test at low energy levels provides conditions riot impossible of a frac-
ture mechanics evaluation. Thus attempts to correlate present results
with available Charpy data provide a reasonable basis for comparison.
Accepting a 15 ft-lb Charpy energy as sufficiently brittle, the work of
Rinebolt and Harris22 provides an empirical basis for rating effects of com-
positional variables. On a series of steels similar to these, addition of
one per cent by weight carbon was found to increase the 15 ft-lb transition
temperature by 500 F;::< silicon by 125 F; and manganese to decrease by
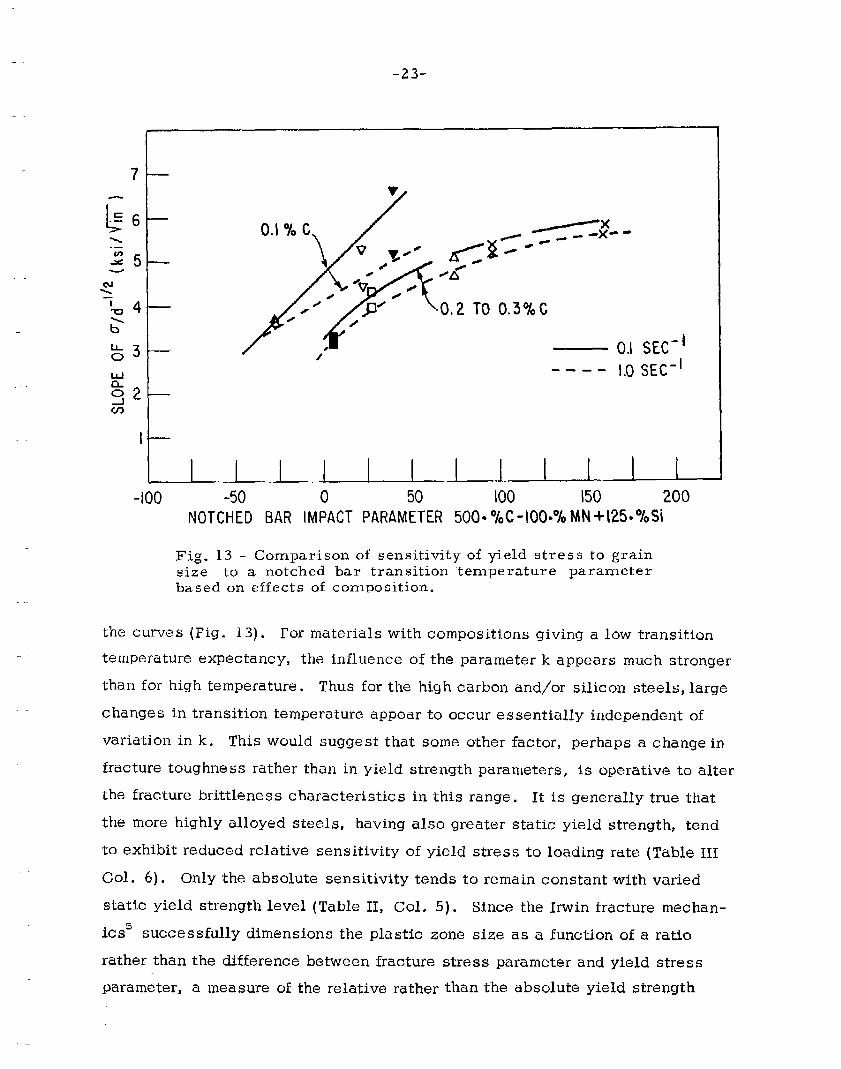
100 F. The sensitivity of upper yield stress to grain size or k appears to
bear a correlation with shift in the transition temperature predicted from
this rule as shown in Fig. 13. At an elastic strain rate of O. 10/see a single
curve can be fitted through all points of the medium (O. 20~0) and high (O. 307’0)
carbon steels; another curve connects the low (O. 10Yo) carbon steels. These
two curves can be brought closer together by selecting a higher level of load-
ing rate for comparison, shown by way of example here for elastic loading
strain rate 1. O/see.
Success in associating a measure of grain size sensitivity with frac-
ture performance has interesting implications. Consider the general shape of
‘~:Morerecent data (unpublished) suggests a somewhat reduced sensitivityto carbon content (e.g. 200 F 17’oC). Use of such a factor would significantlyimprove the correlation between O. 10% C and higher carbon steels in Fig. 13.
—.
. .- .—-—. . ....—.. ——. . . —.
-23-
It-
~0,2 TO 0.3 °Y’OC
O.I SEC-‘---- 1.0 SEC-l
[
-1oo -50 0 50 100 150 200
NOTCHED BAR IMPACT PARAMETER 500= O/OC-lOOrO/O MN+125~0/oSi
Fig. 13 - Comparison of sensitivity of yield stress to grainsize to a notched bar transition “temperature parameterbased on effects of composition.
the curves (Fig. 13). For materials with compositions giving a low transitim
temperature expectancy, the influence of the parameter k appears much stronger
than for high temperature. Thus for the high carbon and/or silicon steels, large
changes in transition temperature appear to occur essentially independent of
variation in k. This would suggest that some other factor,
fracture toughness rather than in yield strength parameters,
the fracture brittlenesss characteristics in this range. It is
perhaps a change in
is operative to alter
generally true that
the more highly alloyed steels, having also greater static yield strength, tend
to exhibit reduced relative sensitivity of yield stress to loading rate (Table III
Col. 6). Only the absolute sensitivity tends to remain constant with varied
static yield strength level (Table II, Col. 5). Since the Irwin fracture mechan-
ics6 successfully dimensions the plastic zone size as a function of a ratio
rather than the difference between fracture stress parameter and yield stress
parameter, a measure of the relative rather than the absolute yield strength
.—
-24-
enhancement due to rapid strain rate should be applicable.
The failure to merge correlations of low carbon with medium and
high carbon levels in Fig. 13 is suggestive of cause related to the sub-
stantial differences in mode transition behavior between these cornposi.-
tion levels. LOW carbon steels exhi bit change from fd]y brittle to fd]y
ductile most abruptly with temperature rise, the higher carbon increas-
ingly more gradual. Ma.~l~nder2 has shown a sensitivity to impact “veloci-
tyrnu,ch greater for low carbon steel than for high. If this’ is so, then the
sensitivity of transition temperature to carbon additions should be a func-
tion of impact velocity. The increase in transition temperature per unit
carbon addition might thus be expected to be reduced at low carbon levels
if greater impact velocity were employed. Such a change would tend to
draw closer together the transition temperatures of O. 10 and O. 207’o carbon
steels, thus providing better correlation between the parameter k and the
transition temperature parameter.
There are general effects of varied carbon and manganese level
discernible in the data which are quali,tat~vely consistent with impact ‘
fracture behavior. In general both relative and absolute upper yield point
rate sensitivity at comparable grain size decrease with increasing manga-
nese, an effect reasonably associated, with corresponding improvement in
fracture mode transition temperature. This effect diminishes at higher
carbon levels, consistent with the leveling of the grain size parameter
(Fig. 11). Greater sensitivities are also evident in the larger grain ma-
terial, consistent with their greater brittleness.
The strain hardening exponent, n, may be taken as an indication of
the extensional strain at tensile instability. As such it should influence
the extent of plastic deformation near the free surfaces of a plate in frac-
ture. It is of interest here to note that at a given carbon level there is a
tendency for n. values to increase with increased, manganese content in
agreement with this concept,
Whiie study of plastic flow properties can provide bases for under-
.
-2!5-
standing of an important part of the fracture proce SS, Its 1imitations are
basic. A description of fracture in terms of two parameters, a fracture
toughness stress parameter, and a yield strength parameter, is essential
to our pre sent state of knowledge. This is not to preclude an eventti.al
explanation of both as consequences of a single basic process, as for ex-
ample one describable by dislocation mechanics. However, pending this
it is helpful to think of these as independent material properties. Fracture
performance can be affected by either,, A study of one can indicate only
effects of one.
Fracture ini.tiat.ion and propaqat.ion are extremely sensltlve to flaws
and t.o the size and geometry of the structure. The piastic flow test, on t“he
other hand., is rather insensitive to these variables. Thus changes in frac-
ture performance Introduced by these variables cannot be directly associated
with flow properties except as they may be used in a proper analysi, s of the
mechanics of the situation.
lf dis
CONCLUSIONS
ocat]on ockl,ng is evaluated as-1/2,
stress to grain size (d ) at sufficiently high loading rates, a correlation
the sensitivity of upper yield
is found to exist between it and the expected variations in Gharpy impact
transition temperature owing to composition variables carbon, manganese
and silicon. It might thus be inferred that additions of these elements,
through their effect on dislocation movement, influence fract we brittle tend-
encies largely through variation in the yield stress, and, not primarily throug”h
changes in fracture toughness. At higher carbon levels changes in transition
temperature are not explicable on this basis and here d,ommance of the frac-
ture toughness or possibly simply the general rise in nonrate sensitive yield
strength are suggested.
—.
-z6-
ACKNOWLEDGMENTS
The authors are particularly grateful to Dr. G. R. Irwin, Superin-
tendent of the Mechanics Division, and Mr. J. A. Kies, Ballistics Branch
Head, for their interest and cooperation, Data collection and processing
were assisted by K. Coxe and J. Stinson. The support of the Ship Struc-
ture Committee provided continued incentive
of this project from Re search Navy Funds.
1.
2.
3.
4.
5.
6.
7.
REFERENCES
Manjoine~ Mb J., “ Influence of Rate of
supplementing basic support
Strain and Temperature on
yield stre~=s Of Mild st=l~” E?um! o&APP!Q@ Mecha~ics~ VOl~ 11 ~p. A211 (1944).
MailSnder, R. , “Verhaltnis der Ergebnisse von Statischen und Dy -namischen Kerbbiegeversuchen Zueinander, “ Arch. f. Eisen, VO1. 10,—.p. 109 (1936).
Hall, W. J., Mosborg, R. J., and McDonald, V. J,, “Brittle Fr~ct~rePropagation in Wide Steel Plates,”& Welding Journal, 36:1, ResearchSupplement, 1s-8s (1957).
Ludwik, P. , Elemente der Technologischen Mechanik. Berlin: 1909.
Irwin, G. R. , Fracture Testing of High-Strength Sheet Materials UnderConditions Appropriate f~r Stress Analysis (U. S. Naval Research Labo-ratory Report 5486), July 27, 1960.orIrwin, G. R., “Plastic Zone Near a Crack and Fracture Toughness, “Proc. of the Seventh Sagamore Ordnance Materials Research Conference,.—Raquette Lake, N. Y. , August 1960.
Srawley, J. E. , “Fracture Appearance of High Strength Steels and OtherAlloys, “ Proc. of the Seventh Sagamore Ordnance Materials Research.—Conference, Raqu.ette Lake, N. Y. , August 1960.
Demer, L. J. , ~ Review o~ Observations on the Cracking Characteristics_—and Fractures of Laboratory Fatigue Specimens (WADC Tech. Note 55-527),Sept. 1955. —
.-
-.z7-
8. Skigemaid, E. A. , “Delayed Failure of High Strength Steel in LiquidEnvironments, “ Trans. ASM, to be published.
9. Ilostaker, W. , Embrittlement b~ Liquid Metals. New York CityRineh.old, Publishing Co. , I?60.
10. Owen, W. S., Whitmore, D. H., Sullivan., C. P., Averbach, B. L.,and Cohen, M. , The Relationship of MicroStructures to the CharpyImpact and Low Temperature Tensi~ Properties of Two Ship Steels
——.— —
(Ship Structure Committee Report Serial No. SSC-102). Washington:National Academy of Sciences-National Research Council, June 18,1956.
11. Ripperger, E . A. , Stress-Strain Characteristics of Materials at High— _—Strain Rates, Part V, “Dynamic Compressive Yield Stresses, “ (SandiaCorp. Contract AT(29-2)-621). Austin. Univ. of Texas, August 1960.
12. Krafft, J. M., “Critical Compari son of Moving Bar Impact with GasExpansion Machines for Dynamic Loading of Metals, “ ,“Jour. APP1.Polymer Sci. , to be published.
13,, Krafft, J. M., “Instrumentation for High-Speed Strain Measurement, “Response of Metals to High Velocity Deformation. New York Metal-——lurgical So~i.ety Conferences, Intersc~ence.
14. Krafft, J. M. , An Interpretation of Lower Yield Point Plastic F1OW in the—— — — — ——Dynamic Testin~of Mild Steel (Ship Structure Committee Report Serial—— —No. SSC-1 23). Washington.. N~tional Academy of Sciences-NationalResearch Council, June 26, 1961.
15. Vigness, I. , Krafft, J. M. , and. Smith, R. C ., “Effect of LoadingHistory upon the Yield Strength of a Plain Carbon Steel, “ Proc, Conf.on the Properties of Materials at High Rates of Strain. London. Inst.—— — .Mech. Eng. , p. 179, 19570 —
16. Beeukes, R., Jr. , “Plasticity and Fracture, “ Proc. of the Third Sagamore— —— —Ordnance Materials Research Conference. Durham, N. C. : Duke Univ. ,December 1956.
17. Krafft, J, M. and Sullivan, A. M. , “Effect of Grain Size and Carbon Con-tent on the Yield Delay-Time of Mild Steel, “ Trans. ASM, vol. 51,——p. 643 (1959).
18. Hesiop, J. and Petch, N. J., “Dislocation Locking and Fracture in a-Iron, “Phil. Msg. , vol. II (Eighth Series), p. 649 (1957).
.
—. .—
-28-
19. FIahn, G. T,, Private communication.
20. Gensamer, M. , “Strength and Ductility, “ (Campbell MemorialLecture), Trans. ASM> VO~. 36, p. 30 (1946).-
21. Frazier, R. H. , Boulger., F. W. , and Lorig, C. H, , “Influenceof Heat Treatment on the Ductile–Brittle Transition Temperatureof Semiskilled Steel Plate, “ Trans. AIME, vol. 203, p. 323(1955).
22. RineboltJ, ]. A. , and Harris, W. J. , Jr. , “Effect of Alloying Ele-ments on Notch Toughness of Pearlitic Steels, “ Trans, ASM,vol. 43, p“ 1175 (1951).
.
.-.
.-[..
COMMITTEE ON SHIP STEEL
Chairman:
Professor John ChipmanHead, Department of MetallurgyMassachusetts Institute of Technology
—
Vice Ghairman:
Members:
Professor C. S. BarrettInstitute for the Study ofUniversity of Chicago
Professor Il. K. Felbeck
Metals
Mr. M. W. LightnerVice President, Research and Technology DivisionUnited States Steel Corporation
Departmentof Mechanical EngineeringUniversityof Michigan
Mr. Paul FfieldAssistant Manager of ResearchBethlehem Steel Company
Professor Maxwell GensamerProfessor of MetallurgySchool of MinesColumbia University
Dr. J. R. Low, Jr.Metallurgy Research UnitResearch Laboratory, General Electric Company
Mr. T. S. WashburnManager, Quality Control DepartmentInland Steel Company
Mr. T. T. WatsonDirector of ResearchLukens Steel Company
—.