Embed Size (px)
Citation preview
BE-4-EC-SKIT-Ph5b1-F02-V2.2LABORATORY PLAN - CAY 2019-20
SRI KRISHNA INSTITUTE OF TECHNOLOGY
LABORATORY PLAN
Academic Year 2019-20
Program: B E – Civil Engineering
Semester : 4
Course Code: 18CVL48
Course Title: Fluid Mechanics and Hydraulics Machinery Lab
Credit / L-T-P: 2 / 0-0-3
Total Contact Hours: 42
Course Plan Author: Priyankashri K N
Academic Evaluation and Monitoring Cell
#29 HESARAGATTA MAIN ROAD, CHIMNEY HILLSCHIKKABANAVARA POST BANGALORE-560090
Phone -080-23721477/28392221WWW.skit.org , EMAIL:[email protected]
18CVL48/ A&B Copyright ©2017. cAAS. All rights reserved.Page # 1 / 26
Ref No:

BE-4-EC-SKIT-Ph5b1-F02-V2.2LABORATORY PLAN - CAY 2019-20
INSTRUCTIONS TO TEACHERS• Classroom / Lab activity shall be started after taking attendance.• Attendance shall only be signed in the classroom by students.• Three hours attendance should be given to each Lab. • Use only Blue or Black Pen to fill the attendance. • Attendance shall be updated on-line & status discussed in DUGC.• No attendance should be added to late comers. • Modification of any attendance, over writings, etc is strictly prohibited. • Updated register is to be brought to every academic review meeting as per the COE.
18CVL48/ A&B Copyright ©2017. cAAS. All rights reserved.Page # 2 / 26
BE-4-EC-SKIT-Ph5b1-F02-V2.2LABORATORY PLAN - CAY 2019-20
Table of ContentsA. LABORATORY INFORMATION.................................................................................................4
1. Laboratory Overview...........................................................................................................................................42. Laboratory Content..............................................................................................................................................43. Laboratory Material..............................................................................................................................................54. Laboratory Prerequisites:.................................................................................................................................55. Content for Placement, Profession, HE and GATE........................................................................5
B. Laboratory Instructions.................................................................................................................61. General Instructions.............................................................................................................................................62. Laboratory Specific Instructions.................................................................................................................6
C. OBE PARAMETERS...........................................................................................................................71. Laboratory Outcomes.........................................................................................................................................72. Laboratory Applications....................................................................................................................................73. Mapping And Justification...............................................................................................................................84. Articulation Matrix.................................................................................................................................................95. Curricular Gap and Experiments..............................................................................................................106. Experiments Beyond Syllabus..................................................................................................................10
D. COURSE ASSESSMENT.............................................................................................................101. Laboratory Coverage........................................................................................................................................ 102. Continuous Internal Assessment (CIA).................................................................................................11
E. EXPERIMENTS....................................................................................................................................11Experiment 01 : CALIBRATION OF COLLECTING TANK (GRAVIMETRIC METHOD)..11Experiment 02 : CALIBRATION OF PRESSURE GAUGE (DEAD WEIGHT METHOD) 12Experiment 03 :VERIFICATION OF BERNOULLI’S EQUATION.................................................13Experiment 04 :CALIBERATION OF VENTURIMETER AND ORIFICEMETER.................15Experiment 05: CALIBERATION OF ORIFICEMETER.......................................................................17Experiment 06 : DETERMINATION OF PIPE FLOW LOSSES IN CIRCULAR PIPES....18Experiment 07:FLOW THROUGH NOTCHES.......................................................................................20Experiment 08: IMPACT OF JET ON PLATES.......................................................................................23Experiment 09: Pelton Wheel turbine.......................................................................................................25
F. Content to Experiment Outcomes.....................................................................................271. TLPA Parameters................................................................................................................................................. 272. Concepts and Outcomes:.............................................................................................................................28
Note : Remove “Table of Content” before including in CP Book Each Laboratory Plan shall be printed and made into a book with cover page Blooms Level in all sections match with A.2, only if you plan to teach / learn at higher levels
18CVL48/ A&B Copyright ©2017. cAAS. All rights reserved.Page # 3 / 26
BE-4-EC-SKIT-Ph5b1-F02-V2.2LABORATORY PLAN - CAY 2019-20
A. LABORATORY INFORMATION
1. Laboratory Overview
Degree: B.Tech Program: CVYear / Semester : 2/4 Academic Year: 2019-20
Course Title: Fluid mechanics and Hydraulics Machinerylab
Course Code: 18CVL48
Credit / L-T-P: 2 / 0-0-3 SEE Duration: 180 MinutesTotal Contact Hours: 42 Hrs SEE Marks: 100 MarksCIA Marks: 40 Marks Assignment 5/1 Experiment
Lab. Plan Author Priyankashri K N Sign Dt : 03/08/18
Checked By: Shivaprasad D G Sign Dt :
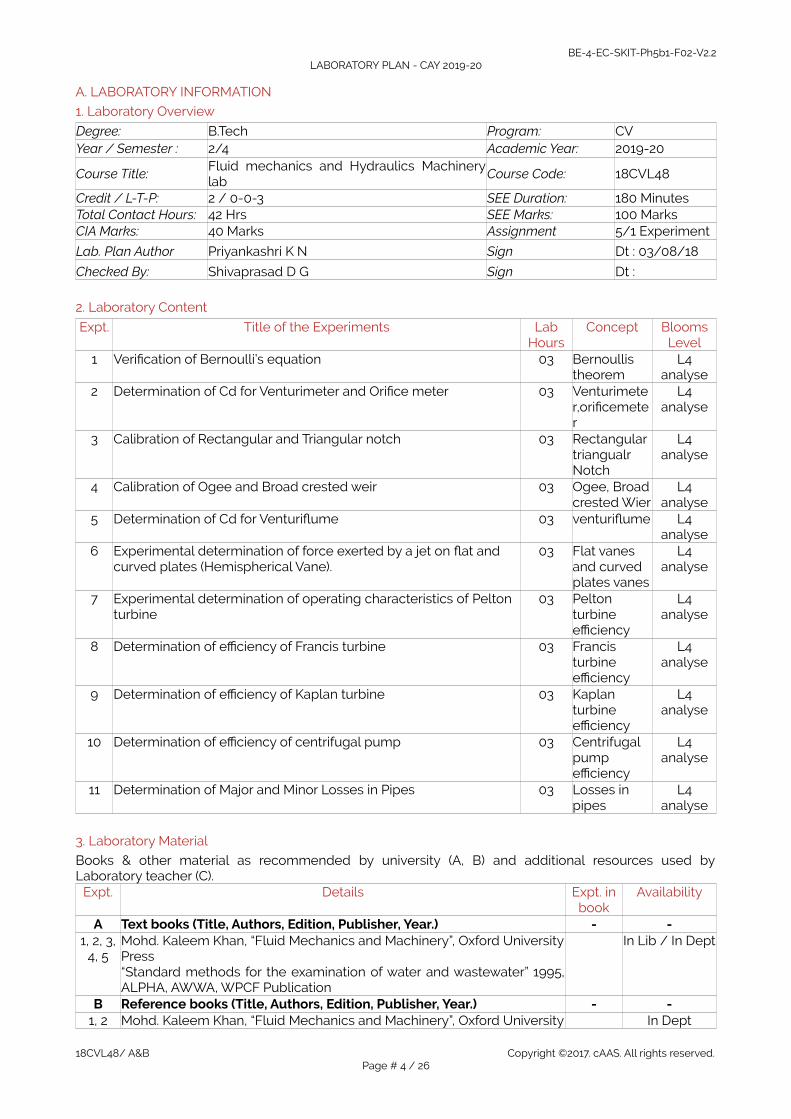
2. Laboratory Content
Expt. Title of the Experiments LabHours
Concept BloomsLevel
1 Verification of Bernoulli’s equation 03 Bernoullis theorem
L4analyse
2 Determination of Cd for Venturimeter and Orifice meter 03 Venturimeter,orificemeter
L4analyse
3 Calibration of Rectangular and Triangular notch 03 Rectangular triangualr Notch
L4analyse
4 Calibration of Ogee and Broad crested weir 03 Ogee, Broadcrested Wier
L4analyse
5 Determination of Cd for Venturiflume 03 venturiflume L4analyse
6 Experimental determination of force exerted by a jet on flat and curved plates (Hemispherical Vane).
03 Flat vanes and curved plates vanes
L4analyse
7 Experimental determination of operating characteristics of Pelton turbine
03 Pelton turbine efficiency
L4analyse
8 Determination of efficiency of Francis turbine 03 Francis turbine efficiency
L4analyse
9 Determination of efficiency of Kaplan turbine 03 Kaplan turbine efficiency
L4analyse
10 Determination of efficiency of centrifugal pump 03 Centrifugal pump efficiency
L4analyse
11 Determination of Major and Minor Losses in Pipes 03 Losses in pipes
L4analyse
3. Laboratory Material
Books & other material as recommended by university (A, B) and additional resources used byLaboratory teacher (C).
Expt. Details Expt. inbook
Availability
A Text books (Title, Authors, Edition, Publisher, Year.) - -1, 2, 3,
4, 5Mohd. Kaleem Khan, “Fluid Mechanics and Machinery”, Oxford UniversityPress “Standard methods for the examination of water and wastewater” 1995,ALPHA, AWWA, WPCF Publication
In Lib / In Dept
B Reference books (Title, Authors, Edition, Publisher, Year.) - -1, 2 Mohd. Kaleem Khan, “Fluid Mechanics and Machinery”, Oxford University In Dept
18CVL48/ A&B Copyright ©2017. cAAS. All rights reserved.Page # 4 / 26
BE-4-EC-SKIT-Ph5b1-F02-V2.2LABORATORY PLAN - CAY 2019-20
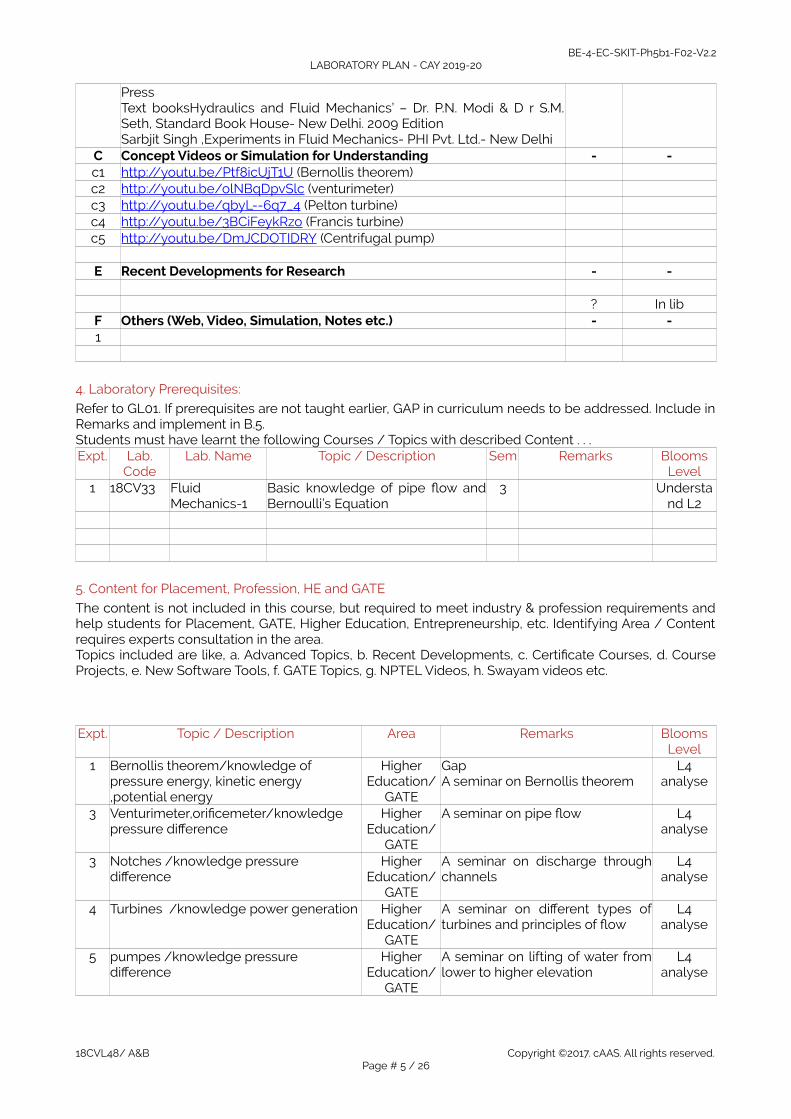
Press Text booksHydraulics and Fluid Mechanics’ – Dr. P.N. Modi & D r S.M.Seth, Standard Book House- New Delhi. 2009 Edition Sarbjit Singh ,Experiments in Fluid Mechanics- PHI Pvt. Ltd.- New Delhi
C Concept Videos or Simulation for Understanding - -c1 http://youtu.be/Ptf8icUjT1U (Bernollis theorem)c2 http://youtu.be/olNBqDpvSlc (venturimeter)c3 http://youtu.be/qbyL--6q7_4 (Pelton turbine)c4 http://youtu.be/3BCiFeykRzo (Francis turbine)c5 http://youtu.be/DmJCDOTIDRY (Centrifugal pump)
E Recent Developments for Research - -
? In libF Others (Web, Video, Simulation, Notes etc.) - -1
4. Laboratory Prerequisites:
Refer to GL01. If prerequisites are not taught earlier, GAP in curriculum needs to be addressed. Include inRemarks and implement in B.5. Students must have learnt the following Courses / Topics with described Content . . . Expt. Lab.
CodeLab. Name Topic / Description Sem Remarks Blooms
Level1 18CV33 Fluid
Mechanics-1Basic knowledge of pipe flow andBernoulli’s Equation
3 Understand L2
5. Content for Placement, Profession, HE and GATE
The content is not included in this course, but required to meet industry & profession requirements andhelp students for Placement, GATE, Higher Education, Entrepreneurship, etc. Identifying Area / Contentrequires experts consultation in the area.Topics included are like, a. Advanced Topics, b. Recent Developments, c. Certificate Courses, d. CourseProjects, e. New Software Tools, f. GATE Topics, g. NPTEL Videos, h. Swayam videos etc.
Expt. Topic / Description Area Remarks BloomsLevel
1 Bernollis theorem/knowledge of pressure energy, kinetic energy ,potential energy
HigherEducation/
GATE
GapA seminar on Bernollis theorem
L4analyse
3 Venturimeter,orificemeter/knowledge pressure difference
HigherEducation/
GATE
A seminar on pipe flow L4analyse
3 Notches /knowledge pressure difference
HigherEducation/
GATE
A seminar on discharge throughchannels
L4analyse
4 Turbines /knowledge power generation HigherEducation/
GATE
A seminar on different types ofturbines and principles of flow
L4analyse
5 pumpes /knowledge pressure difference
HigherEducation/
GATE
A seminar on lifting of water fromlower to higher elevation
L4analyse
18CVL48/ A&B Copyright ©2017. cAAS. All rights reserved.Page # 5 / 26
BE-4-EC-SKIT-Ph5b1-F02-V2.2LABORATORY PLAN - CAY 2019-20
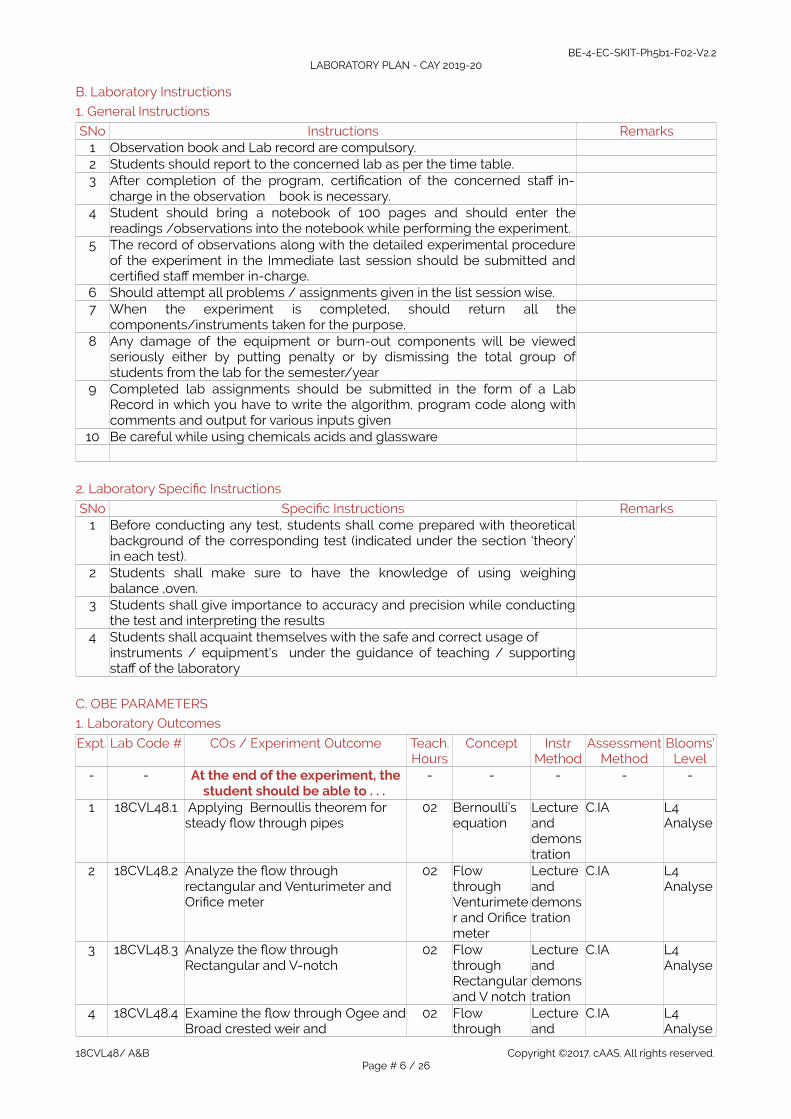
B. Laboratory Instructions
1. General Instructions
SNo Instructions Remarks1 Observation book and Lab record are compulsory.2 Students should report to the concerned lab as per the time table.3 After completion of the program, certification of the concerned staff in-
charge in the observation book is necessary.4 Student should bring a notebook of 100 pages and should enter the
readings /observations into the notebook while performing the experiment.5 The record of observations along with the detailed experimental procedure
of the experiment in the Immediate last session should be submitted andcertified staff member in-charge.
6 Should attempt all problems / assignments given in the list session wise.7 When the experiment is completed, should return all the
components/instruments taken for the purpose.8 Any damage of the equipment or burn-out components will be viewed
seriously either by putting penalty or by dismissing the total group ofstudents from the lab for the semester/year
9 Completed lab assignments should be submitted in the form of a LabRecord in which you have to write the algorithm, program code along withcomments and output for various inputs given
10 Be careful while using chemicals acids and glassware
2. Laboratory Specific Instructions
SNo Specific Instructions Remarks1 Before conducting any test, students shall come prepared with theoretical
background of the corresponding test (indicated under the section ‘theory’in each test).
2 Students shall make sure to have the knowledge of using weighingbalance ,oven.
3 Students shall give importance to accuracy and precision while conductingthe test and interpreting the results
4 Students shall acquaint themselves with the safe and correct usage ofinstruments / equipment's under the guidance of teaching / supportingstaff of the laboratory
C. OBE PARAMETERS
1. Laboratory Outcomes
Expt. Lab Code # COs / Experiment Outcome Teach.Hours
Concept InstrMethod
AssessmentMethod
Blooms’Level
- - At the end of the experiment, thestudent should be able to . . .
- - - - -
1 18CVL48.1 Applying Bernoullis theorem for steady flow through pipes
02 Bernoulli’s equation
Lecture and demonstration
C.IA L4Analyse
2 18CVL48.2 Analyze the flow through rectangular and Venturimeter and Orifice meter
02 Flow through Venturimeter and Orifice meter
Lecture and demonstration
C.IA L4Analyse
3 18CVL48.3 Analyze the flow through Rectangular and V-notch
02 Flow throughRectangularand V notch
Lecture and demonstration
C.IA L4Analyse
4 18CVL48.4 Examine the flow through Ogee andBroad crested weir and
02 Flow through
Lecture and
C.IA L4Analyse
18CVL48/ A&B Copyright ©2017. cAAS. All rights reserved.Page # 6 / 26
BE-4-EC-SKIT-Ph5b1-F02-V2.2LABORATORY PLAN - CAY 2019-20
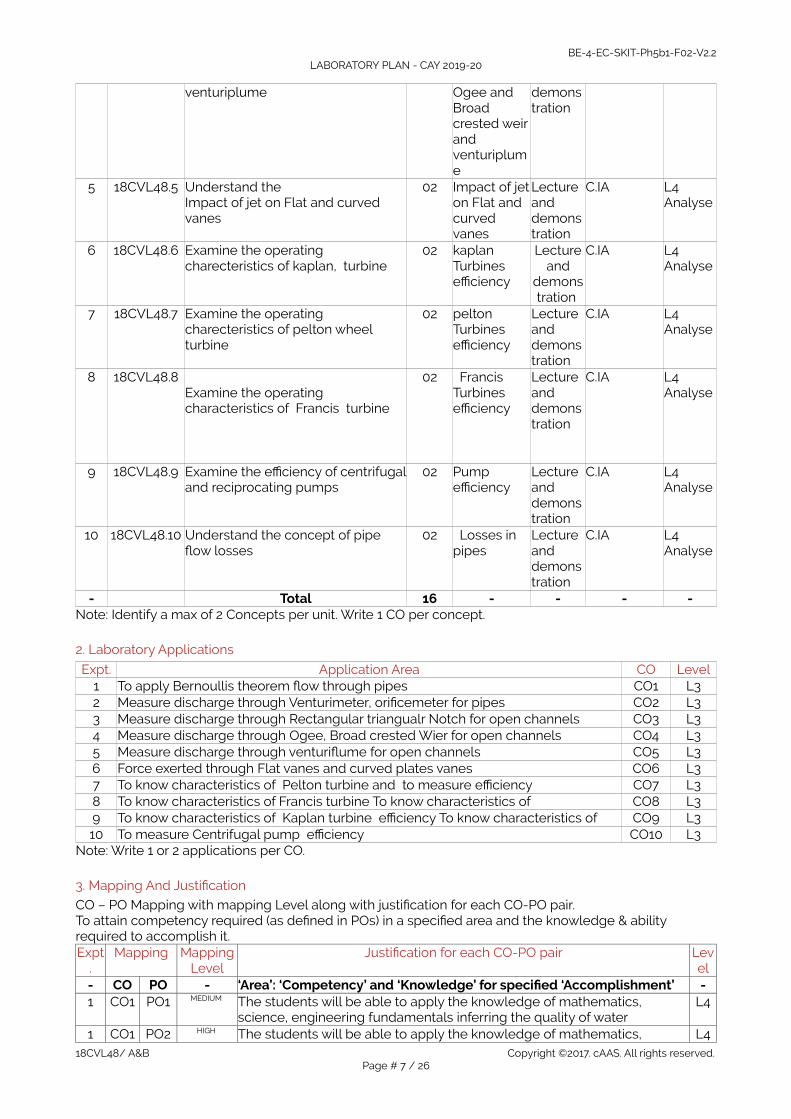
venturiplume Ogee and Broad crested weirand venturiplume
demonstration
5 18CVL48.5 Understand the Impact of jet on Flat and curved vanes
02 Impact of jeton Flat and curved vanes
Lecture and demonstration
C.IA L4Analyse
6 18CVL48.6 Examine the operating charecteristics of kaplan, turbine
02 kaplan Turbines efficiency
Lectureand
demonstration
C.IA L4Analyse
7 18CVL48.7 Examine the operating charecteristics of pelton wheel turbine
02 pelton Turbines efficiency
Lecture and demonstration
C.IA L4Analyse
8 18CVL48.8Examine the operating characteristics of Francis turbine
02 Francis Turbines efficiency
Lecture and demonstration
C.IA L4Analyse
9 18CVL48.9 Examine the efficiency of centrifugaland reciprocating pumps
02 Pump efficiency
Lecture and demonstration
C.IA L4Analyse
10 18CVL48.10 Understand the concept of pipe flow losses
02 Losses in pipes
Lecture and demonstration
C.IA L4Analyse
- Total 16 - - - -Note: Identify a max of 2 Concepts per unit. Write 1 CO per concept.
2. Laboratory Applications
Expt. Application Area CO Level1 To apply Bernoullis theorem flow through pipes CO1 L32 Measure discharge through Venturimeter, orificemeter for pipes CO2 L33 Measure discharge through Rectangular triangualr Notch for open channels CO3 L34 Measure discharge through Ogee, Broad crested Wier for open channels CO4 L35 Measure discharge through venturiflume for open channels CO5 L36 Force exerted through Flat vanes and curved plates vanes CO6 L37 To know characteristics of Pelton turbine and to measure efficiency CO7 L38 To know characteristics of Francis turbine To know characteristics of CO8 L39 To know characteristics of Kaplan turbine efficiency To know characteristics of CO9 L310 To measure Centrifugal pump efficiency CO10 L3
Note: Write 1 or 2 applications per CO.
3. Mapping And Justification
CO – PO Mapping with mapping Level along with justification for each CO-PO pair.To attain competency required (as defined in POs) in a specified area and the knowledge & ability required to accomplish it.Expt
.Mapping Mapping
LevelJustification for each CO-PO pair Lev
el- CO PO - ‘Area’: ‘Competency’ and ‘Knowledge’ for specified ‘Accomplishment’ -1 CO1 PO1 MEDIUM The students will be able to apply the knowledge of mathematics,
science, engineering fundamentals inferring the quality of water L4
1 CO1 PO2 HIGH The students will be able to apply the knowledge of mathematics, L418CVL48/ A&B Copyright ©2017. cAAS. All rights reserved.
Page # 7 / 26
BE-4-EC-SKIT-Ph5b1-F02-V2.2LABORATORY PLAN - CAY 2019-20
science, engineering fundamentals for dissolved oxygen content in water 2 CO2 PO1 HIGH The students will be able to apply the knowledge of mathematics,
science, engineering fundamentals for finding out chemical parameters like pH, acidity, alkalinity
L4
2 CO2 PO2 HIGH The students will be able to identify, formulate, review research literature, and analyse pH, acidity, alkalinity using Indian standard methods in reaching substantiated conclusions using first principles of mathematics, natural sciences, and engineering sciences
L4
2 CO2 PO3 MEDIUM The students will be able to design solutions for making the pH, acidity, alkalinity within the standard levels
L4
3 CO3 PO1 HIGH The students will be able to apply the knowledge of mathematics, science, engineering fundamentals for finding out the physical characteristics viz. colour, turbidity, and conductivity of a given water sample
L4
3 CO3 PO2 HIGH The students will be able to identify and examine physical characteristics viz. colour, turbidity, and conductivity of a given water sample using natural sciences, and engineering sciences
L4
4 CO4 PO2 HIGH The students will be able to identify, formulate and review research literature for dissolved oxygen content in water reaching substantiated conclusions using first principles of mathematics, natural sciences, and engineering sciences
L4
4 CO4 PO4 HIGH The students will be able to use research-based knowledge and researchmethods including design of experiments, analysis and interpretation of dissolved oxygen content
L4
5 CO5 PO2 HIGH The students will be able to identify, formulate and review research literature for chloride content in water reaching substantiated conclusionsusing first principles of mathematics, natural sciences, and engineering sciences
L4
5 CO5 PO4 HIGH The students will be able to use research-based knowledge and researchmethods including design of experiments, analysis and interpretation of chlorides content
L4
6 CO6 PO1 HIGH The students will be able to apply the knowledge of mathematics, science, engineering fundamentals to examine the chemical characteristics viz. chlorides, Iron, Available Chlorine and sulphates content to assess its suitability for drinking purposes.
L4
6 CO6 PO2 HIGH The students will be able to identify, formulate, review research literature, and analyse chemical characteristics viz. chlorides, Iron, Available Chlorine and sulphates content in samples
L4
7 CO7 PO1 HIGH The students will be able to apply the knowledge of mathematics, science, engineering fundamentals, and an engineering specialization to find the optimum dosage of alum using Jar test
L4
7 CO7 PO2 HIGH The students will be able to identify, formulate, review research literature, and analyse the optimum dosage of alum using Jar test reaching substantiated conclusions natural sciences, and engineering sciences
L4
8 CO8 PO1 HIGH The students will be able to apply the knowledge of mathematics, science, engineering fundamentals to examine the chemical characteristics viz. chlorides, sodium potassium, Iron, nitrates, manganesecontent to assess its suitability for drinking purposes.
L4
8 CO8 PO2 HIGH The students will be able to identify, formulate, review research literature, and analyse chemical characteristics viz. sodium, potassium, Iron, nitrates,manganese content in samples
L4
9 CO9 PO1 MEDIUM The students will be able to apply the knowledge of mathematics, science, engineering fundamentals to understand the COD to assess its suitability for drinking purposes.
L4
10 CO10 PO1 MEDIUM The students will be able to apply the knowledge of mathematics, science, engineering fundamentals to understand the Air quality Monitoring and sound levels
L4
18CVL48/ A&B Copyright ©2017. cAAS. All rights reserved.Page # 8 / 26

BE-4-EC-SKIT-Ph5b1-F02-V2.2LABORATORY PLAN - CAY 2019-20
4. Articulation Matrix
CO – PO Mapping with mapping level for each CO-PO pair, with course average attainment.- - Experiment Outcomes Program Outcomes -
Expt. CO.# At the end of the experimentstudent should be able to . . .
PO1
PO2
PO3
PO4
PO5
PO6
PO7
PO8
PO9
PO10
PO11
PO12
PSO1
PSO2
PSO3
Level
1 CO1 Applying Bernoullis theorem forsteady flow through pipes
2 3 - - - - - - - - - - - - - L4
2 CO2 Analyze the flow through rectangular and Venturimeter and Orifice meter
3 2 1 - - - - - - - - - - - - L4
3 CO3 Analyze the flow through Rectangular and V-notch
3 2 3 - - - - - - - - - - - - L4
4 CO4 Examine the flow through Ogee and Broad crested weir and venturiplume
3 3 3 - - - - - - - - - - - - L4
5 CO5 Understand the Impact of jet on Flat and curved vanes
3 2 - - - - - - - - - - - - - L4
6 CO6 Examine the operating charecteristics of kaplan, turbine
3 2 - - - - - - - - - - - - L4
7 CO7 Examine the operating charecteristics of pelton wheel turbine
3 2 - - - - - - - - - - - - L4
8 CO8 Examine the operating characteristics of Francis turbine
3 2 - - - - - - - - - - - - L4
9 CO9 Examine the efficiency of centrifugal and reciprocating pumps
3 2 - - - - - - - - - - - - L4
10 CO10 Understand the concept of pipe flow losses
1 2 - - - - - - - - - - - - L4
- Average attainment (1, 2, or 3) 2.7 2.5 2.5 1.5 - - - - - - - - - - - -- PO, PSO 1.Engineering Knowledge; 2.Problem Analysis; 3.Design / Development of Solutions;
4.Conduct Investigations of Complex Problems; 5.Modern Tool Usage; 6.The Engineer andSociety; 7.Environment and Sustainability; 8.Ethics; 9.Individual and Teamwork;10.Communication; 11.Project Management and Finance; 12.Life-long Learning;S1.Software Engineering; S2.Data Base Management; S3.Web Design
5. Curricular Gap and Experiments
Topics & contents not covered (from A.4), but essential for the course to address POs and PSOs.Expt Gap Topic Actions Planned Schedule Planned Resources Person PO Mapping
12345
Note: Write Gap topics from A.4 and add others also.
18CVL48/ A&B Copyright ©2017. cAAS. All rights reserved.Page # 9 / 26

BE-4-EC-SKIT-Ph5b1-F02-V2.2LABORATORY PLAN - CAY 2019-20
D. COURSE ASSESSMENT
1. Laboratory Coverage
Assessment of learning outcomes for Internal and end semester evaluation. Distinct assignment for eachstudent. 1 Assignment per chapter per student. 1 seminar per test per student.Unit Title Teachi
ngHours
No. of question in Exam CO LevelsCIA-1 CIA-2 CIA-3 Asg-1 Asg-2Asg-3 SEE
1 Applying Bernoullis theorem for steady flow through pipes
03 - - - - - - 1 CO1 L4
2 Analyze the flow through rectangular and Venturimeter and Orifice meter
03 - - - - - - 1 CO2 L4
3 Analyze the flow through Rectangular and V-notch
03 - - - - - - 1 CO3 L4
4 Examine the flow through Ogee and Broad crested weir and venturiplume
03 - - - - - - 1 CO4 L4
5 Understand the Impact of jet on Flat and curved vanes
03 - - - - - - 1 CO5 L4
6 Examine the operating charecteristics of kaplan, turbine
03 - - - - - - 1 CO6 L4
7 Examine the operating charecteristics of pelton wheel turbine
03 - - - - - - 1 CO7 L4
8 Examine the operating characteristics of Francis turbine
03 - - - - - - 1 CO8 L4
9 Examine the efficiency of centrifugal and reciprocating pumps
03 - - - - - - 1 CO9 L4
10 Understand the concept of pipe flow losses
03 - - - - - - 1 CO10 L4
- Total 42 - - - - - - 10 - -
2. Continuous Internal Assessment (CIA)
Assessment of learning outcomes for Internal exams. Blooms Level in last column shall match with A.2.Evaluation Weightage in Marks CO Levels
CIA Exam – 1 15 CO1, CO2, CO3, L4CIA Exam – 2 15 CO4, CO5, CO6, L4CIA Exam – 3 15 CO7, CO8,CO9,CO10 L4
Assignment - 1 05 CO1, CO2, CO3, L4Assignment - 2 05 CO4, CO5, CO6, L4Assignment - 3 05 CO7, CO8,CO9 L4
Seminar - 1 -Seminar - 2 -Seminar - 3 -
Other Activities – define –Slip test
CO1 to Co10 L2, L3, L4 . ..
Final CIA Marks 20 - --
18CVL48/ A&B Copyright ©2017. cAAS. All rights reserved.Page # 10 / 26
BE-4-EC-SKIT-Ph5b1-F02-V2.2LABORATORY PLAN - CAY 2019-20
SNo Description Marks1 Observation and Weekly Laboratory Activities 05 Marks2 Record Writing 10 Marks for each Expt3 Internal Exam Assessment 20 Marks4 Internal Assessment 40 Marks5 SEE 80 Marks- Total 100 Marks
E. EXPERIMENTS
Experiment 01 : CALIBRATION OF COLLECTING TANK (GRAVIMETRIC METHOD)
- Experiment No.: 1 Marks DatePlanned
DateConducted
1 Title Collecting tank by Gravimetric method2 Course Outcomes Applying Bernoullis theorem for steady flow through pipes3 Aim To calibrate the collecting tank by Gravimetric method4 Material / Equipment
Requiredweight scale, collecting tank, sump tank, piezometer, stop watch.
5 Theory, Formula,Principle, Concept
Calibration is a comparison between measurements of one of the knownmagnitude and another measurement made in as similar way as possible witha second device. The device with the know correctness is called the standard.The second device is the unit under test.
6 Procedure • Keep the delivery valve closed and check for electrical connections.
• Switch on the electronic weighing scale and motor.
• Note down the dimension of measuring tank
• Allow an initial discharge of water to measuring tank by regulating thevalve.
• Press the tare button to set zero in the weighing scale.
• Allow discharge for know rise „R , (say 10cm) water to be collected in‟the collecting tank.
• Note down the mass of the water collected in the measuring tank.
• Tabulate the reading and repeat the procedure for different rise7 Diagram
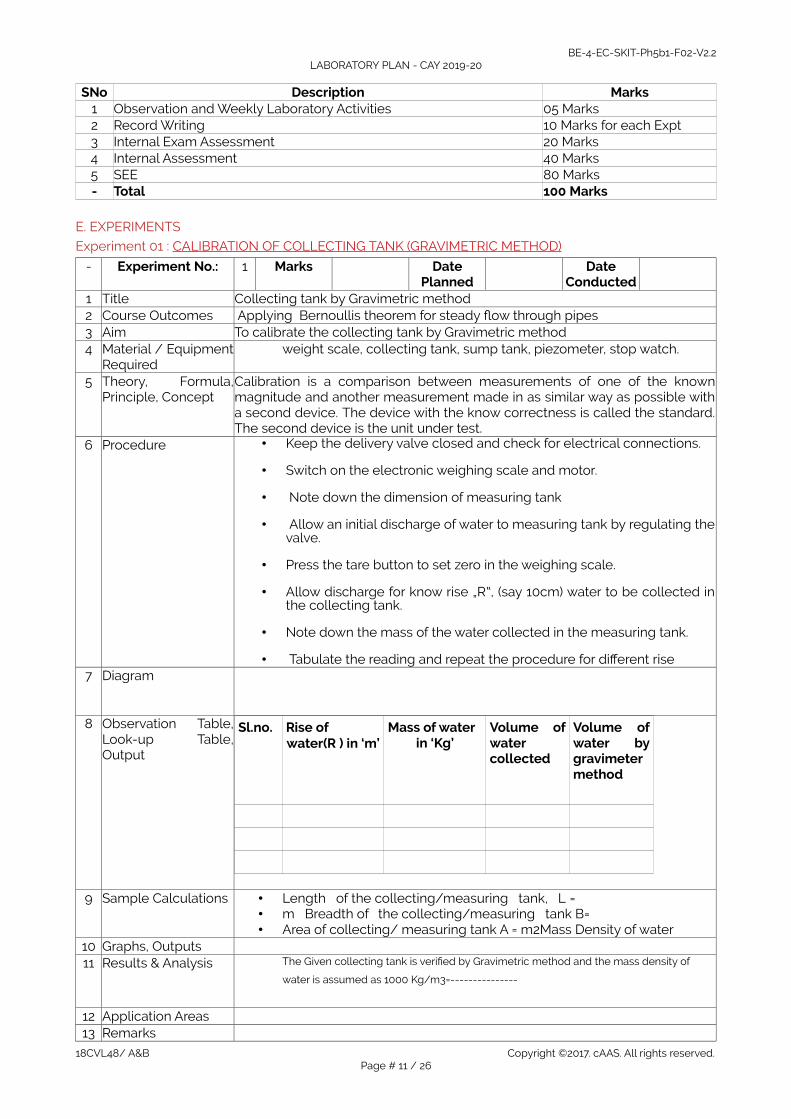
8 Observation Table,Look-up Table,Output
Sl.no. Rise ofwater(R ) in ‘m’
Mass of waterin ‘Kg’
Volume ofwatercollected
Volume ofwater bygravimetermethod
9 Sample Calculations • Length of the collecting/measuring tank, L =• m Breadth of the collecting/measuring tank B=• Area of collecting/ measuring tank A = m2Mass Density of water
10 Graphs, Outputs11 Results & Analysis The Given collecting tank is verified by Gravimetric method and the mass density of
water is assumed as 1000 Kg/m3=---------------
12 Application Areas13 Remarks
18CVL48/ A&B Copyright ©2017. cAAS. All rights reserved.Page # 11 / 26
BE-4-EC-SKIT-Ph5b1-F02-V2.2LABORATORY PLAN - CAY 2019-20
14 Faculty Signaturewith Date
Experiment 02 : CALIBRATION OF PRESSURE GAUGE (DEAD WEIGHT METHOD)
- Experiment No.: 2 Marks DatePlanned
DateConducted
1 Title PRESSURE GAUGE (DEAD WEIGHT METHOD)
2 Course Outcomes Applying Bernoullis theorem for steady flow through pipes3 Aim To CALIBRATE PRESSURE GAUGE (DEAD WEIGHT METHOD)
4 MaterialEquipmentRequired
Pressure cell, Dial type pressure indicator, Hydraulic dead weight, Pressuregauge Tester to develop the pressure, Digital pressure indicator
5 Theory, Formula,Principle, Concept
Pressure is defined as force power unit area and is measured in Newton persquare meter (Pascal) or in terms of an equivalent head of some standard liquid(mm of mercury or mater of water). A typical pressure gauge will measure thedifference in pressure between two pressures. Thus a pressure gauge isconnected to the hydraulic line and the gauge itself stands in atmosphericpressure. The gauge reading will be the difference between the air pressure andthe atmospheric pressure and is called gauge pressure. The absolute pressure(the actual pressure within the air line) is the sum of the gauge pressure andatmospheric pressure.
6 Procedure • Ensure that sufficient oil is there in the oil cap .• Put the standard dead weight on the pan and close the needle valve.• Then slowly operate the pump lever up and down and observe the
pressure builds up and• plunger is rises up.• Observe the pressure gauge reading against the known weight• While taking reading gently rotate the pan so that no friction will occur.• Increase the dead weight and repeat the procedure and note down the
readings.
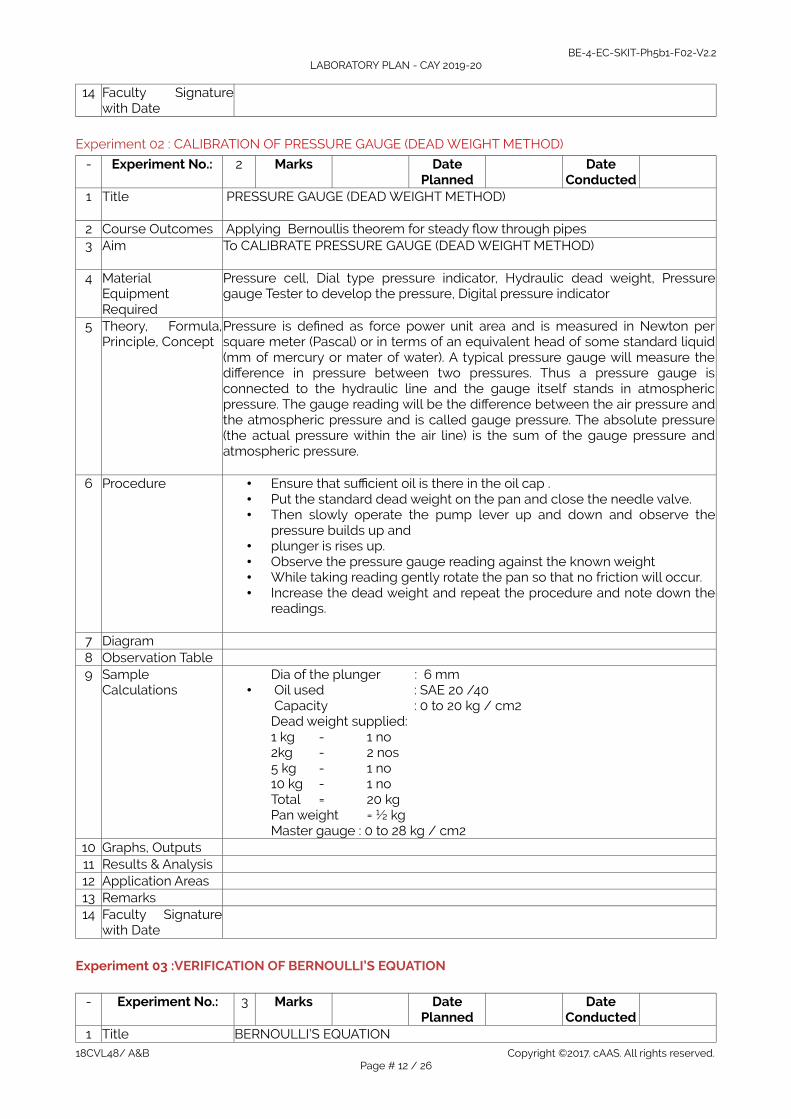
7 Diagram8 Observation Table9 Sample
CalculationsDia of the plunger : 6 mm
• Oil used : SAE 20 /40 Capacity : 0 to 20 kg / cm2Dead weight supplied:1 kg - 1 no2kg - 2 nos5 kg - 1 no10 kg - 1 noTotal = 20 kgPan weight = ½ kgMaster gauge : 0 to 28 kg / cm2
10 Graphs, Outputs11 Results & Analysis12 Application Areas13 Remarks14 Faculty Signature
with Date
Experiment 03 :VERIFICATION OF BERNOULLI’S EQUATION
- Experiment No.: 3 Marks DatePlanned
DateConducted
1 Title BERNOULLI’S EQUATION 18CVL48/ A&B Copyright ©2017. cAAS. All rights reserved.
Page # 12 / 26
BE-4-EC-SKIT-Ph5b1-F02-V2.2LABORATORY PLAN - CAY 2019-20
2 Course Outcomes Applying Bernoullis theorem for steady flow through pipes3 Aim Verification of BERNOULLI’S EQUATION 4 Material / Equipment
RequiredVenturimeter, multi-tube piezometer, stopwatch, collecting tank set-up.
5 Theory, Formula,Principle, Concept
The objective is to validate Bernoulli s assumptions and theorem by‟experimentally proving that the sum of the terms in the Bernoulli equationalong a streamline always remains a constantThe Bernoulli theorem is an approximate relation between pressure head,velocity head, and elevation (datum), and is valid in regions of steady,incompressible flow where net frictional forces are negligible. The keyapproximation in the derivation of Bernoulli s equation is that viscous effects‟are negligibly small compared to inertial, gravitational, and pressure effects.We can write the theorem as
6 Procedure • Observe the dimensions of the convergent-divergent duct of the apparatus, not it down. Measure the cross section area of collecting tank.
• Keep the delivery valve closed.• Check electrical connection and switch on the pump• Slowly open the inlet valve and allow water to fill up to a high head
level.• Adjust the flow rate to obtain steady flow and to maintain constant
head.• Note down the pressure head at different points of venture meter on
the multi tube peizometer.• Close the ball valve of the collecting tank and measure the time for the
known rise of water.• Repeat the experiment for medium and low head levels.• Tabulate the readingsVerify the Bernoulli s equation by considering ‟ ‟
any two or more points on the venture meter.• Plot the curves showing the variation of Pressure head (Hp),
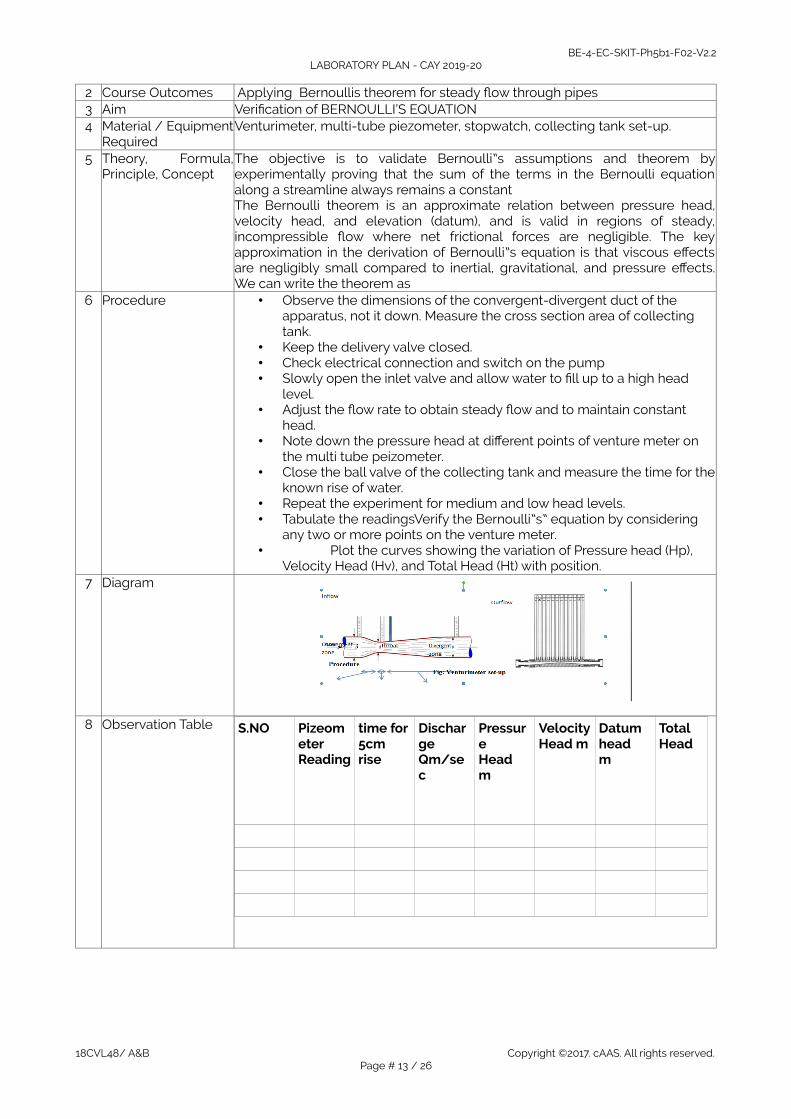
Velocity Head (Hv), and Total Head (Ht) with position.7 Diagram
8 Observation Table S.NO PizeometerReading
time for 5cm rise
DischargeQm/sec
Pressure Head m
VelocityHead m
Datum head m
Total Head
18CVL48/ A&B Copyright ©2017. cAAS. All rights reserved.Page # 13 / 26
BE-4-EC-SKIT-Ph5b1-F02-V2.2LABORATORY PLAN - CAY 2019-20
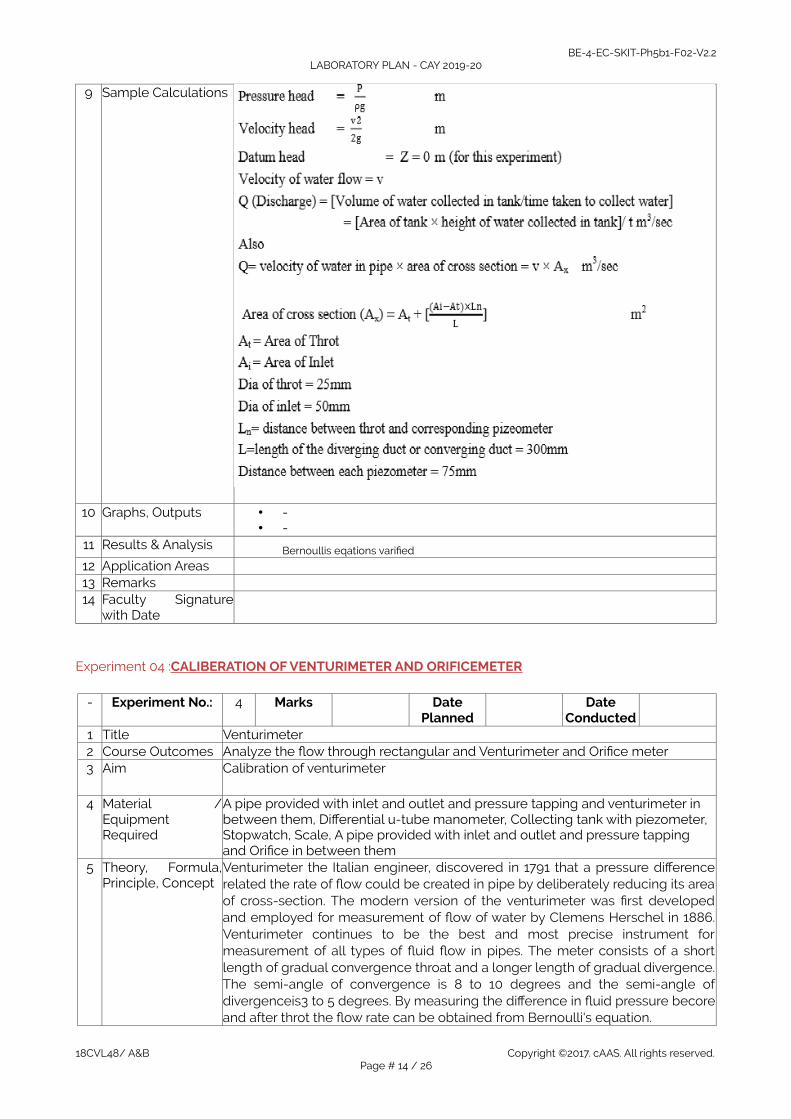
9 Sample Calculations
10 Graphs, Outputs • -• -
11 Results & Analysis Bernoullis eqations varified
12 Application Areas13 Remarks14 Faculty Signature
with Date
Experiment 04 :CALIBERATION OF VENTURIMETER AND ORIFICEMETER
- Experiment No.: 4 Marks DatePlanned
DateConducted
1 Title Venturimeter2 Course Outcomes Analyze the flow through rectangular and Venturimeter and Orifice meter 3 Aim Calibration of venturimeter
4 Material /EquipmentRequired
A pipe provided with inlet and outlet and pressure tapping and venturimeter in between them, Differential u-tube manometer, Collecting tank with piezometer, Stopwatch, Scale, A pipe provided with inlet and outlet and pressure tapping and Orifice in between them
5 Theory, Formula,Principle, Concept
Venturimeter the Italian engineer, discovered in 1791 that a pressure differencerelated the rate of flow could be created in pipe by deliberately reducing its areaof cross-section. The modern version of the venturimeter was first developedand employed for measurement of flow of water by Clemens Herschel in 1886.Venturimeter continues to be the best and most precise instrument formeasurement of all types of fluid flow in pipes. The meter consists of a shortlength of gradual convergence throat and a longer length of gradual divergence.The semi-angle of convergence is 8 to 10 degrees and the semi-angle ofdivergenceis3 to 5 degrees. By measuring the difference in fluid pressure becoreand after throt the flow rate can be obtained from Bernoulli's equation.
18CVL48/ A&B Copyright ©2017. cAAS. All rights reserved.Page # 14 / 26
BE-4-EC-SKIT-Ph5b1-F02-V2.2LABORATORY PLAN - CAY 2019-20
6 Procedure
• The pipe is selected for conducting venturimeter experiment.• The motor is switched on, as a result water will flow• According to the flow, the ccl4 level fluctuates in the U-tube manometer• The reading of H1 and H2 are noted• The time taken for 5 cm rise of water in the collecting tank is noted• The experiment is repeated for various flow in the same pipe• The co-efficient of discharge is calculated• The same procedure is followed for conducting orifice experiment
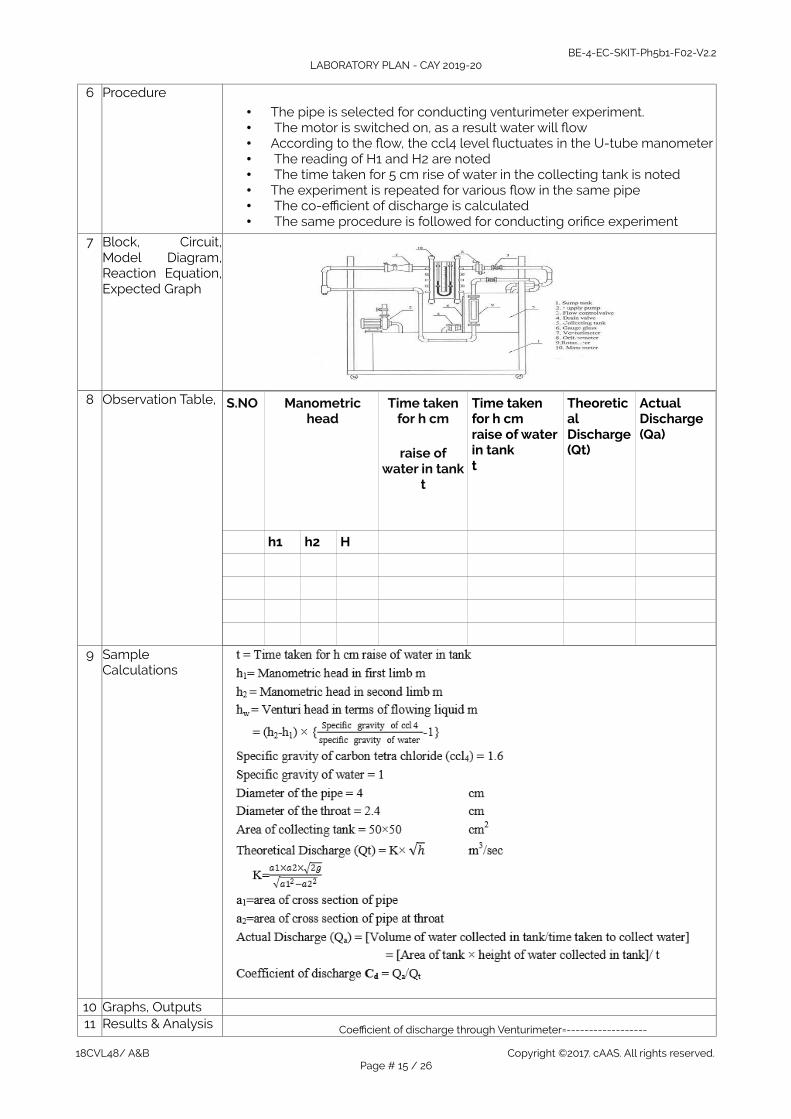
7 Block, Circuit,Model Diagram,Reaction Equation,Expected Graph
8 Observation Table, S.NO Manometrichead
Time takenfor h cm
raise ofwater in tank
t
Time taken for h cm raise of waterin tankt
Theoretical Discharge(Qt)
Actual Discharge (Qa)
h1 h2 H
9 SampleCalculations
10 Graphs, Outputs11 Results & Analysis Coefficient of discharge through Venturimeter=------------------
18CVL48/ A&B Copyright ©2017. cAAS. All rights reserved.Page # 15 / 26
BE-4-EC-SKIT-Ph5b1-F02-V2.2LABORATORY PLAN - CAY 2019-20
12 Application Areas13 Remarks14 Faculty Signature
with Date
Experiment 05: CALIBERATION OF ORIFICEMETER
- Experiment No.: 5 Marks DatePlanned
DateConducted
1 Title ORIFICEMETER
2 Course Outcomes Analyze the flow through rectangular and Venturimeter and Orifice meter 3 Aim Calibration of orificemeter
4 Material /EquipmentRequired
A pipe provided with inlet and outlet and pressure tapping and venturi in between them, Differential u-tube manometer, Collecting tank with piezometer, Stopwatch, Scale, A pipe provided with inlet and outlet and pressure tapping and Orifice in between them
5 Theory, Formula,Principle, Concept
An orifice plate is a thin plate with a hole in it, which is usually placed in a pipe.When a fluid passes through the orifice, its pressure builds up slightly upstreamof the orifice, but as the fluid is forced to converge to pass through the hole, thevelocity increases and the fluid pressure decreases. A little downstream of theorifice the flow reaches its point of maximum convergence, afterd that, the flowexpands, the velocity falls and the pressure increases. By measuring thedifference in fluid pressure across tappings upstream and downstream of theplate, the flow rate can be obtained from Bernoulli's equation
6 Procedure,
• The pipe is selected for conducting venturimeter experiment.• The motor is switched on, as a result water will flow• According to the flow, the ccl4 level fluctuates in the U-tube
manometer• The reading of H1 and H2 are noted• The time taken for 5 cm rise of water in the collecting tank is noted• The experiment is repeated for various flow in the same pipe• The co-efficient of discharge is calculated• The same procedure is followed for conducting orifice experiment
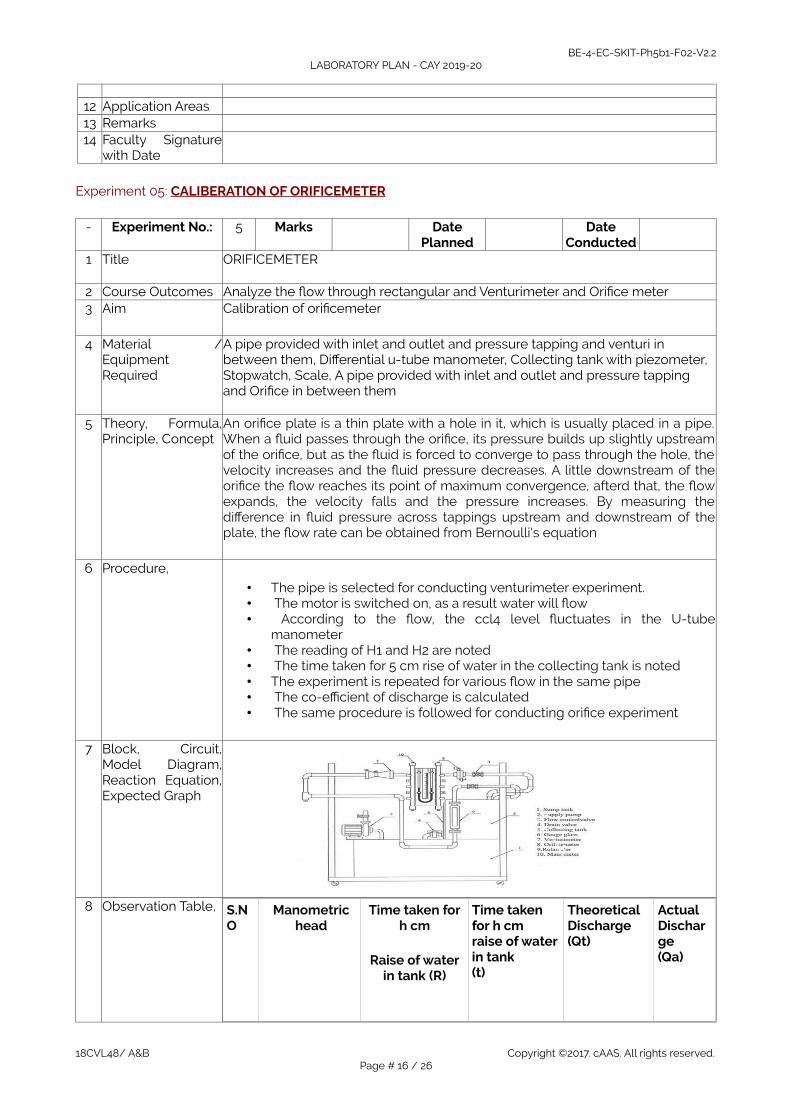
7 Block, Circuit,Model Diagram,Reaction Equation,Expected Graph
8 Observation Table, S.NO
Manometrichead
Time taken forh cm
Raise of waterin tank (R)
Time taken for h cm raise of waterin tank(t)
Theoretical Discharge (Qt)
Actual Discharge (Qa)
18CVL48/ A&B Copyright ©2017. cAAS. All rights reserved.Page # 16 / 26
BE-4-EC-SKIT-Ph5b1-F02-V2.2LABORATORY PLAN - CAY 2019-20
h1 h2 H
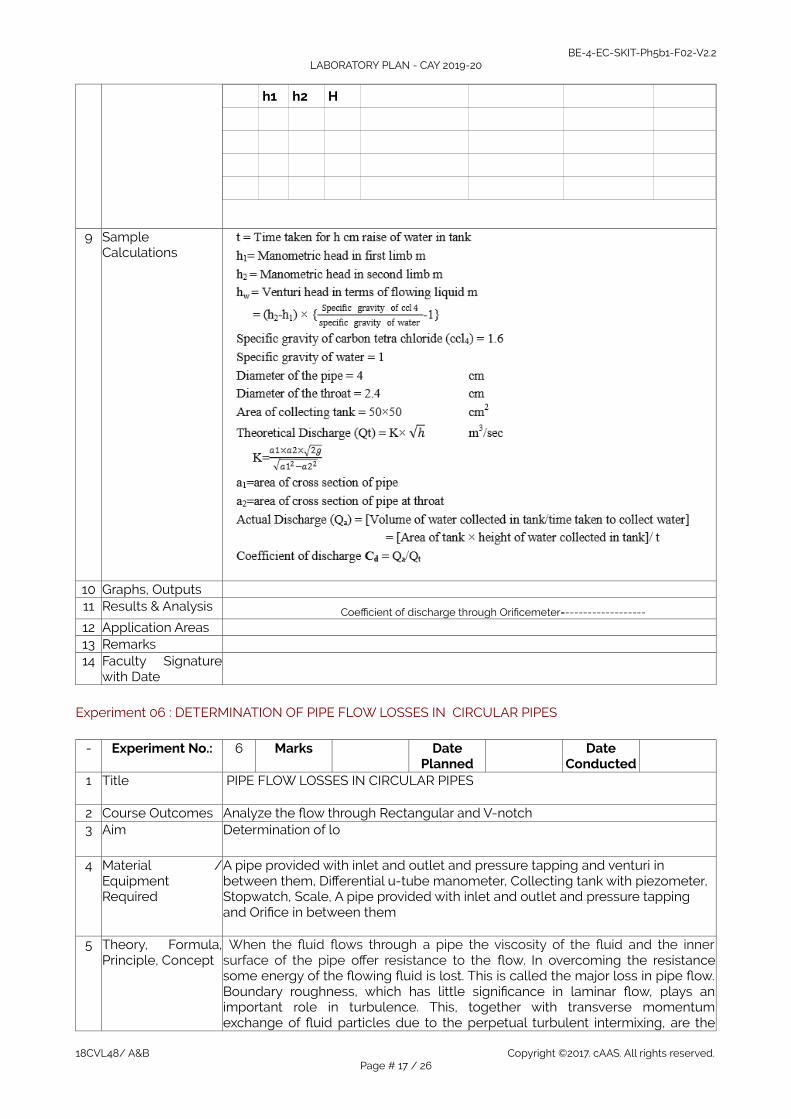
9 SampleCalculations
10 Graphs, Outputs11 Results & Analysis Coefficient of discharge through Orificemeter=------------------
12 Application Areas13 Remarks14 Faculty Signature
with Date
Experiment 06 : DETERMINATION OF PIPE FLOW LOSSES IN CIRCULAR PIPES
- Experiment No.: 6 Marks DatePlanned
DateConducted
1 Title PIPE FLOW LOSSES IN CIRCULAR PIPES
2 Course Outcomes Analyze the flow through Rectangular and V-notch3 Aim Determination of lo
4 Material /EquipmentRequired
A pipe provided with inlet and outlet and pressure tapping and venturi in between them, Differential u-tube manometer, Collecting tank with piezometer, Stopwatch, Scale, A pipe provided with inlet and outlet and pressure tapping and Orifice in between them
5 Theory, Formula,Principle, Concept
When the fluid flows through a pipe the viscosity of the fluid and the innersurface of the pipe offer resistance to the flow. In overcoming the resistancesome energy of the flowing fluid is lost. This is called the major loss in pipe flow.Boundary roughness, which has little significance in laminar flow, plays animportant role in turbulence. This, together with transverse momentumexchange of fluid particles due to the perpetual turbulent intermixing, are the
18CVL48/ A&B Copyright ©2017. cAAS. All rights reserved.Page # 17 / 26
BE-4-EC-SKIT-Ph5b1-F02-V2.2LABORATORY PLAN - CAY 2019-20
main sources of tangential or shear stresses in turbulent flow. Various equationshave been proposed to determine the head losses due to friction. Theseequations relate the friction losses to physical characteristics of the pipe andvarious flow parameters
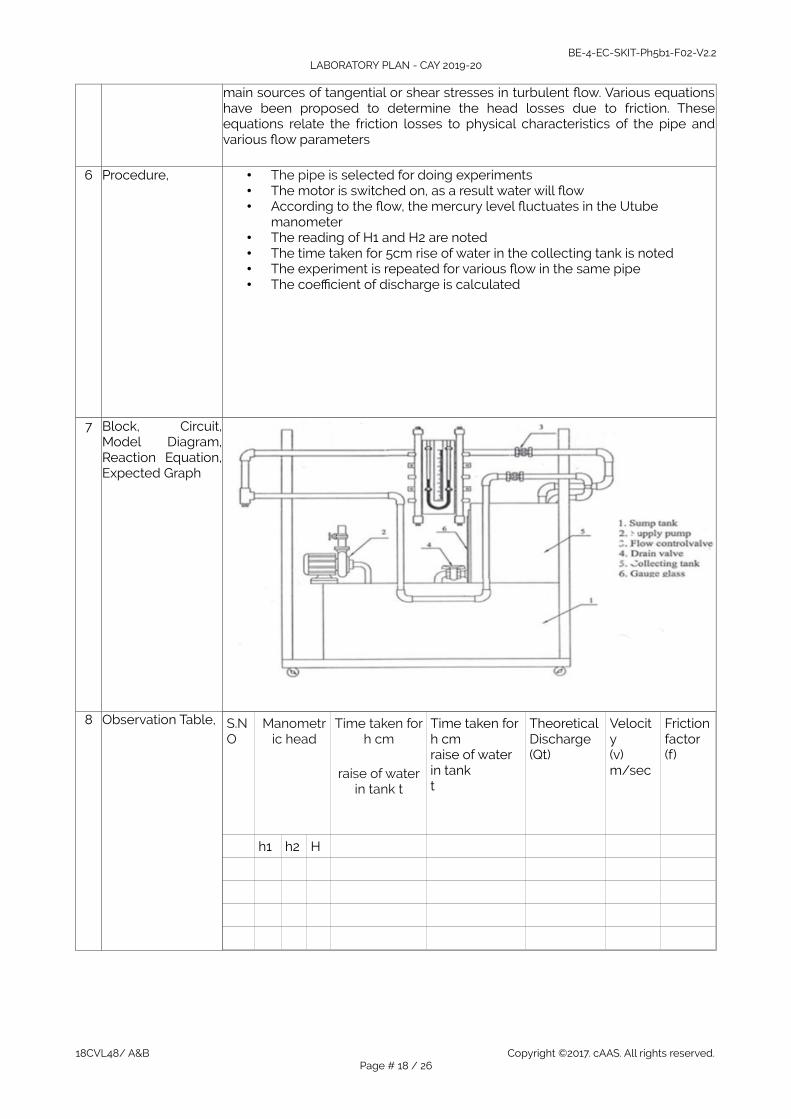
6 Procedure, • The pipe is selected for doing experiments• The motor is switched on, as a result water will flow• According to the flow, the mercury level fluctuates in the Utube
manometer• The reading of H1 and H2 are noted• The time taken for 5cm rise of water in the collecting tank is noted• The experiment is repeated for various flow in the same pipe• The coefficient of discharge is calculated
7 Block, Circuit,Model Diagram,Reaction Equation,Expected Graph
8 Observation Table, S.NO
Manometric head
Time taken forh cm
raise of waterin tank t
Time taken for h cm raise of water in tankt
Theoretical Discharge (Qt)
Velocity(v) m/sec
Frictionfactor (f)
h1 h2 H
18CVL48/ A&B Copyright ©2017. cAAS. All rights reserved.Page # 18 / 26

BE-4-EC-SKIT-Ph5b1-F02-V2.2LABORATORY PLAN - CAY 2019-20
9 Sample Calculation
10 Graphs, Outputs11 Results & Analysis12 Application Areas13 Remarks14 Faculty Signature
with Date
Experiment 07:FLOW THROUGH NOTCHES
- Experiment No.: 7 Marks DatePlanned
DateConducted
1 Title FLOW THROUGH NOTCHES2 Course Outcomes3 Aim To determine the coefficients of discharge of the rectangular, triangular and
trapezoidal notches
4 Material /Equipment
Hydraulic benchNotches – Rectangular, triangular, trapezoidal shape.
18CVL48/ A&B Copyright ©2017. cAAS. All rights reserved.Page # 19 / 26
BE-4-EC-SKIT-Ph5b1-F02-V2.2LABORATORY PLAN - CAY 2019-20
Required Hook and point gaugeCalibrated collecting tankStop watch
5 Theory, Formula,Principle, Concept
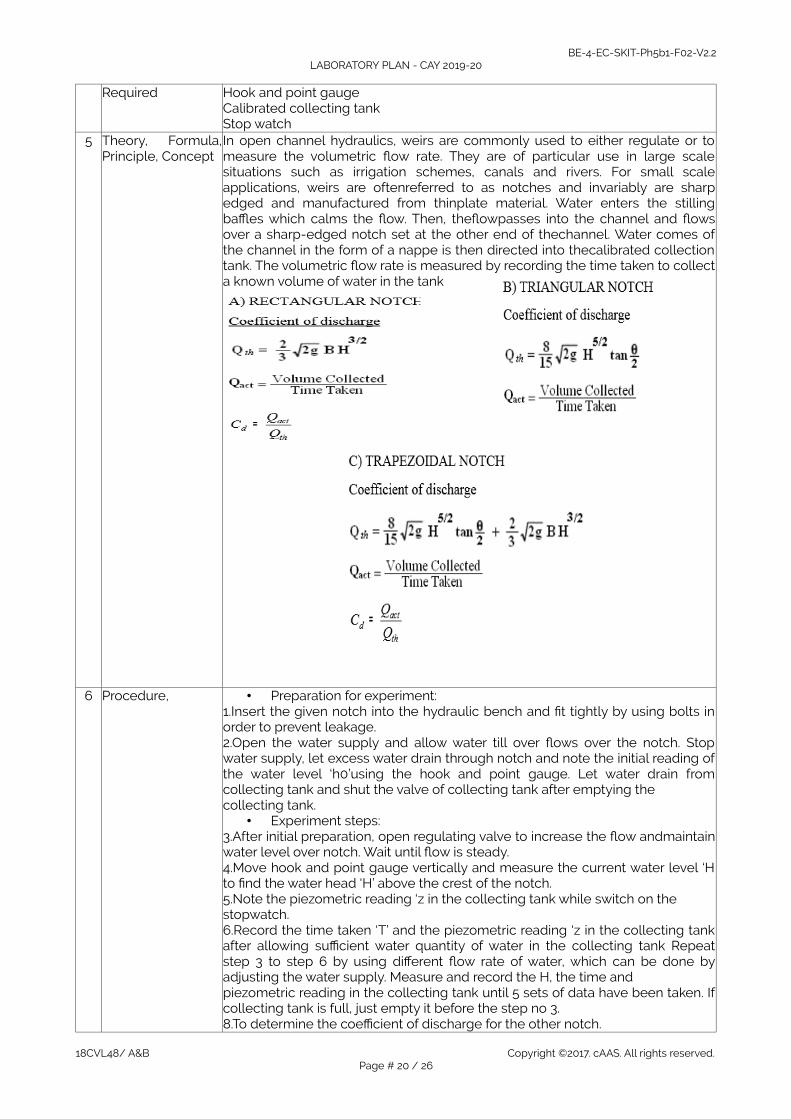
In open channel hydraulics, weirs are commonly used to either regulate or tomeasure the volumetric flow rate. They are of particular use in large scalesituations such as irrigation schemes, canals and rivers. For small scaleapplications, weirs are oftenreferred to as notches and invariably are sharpedged and manufactured from thinplate material. Water enters the stillingbaffles which calms the flow. Then, theflowpasses into the channel and flowsover a sharp-edged notch set at the other end of thechannel. Water comes ofthe channel in the form of a nappe is then directed into thecalibrated collectiontank. The volumetric flow rate is measured by recording the time taken to collecta known volume of water in the tank
6 Procedure, • Preparation for experiment:1.Insert the given notch into the hydraulic bench and fit tightly by using bolts inorder to prevent leakage.2.Open the water supply and allow water till over flows over the notch. Stopwater supply, let excess water drain through notch and note the initial reading ofthe water level ‘h0’using the hook and point gauge. Let water drain fromcollecting tank and shut the valve of collecting tank after emptying thecollecting tank.
• Experiment steps:3.After initial preparation, open regulating valve to increase the flow andmaintainwater level over notch. Wait until flow is steady.4.Move hook and point gauge vertically and measure the current water level ‘Hto find the water head ‘H’ above the crest of the notch.5.Note the piezometric reading ‘z in the collecting tank while switch on thestopwatch.6.Record the time taken ‘T’ and the piezometric reading ‘z in the collecting tankafter allowing sufficient water quantity of water in the collecting tank Repeatstep 3 to step 6 by using different flow rate of water, which can be done byadjusting the water supply. Measure and record the H, the time andpiezometric reading in the collecting tank until 5 sets of data have been taken. Ifcollecting tank is full, just empty it before the step no 3.8.To determine the coefficient of discharge for the other notch.
18CVL48/ A&B Copyright ©2017. cAAS. All rights reserved.Page # 20 / 26

BE-4-EC-SKIT-Ph5b1-F02-V2.2LABORATORY PLAN - CAY 2019-20
7 Block, Circuit,Model Diagram,Reaction Equation,Expected Graph
8 Observation Table, SL.NO
Theoretical Discharge Measurement
Actual Discharge Measurement Cd
h1 H Theoretical Discharge
Water Rise inCollectingTankR (m)
TimeTaken‘T’ (sec)
Volume ofwatercollected
Discharge, Qact
Determination of Cd of rectangular notch
SL.NO
Theoretical Discharge Measurement
Actual Discharge Measurement Cd
h1 H Theoretical Discharge
Water Rise inCollectingTankR (m)
TimeTaken‘T’ (sec)
Volume ofwatercollected
Discharge, Qact
18CVL48/ A&B Copyright ©2017. cAAS. All rights reserved.Page # 21 / 26
BE-4-EC-SKIT-Ph5b1-F02-V2.2LABORATORY PLAN - CAY 2019-20
Determination of Cd of rectangular notch
SL.NO
Theoretical Discharge Measurement
Actual Discharge Measurement Cd
h1 H Theoretical Discharge
Water Rise inCollectingTankR (m)
TimeTaken‘T’ (sec)
Volume ofwatercollected
Discharge, Qact
9 Sample Calculation
10 Graphs, Outputs11 Results & Analysis • Rectangular notch : Average Value of Cd = ...................…
• triangular notch : Average Value of Cd = ...................…
• trapezoidal notch : Average Value of Cd = ......................
12 Application Areas13 Remarks14 Faculty Signature
with Date
Experiment 08: IMPACT OF JET ON PLATES
- Experiment No.: 8 Marks DatePlanned
DateConducted
1 Title IMPACT OF JET ON PLATES2 Course Outcomes3 Aim Determine the vane coefficient for a flat vane &semicircular vane
4 Material /EquipmentRequired
A hydraulic work bench setup containing nozzle for striking jet on plate.Collecting tankStop watchWeights
5 Theory, Formula,Principle, Concept
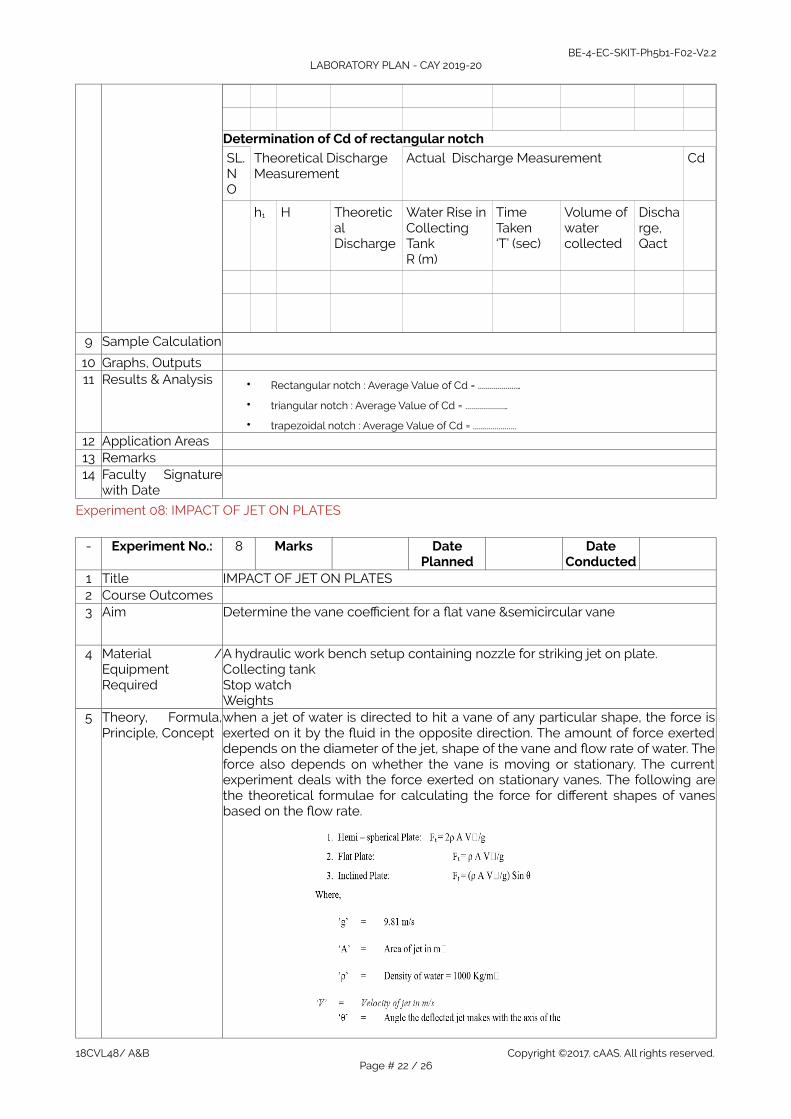
when a jet of water is directed to hit a vane of any particular shape, the force isexerted on it by the fluid in the opposite direction. The amount of force exerteddepends on the diameter of the jet, shape of the vane and flow rate of water. Theforce also depends on whether the vane is moving or stationary. The currentexperiment deals with the force exerted on stationary vanes. The following arethe theoretical formulae for calculating the force for different shapes of vanesbased on the flow rate.
18CVL48/ A&B Copyright ©2017. cAAS. All rights reserved.Page # 22 / 26

BE-4-EC-SKIT-Ph5b1-F02-V2.2LABORATORY PLAN - CAY 2019-20
6 Procedure, a. Fill in the sump tank with clean water.b. Keep the delivery valve closed.c. Connect the power cable to 1Ph, 220V,10Amps with earth connection.d. Fix the vane & jet in position with care applying minimum force.e. Press tare button on the force indicator to balance (if zero does not appear).f. Switch on the pump & open the delivery valve.g. Adjust the flow using control valve of the Rotameter.h. Note down the force exerted by the jet on the vane indicated by forceindicator. i. Change the flow rate and repeat the above steps
7 Block, Circuit,Model Diagram,Reaction Equation,Expected Graph
8 Observation Table, SL.NO
Dia of Jet
type of vane
Rotameter Reading LPM ‘Qlpm’²
Pressure gauge ‘P’in Kg/Cm
Force Indicator ‘Fa’ Kgf
SL.NO
Jet Dia in mm
Type of vane
Qlpm Actual Force Fain Kgf
Theoretical Force Fth in Kgf
Coefficient ofimpact Ci= Fa/Fth
9 Sample Calculation
10 Graphs, Outputs11 Results & Analysis • Actual Force, Fa in Kgf=
• Theoretical Force, Fth in Kgf=• Co –efficient of Impact = Fa/Fth=
12 Application Areas13 Remarks14 Faculty Signature
with Date
18CVL48/ A&B Copyright ©2017. cAAS. All rights reserved.Page # 23 / 26

BE-4-EC-SKIT-Ph5b1-F02-V2.2LABORATORY PLAN - CAY 2019-20
Experiment 09: Pelton Wheel turbine
- ExperimentNo.:
9 Marks DatePlanned
DateConducted
1 Title Pelton wheel turbine2 Course
Outcomes3 Aim To study performance characteristics of a Pelton Wheel
4 Material /EquipmentRequired
A hydraulic work bench setup containing nozzle for striking jet on plate.Collecting tankStop watchWeights
5 Theory,Formula,Principle,Concept
Turbines are classified as Impulse and Reaction Types. In Impulse Turbine, thehead of the water is completely converted into a jet, which impulse the force onthe Turbine. In Reaction Turbine, it is the pressure of the flowing water, whichrotates the runner of the Turbine. Of many types of Turbine, the Pelton Wheel,most commonly used, falls into this category of Impulse Turbine while theFrancis & Kaplan fall into the category of Reaction Turbines. Normally, PeltonWheel requires high Heads and Low Discharge while the Francis & Kaplan(Reaction Turbines) requires relatively low Heads and high Discharge.
6 Procedure, PROCEDURE:A. TO OBTAIN CONSTANT HEAD CHARACTERISTICS.1.Keep the Delivery valve open at Maximum.2.Set the head at required value.3.Now apply the load.4.Operating the Sphere Rod Assembly, maintain the head to the Setvalue.Repeat the steps 4 and 5 till the maximum load the turbine can take.5.In the meantime, Note down the turbine speed, vacuum head andVenturimeter readings for each loadingsB. TO OBTAIN CONSTANT SPEED CHARACTERISTICS.1.Keep the Delivery valve open at Maximum.2.Now apply the load.3.Operating the Sphere Rod Assembly, maintain the speed tothe Setvalue.Repeat the steps 4 and 5 till the maximum load the turbine can take.4.In the meantime, Note down the turbine speed, vacuum head andVenturimeter readings for each loadings.
7 Block, Circuit,ModelDiagram,ReactionEquation,ExpectedGraph
8 ObservationTable, SL.
NOTurbine speedN rpm
Delivery Pressure`P’ Kg/cm²
Venturimeter Head
Load, Kg
P1 P2 F1 F2 F=F1~F
18CVL48/ A&B Copyright ©2017. cAAS. All rights reserved.Page # 24 / 26

BE-4-EC-SKIT-Ph5b1-F02-V2.2LABORATORY PLAN - CAY 2019-20
Kg/cm²
Kg/cm²
2
9 SampleCalculation
Sl. No Total Head H, m
Discharge Q, m³/sec
IP, KW
OP, KW
Turbine efficiency %
10 Graphs,Outputs
11 Results &Analysis
1)Graphs plotted show the constant head/speed characteristics of the Kaplan turbine.
2)An attempt has been made to provide the facility to understand the variouscomponents of the Kaplan turbine & present the characteristic curves.
18CVL48/ A&B Copyright ©2017. cAAS. All rights reserved.Page # 25 / 26

BE-4-EC-SKIT-Ph5b1-F02-V2.2LABORATORY PLAN - CAY 2019-20
3)The unit head and other quantities are calculated from the knowledge ofconstant head characteristics.4)The numerical values in graphs and design calculations should be looked upon as qualitative figures rather than quantitative ones as some of the components available in the market for constructing the turbine are limited.
12 ApplicationAreas
13 Remarks14 Faculty
Signature withDate
18CVL48/ A&B Copyright ©2017. cAAS. All rights reserved.Page # 26 / 26