Embed Size (px)
Citation preview

sqs.com
SQS – the world’s leading specialist in software quality
8 September 2015 Diederik Vos – CEO René Gawron – CFO
SQS H1 2015 Interim Results
sqs.com
SQS – the world’s leading specialist in software quality
Energy & Utilities
Manufacturing
Insurance Retail & Logistics
Telecommunications
Banking & Financial Services 2015

© SQS Software Quality Systems AG | Results for the 6 months ended 30 June 2015 | 8 September 2015 | 2
Founded more than 30 years ago, we have established ourselves as the leading specialist for smart quality solutions, serving North America, EMEA and APAC. The SQS mission is to shape and drive the most critical and challenging software change initiatives. We support our clients through our deep industry know how and global delivery capability. Driven by our standardised methodology PractiQ®, industrialisation & automation processes.
SQS is the world’s leading specialist in independent software quality services.
About SQS
We focus on customers from six industries: • Banking & Financial Services • Energy & Utilities • Insurance • Manufacturing • Retail & Logistics • Telecommunications

Progress in Profitability, Managed Services and Global Footprint. Margins under Pressure in Regular Testing.
Key Highlights H1 2015
© SQS Software Quality Systems AG | Results for the 6 months ended 30 June 2015 | 8 September 2015 | 3
+ 16% revenue growth with increased market share (11% organic growth)
Growth
Gross Margin Up to 35.9% for Managed Services and up to 34.5%
for Specialist Consulting. Down to 26.4% for RTS.
Capex Investments
Invested €16m in Bit Media / Trissential and €2.4m in India Test Centre resulting in €26.5m net debt
Order Intake Managed Services
€ 153m further improving visibility
Record book to bill ratio of 2.1
Transition of business model
Managed Services largest segment at 48% of total revenues (up from 44% of total)

Focus on Managed Services is yielding results. Challenges in RTS Margin are being addressed.
Achievements H1 2015 and Challenges
© SQS Software Quality Systems AG | Results for the 6 months ended 30 June 2015 | 8 September 2015 | 4
• Managed Services at 48% of total revenues • Record order intake for MS with book to
bill ratio of 2.1 • Successful acquisition of Trissential and Galmont in the USA • Completed European footprint with Bit Media acquisition
Achievements H1 2015
• Margin pressure in Regular Testing Services (RTS) has increased
• Post the period we have taken actions to reduce and disengage from some clients in RTS, reduce overheads and headcount
• Lower macro economic growth forecast across our markets
Challenges

Achievements in the execution of SQS‘ strategy SQS‘ Strategy
© SQS Software Quality Systems AG | Results for the 6 months ended 30 June 2015 | 8 September 2015 | 5
Established global sales and delivery infrastructure in Managed Services engagements
Key Verticals • BFSI • Manufacturing/Automotive • Retail/Logistics
US Presence (47% of world market) • Built SQS US • Acquired Trissential and Galmont
Change and drive all critical software initiatives
Enlarge Specialist Consultancy Services
~ 18% of SQS Group revenue going forward
SQS is innovation leader in industrialised delivery and methodology using own IP
Added Business Analysis, DevOps, Agile and Project Management Services to portfolio

© SQS Software Quality Systems AG | Results for the 6 months ended 30 June 2015 | 8 September 2015 | 6
By adding Trissential and Galmont acquisitions to SQS US, we have built a strong quality specialist services US business.
US Market Coverage
Trissential
IT Programme & Project Management
Onsite Specialist Consulting
SQS US Galmont
Software Testing & Quality Management
Onsite Specialist Consulting + Regular Testing
Nearshore Test Centre (Kentucky)
Offshore Test Centre (India)
Now a $65m revenue organisation, c. 18% of SQS total revenue on full year run rate
Cross selling potential

System Integrators (testing part only)
SQS is the world’s largest testing services specialist by revenue and has moved to # 8 among system integrators.
Competitor Landscape
Source: Nelson Hall Report, 2014; SQS, based on estimated or published 2014/15 revenue figures
(€m)
Cap Gemini
TCS
Wipro
Accenture
HP
Tech Mahindra
© SQS Software Quality Systems AG | Results for the 6 months ended 30 June 2015 | 8 September 2015 | 7
IBM
Infosys
Cognizant
0 250 500 1,000 125
SQS 300m* 317m (incl. acquisitions:
Trissential, and Galmont)
* Current revenue run rate
230
700
790
570
920
250
1,000
500
955
CGI
HCL
295
310
Pure Play Test Specialists
(€m) 350 25 50 100 …………. 0
Qualitest
15 Maverick
MTP
26
43 Cigniti Plan IT
22
Imbus 15
Inspearit 22
15 QA Infotech
Acial 12
RTTS 15
14 Galmont
58
SQS
300m* 317m (incl. acquisitions:
Trissential, Galmont)
World market for software testing: • $15.7bn • 47% in US, 40% in Europe, 13% RoW • Expected CAGR of ~ 7 – 12%
# 1
# 8

8 © SQS Software Quality Systems AG | Results for the 6 months ended 30 June 2015 | 8 September 2015 |
Financials
2004 2005 2006 2007 2008 2009 2010 2011 2012 2013 2014 2004 2005 2006 2007 2008 2009 2010 2011 2012 2013 2014 2015
© SQS Software Quality Systems AG | Results for the 6 months ended 30 June 2015 | 8 September 2015 | 9
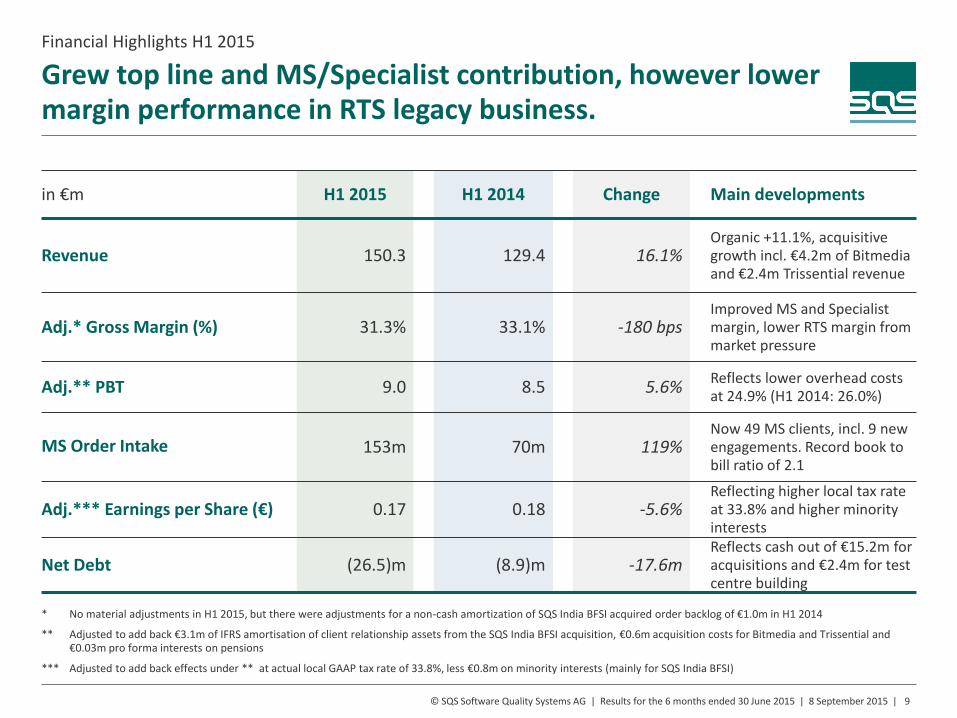
Financial Highlights H1 2015
in €m H1 2015 H1 2014 Change Main developments
Revenue 150.3 129.4 16.1% Organic +11.1%, acquisitive growth incl. €4.2m of Bitmedia and €2.4m Trissential revenue
Adj.* Gross Margin (%) 31.3% 33.1% -180 bps Improved MS and Specialist margin, lower RTS margin from market pressure
Adj.** PBT 9.0 8.5 5.6% Reflects lower overhead costs at 24.9% (H1 2014: 26.0%)
MS Order Intake 153m 70m 119% Now 49 MS clients, incl. 9 new engagements. Record book to bill ratio of 2.1
Adj.*** Earnings per Share (€) 0.17 0.18 -5.6% Reflecting higher local tax rate at 33.8% and higher minority interests
Net Debt (26.5)m (8.9)m -17.6m Reflects cash out of €15.2m for acquisitions and €2.4m for test centre building
Grew top line and MS/Specialist contribution, however lower margin performance in RTS legacy business.
* No material adjustments in H1 2015, but there were adjustments for a non-cash amortization of SQS India BFSI acquired order backlog of €1.0m in H1 2014
** Adjusted to add back €3.1m of IFRS amortisation of client relationship assets from the SQS India BFSI acquisition, €0.6m acquisition costs for Bitmedia and Trissential and €0.03m pro forma interests on pensions
*** Adjusted to add back effects under ** at actual local GAAP tax rate of 33.8%, less €0.8m on minority interests (mainly for SQS India BFSI)
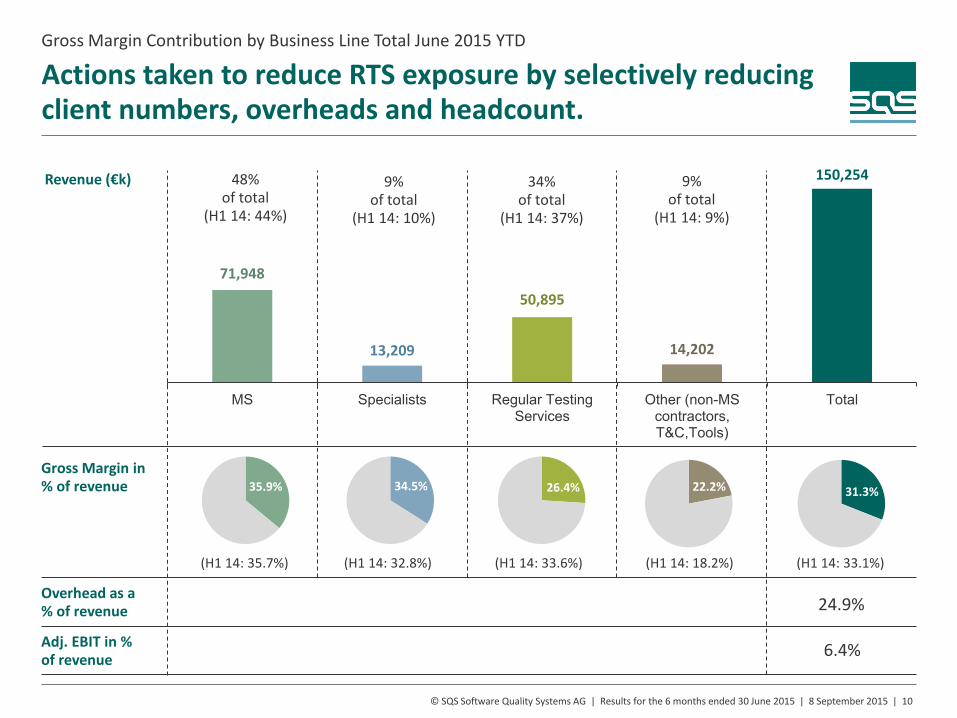
Actions taken to reduce RTS exposure by selectively reducing client numbers, overheads and headcount.
Gross Margin Contribution by Business Line Total June 2015 YTD
© SQS Software Quality Systems AG | Results for the 6 months ended 30 June 2015 | 8 September 2015 | 10
71,948
13,209
50,895
14,202
150,254
MS Specialists Regular TestingServices
Other (non-MScontractors,T&C,Tools)
Total
Revenue (€k)
Gross Margin in % of revenue 35.9%
48% of total
(H1 14: 44%)
Overhead as a % of revenue
6.4%
24.9%
34.5% 22.2% 31.3%
9% of total
(H1 14: 10%)
9% of total
(H1 14: 9%)
34% of total
(H1 14: 37%)
26.4%
Adj. EBIT in % of revenue
(H1 14: 35.7%) (H1 14: 32.8%) (H1 14: 33.6%) (H1 14: 18.2%) (H1 14: 33.1%)

Further Financial Metrics
© SQS Software Quality Systems AG | Results for the 6 months ended 30 June 2015 | 8 September 2015 | 11
Net Debt/ Net Cash
-26.5
9.8
-8.9
-2.9
-10.3
-7.9
-12,3
(in m€)
FY 2011
FY 2012
H1 2013*
FY 2013
H1 2014*
H1 2015*
*Net debt higher at H1 due to typical seasonality
FY 2014
Acquisitions SQS India Test Centre
Normalised net debt
15.2m 2.4m 8.9m
Typical H1 Seasonality on Operating Cash Flow, €18m investment cashout for acquisitions/test centre expansion.
Number of clients / Average revenue
551
335k
486 424k 468 474k
423
634k
385
769k
2011 2012 2013 2014 H1 2015
2011 2012 2013 2014 H1 2015
Annualised H1 2015
Seasonality in debtor days: • YE 2013 – 64 • H1 2014 – 82 • YE 2014 – 72 • H1 2015 – 84
Adj. PBT €9.0m
WIP increase €-5.4m
Receivables up €-5.1m
Trade Payables down €-4.6m
Other €1.5m
Operating Cash Flow*
€-4.6m
Operating Cash Flow
*see remark on slide 18
Capex
0

36% (-2%)*
16% ( -)*
14% (-1%)*
12% (-)*
7%
4%
6%
5%
33%
17% 11%
8%
8%
6%
4%
8% 5%
Focus verticals
Banking & Financial Services
Retail, Logistics & Services
Insurance
Manufacturing
Energy & Utilities
Telecom- munication
Other
Government & Public
Germany
UK Switzerland
Nordic
Rest of World (ASIA/SA/ME)
Rest of Europe
Continued diversification in verticals and regional split. Revenue Split
© SQS Software Quality Systems AG | Results for the 6 months ended 30 June 2015 | 8 September 2015 | 12
Revenue by geographies Revenue by industries
H1 2015 Revenue: €150.3 m (+16% YoY)
* Change to FY 2014
-
-
- o
o
+ o
+/- Change to FY 2014
Austria
Ireland +
USA +
13 © SQS Software Quality Systems AG | Results for the 6 months ended 30 June 2015 | 8 September 2015 |
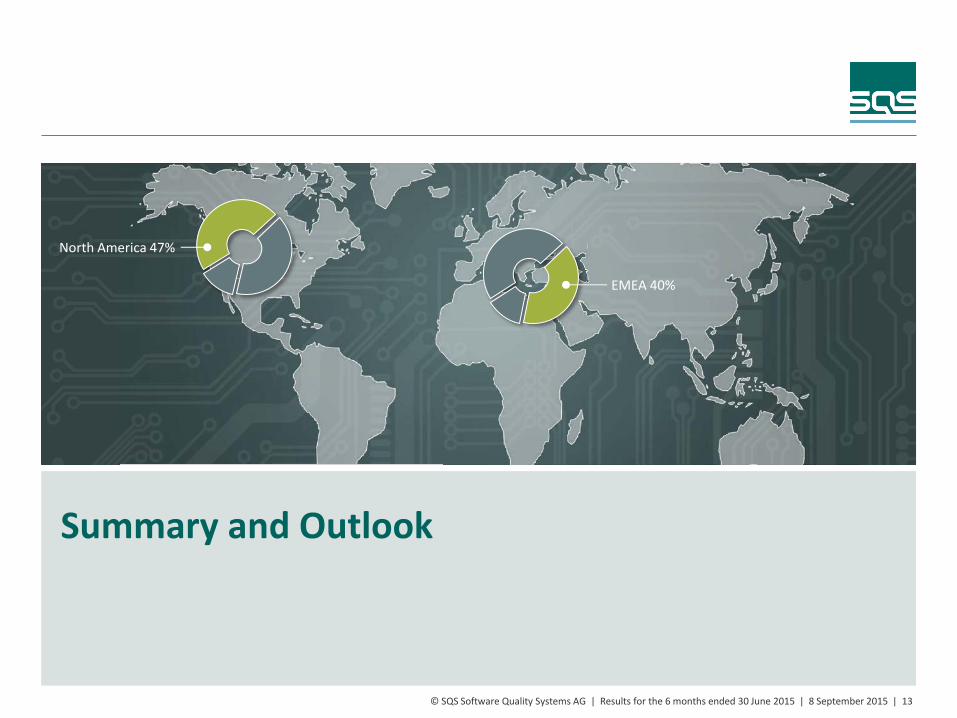
Summary and Outlook
EMEA 40%
North America 47%
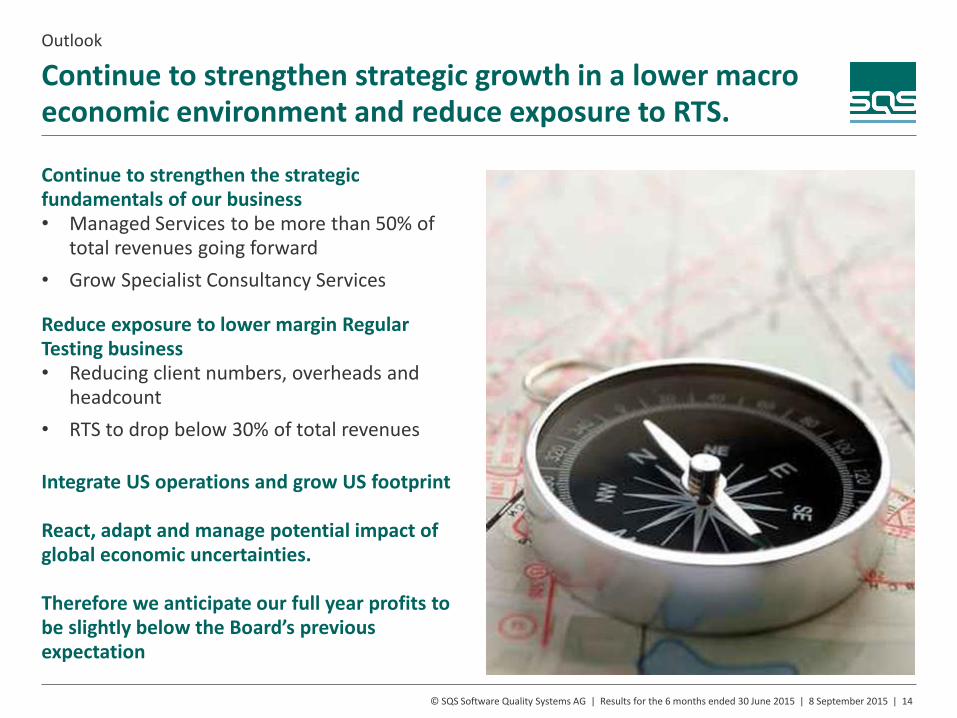
Continue to strengthen strategic growth in a lower macro economic environment and reduce exposure to RTS.
Outlook
© SQS Software Quality Systems AG | Results for the 6 months ended 30 June 2015 | 8 September 2015 | 14
Continue to strengthen the strategic fundamentals of our business • Managed Services to be more than 50% of
total revenues going forward • Grow Specialist Consultancy Services
Reduce exposure to lower margin Regular Testing business • Reducing client numbers, overheads and
headcount • RTS to drop below 30% of total revenues
Integrate US operations and grow US footprint React, adapt and manage potential impact of global economic uncertainties. Therefore we anticipate our full year profits to be slightly below the Board’s previous expectation

15 © SQS Software Quality Systems AG | Results for the 6 months ended 30 June 2015 | 8 September 2015 |
Appendix
2014
2013
2012
2011
2015

Revenue up by 16% YoY. Profit & Loss Statement
© SQS Software Quality Systems AG | Results for the 6 months ended 30 June 2015 | 8 September 2015 | 16
in €’000 HY 1/2015 HY 1/2014 Change YE 2014 in % of
sales in % of
sales HY 1
2015/2014 in % of
sales
Revenue 150,254 129,366 16.1% 268,483 Adj. Gross Profit 46,985 31.3% 42,791 33.1% 9.8% 89,555 33.4%
G&A S&M R&D
24,816 10,897
1,712
16.5% 7.3% 1.1%
22,091 10,098
1,448
17.1% 7.8% 1.1%
12.3% 7.9%
18.2%
45,250 20,720
3,815
16.9% 7.7% 1.4%
EBITDA Depreciation
12,624 3,064
8.4% 2.0%
11,849 2,696
9.2% 2.1%
6.5% 13.6%
25,820 6,049
9.6% 2.3%
Adj. EBIT 9,560 6.4% 9,153 7.1% 4.4 % 19,771 7.4%
Net interest financial Exchange rate loss/gain
-519 -70
-576 -84
-9.9% -16.7%
-1,049 66
Adj. PBT 8,971 6.0% 8,492 6.6% 5.6% 18,788 7.0% IFRS regular amortisation on acquisitions
Acquisition costs and IFRS pro forma interests on pension
-3,145
-630
-4,399
-370
-8,202
-460
PBT 5,196 3.5% 3,723 2.9% 39.6% 10,126 3.8% Taxes -1, 316 -1,118 17.7% -3,266 Profit after taxes 3, 880 2.6% 2,605 2.0% 48.9 % 6,860 2.6%
Primarily SQS India BFSI purchase price amortisation (non cash effects)

Typical mid year increase of receivables and work in progress; debtor days at 84 (H1 2014: 82).
Balance Sheet
© SQS Software Quality Systems AG | Results for the 6 months ended 30 June 2015 | 8 September 2015 | 17
in €’000 HY 1/2015 HY 1/2014 YE 2014
Assets Non current assets 118,891 90,521 87,910
Goodwill Intangible assets Other assets (e.g. fixed assets, financial assets)
83,354 18,632 16,905
55,096 20,732 14,693
55,836 18,470 13,604
Current assets 109,982 92,349 96,073
Cash Trade receivables Work in progress Other receivables (e.g. tax receivables)
18,308 71,319 12,089
8,266
17,024 54,391 14,799
6,135
26,297 57,995
7,736 4,045
Total assets 228,873 182,870 183,983
Equity and Liabilities Current liabilities 87,507 58,721 51,111
Bank loans & overdrafts Trade creditors Short term liabilities for acquisitions (25% SQS Pune)
Other short term liabilities (mostly staff accruals)
Tax accruals and liabilities
34,511 7,883
10,613 24,498 10,002
14,096 6,197 6,812
23,563 8,053
5,463 10,763
7,978 16,753 10,154
Non current liabilities 25,332 21,297 28,996
Bank loans Long term liabilities for acquisitions Other non current liabilities (mainly deferred tax liabilities)
10,310 894
14,128
11,797 0
9,500
11,000 7,977
10,019
Equity/Net Assets 116,034 102,852 103,876
Total liabilities 228,873 182,870 183,983
= items counted under net debt
Bit Media and Trissential posted 100% under goodwill while PPA is still pending
Borrowings increased by €28m (since 31 Dec 14) to primarily fund investment activities

Operating cash flow impacted by seasonality and above average BFSI / Bit Media debtor days.
Cash Flow Statement
© SQS Software Quality Systems AG | Results for the 6 months ended 30 June 2015 | 8 September 2015 | 18
in €’000 HY 1/2015 HY 1/2014 YE 2014
Net cash flow from
Operating activities* -4,648 -2,600 26,623
Interest payments Tax payments
-619 -3,065
-598 -2,480
-1,467 -5,594
Current business activities -8,332 -5,678 19,562
Acquisition and capitalization of tangible / intangible assets (w/o goodwill) Acquisition of subsidiaries (Bit Media/Trissential/*)
Foreign currency result / interest received
-6,818
-15,202 -40
-3,575 7,524
21
-7,956 7,524
477
Investment activities -22,060 3,970 45
Dividend payments / Minority effects Increase of capital Payment for acquisition of non controlling interests Net change of finance loans Redemption / termination of leasing contracts
-3,973 194
-425 25,834
-176
-2,751 117
0 6,293 -348
-3,409 205
-1,800 -3,138
-694
Financing activities 21,454 3,311 -8,836
Changes in cash due to forex / consolidation effects TS 949 173 278
Cash at beginning 26,297 15,248 15,248
Cash at end 18,308 17,024 26,297
* For H1 2015 we have re-classified -599k of acquisition costs to investment activities, to make numbers comparable to previous periods

Adj. EPS slightly lower due to higher tax rate and minorities. Earnings per Share (EPS)
© SQS Software Quality Systems AG | Results for the 6 months ended 30 June 2015 | 8 September 2015 | 19
in €’000 HY 1/2015 HY 1/2014 Change YE 2014
PBT reported 5,196 3,723 39.6% 10,126
IFRS regular amortisation on acquisitions & acquisition costs Acquisition costs and IFRS pro forma interests on pension Taxes on income of operations local GAAP Minority interests
3,145
630
-3,032 -803
4,399
370
-2,505 -550
8,202
460
-4,954 -819
Profit after taxes adjusted 5,136 5,437 -5.5% 13,015
Weighted average number of shares undiluted 30,623,823 30,562,679 30,562,679
EPS adjusted in € 0.17 0.18 -5.6% 0.43

Backup
© SQS Software Quality Systems AG | Results for the 6 months ended 30 June 2015 | 8 September 2015 | 20
In k€ HY 1/2015
Accruals Bonus 4,780 Holiday 4,110 Outstanding invoices 3,416 Personnel (travel/partial retirement) 3,093 Social securities 641 Other 1,491 Audit 191 Warranties 0 Sub-total 17,722
Other liabilities Social securities 2,777 Current liabilities other (travel/rent/VAT) 2,159 Leasing 135 Wages/travel 922 Sub-total 5,993
Accrued Expenses Deferred income 783
Total 24,498
Other short term liabilities, 30 June 2015

Backup
© SQS Software Quality Systems AG | Results for the 6 months ended 30 June 2015 | 8 September 2015 | 21
In k€ Goodwill Intangible assets
(e.g. client relationship)
Total
UK 31,702 31,702
Triton (MC Insurance) 9,100 9,100
India 9,439 9,439
Thinksoft TS 4,527 9,220 13,747
Nordic 2,866 2,866
Netherlands 555 555
Bit Media (*PPA still pending) 4,735 4,735
Trissential (*PPA still pending) 20,195 20,195
Other companies 235 235
Sub-total 83,354 9,220 92,574
Software (SAP/Microsoft) 3,148 3,148
R&D (SQS Tools/ PractiQ) 6,045 6,045
Other 219 219
Total 83,354 18,632 101,986
Goodwill & Intangibles, 30 June 2015

Meeting market trends through offering the leading services portfolio in software quality.
Portfolio/Market trends
© SQS Software Quality Systems AG | Results for the 6 months ended 30 June 2015 | 8 September 2015 | 22
Managed Services Digital Transformation
Telematics & Cloud solutions
Domain Expertise Mobility
Vendor Release
Customer Release
Proven Product & Industry Assets
Re-usable Product & Industry Assets
Automation Assets
Proven Product
SW Product Testing
Product Vendor
-usable Product
SW Integration Testing
Product Customer
SW in Operation
Product Customer
SQS Certification
Dev/Ops integration
Industrialisation Big data testing strategy

Managed Services Order Backlog
© SQS Software Quality Systems AG | Results for the 6 months ended 30 June 2015 | 8 September 2015 | 23
Record order intake of €153m from 9 new MS clients and contract extensions.
Order intake
2009 2010 2012 2011 2013 2014
€10m
€51m
€66.5m
€101m
€112.5m
€142m
€153m
H1 2015

Shareholders
© SQS Software Quality Systems AG | Results for the 6 months ended 30 June 2015 | 8 September 2015 | 24
Octopus Investments 12.1%
Herald Investment Mgt 6.0%
Miton Asset Mgmt. 5.9%
Legal & General 4.6%
Investec Asset Mgt 3.6%
River & Mercantile Asset Mgmt. 2.6%
BlackRock Investment Mgmt. 2.6%
Charles Stanley 2.5%
Schroder Investment 2.4%
Standard Life 2.4%
Henderson Global Investors 2.0%
JO Hambro Capital Mgmt. 2.0%
BA Pension Investment Mgmt. 1.7%
Rathbone Investment Mgmt. 1.7%
Hargreave Hale 1.6%
Brooks Macdonald Asset Mgmt. 1.2%
Allianz Global Investors 1.0% Sub-Total 55.9%
Major Institutional Shareholders > 1%
Source: Equiniti Investor Analytics 08/2015
Founders (van Megen/Bons) 25.0%
Earn Out Shareholders/Employees 1.2%
Sub-Total 26.2%
Individual Shareholders
Our largest institutional shareholders hold more than 55% of SQS’ issued shares.

The number of shares in issue will continue to increase from consideration shares from acquisitions.
Issued Share Capital
Actual and estimated weighted (undiluted) average number of shares in issue:
2012 27,893k shares (actual)
2013 28,211k shares (actual)
2014 30,563k shares (actual) + (2,099k weighted stock options)
2015 31,044k shares (forecast) + (2,330k weighted stock options)
2016 32,307k shares (forecast)
2017 33,036k shares (forecast)
© SQS Software Quality Systems AG | Results for the 6 months ended 30 June 2015 | 8 September 2015 | 25

SQS runs eight off- and near-shore Test Centres with more than 2,000 employees.
About SQS
© SQS Software Quality Systems AG | Results for the 6 months ended 30 June 2015 | 8 September 2015 | 26
Görlitz, Germany
Durban, South Africa Chennai I, India Chennai II, India
Pune, India Cairo, Egypt
Belfast, UK Güssing, Austria Mumbai, India
Chennai I, India Chennai II, India Durban, South Africa
Pune, India Cairo, Egypt
Güssing, Austria

Thank you for your attention
© SQS Software Quality Systems AG | Results for the 6 months ended 30 June 2015 | 8 September 2015 | 27