Embed Size (px)
Citation preview
SPY 627:Survey Level Assessment
Rachel Brown-Chidsey, Ph.D.Associate Professor of School Psychology
University of Southern [email protected]
907-355-7328
© Brown-Chidsey, 2009 2
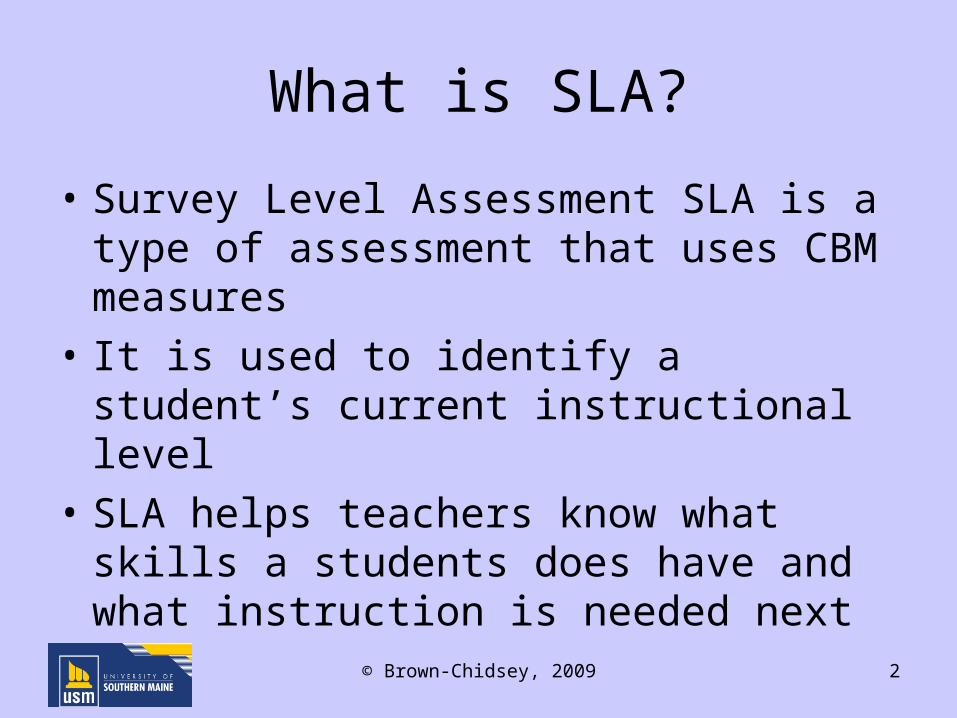
What is SLA?
• Survey Level Assessment SLA is a type of assessment that uses CBM measures
• It is used to identify a student’s current instructional level
• SLA helps teachers know what skills a students does have and what instruction is needed next
© Brown-Chidsey, 2009 3
Why Use SLA??
• SLA provides information about what a student CAN do instead of what a student CANNOT do
• SLA starts with the hardest items first and works “backward” the easier ones
• The student ends the testing session completing tasks s/he can do
• SLA shows teachers where instruction needs to start
© Brown-Chidsey, 2009 4
How Do I Do SLA?
• SLA involves using specific CBM items in the areas of reading, spelling, writing, and math
• Start by gathering the Benchmark probes for the students current grade level and at least 3 grades below that level– Example, if a student is in 4th grade, get the
4th, 3rd, 2nd, and 1st probes
How to Do SLA, cont’d.
• Set up a testing time of about 15 minutes
• Explain to the student that s/he will complete a number of test items that will start hard and get easier
• Begin by testing with the highest level items; give all 3 items for that level
© Brown-Chidsey, 2009 5
How to Do SLA, cont’d.
• Test sequentially “backwards” until you have given all 3 items at the level which the student can complete with 95% accuracy
• Example order:– 3 -- 4th grade items (check accuracy)– 3 -- 3rd grade items (check accuracy)– 3 -- 2nd grade items (check accuracy)– 3 -- 1st grade items (check accuracy)
© Brown-Chidsey, 2009 6
Summarizing SLA Data
• The easiest way to summarize SLA data is with a table which shows the number correct, the number of errors and the median for each grade– Median score is used as the estimate of performance
for that level– Median is the middle score of the 3 given– When two scores are the same, that’s the median
• Note that the median corrects and median errors may not be from the same item
© Brown-Chidsey, 2009 7
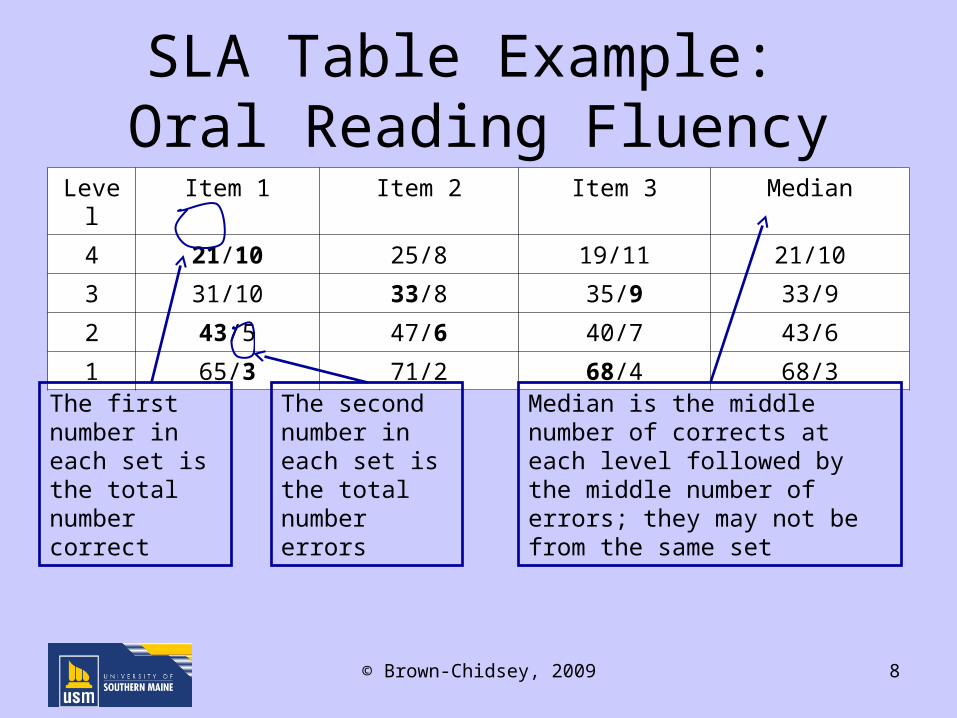
SLA Table Example: Oral Reading Fluency
Level Item 1 Item 2 Item 3 Median
4 21/10 25/8 19/11 21/10
3 31/10 33/8 35/9 33/9
2 43/5 47/6 40/7 43/6
1 65/3 71/2 68/4 68/3
© Brown-Chidsey, 2009 8
The first number in each set is the total number correct
The second number in each set is the total number errors
Median is the middle number of corrects at each level followed by the middle number of errors; they may not be from the same set
Calculating Accuracy
• Once a summary of the data has been created, the next step is to calculate accuracy.
• This is done by dividing the median correct by that number corrects plus median errors
• Example: 21/31 = 67% accuracy at 4th grade
© Brown-Chidsey, 2009 9
Comparing Scores
© Brown-Chidsey, 2009 10
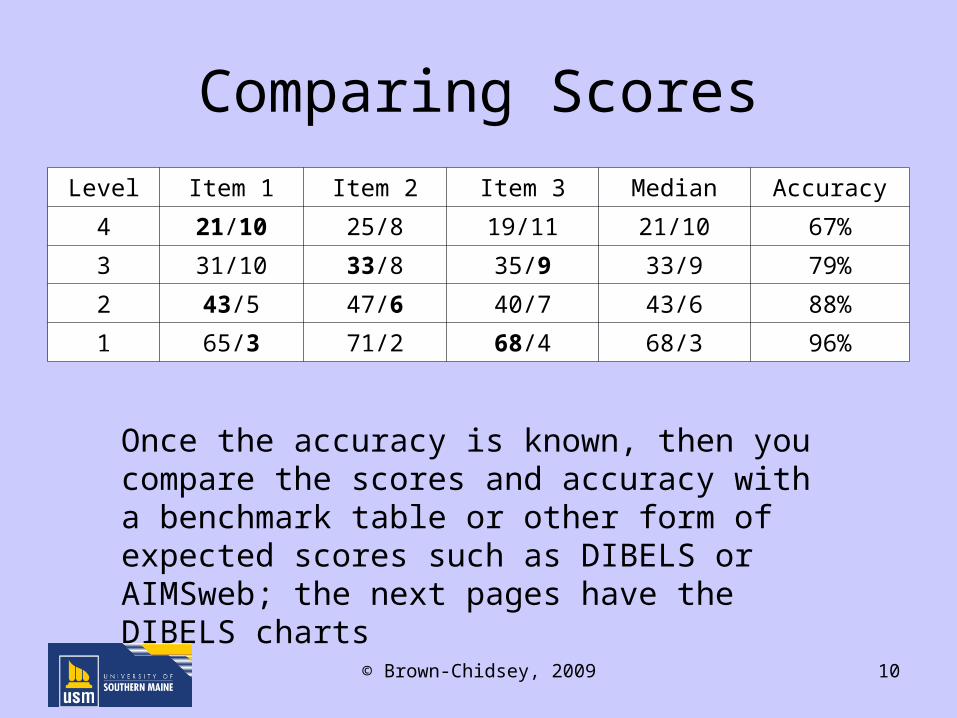
Level Item 1 Item 2 Item 3 Median Accuracy
4 21/10 25/8 19/11 21/10 67%
3 31/10 33/8 35/9 33/9 79%
2 43/5 47/6 40/7 43/6 88%
1 65/3 71/2 68/4 68/3 96%
Once the accuracy is known, then you compare the scores and accuracy with a benchmark table or other form of expected scores such as DIBELS or AIMSweb; the next pages have the DIBELS charts
© Brown-Chidsey, 2009 11
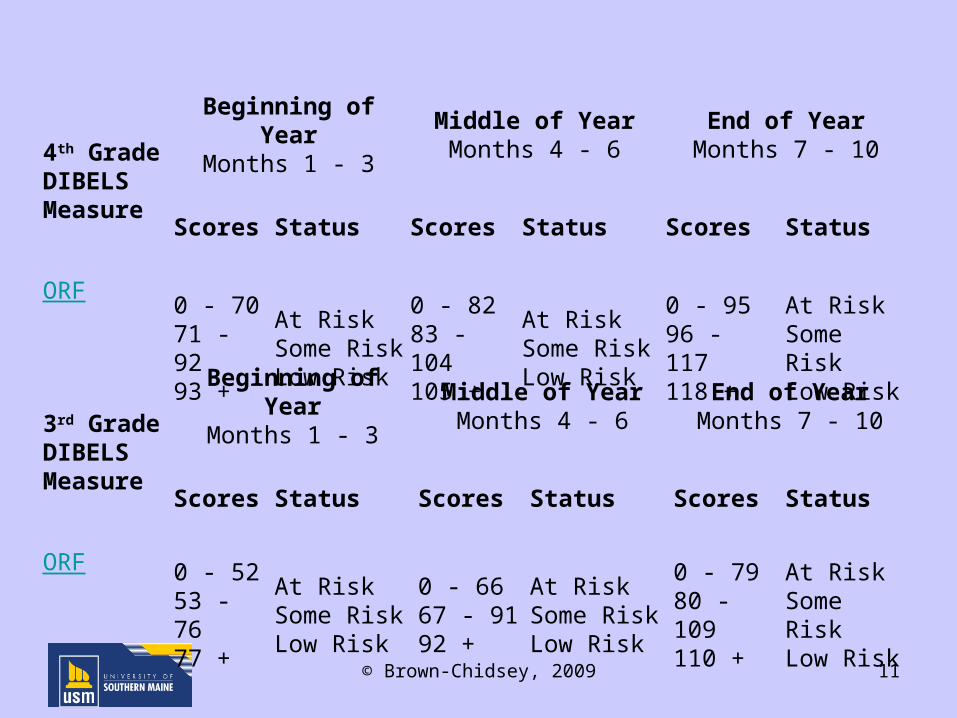
4th GradeDIBELS Measure
Beginning of YearMonths 1 - 3
Middle of YearMonths 4 - 6
End of YearMonths 7 - 10
Scores Status Scores Status Scores Status
ORF 0 - 7071 - 9293 +
At RiskSome RiskLow Risk
0 - 8283 - 104105 +
At RiskSome RiskLow Risk
0 - 9596 - 117118 +
At RiskSome RiskLow Risk
3rd Grade DIBELS Measure
Beginning of YearMonths 1 - 3
Middle of YearMonths 4 - 6
End of YearMonths 7 - 10
Scores Status Scores Status Scores Status
ORF 0 - 5253 - 7677 +
At RiskSome RiskLow Risk
0 - 6667 - 9192 +
At RiskSome RiskLow Risk
0 - 7980 - 109110 +
At RiskSome RiskLow Risk
© Brown-Chidsey, 2009 12
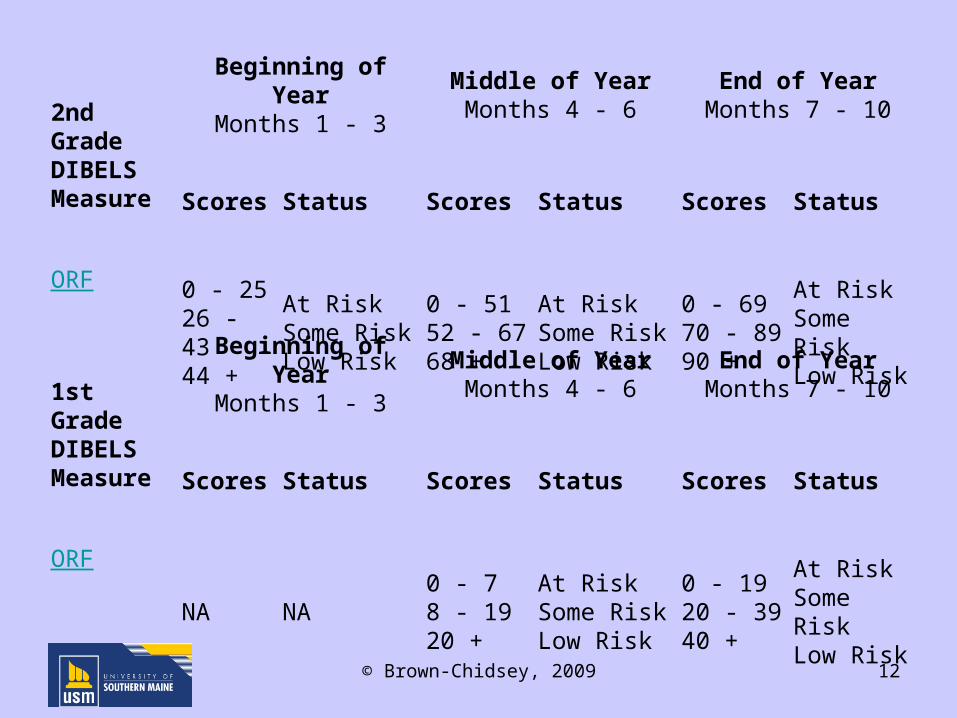
2nd Grade DIBELS Measure
Beginning of YearMonths 1 - 3
Middle of YearMonths 4 - 6
End of YearMonths 7 - 10
Scores Status Scores Status Scores Status
ORF 0 - 2526 - 4344 +
At RiskSome RiskLow Risk
0 - 5152 - 6768 +
At RiskSome RiskLow Risk
0 - 6970 - 8990 +
At RiskSome RiskLow Risk
1st Grade DIBELS Measure
Beginning of YearMonths 1 - 3
Middle of YearMonths 4 - 6
End of YearMonths 7 - 10
Scores Status Scores Status Scores Status
ORFNA NA
0 - 78 - 1920 +
At RiskSome RiskLow Risk
0 - 1920 - 3940 +
At RiskSome RiskLow Risk
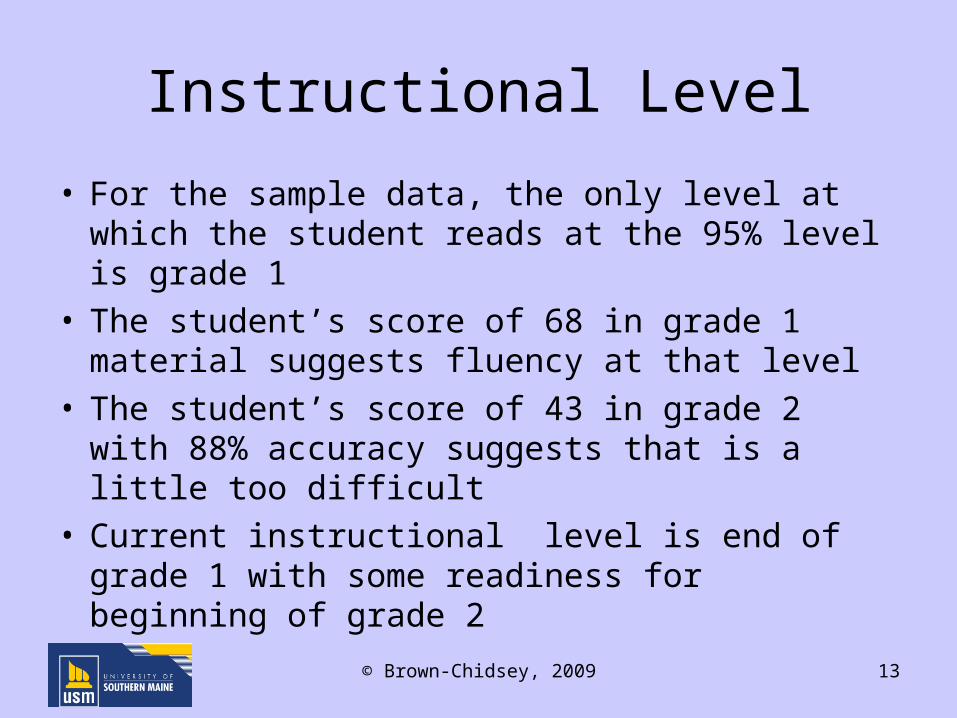
Instructional Level
• For the sample data, the only level at which the student reads at the 95% level is grade 1
• The student’s score of 68 in grade 1 material suggests fluency at that level
• The student’s score of 43 in grade 2 with 88% accuracy suggests that is a little too difficult
• Current instructional level is end of grade 1 with some readiness for beginning of grade 2
© Brown-Chidsey, 2009 13
Error Analysis
• After determining instructional level, the next step is to conduct an error analysis
• This includes looking at the error patters and classifying the reading errors by type
• This will help with specific instructional planning
© Brown-Chidsey, 2009 14
© Brown-Chidsey, 2009 15
Summary
• SLA is a system of identifying a student’s current instructional level
• It includes testing the students with CBM probes in a sequential, backwards, way
• The level of material the student can do with 95% accuracy is the current instructional level