Embed Size (px)
Citation preview

Spring Travel Coronavirus- MarchFieldwork Dates: 5th - 6th March 2020
Conducted by YouGovYouGov Realtime
© YouGov plc 2020

BACKGROUND
This spreadsheet contains survey data collected and analysed by YouGov plc.
Methodology: This survey has been conducted using an online interview administered to members of the YouGov Plc panel of individuals who have agreed to take part in surveys. Emails are sent to panelists selected at random from the base sample. The e-mail invites them to take part in a survey and provides a generic survey link. Once a panel member clicks on the link they are sent to the survey that they are most required for, according to the sample definition and quotas. (The sample definition could be "US adult population" or a subset such as "US adult females"). Invitations to surveys don’t expire and respondents can be sent to any available survey. The responding sample is weighted to the profile of the sample definition to provide a representative reporting sample. The profile is normally derived from census data or, if not available from the census, from industry accepted data.YouGov plc make every effort to provide representative information. All results are based on a sample and are therefore subject to statistical errors normally associated with sample-based information.
For further information about the results in this spreadsheet, please email [email protected] quoting the survey details
EDITOR'S NOTES - all press releases should contain the following information
All figures, unless otherwise stated, are from YouGov Plc. Total sample size was 1124 adults. Fieldwork was undertaken between 5th - 6th March 2020. The survey was carried out online. The figures have been weighted and are representative of all US adults (aged 18+).
- YouGov is registered with the Information Commissioner- YouGov is a member of the British Polling Council
Any percentages calculated on bases fewer than 50 respondents must not be reported as they do not represent a wide enough cross-section of the target population to be considered statistically reliable. These figures will be italicised.

YouGov RealtimeSpring Travel Coronavirus- MarchUS_nat_int Sample: 5th - 6th March 2020
Male FemaleGen Z (2000 and
later)Millennial (1982-
1999)Gen X (1965-
1981)Baby Boomer
(1946-1964)
Silent Generation (1928-1945)
Pre-Silent Generation (1927 and
earlier)
Other Northeast Midwest South West White
A B C D E F G H I J K L M Nrrw_q1. How many, if any, separate leisure trips (i.e., any trip not for business or work) do you plan to take this spring (i.e., from March 20th to June 20th)?
Unweighted base 1124 514 610 42 344 325 342 71 - - 194 220 411 299 768Base: All US Adults 1124 546 578 53 335 307 352 78 - - 200 236 423 265 747
None 46% 48% 44% 29% 40% 47% 50% 57% - - 48% 48% 43% 47% 48%** D D* ** ** Q
1 22% 22% 22% 20% 19% 21% 25% 24% - - 24% 23% 18% 25% 23%** * ** **
2 14% 13% 14% 12% 17% 15% 11% 7% - - 10% 16% 15% 12% 15%** F.G * ** **
3 5% 4% 5% 16% 6% 5% 3% 1% - - 4% 3% 6% 5% 3%** * ** **
4 1% 1% 1% 1% 1% 2% 1% - - - 1% 1% 1% 1% 1%** * ** **
5 or more trips 2% 2% 1% - 2% 2% 1% 3% - - 0% 0% 2% 2% 1%** * ** **
Don't know 11% 10% 13% 23% 15% 8% 9% 7% - - 12% 9% 14% 8% 8%** E.F * ** ** M
Net: At least one trip 43% 43% 44% 49% 45% 44% 41% 36% - - 40% 43% 43% 45% 44%** * ** **
rrw_q2. Approximately how much do you expect to spend, in total, on leisure travel this spring?
Unweighted base 487 224 263 19 153 144 145 26 - - 80 96 179 132 334Base: All US Adults planning to take at least one leisure trip this
spring484 232 251 25 150 136 144 28 - - 81 102 181 120 330
Less than $100 5% 3% 6% 7% 8% 3% 3% 4% - - 3% 9% 3% 5% 5%** ** ** ** * L*
$101-$200 11% 11% 11% 32% 10% 10% 10% 10% - - 16% 15% 7% 11% 10%** ** ** ** * L*
$201-$300 9% 6% 12% - 8% 7% 13% 20% - - 8% 8% 10% 11% 10%A ** ** ** ** * *
$301-$400 10% 13% 8% 6% 15% 7% 10% 3% - - 12% 6% 13% 8% 8%** ** ** ** * *
$401-$500 11% 11% 12% 29% 10% 13% 9% 9% - - 11% 7% 14% 12% 12%** ** ** ** * *
$501-$600 11% 12% 11% 14% 12% 16% 8% 4% - - 12% 13% 13% 8% 11%** F ** ** ** * *
$601-$700 5% 4% 5% - 6% 6% 3% 4% - - 5% 3% 4% 7% 5%** ** ** ** * *
$701-$800 6% 7% 4% 9% 8% 4% 5% - - - 4% 4% 8% 6% 5%** ** ** ** * *
$801-$900 3% 3% 3% 2% 4% 2% 3% 4% - - 1% 1% 4% 3% 3%** ** ** ** * *
$901-$1000 9% 8% 9% - 5% 9% 10% 21% - - 12% 7% 8% 8% 9%** ** ** ** * *
More than $1000 20% 22% 18% - 15% 23% 25% 20% - - 18% 27% 16% 21% 22%** D ** ** ** * L* O
rrw_q3. Which, if any, of the following types of trips do you plan to take this spring? Please select all that apply.
Unweighted base 487 224 263 19 153 144 145 26 - - 80 96 179 132 334Base: All US Adults planning to take at least one leisure trip this
spring484 232 251 25 150 136 144 28 - - 81 102 181 120 330
Family trip (i.e., visiting relatives) 35% 27% 42% 19% 27% 33% 49% 37% - - 36% 45% 32% 31% 39%A ** D.E ** ** ** * L.M* P
Total
Gender Generation Region Race

YouGov RealtimeSpring Travel Coronavirus- MarchUS_nat_int Sample: 5th - 6th March 2020
rrw_q1. How many, if any, separate leisure trips (i.e., any trip not for business or work) do you plan to take this spring (i.e., from March 20th to June 20th)?
Unweighted base 1124Base: All US Adults 1124
None 46%
1 22%
2 14%
3 5%
4 1%
5 or more trips 2%
Don't know 11%
Net: At least one trip 43%
rrw_q2. Approximately how much do you expect to spend, in total, on leisure travel this spring?
Unweighted base 487Base: All US Adults planning to take at least one leisure trip this
spring484
Less than $100 5%
$101-$200 11%
$201-$300 9%
$301-$400 10%
$401-$500 11%
$501-$600 11%
$601-$700 5%
$701-$800 6%
$801-$900 3%
$901-$1000 9%
More than $1000 20%
rrw_q3. Which, if any, of the following types of trips do you plan to take this spring? Please select all that apply.
Unweighted base 487Base: All US Adults planning to take at least one leisure trip this
spring484
Family trip (i.e., visiting relatives) 35%
TotalBlack Hispanic Other (NET)
No HS, High school graduate
Some college, 2-year 4-year Post Grad Married Civil Partnership
Living together, not married or
civil partnership
In a relationship, not living together
NET: In a relationship Single Divorced
O P Q R S T U V W X Y Z AA AB
133 151 72 405 380 215 124 495 24 72 44 635 297 104133 176 67 453 348 205 117 481 23 73 41 618 292 11243% 42% 35% 53% 44% 39% 33% 42% 44% 48% 27% 42% 50% 64%
* S.T.U U ** Y* * Y Y.Z V.Y.Z.AA*17% 21% 19% 16% 24% 24% 31% 26% 24% 15% 43% 26% 18% 14%
* R R R AA.AB ** * V.X.Z.AA.AB.AC* X.AA.AB *13% 12% 12% 11% 12% 17% 22% 17% 7% 19% 13% 17% 10% 11%
* R R.S AA ** AA* * AA *5% 8% 11% 4% 5% 7% 4% 5% 17% 1% 4% 5% 6% 2%
N N* ** * * *1% 0% - 0% 1% 3% 1% 1% - 2% - 1% 1% -
* R.S ** * * *- 3% 1% 1% 1% 2% 2% 1% 4% - - 1% 1% 2%
* ** * * *22% 13% 22% 13% 12% 8% 7% 8% 4% 14% 14% 9% 14% 7%
N N* ** * * V.Z *35% 45% 43% 34% 43% 53% 60% 50% 52% 38% 60% 49% 36% 29%
* R R.S R.S AA.AB ** * X.AA.AB.AC* AA.AB *
49 71 33 134 165 114 74 248 12 27 26 313 107 31
46 79 29 152 151 109 71 242 12 28 24 306 107 32
4% 4% 10% 8% 6% 1% 4% 4% 7% 7% 3% 5% 7% -* * * T * ** ** ** * **
24% 10% - 11% 15% 9% 6% 8% - 6% 15% 8% 24% 11%N.Q* * * * ** ** ** V.Z* **13% 7% 2% 11% 7% 10% 12% 8% 8% 6% 6% 8% 9% 19%* * * * ** ** ** * **
12% 21% 8% 16% 10% 5% 6% 10% 8% 4% 11% 10% 12% 12%* N* * T * ** ** ** * **8% 9% 20% 12% 12% 8% 15% 11% 30% 15% 27% 13% 9% 3%* * * * ** ** ** V * **
14% 8% 22% 10% 14% 9% 12% 10% 14% 19% 11% 11% 11% 12%* * * * ** ** ** * **3% 4% 6% 3% 5% 6% 5% 5% - - 8% 4% 6% 6%* * * * ** ** ** * **9% 6% 3% 8% 4% 5% 6% 6% 19% 6% 4% 6% 4% 3%* * * * ** ** ** * **- 3% 7% 2% 4% 3% 3% 4% - 3% 4% 4% - 5%* * * * ** ** ** * **6% 10% 9% 8% 7% 12% 8% 9% - 18% 7% 9% 5% 6%* * * * ** ** ** * **8% 17% 12% 12% 17% 32% 23% 25% 15% 15% 4% 22% 12% 24%* * * R.S R* Z.AA ** ** ** AA * **
49 71 33 134 165 114 74 248 12 27 26 313 107 31
46 79 29 152 151 109 71 242 12 28 24 306 107 32
30% 23% 36% 29% 39% 38% 35% 39% 23% 36% 32% 38% 27% 38%* * * * AA ** ** ** * **
Marital StatusRace Education

YouGov RealtimeSpring Travel Coronavirus- MarchUS_nat_int Sample: 5th - 6th March 2020
rrw_q1. How many, if any, separate leisure trips (i.e., any trip not for business or work) do you plan to take this spring (i.e., from March 20th to June 20th)?
Unweighted base 1124Base: All US Adults 1124
None 46%
1 22%
2 14%
3 5%
4 1%
5 or more trips 2%
Don't know 11%
Net: At least one trip 43%
rrw_q2. Approximately how much do you expect to spend, in total, on leisure travel this spring?
Unweighted base 487Base: All US Adults planning to take at least one leisure trip this
spring484
Less than $100 5%
$101-$200 11%
$201-$300 9%
$301-$400 10%
$401-$500 11%
$501-$600 11%
$601-$700 5%
$701-$800 6%
$801-$900 3%
$901-$1000 9%
More than $1000 20%
rrw_q3. Which, if any, of the following types of trips do you plan to take this spring? Please select all that apply.
Unweighted base 487Base: All US Adults planning to take at least one leisure trip this
spring484
Family trip (i.e., visiting relatives) 35%
TotalWidowed Separated Other Prefer not to say Younger than 18 18 or over NET: Any age
Not a parent / guardian
Don't know / Prefer not to say Under $40k $40k to $80k $80k+
Don't know / Prefer not to say Urban
AC AD AE AF AG AH AI AJ AK AL AM AN AO AP
47 21 5 15 274 362 603 483 38 406 314 263 141 36052 22 7 22 268 364 601 483 40 407 320 250 147 37055% 20% 74% 9% 38% 47% 44% 50% 27% 56% 45% 34% 40% 44%Y* ** ** ** AG.AK AG AG.AI.AK * AM.AN.AO AN20% 17% - 9% 24% 26% 25% 19% 15% 17% 23% 30% 20% 19%* ** ** ** AJ AJ * AL.AO
13% 9% - 11% 20% 14% 16% 11% 10% 12% 13% 22% 6% 14%* ** ** ** AJ AJ * AO AL.AM.AO- 20% 14% 2% 7% 3% 4% 6% 8% 3% 6% 5% 7% 5%* ** ** ** AH.AI AH AH *- - - 3% 2% 1% 1% 1% - 1% 0% 2% 0% 1%* ** ** ** *3% 20% - - 2% 2% 2% 1% - 1% 2% 2% 1% 2%* ** ** ** *9% 14% 12% 66% 8% 8% 8% 12% 41% 10% 11% 5% 26% 15%* ** ** ** AI AG.AH.AI.AJ* AN AN AL.AM.AN AQ
36% 67% 14% 25% 54% 45% 48% 37% 33% 34% 44% 61% 34% 41%* ** ** ** AH.AI.AJ.AK AJ AJ * AL AL.AM.AO
18 12 1 5 145 167 293 181 13 143 136 161 47 153
19 14 1 6 145 164 290 180 13 139 141 153 50 153
8% 7% - - 6% 3% 4% 5% 14% 9% 2% 1% 12% 3%** ** ** ** ** AM.AN AM.AN*6% - - - 9% 11% 10% 13% 8% 17% 10% 5% 16% 10%** ** ** ** ** AN AN*14% 9% - 37% 8% 12% 10% 8% 16% 13% 10% 5% 12% 8%** ** ** ** ** AN *- 24% - - 15% 8% 12% 8% - 13% 13% 7% 6% 12%** ** ** ** AH ** *4% 9% - 18% 9% 8% 8% 15% 23% 12% 11% 10% 15% 11%** ** ** ** AI ** *14% 6% - 34% 9% 10% 10% 13% 24% 12% 11% 13% 5% 13%** ** ** ** ** *- - - - 7% 4% 6% 3% - 3% 2% 9% 2% 6%** ** ** ** ** AL.AM *6% 24% - - 7% 5% 7% 5% - 5% 7% 6% 5% 8%** ** ** ** ** *- - 100% 11% 3% 1% 2% 4% 6% 2% 3% 3% 3% 3%** ** ** ** ** *22% 6% - - 9% 12% 11% 5% 8% 6% 11% 8% 12% 9%** ** ** ** AJ AJ ** *26% 15% - - 17% 24% 20% 20% - 10% 19% 32% 13% 18%** ** ** ** ** AL AL.AM.AO *
18 12 1 5 145 167 293 181 13 143 136 161 47 153
19 14 1 6 145 164 290 180 13 139 141 153 50 153
48% 37% - - 32% 45% 40% 29% 13% 36% 36% 36% 27% 28%** ** ** ** AG.AJ AG.AJ ** *
Marital Status Parent or guardian of any children Income Type of Area Lived in

YouGov RealtimeSpring Travel Coronavirus- MarchUS_nat_int Sample: 5th - 6th March 2020
rrw_q1. How many, if any, separate leisure trips (i.e., any trip not for business or work) do you plan to take this spring (i.e., from March 20th to June 20th)?
Unweighted base 1124Base: All US Adults 1124
None 46%
1 22%
2 14%
3 5%
4 1%
5 or more trips 2%
Don't know 11%
Net: At least one trip 43%
rrw_q2. Approximately how much do you expect to spend, in total, on leisure travel this spring?
Unweighted base 487Base: All US Adults planning to take at least one leisure trip this
spring484
Less than $100 5%
$101-$200 11%
$201-$300 9%
$301-$400 10%
$401-$500 11%
$501-$600 11%
$601-$700 5%
$701-$800 6%
$801-$900 3%
$901-$1000 9%
More than $1000 20%
rrw_q3. Which, if any, of the following types of trips do you plan to take this spring? Please select all that apply.
Unweighted base 487Base: All US Adults planning to take at least one leisure trip this
spring484
Family trip (i.e., visiting relatives) 35%
Total Suburban/ Town Rural Other None 1 2 3 4 5 or more trips Don't know
Net: At least one trip
Canceled travel plans
Changed travel plans
Has taken extra precautions
AQ AR AS AT AU AV AW AX AY AZ BA BB BC BD
537 223 4 519 255 155 51 12 14 118 487 63 89 151527 223 4 516 246 155 55 11 17 125 484 69 96 15047% 46% - 100% - - - - - - - 38% 15% 20%
** AU.AV.AW.AZ.BA * ** ** * BC.BD.BF.BI* *25% 19% 22% - 100% - - - - - 51% 23% 18% 30%AP ** AT.AV.AW.AZ.BA * ** ** * AT.AV.AW.AZ BG* BG* BC.BG
13% 16% 24% - - 100% - - - - 32% 16% 26% 26%** AT.AU.AW.AZ.BA * ** ** * AT.AU.AW.AZ BG* BE.BG.BH* BE.BG.BH
5% 3% - - - - 100% - - - 11% 13% 27% 14%** AT.AU.AV.AZ.BA* ** ** * AT.AU.AV.AZ BF.BG.BH*BB.BD.BE.BF.BG.BH.BI.BJ*BF.BG.BH
1% 2% - - - - - 100% - - 2% 3% 3% 3%AQ ** * ** ** * AT.AU.AV BG* BG* BG
1% 2% - - - - - - 100% - 4% 5% 8% 3%** * ** ** * AT.AU.AV BG* BE.BF.BG.BH.BJ* BG
8% 11% 54% - - - - - - 100% - 4% 3% 4%** * ** ** AT.AU.AV.AW.BA* * *
45% 43% 46% - 100% 100% 100% 100% 100% - 100% 59% 83% 76%** AT.AZ AT.AZ AT.AZ* ** ** * AT.AZ BG.BH* BB.BE.BG.BH.BI.BJ*BB.BE.BG.BH.BJ
237 95 2 - 255 155 51 12 14 - 487 37 76 113
235 95 2 - 246 155 55 11 17 - 484 41 80 113
6% 5% 52% - 7% 3% 3% - - - 5% 15% 6% 2%* ** ** BA * ** ** ** ** * *
11% 12% - - 16% 6% 10% - - - 11% 21% 15% 8%* ** ** AV.BA * ** ** ** AV ** * *
9% 12% - - 13% 6% 3% - 11% - 9% - 8% 6%* ** ** AV.BA * ** ** ** ** * *
11% 7% 48% - 11% 10% 8% 7% 15% - 10% 15% 11% 9%* ** ** * ** ** ** ** * *
12% 9% - - 9% 12% 10% 28% 35% - 11% 9% 16% 15%* ** ** * ** ** ** AU ** * *
9% 15% - - 9% 13% 14% 24% 5% - 11% 9% 16% 17%* ** ** * ** ** ** ** * *
4% 5% - - 5% 4% 5% 9% - - 5% 2% 6% 9%* ** ** * ** ** ** ** * BF*
5% 4% - - 5% 6% 13% - - - 6% 14% 8% 7%* ** ** * ** ** ** ** * *
3% 3% - - 2% 4% 6% 6% - - 3% - 4% 3%* ** ** * ** ** ** AU ** * *
7% 12% - - 7% 11% 10% 6% 5% - 9% 6% 4% 7%* ** ** * ** ** ** ** * *
23% 15% - - 17% 24% 18% 21% 30% - 20% 7% 6% 17%* ** ** * ** ** ** ** * BC.BI*
237 95 2 - 255 155 51 12 14 - 487 37 76 113
235 95 2 - 246 155 55 11 17 - 484 41 80 113
39% 38% - - 41% 30% 27% 24% 24% - 35% 20% 16% 27%* ** ** AV.BA * ** ** ** ** * BI*
Travel plans that have changed due to the coronavirusType of Area Lived in Number of trips planned to take

YouGov RealtimeSpring Travel Coronavirus- MarchUS_nat_int Sample: 5th - 6th March 2020
rrw_q1. How many, if any, separate leisure trips (i.e., any trip not for business or work) do you plan to take this spring (i.e., from March 20th to June 20th)?
Unweighted base 1124Base: All US Adults 1124
None 46%
1 22%
2 14%
3 5%
4 1%
5 or more trips 2%
Don't know 11%
Net: At least one trip 43%
rrw_q2. Approximately how much do you expect to spend, in total, on leisure travel this spring?
Unweighted base 487Base: All US Adults planning to take at least one leisure trip this
spring484
Less than $100 5%
$101-$200 11%
$201-$300 9%
$301-$400 10%
$401-$500 11%
$501-$600 11%
$601-$700 5%
$701-$800 6%
$801-$900 3%
$901-$1000 9%
More than $1000 20%
rrw_q3. Which, if any, of the following types of trips do you plan to take this spring? Please select all that apply.
Unweighted base 487Base: All US Adults planning to take at least one leisure trip this
spring484
Family trip (i.e., visiting relatives) 35%
Total Will not make any future travel
plans
Has not changed or
cancelled travel plans
Did not have plans to travel None
Net: Has changed or
cancelled travel plans
Net: Traveling has been
impacted by coronavirus in
some wayBE BF BG BH BI BJ
102 303 403 112 133 324103 297 403 116 140 32444% 16% 85% 32% 23% 28%
BC.BD.BF.BI.BJ* BB.BC.BD.BE.BF.BH.BI.BJ BC.BF* BC BC.BD.BF23% 48% - 23% 20% 26%BG* BB.BC.BD.BE.BG.BH.BI.BJ BG* BG BG11% 26% - 9% 24% 22%BG* BE.BG.BH BG* BE.BG.BH BE.BG.BH7% 4% - 3% 20% 13%BG* BG BG* BE.BF.BG.BH.BJ BF.BG.BH2% 1% - - 4% 2%BG* BG * BG BG1% 2% - 1% 6% 3%* BG * BG BG
12% 3% 15% 32% 3% 6%BC.BD.BF.BI.BJ* BB.BC.BD.BF.BI.BJBB.BC.BD.BE.BF.BG.BI.BJ* BF
44% 81% - 35% 74% 66%BG* BB.BE.BG.BH.BJ BG* BB.BE.BG.BH.BJ BE.BG.BH
42 243 - 43 99 214
45 240 - 41 103 214
- 4% - 7% 10% 6%* ** * BC.BD.BF* BD
29% 9% - 14% 14% 13%BD.BF.BJ* ** * * BD11% 9% - 18% 6% 8%* ** BD.BI.BJ* *5% 11% - 14% 11% 9%* ** * *
10% 10% - 10% 15% 13%* ** * *4% 11% - 5% 14% 13%* ** * *7% 2% - 8% 5% 6%* ** * *
11% 5% - 2% 9% 8%* ** * *4% 2% - - 3% 4%* ** * *3% 11% - 8% 6% 6%* ** * *
16% 26% - 14% 6% 14%* BC.BI.BJ ** * * BC.BI
42 243 - 43 99 214
45 240 - 41 103 214
46% 42% - 37% 16% 28%BC.BD.BI.BJ* BC.BD.BI.BJ ** BC.BI* * BC.BI
Travel plans that have changed due to the coronavirus

YouGov RealtimeSpring Travel Coronavirus- MarchUS_nat_int Sample: 5th - 6th March 2020
Male FemaleGen Z (2000 and
later)Millennial (1982-
1999)Gen X (1965-
1981)Baby Boomer
(1946-1964)
Silent Generation (1928-1945)
Pre-Silent Generation (1927 and
earlier)
Other Northeast Midwest South West WhiteTotal
Gender Generation Region Race
Ski/snow trip 5% 6% 3% - 9% 4% 2% 4% - - 3% 6% 6% 2% 4%** F ** ** ** * *
Beach trip 18% 18% 18% 32% 21% 16% 17% 7% - - 19% 14% 19% 19% 18%** ** ** ** * *
City trip 15% 14% 16% 33% 15% 17% 13% 5% - - 12% 14% 16% 18% 13%** ** ** ** * *
Cruise 6% 5% 6% 21% 5% 7% 3% - - - 10% 3% 7% 3% 5%** ** ** ** * *
Camping trip 12% 13% 11% 9% 12% 12% 15% 4% - - 11% 14% 12% 11% 14%** ** ** ** * *
Road trip 23% 19% 27% 31% 16% 25% 26% 29% - - 28% 24% 22% 19% 24%A ** D ** ** ** * *
Staycation (i.e., taking off of work but not traveling anywhere) 8% 8% 7% 21% 11% 4% 6% - - - 9% 3% 11% 6% 5%** E ** ** ** * * K
Volunteer trip 2% 2% 2% 2% 4% 2% 1% - - - 1% - 3% 3% 2%** ** ** ** * *
An international trip 11% 12% 10% 12% 12% 11% 10% 3% - - 12% 10% 9% 12% 11%** ** ** ** * *
A domestic trip 22% 26% 19% 11% 23% 28% 19% 19% - - 27% 25% 20% 21% 25%** ** ** ** * *
Theme park 13% 15% 11% 13% 21% 16% 3% 4% - - 17% 7% 16% 10% 9%** F F ** ** ** * * K
A train trip 3% 3% 4% - 5% 5% 1% 4% - - 4% 1% 3% 5% 3%** F F ** ** ** * *
A sailing trip 2% 1% 2% - 3% 2% 1% - - - - 1% 3% 1% 1%** ** ** ** * *
A hunting trip 2% 3% 1% - 3% 4% 1% - - - 1% 2% 2% 4% 3%** ** ** ** * *
A sporting event 4% 7% 2% - 7% 4% 4% - - - 6% 5% 4% 3% 5%B ** ** ** ** * *
A concert or festival 7% 9% 6% 10% 7% 12% 3% 7% - - 4% 10% 7% 6% 8%** F ** ** ** * *
Other 5% 4% 6% - 4% 5% 7% 9% - - 2% 4% 6% 7% 6%** ** ** ** * *
Don't know 3% 3% 3% 4% 2% 4% 3% 5% - - 3% 1% 2% 6% 2%** ** ** ** * *
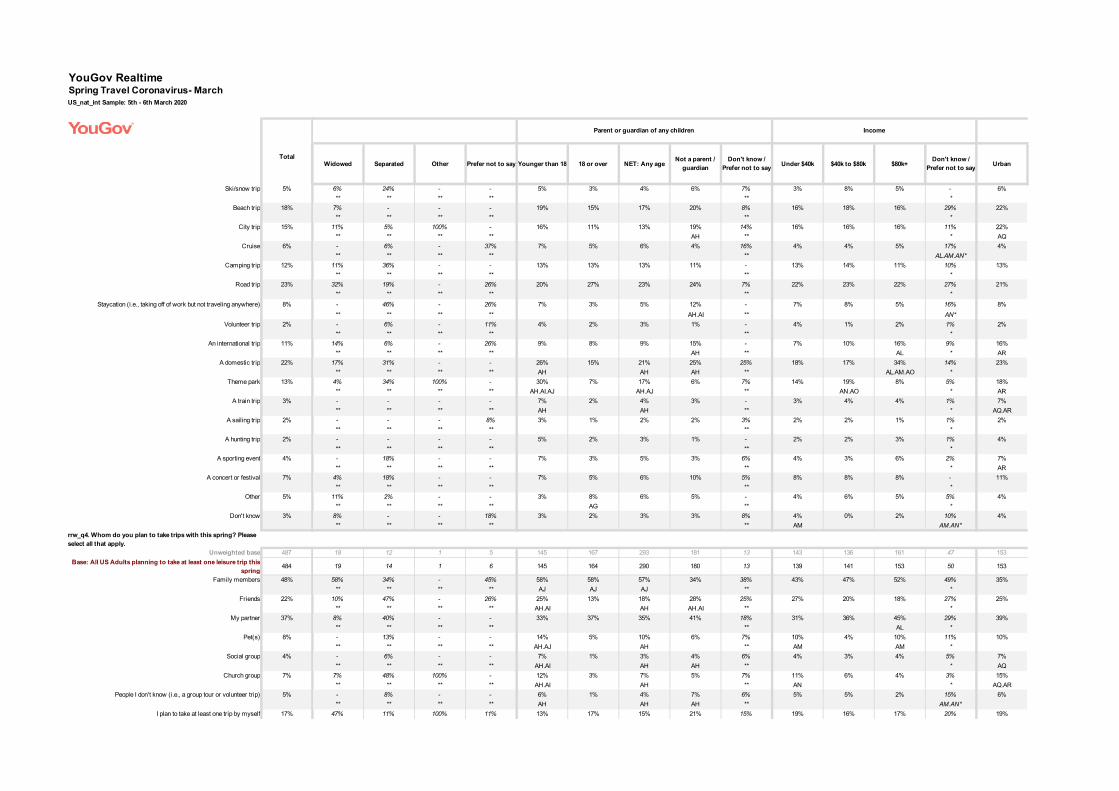
rrw_q4. Whom do you plan to take trips with this spring? Please select all that apply.
Unweighted base 487 224 263 19 153 144 145 26 - - 80 96 179 132 334Base: All US Adults planning to take at least one leisure trip this
spring484 232 251 25 150 136 144 28 - - 81 102 181 120 330
Family members 48% 44% 51% 44% 42% 51% 54% 34% - - 53% 58% 45% 38% 48%** D ** ** ** M* M*
Friends 22% 22% 22% 34% 29% 23% 14% 12% - - 24% 25% 23% 18% 21%** F ** ** ** * *
My partner 37% 37% 36% 46% 31% 36% 38% 51% - - 37% 31% 38% 39% 39%** ** ** ** * *
Pet(s) 8% 6% 10% 9% 12% 5% 9% - - - 4% 7% 10% 10% 9%** ** ** ** * *
Social group 4% 4% 4% 13% 9% 1% - - - - 6% 4% 4% 3% 3%** E.F ** ** ** * *
Church group 7% 7% 6% 17% 13% 4% 1% 3% - - 5% 2% 10% 7% 4%** E.F ** ** ** * * K
People I don't know (i.e., a group tour or volunteer trip) 5% 8% 2% 18% 7% 6% 1% - - - 8% 2% 5% 5% 3%B ** F F ** ** ** * *
I plan to take at least one trip by myself 17% 20% 15% 20% 13% 19% 20% 18% - - 15% 20% 15% 21% 18%

YouGov RealtimeSpring Travel Coronavirus- MarchUS_nat_int Sample: 5th - 6th March 2020
Total
Ski/snow trip 5%
Beach trip 18%
City trip 15%
Cruise 6%
Camping trip 12%
Road trip 23%
Staycation (i.e., taking off of work but not traveling anywhere) 8%
Volunteer trip 2%
An international trip 11%
A domestic trip 22%
Theme park 13%
A train trip 3%
A sailing trip 2%
A hunting trip 2%
A sporting event 4%
A concert or festival 7%
Other 5%
Don't know 3%
rrw_q4. Whom do you plan to take trips with this spring? Please select all that apply.
Unweighted base 487Base: All US Adults planning to take at least one leisure trip this
spring484
Family members 48%
Friends 22%
My partner 37%
Pet(s) 8%
Social group 4%
Church group 7%
People I don't know (i.e., a group tour or volunteer trip) 5%
I plan to take at least one trip by myself 17%
Black Hispanic Other (NET)No HS, High
school graduateSome college, 2-
year 4-year Post Grad Married Civil PartnershipLiving together, not married or
civil partnership
In a relationship, not living together
NET: In a relationship Single Divorced
Marital StatusRace Education
- 9% 11% 5% 3% 7% 5% 4% - 5% - 4% 6% -* * O* * ** ** ** * **
22% 20% 9% 20% 15% 21% 17% 18% 49% 33% 27% 21% 16% 12%* * * * ** ** ** * **
26% 17% 14% 13% 16% 16% 17% 13% 19% 15% 22% 14% 22% 12%N* * * * ** ** ** V* **18% 2% 3% 5% 6% 5% 5% 3% 7% 3% 7% 4% 9% 9%N.P* * * * ** ** ** V.Z* **7% 12% 5% 16% 14% 10% 4% 10% 23% 16% 7% 11% 13% 15%* * * U U * ** ** ** * **
29% 15% 27% 28% 22% 23% 14% 19% 23% 22% 25% 20% 25% 39%* * * U * ** ** ** * **
16% 15% 3% 11% 6% 7% 4% 6% - 3% - 5% 11% 2%N* N* * * ** ** ** * **2% 4% 3% 1% 3% 3% 1% 1% - 3% - 1% 4% -* * * * ** ** ** * **5% 13% 15% 7% 9% 13% 19% 10% 33% 9% 7% 10% 13% 8%* * * R.S* ** ** ** * **
17% 17% 15% 17% 20% 31% 28% 23% 16% 50% 3% 24% 24% 8%* * * R.S * ** ** ** * **
16% 28% 5% 18% 9% 12% 10% 13% - 22% 10% 13% 9% 21%* N.Q* * S * ** ** ** * **2% 5% 6% 3% 1% 5% 6% 4% - 3% 3% 3% 5% -* * * S S* ** ** ** * **- 3% 6% 2% 1% 3% 1% 1% - - - 1% 3% 5%* * N* * ** ** ** * **3% 1% - 2% 2% 2% 3% 3% 7% 3% - 3% 3% -* * * * ** ** ** * **3% 4% 3% 3% 3% 6% 7% 4% - - - 3% 5% 9%* * * * ** ** ** * **5% 8% 3% 8% 8% 5% 6% 6% 14% 11% 10% 7% 10% -* * * * ** ** ** * **7% 1% 3% 2% 5% 7% 8% 7% - - 3% 6% 4% -* * * * ** ** ** * **1% 7% 4% 4% 3% 2% 3% 4% - - 4% 3% 3% -* * * * ** ** ** * **
49 71 33 134 165 114 74 248 12 27 26 313 107 31
46 79 29 152 151 109 71 242 12 28 24 306 107 32
53% 45% 43% 44% 44% 50% 59% 53% 8% 41% 38% 49% 42% 58%* * * S* ** ** ** * **
29% 26% 16% 31% 21% 15% 17% 15% 30% 27% 19% 17% 35% 25%* * * T.U * ** ** ** V.Z* **
41% 29% 30% 38% 34% 40% 34% 49% 31% 62% 49% 50% 14% 11%* * * * AA ** ** ** AA * **6% 7% 8% 8% 10% 6% 7% 10% 26% 13% 10% 11% 3% 5%* * * * ** ** ** AA * **- 7% 6% 4% 5% 3% 3% 3% 7% - 8% 3% 7% 3%* * * * ** ** ** * **
10% 17% 5% 9% 8% 2% 5% 3% 26% - 7% 4% 10% 3%* N* * T * ** ** ** V.Z* **
13% 5% 14% 9% 3% 4% 2% 3% 14% - - 3% 13% 3%N* * N* S * ** ** ** V.Z* **31% 6% 21% 14% 18% 20% 18% 11% - 18% - 10% 32% 24%
YouGov RealtimeSpring Travel Coronavirus- MarchUS_nat_int Sample: 5th - 6th March 2020
Total
Ski/snow trip 5%
Beach trip 18%
City trip 15%
Cruise 6%
Camping trip 12%
Road trip 23%
Staycation (i.e., taking off of work but not traveling anywhere) 8%
Volunteer trip 2%
An international trip 11%
A domestic trip 22%
Theme park 13%
A train trip 3%
A sailing trip 2%
A hunting trip 2%
A sporting event 4%
A concert or festival 7%
Other 5%
Don't know 3%
rrw_q4. Whom do you plan to take trips with this spring? Please select all that apply.
Unweighted base 487Base: All US Adults planning to take at least one leisure trip this
spring484
Family members 48%
Friends 22%
My partner 37%
Pet(s) 8%
Social group 4%
Church group 7%
People I don't know (i.e., a group tour or volunteer trip) 5%
I plan to take at least one trip by myself 17%
Widowed Separated Other Prefer not to say Younger than 18 18 or over NET: Any ageNot a parent /
guardianDon't know /
Prefer not to say Under $40k $40k to $80k $80k+Don't know /
Prefer not to say Urban
Marital Status Parent or guardian of any children Income Type of Area Lived in
6% 24% - - 5% 3% 4% 6% 7% 3% 8% 5% - 6%** ** ** ** ** *7% - - - 19% 15% 17% 20% 8% 16% 18% 16% 29% 22%** ** ** ** ** *11% 5% 100% - 16% 11% 13% 19% 14% 16% 16% 16% 11% 22%** ** ** ** AH ** * AQ- 6% - 37% 7% 5% 6% 4% 16% 4% 4% 5% 17% 4%** ** ** ** ** AL.AM.AN*11% 36% - - 13% 13% 13% 11% - 13% 14% 11% 10% 13%** ** ** ** ** *32% 19% - 26% 20% 27% 23% 24% 7% 22% 23% 22% 27% 21%** ** ** ** ** *- 46% - 26% 7% 3% 5% 12% - 7% 8% 5% 16% 8%** ** ** ** AH.AI ** AN*- 6% - 11% 4% 2% 3% 1% - 4% 1% 2% 1% 2%** ** ** ** ** *14% 6% - 26% 9% 8% 9% 15% - 7% 10% 16% 9% 16%** ** ** ** AH ** AL * AR17% 31% - - 26% 15% 21% 25% 25% 18% 17% 34% 14% 23%** ** ** ** AH AH AH ** AL.AM.AO *4% 34% 100% - 30% 7% 17% 6% 7% 14% 19% 8% 5% 18%** ** ** ** AH.AI.AJ AH.AJ ** AN.AO * AR- - - - 7% 2% 4% 3% - 3% 4% 4% 1% 7%** ** ** ** AH AH ** * AQ.AR- - - 8% 3% 1% 2% 2% 3% 2% 2% 1% 1% 2%** ** ** ** ** *- - - - 5% 2% 3% 1% - 2% 2% 3% 1% 4%** ** ** ** ** *- 18% - - 7% 3% 5% 3% 6% 4% 3% 6% 2% 7%** ** ** ** ** * AR4% 18% - - 7% 5% 6% 10% 5% 8% 8% 8% - 11%** ** ** ** ** *11% 2% - - 3% 8% 6% 5% - 4% 6% 5% 5% 4%** ** ** ** AG ** *8% - - 18% 3% 2% 3% 3% 8% 4% 0% 2% 10% 4%** ** ** ** ** AM AM.AN*
18 12 1 5 145 167 293 181 13 143 136 161 47 153
19 14 1 6 145 164 290 180 13 139 141 153 50 153
58% 34% - 45% 58% 58% 57% 34% 38% 43% 47% 52% 49% 35%** ** ** ** AJ AJ AJ ** *10% 47% - 26% 25% 13% 18% 28% 25% 27% 20% 18% 27% 25%** ** ** ** AH.AI AH AH.AI ** *8% 40% - - 33% 37% 35% 41% 18% 31% 36% 45% 29% 39%** ** ** ** ** AL *- 13% - - 14% 5% 10% 6% 7% 10% 4% 10% 11% 10%** ** ** ** AH.AJ AH ** AM AM *- 6% - - 7% 1% 3% 4% 6% 4% 3% 4% 5% 7%** ** ** ** AH.AI AH AH ** * AQ7% 48% 100% - 12% 3% 7% 5% 7% 11% 6% 4% 3% 15%** ** ** ** AH.AI AH ** AN * AQ.AR- 8% - - 6% 1% 4% 7% 6% 5% 5% 2% 15% 6%** ** ** ** AH AH AH ** AM.AN*47% 11% 100% 11% 13% 17% 15% 21% 15% 19% 16% 17% 20% 19%

YouGov RealtimeSpring Travel Coronavirus- MarchUS_nat_int Sample: 5th - 6th March 2020
Total
Ski/snow trip 5%
Beach trip 18%
City trip 15%
Cruise 6%
Camping trip 12%
Road trip 23%
Staycation (i.e., taking off of work but not traveling anywhere) 8%
Volunteer trip 2%
An international trip 11%
A domestic trip 22%
Theme park 13%
A train trip 3%
A sailing trip 2%
A hunting trip 2%
A sporting event 4%
A concert or festival 7%
Other 5%
Don't know 3%
rrw_q4. Whom do you plan to take trips with this spring? Please select all that apply.
Unweighted base 487Base: All US Adults planning to take at least one leisure trip this
spring484
Family members 48%
Friends 22%
My partner 37%
Pet(s) 8%
Social group 4%
Church group 7%
People I don't know (i.e., a group tour or volunteer trip) 5%
I plan to take at least one trip by myself 17%
Suburban/ Town Rural Other None 1 2 3 4 5 or more trips Don't know
Net: At least one trip
Canceled travel plans
Changed travel plans
Has taken extra precautions
Travel plans that have changed due to the coronavirusType of Area Lived in Number of trips planned to take
5% 3% - - 1% 7% 14% - 17% - 5% 4% 13% 11%* ** ** AU AU.BA* ** ** ** AU ** BE.BF.BH* BE.BF.BH*
17% 14% 48% - 13% 19% 34% 26% 21% - 18% 37% 23% 18%* ** ** AU.BA* ** ** ** AU ** * *
11% 16% - - 11% 19% 24% 29% 5% - 15% 20% 17% 19%* ** ** AU AU* ** ** ** AU ** * *
8% 2% - - 3% 5% 14% 19% 15% - 6% 18% 16% 6%AR * ** ** AU.BA* ** ** ** AU ** BD.BF.BH.BJ* *10% 15% - - 9% 13% 17% 17% 33% - 12% 8% 14% 16%
* ** ** * ** ** ** AU ** * *22% 29% - - 20% 26% 32% 8% 23% - 23% 31% 21% 22%
* ** ** * ** ** ** ** * *8% 5% - - 4% 8% 16% 7% 27% - 8% 17% 14% 9%
* ** ** AU* ** ** ** AU ** BF* *2% 2% - - 1% 1% 7% 13% 5% - 2% 9% 9% 2%
* ** ** AU* ** ** ** ** BF* BF*10% 6% - - 6% 12% 21% 13% 32% - 11% 10% 17% 16%
* ** ** AU AU.BA* ** ** ** AU ** * *23% 21% - - 17% 31% 23% 21% 24% - 22% 20% 19% 26%
* ** ** AU.BA * ** ** ** AU ** * BH*12% 6% - - 8% 21% 10% 13% 25% - 13% 23% 23% 11%
* ** ** AU.BA * ** ** ** AU ** BD.BE.BF* *2% 1% 52% - 1% 4% 14% - - - 3% 5% 14% 8%
* ** ** AU.AV.BA* ** ** ** AU ** BF.BJ* BF*1% 2% - - 0% 2% 4% 9% 5% - 2% - 4% 3%
* ** ** AU* ** ** ** AU ** BF* BF*2% 2% - - 1% 4% 4% 9% - - 2% 9% 9% 6%
* ** ** * ** ** ** ** BF.BJ* BF*4% 1% - - 2% 6% 4% 17% 15% - 4% 12% 9% 4%
* ** ** * ** ** ** AU ** * *5% 7% - - 5% 7% 9% 31% 27% - 7% 14% 8% 14%
* ** ** * ** ** ** ** * BF*6% 6% - - 4% 8% 4% - 8% - 5% 2% 3% 3%
* ** ** * ** ** ** ** * *3% 2% - - 5% 2% - - - - 3% 8% 3% 1%
* ** ** * ** ** ** ** * *
237 95 2 - 255 155 51 12 14 - 487 37 76 113
235 95 2 - 246 155 55 11 17 - 484 41 80 113
55% 49% 48% - 49% 51% 38% 46% 23% - 48% 53% 36% 40%AP AP* ** ** * ** ** ** ** * *
21% 22% - - 13% 30% 36% 25% 43% - 22% 45% 35% 27%* ** ** AU.BA AU.BA* ** ** ** AU ** BF.BH* *
34% 41% - - 35% 40% 35% 19% 37% - 37% 36% 31% 32%* ** ** * ** ** ** ** * *
6% 11% - - 4% 11% 17% 10% 18% - 8% 23% 14% 13%* ** ** AU AU* ** ** ** AU ** BF* BF*
2% 2% - - 3% 2% 10% 9% 5% - 4% 5% 7% 9%* ** ** AU.AV* ** ** ** ** BF* BF*
3% 1% - - 3% 6% 20% 7% 20% - 7% 15% 25% 12%* ** ** AU.AV.BA* ** ** ** AU ** BD.BF.BH.BJ* BF.BH*
5% 1% 52% - 2% 3% 13% 17% 26% - 5% 23% 21% 8%* ** ** AU.AV.BA* ** ** ** AU ** BD.BF.BH.BJ* BF*
17% 16% - - 18% 13% 26% 26% 17% - 17% 23% 23% 16%

YouGov RealtimeSpring Travel Coronavirus- MarchUS_nat_int Sample: 5th - 6th March 2020
Total
Ski/snow trip 5%
Beach trip 18%
City trip 15%
Cruise 6%
Camping trip 12%
Road trip 23%
Staycation (i.e., taking off of work but not traveling anywhere) 8%
Volunteer trip 2%
An international trip 11%
A domestic trip 22%
Theme park 13%
A train trip 3%
A sailing trip 2%
A hunting trip 2%
A sporting event 4%
A concert or festival 7%
Other 5%
Don't know 3%
rrw_q4. Whom do you plan to take trips with this spring? Please select all that apply.
Unweighted base 487Base: All US Adults planning to take at least one leisure trip this
spring484
Family members 48%
Friends 22%
My partner 37%
Pet(s) 8%
Social group 4%
Church group 7%
People I don't know (i.e., a group tour or volunteer trip) 5%
I plan to take at least one trip by myself 17%
Will not make any future travel
plans
Has not changed or
cancelled travel plans
Did not have plans to travel None
Net: Has changed or
cancelled travel plans
Net: Traveling has been
impacted by coronavirus in
some way
Travel plans that have changed due to the coronavirus
- 2% - - 10% 8%* ** * BF* BF
26% 17% - 13% 25% 20%* ** * *
22% 14% - 17% 19% 16%* ** * *
16% 4% - - 13% 8%BF.BH* ** * BF.BH*11% 12% - 13% 11% 12%* ** * *
35% 23% - 24% 22% 23%* ** * *
20% 5% - 2% 13% 11%BF.BH* ** * BF* BF2% - - 2% 8% 4%* ** BF* BD.BF* BF9% 11% - 4% 16% 12%* ** * *
32% 22% - 11% 19% 27%BH* ** * * BH6% 9% - 18% 22% 15%* ** * BD.BE.BF*5% 1% - 2% 11% 6%* ** * BF* BF2% 0% - - 3% 3%* ** * * BF2% 2% - - 7% 4%* ** * BF*6% 4% - - 8% 6%* ** * *5% 6% - 7% 10% 9%* ** * *- 8% - 4% 2% 2%* BJ ** * *2% 2% - 8% 5% 3%* ** BD* *
42 243 - 43 99 214
45 240 - 41 103 214
57% 53% - 45% 37% 42%* BC.BD.BI.BJ ** * *
29% 18% - 13% 36% 29%* ** * BF.BH* BF.BH
50% 40% - 41% 29% 34%BI* ** * *11% 5% - 8% 17% 11%* ** * BF* BF4% 1% - 6% 5% 6%* ** BF* BF* BF
15% 1% - - 20% 14%BF.BH* ** * BF.BH* BF.BH16% 1% - - 19% 10%BF.BH* ** * BD.BF.BH.BJ* BF.BH18% 19% - 14% 20% 17%

YouGov RealtimeSpring Travel Coronavirus- MarchUS_nat_int Sample: 5th - 6th March 2020
Male FemaleGen Z (2000 and
later)Millennial (1982-
1999)Gen X (1965-
1981)Baby Boomer
(1946-1964)
Silent Generation (1928-1945)
Pre-Silent Generation (1927 and
earlier)
Other Northeast Midwest South West WhiteTotal
Gender Generation Region Race
** ** ** ** * * POther 1% 2% 1% - 3% 1% 1% - - - 2% 1% 1% 3% 1%
** ** ** ** * *Don't know 1% 1% 1% 4% 0% - 2% 3% - - 1% 1% 1% 2% 1%
** ** ** ** * *rrw_q5. How does your outlook on the US economy impact your likelihood to travel this spring?
Unweighted base 1124 514 610 42 344 325 342 71 - - 194 220 411 299 768Base: All US Adults 1124 546 578 53 335 307 352 78 - - 200 236 423 265 747
I am much more likely to travel 9% 10% 8% 13% 10% 9% 8% 9% - - 11% 7% 10% 9% 8%** * ** **
I am somewhat more likely to travel 9% 11% 7% 5% 9% 12% 7% 7% - - 11% 7% 10% 7% 8%B ** F * ** **
I am no more or less likely to travel 41% 42% 40% 23% 35% 40% 48% 53% - - 37% 49% 35% 45% 48%** D D* ** ** J.L L O.P.Q
I am somewhat less likely to travel 8% 6% 9% 20% 8% 6% 8% 6% - - 5% 10% 7% 9% 8%** * ** **
I am much less likely to travel 15% 14% 16% 18% 14% 14% 17% 15% - - 11% 14% 19% 14% 12%** * ** ** J
Don't know 18% 16% 20% 21% 25% 19% 12% 10% - - 25% 14% 19% 16% 15%** F.G F * ** ** K.M
Net: Top 2 18% 22% 15% 18% 19% 22% 15% 16% - - 22% 14% 20% 16% 17%B ** F * ** ** K
Net: Bottom 2 23% 21% 25% 38% 21% 20% 25% 21% - - 16% 23% 25% 23% 20%** * ** ** J
When booking each of the following things, do you MOST prefer to book it online, by phone, in person, or by using a travel agent/advisor? Please select one option in each row.rrw_q6_1. Flights
Unweighted base 1124 514 610 42 344 325 342 71 - - 194 220 411 299 768Base: All US Adults 1124 546 578 53 335 307 352 78 - - 200 236 423 265 747
I prefer to book this online myself through a travel site 28% 29% 26% 30% 30% 33% 24% 13% - - 25% 22% 29% 32% 30%** G F.G G * ** ** K P
I prefer to book this online myself directly through the company's website
26% 24% 27% 22% 26% 25% 29% 20% - - 24% 28% 22% 30% 27%
** * ** ** LI prefer to book this by phone myself 6% 7% 5% 9% 6% 5% 6% 11% - - 9% 6% 6% 5% 6%
** * ** **I prefer to book this in person myself 3% 3% 3% 2% 3% 3% 2% 5% - - 3% 5% 2% 2% 2%
** * ** **I prefer to book this through a travel agent 2% 1% 3% 2% 1% 2% 2% 5% - - 3% 3% 2% 2% 3%
A ** D* ** **Don't know 10% 10% 10% 15% 13% 8% 8% 11% - - 9% 11% 9% 11% 8%
** E.F * ** **Not applicable - This isn't part of my trip/someone else I travel with
handles this25% 25% 26% 21% 22% 24% 28% 35% - - 28% 25% 29% 18% 25%
** D* ** ** M Mrrw_q6_2. Hotels or Accomodation
Unweighted base 1124 514 610 42 344 325 342 71 - - 194 220 411 299 768Base: All US Adults 1124 546 578 53 335 307 352 78 - - 200 236 423 265 747
I prefer to book this online myself through a travel site 31% 31% 30% 33% 33% 34% 28% 15% - - 25% 27% 33% 33% 34%** G G G * ** ** P
I prefer to book this online myself directly through the company's website
27% 30% 24% 35% 26% 27% 30% 16% - - 29% 33% 23% 26% 27%
B ** G * ** ** LI prefer to book this by phone myself 8% 6% 10% 5% 5% 8% 11% 16% - - 8% 10% 8% 7% 9%

YouGov RealtimeSpring Travel Coronavirus- MarchUS_nat_int Sample: 5th - 6th March 2020
Total
Other 1%
Don't know 1%
rrw_q5. How does your outlook on the US economy impact your likelihood to travel this spring?
Unweighted base 1124Base: All US Adults 1124
I am much more likely to travel 9%
I am somewhat more likely to travel 9%
I am no more or less likely to travel 41%
I am somewhat less likely to travel 8%
I am much less likely to travel 15%
Don't know 18%
Net: Top 2 18%
Net: Bottom 2 23%
When booking each of the following things, do you MOST prefer to book it online, by phone, in person, or by using a travel agent/advisor? Please select one option in each row.rrw_q6_1. Flights
Unweighted base 1124Base: All US Adults 1124
I prefer to book this online myself through a travel site 28%
I prefer to book this online myself directly through the company's website
26%
I prefer to book this by phone myself 6%
I prefer to book this in person myself 3%
I prefer to book this through a travel agent 2%
Don't know 10%
Not applicable - This isn't part of my trip/someone else I travel with handles this
25%
rrw_q6_2. Hotels or AccomodationUnweighted base 1124
Base: All US Adults 1124I prefer to book this online myself through a travel site 31%
I prefer to book this online myself directly through the company's website
27%
I prefer to book this by phone myself 8%
Black Hispanic Other (NET)No HS, High
school graduateSome college, 2-
year 4-year Post Grad Married Civil PartnershipLiving together, not married or
civil partnership
In a relationship, not living together
NET: In a relationship Single Divorced
Marital StatusRace Education
P* * P* * ** ** ** V.Z* **2% 4% - 2% 0% 2% 1% 2% - - 3% 2% 1% -* * * * ** ** ** * **- 1% - 1% 3% - - 0% 8% 3% - 1% 1% 2%* * * * ** ** ** * **
133 151 72 405 380 215 124 495 24 72 44 635 297 104133 176 67 453 348 205 117 481 23 73 41 618 292 11211% 10% 10% 10% 6% 8% 13% 11% 10% 5% 12% 11% 9% 7%
* S ** * * *8% 14% 6% 9% 10% 8% 9% 10% 11% 11% 7% 10% 8% 7%
* ** * * *30% 23% 31% 32% 41% 53% 54% 48% 39% 30% 36% 45% 37% 39%
* R R.S R.S X.Z.AA ** * * X *4% 9% 7% 6% 9% 6% 10% 7% 14% 16% 12% 8% 7% 6%
* ** V.Z.AA* * V *27% 18% 18% 20% 13% 13% 7% 11% 15% 9% 14% 11% 15% 33%
N * S.T.U U ** * * V.X.Y.Z.AA*19% 27% 27% 23% 20% 11% 8% 13% 11% 28% 18% 15% 24% 8%
N N* T.U T.U ** V.Z.AB* * V V.Z.AB *19% 24% 16% 19% 16% 17% 22% 22% 22% 16% 19% 21% 16% 14%
* ** * * *31% 27% 25% 26% 23% 19% 16% 18% 29% 25% 26% 20% 22% 39%
N * U ** * * V V.Z.AA*
133 151 72 405 380 215 124 495 24 72 44 635 297 104133 176 67 453 348 205 117 481 23 73 41 618 292 11227% 19% 24% 20% 30% 31% 44% 31% 17% 25% 28% 30% 31% 24%
* R R R.S.T AC ** * AC* AC AC *
20% 24% 32% 16% 26% 42% 30% 28% 12% 27% 37% 28% 24% 22%
* R R.S.U R ** * * *6% 9% 5% 6% 8% 5% 8% 6% 8% 10% 4% 6% 5% 6%
* ** * * *3% 4% 4% 3% 3% 3% - 2% 8% 1% 2% 2% 2% 5%
* ** * * *2% 1% 1% 2% 3% 0% 3% 3% 7% 1% - 2% 1% 4%
* T ** * * AA*12% 19% 11% 16% 7% 4% 4% 7% 18% 7% 10% 8% 10% 11%
N * S.T.U ** * * *
31% 24% 23% 36% 22% 15% 11% 23% 29% 29% 19% 23% 27% 27%
* S.T.U T.U ** * * *
133 151 72 405 380 215 124 495 24 72 44 635 297 104133 176 67 453 348 205 117 481 23 73 41 618 292 11228% 18% 30% 23% 32% 36% 48% 36% 27% 32% 40% 35% 27% 22%
* R R R.S.T AA.AB.AC ** * AB* AA.AB *
23% 31% 25% 21% 30% 36% 24% 28% 26% 30% 29% 28% 26% 29%
* R R.U ** * * *7% 6% 8% 8% 8% 9% 8% 10% 4% 3% 8% 8% 7% 8%

YouGov RealtimeSpring Travel Coronavirus- MarchUS_nat_int Sample: 5th - 6th March 2020
Total
Other 1%
Don't know 1%
rrw_q5. How does your outlook on the US economy impact your likelihood to travel this spring?
Unweighted base 1124Base: All US Adults 1124
I am much more likely to travel 9%
I am somewhat more likely to travel 9%
I am no more or less likely to travel 41%
I am somewhat less likely to travel 8%
I am much less likely to travel 15%
Don't know 18%
Net: Top 2 18%
Net: Bottom 2 23%
When booking each of the following things, do you MOST prefer to book it online, by phone, in person, or by using a travel agent/advisor? Please select one option in each row.rrw_q6_1. Flights
Unweighted base 1124Base: All US Adults 1124
I prefer to book this online myself through a travel site 28%
I prefer to book this online myself directly through the company's website
26%
I prefer to book this by phone myself 6%
I prefer to book this in person myself 3%
I prefer to book this through a travel agent 2%
Don't know 10%
Not applicable - This isn't part of my trip/someone else I travel with handles this
25%
rrw_q6_2. Hotels or AccomodationUnweighted base 1124
Base: All US Adults 1124I prefer to book this online myself through a travel site 31%
I prefer to book this online myself directly through the company's website
27%
I prefer to book this by phone myself 8%
Widowed Separated Other Prefer not to say Younger than 18 18 or over NET: Any ageNot a parent /
guardianDon't know /
Prefer not to say Under $40k $40k to $80k $80k+Don't know /
Prefer not to say Urban
Marital Status Parent or guardian of any children Income Type of Area Lived in
** ** ** ** ** *- 2% - - 2% 1% 2% 1% - 1% 3% 0% 2% 1%** ** ** ** ** *- - - 18% 1% 1% 1% 1% 8% 1% 0% 1% 3% 1%** ** ** ** ** *
47 21 5 15 274 362 603 483 38 406 314 263 141 36052 22 7 22 268 364 601 483 40 407 320 250 147 3705% 8% - - 16% 10% 12% 5% 11% 7% 9% 10% 13% 9%* ** ** ** AI.AJ AJ AJ * AL5% 22% - - 11% 9% 10% 8% 4% 9% 11% 8% 6% 11%* ** ** ** *
41% 22% 14% 27% 33% 48% 41% 43% 17% 33% 42% 57% 33% 33%* ** ** ** AG.AI.AK AG.AK AG.AK * AL AL.AM.AO7% 8% - 3% 8% 7% 8% 8% 4% 8% 7% 10% 4% 7%* ** ** ** * AO
27% 24% - 2% 16% 14% 15% 16% 16% 22% 14% 7% 12% 19%V.X.Z* ** ** ** * AM.AN.AO AN AQ15% 17% 86% 68% 16% 12% 14% 21% 48% 21% 16% 8% 32% 21%* ** ** ** AH.AI AG.AH.AI.AJ* AN AN AL.AM.AN
11% 29% - - 26% 20% 22% 13% 15% 15% 21% 19% 19% 21%* ** ** ** AH.AI.AJ AJ AJ *
33% 32% - 5% 24% 21% 22% 23% 20% 30% 21% 17% 16% 26%V.Z* ** ** ** * AM.AN.AO
47 21 5 15 274 362 603 483 38 406 314 263 141 36052 22 7 22 268 364 601 483 40 407 320 250 147 37011% 15% 13% 4% 31% 24% 26% 31% 17% 25% 27% 39% 17% 30%* ** ** ** AH.AI AH * AL.AM.AO
31% 16% - 19% 24% 29% 27% 24% 22% 17% 26% 37% 28% 26%
* ** ** ** * AL AL.AM AL9% 16% - 14% 7% 8% 8% 5% 3% 5% 7% 7% 8% 8%* ** ** ** *- 8% 14% - 3% 3% 3% 2% 4% 3% 3% 2% 2% 2%* ** ** ** *4% - - - 1% 3% 2% 2% - 2% 3% 1% 1% 1%* ** ** ** *
14% 26% 49% 28% 9% 9% 9% 10% 21% 13% 10% 3% 16% 10%* ** ** ** AH.AI* AN AN AN
31% 18% 24% 35% 23% 26% 25% 25% 33% 34% 24% 10% 28% 23%
* ** ** ** * AM.AN AN AN
47 21 5 15 274 362 603 483 38 406 314 263 141 36052 22 7 22 268 364 601 483 40 407 320 250 147 37021% 39% 13% 6% 36% 27% 30% 32% 12% 24% 32% 47% 19% 28%* ** ** ** AH.AI.AK AH.AK AK * AL.AO AL.AM.AO
24% 19% - 25% 28% 28% 28% 26% 22% 22% 29% 32% 26% 31%
* ** ** ** * AL AL AR15% 5% 14% - 5% 13% 10% 7% 3% 9% 7% 8% 8% 6%

YouGov RealtimeSpring Travel Coronavirus- MarchUS_nat_int Sample: 5th - 6th March 2020
Total
Other 1%
Don't know 1%
rrw_q5. How does your outlook on the US economy impact your likelihood to travel this spring?
Unweighted base 1124Base: All US Adults 1124
I am much more likely to travel 9%
I am somewhat more likely to travel 9%
I am no more or less likely to travel 41%
I am somewhat less likely to travel 8%
I am much less likely to travel 15%
Don't know 18%
Net: Top 2 18%
Net: Bottom 2 23%
When booking each of the following things, do you MOST prefer to book it online, by phone, in person, or by using a travel agent/advisor? Please select one option in each row.rrw_q6_1. Flights
Unweighted base 1124Base: All US Adults 1124
I prefer to book this online myself through a travel site 28%
I prefer to book this online myself directly through the company's website
26%
I prefer to book this by phone myself 6%
I prefer to book this in person myself 3%
I prefer to book this through a travel agent 2%
Don't know 10%
Not applicable - This isn't part of my trip/someone else I travel with handles this
25%
rrw_q6_2. Hotels or AccomodationUnweighted base 1124
Base: All US Adults 1124I prefer to book this online myself through a travel site 31%
I prefer to book this online myself directly through the company's website
27%
I prefer to book this by phone myself 8%
Suburban/ Town Rural Other None 1 2 3 4 5 or more trips Don't know
Net: At least one trip
Canceled travel plans
Changed travel plans
Has taken extra precautions
Travel plans that have changed due to the coronavirusType of Area Lived in Number of trips planned to take
* ** ** * ** ** ** ** * *2% 1% - - 1% 2% - - - - 1% 2% 1% 2%
* ** ** * ** ** ** ** * *1% 1% - - 2% 1% - - - - 1% - 1% -
* ** ** * ** ** ** ** * *
537 223 4 519 255 155 51 12 14 118 487 63 89 151527 223 4 516 246 155 55 11 17 125 484 69 96 1509% 8% 46% 2% 18% 16% 31% 17% 5% 4% 18% 33% 23% 13%
** AT.AZ AT.AZ AT.AU.AV.AZ.BA* ** ** * AT.AZ BD.BE.BF.BG.BH.BJ*BD.BE.BF.BG.BH* BG7% 9% - 5% 12% 17% 13% 7% 58% 3% 15% 21% 29% 21%
** AT.AZ AT.AZ AT.AZ* ** ** * AT.AU.AZ BE.BF.BG.BH* BE.BF.BG.BH.BJ* BE.BF.BG.BH45% 45% 29% 39% 54% 45% 32% 47% 32% 21% 48% 13% 23% 32%AP AP ** AZ AT.AW.AZ.BA AZ * ** ** * AT.AW.AZ * * BB.BI8% 7% - 7% 9% 8% 12% 13% - 4% 9% 8% 13% 13%
** * ** ** * * BF.BG* BF.BG13% 14% - 25% 3% 2% 12% 9% 5% 17% 4% 19% 5% 13%
** AU.AV.BA AU.AV.BA* ** ** AU.AV.BA* BC.BF* * BC.BF17% 17% 26% 22% 4% 11% - 7% - 51% 6% 5% 6% 8%
** AU.AV.AW.BA AU.AW.BA * ** ** AT.AU.AV.AW.BA* * *16% 18% 46% 6% 29% 33% 44% 23% 63% 7% 33% 54% 53% 34%
** AT.AZ AT.AZ AT.AZ* ** ** * AT.AZ BD.BE.BF.BG.BH.BJ*BD.BE.BF.BG.BH.BJ* BE.BF.BG.BH22% 21% - 33% 12% 11% 24% 23% 5% 21% 13% 27% 18% 26%
** AU.AV.AZ.BA AU.AV.BA* ** ** AU.AV.BA* BF* BF* BF
537 223 4 519 255 155 51 12 14 118 487 63 89 151527 223 4 516 246 155 55 11 17 125 484 69 96 15028% 24% - 24% 36% 30% 30% 51% 26% 22% 33% 42% 27% 31%
** AT.AZ * ** ** * AT.AZ BG* * BG
27% 21% 24% 24% 34% 31% 32% 25% 27% 9% 32% 24% 30% 33%
** AZ AT.AZ AZ AZ* ** ** * AT.AZ BH* BH* BG.BH6% 6% - 5% 6% 8% 5% 7% 34% 8% 7% 11% 13% 11%
** * ** ** * * BF.BG.BH* BF.BG2% 4% 29% 2% 2% 1% 8% 8% 5% 5% 3% 2% 7% 3%
** AT.AV* ** ** * * BF*3% 3% - 3% 1% 2% 3% 9% - 1% 1% - 2% 2%
** AU * ** ** * * *9% 12% 26% 11% 5% 7% 9% - - 25% 6% 5% 5% 9%
** AU.BA * ** ** AT.AU.AV.AW.BA* * *
25% 29% 22% 32% 16% 22% 14% - 8% 31% 17% 16% 15% 11%
** AU.AV.AW.BA * ** ** AU.AW.BA* * *
537 223 4 519 255 155 51 12 14 118 487 63 89 151527 223 4 516 246 155 55 11 17 125 484 69 96 15033% 30% - 25% 41% 41% 31% 50% 22% 21% 39% 39% 20% 37%
** AT.AZ AT.AZ * ** ** * AT.AZ BC.BG* * BC.BG
26% 22% - 26% 28% 29% 42% 19% 42% 17% 30% 37% 41% 31%
** AZ AZ AT.AZ* ** ** * AZ BG.BH* BG.BH.BI* BH8% 13% 52% 6% 12% 8% 5% - 24% 8% 10% 7% 7% 8%

YouGov RealtimeSpring Travel Coronavirus- MarchUS_nat_int Sample: 5th - 6th March 2020
Total
Other 1%
Don't know 1%
rrw_q5. How does your outlook on the US economy impact your likelihood to travel this spring?
Unweighted base 1124Base: All US Adults 1124
I am much more likely to travel 9%
I am somewhat more likely to travel 9%
I am no more or less likely to travel 41%
I am somewhat less likely to travel 8%
I am much less likely to travel 15%
Don't know 18%
Net: Top 2 18%
Net: Bottom 2 23%
When booking each of the following things, do you MOST prefer to book it online, by phone, in person, or by using a travel agent/advisor? Please select one option in each row.rrw_q6_1. Flights
Unweighted base 1124Base: All US Adults 1124
I prefer to book this online myself through a travel site 28%
I prefer to book this online myself directly through the company's website
26%
I prefer to book this by phone myself 6%
I prefer to book this in person myself 3%
I prefer to book this through a travel agent 2%
Don't know 10%
Not applicable - This isn't part of my trip/someone else I travel with handles this
25%
rrw_q6_2. Hotels or AccomodationUnweighted base 1124
Base: All US Adults 1124I prefer to book this online myself through a travel site 31%
I prefer to book this online myself directly through the company's website
27%
I prefer to book this by phone myself 8%
Will not make any future travel
plans
Has not changed or
cancelled travel plans
Did not have plans to travel None
Net: Has changed or
cancelled travel plans
Net: Traveling has been
impacted by coronavirus in
some way
Travel plans that have changed due to the coronavirus
* ** * *- 0% - 8% 2% 2%* ** BF.BJ* *- 1% - 2% 1% 0%* ** * *
102 303 403 112 133 324103 297 403 116 140 32411% 13% 1% 7% 24% 16%BG* BG BG* BD.BE.BF.BG.BH.BJ BG.BH8% 9% 2% 8% 25% 18%BG* BG BG* BE.BF.BG.BH.BJ BE.BF.BG.BH29% 63% 39% 22% 21% 30%BB* BB.BC.BD.BE.BG.BH.BI.BJBB.BC.BH.BI.BJ * BB.BI22% 5% 6% 7% 12% 12%
BB.BF.BG.BH.BI.BJ* * BF.BG BF.BG23% 3% 26% 10% 11% 15%
BC.BD.BF.BH.BI.BJ* BC.BD.BF.BH.BI.BJ BF* BC.BF BC.BF7% 6% 27% 45% 7% 8%* BB.BC.BD.BE.BF.BI.BJBB.BC.BD.BE.BF.BG.BI.BJ*
19% 22% 2% 16% 49% 35%BG* BG BG* BD.BE.BF.BG.BH.BJ BE.BF.BG.BH45% 8% 31% 17% 23% 27%
BB.BC.BD.BF.BG.BH.BI.BJ* BC.BF.BH BF* BF BC.BF
102 303 403 112 133 324103 297 403 116 140 32429% 34% 19% 29% 36% 32%BG* BG BG* BC.BG BG
34% 34% 20% 10% 27% 32%
BG.BH* BG.BH BH * BH BG.BH7% 4% 5% 4% 10% 10%* * BF BF.BG
6% 1% 3% 2% 6% 5%BF* * BF BF3% 1% 3% 1% 2% 2%* *
7% 5% 14% 19% 6% 7%* BC.BF.BI.BJBB.BC.BD.BE.BF.BI.BJ*
14% 19% 37% 35% 13% 12%
* BD.BJ BB.BC.BD.BE.BF.BI.BJBB.BC.BD.BE.BF.BI.BJ*
102 303 403 112 133 324103 297 403 116 140 32432% 42% 20% 29% 31% 34%BG* BC.BG.BH.BI.BJ * BC.BG BC.BG
38% 34% 22% 12% 34% 33%
BG.BH* BG.BH BH * BG.BH BG.BH14% 9% 7% 5% 8% 10%

YouGov RealtimeSpring Travel Coronavirus- MarchUS_nat_int Sample: 5th - 6th March 2020
Male FemaleGen Z (2000 and
later)Millennial (1982-
1999)Gen X (1965-
1981)Baby Boomer
(1946-1964)
Silent Generation (1928-1945)
Pre-Silent Generation (1927 and
earlier)
Other Northeast Midwest South West WhiteTotal
Gender Generation Region Race
A ** D D.E* ** **I prefer to book this in person myself 5% 6% 5% 4% 5% 6% 5% 8% - - 6% 4% 6% 5% 5%
** * ** **I prefer to book this through a travel agent 3% 3% 4% 1% 5% 2% 3% 5% - - 3% 4% 3% 4% 3%
** E * ** **Don't know 8% 7% 8% 10% 10% 7% 5% 9% - - 7% 7% 7% 9% 5%
** F * ** **Not applicable - This isn't part of my trip/someone else I travel with
handles this18% 17% 19% 12% 16% 17% 18% 31% - - 23% 15% 18% 16% 17%
** D.E.F* ** **rrw_q6_3. Activities and Tours
Unweighted base 1124 514 610 42 344 325 342 71 - - 194 220 411 299 768Base: All US Adults 1124 546 578 53 335 307 352 78 - - 200 236 423 265 747
I prefer to book this online myself through a travel site 21% 23% 19% 19% 26% 23% 17% 7% - - 21% 17% 21% 22% 22%** F.G G * ** **
I prefer to book this online myself directly through the company's website
21% 21% 22% 24% 23% 21% 22% 11% - - 23% 25% 19% 21% 24%
** G G * ** ** OI prefer to book this by phone myself 6% 7% 6% 8% 5% 6% 6% 11% - - 4% 5% 8% 6% 5%
** D* ** **I prefer to book this in person myself 7% 9% 6% 10% 6% 10% 7% 4% - - 9% 11% 6% 4% 8%
** * ** ** L.MI prefer to book this through a travel agent 5% 4% 6% 2% 6% 4% 4% 8% - - 5% 6% 4% 5% 5%
** * ** **Don't know 13% 12% 14% 19% 14% 13% 11% 17% - - 10% 12% 15% 14% 10%
** * ** **Not applicable - This isn't part of my trip/someone else I travel with
handles this27% 26% 28% 17% 21% 24% 33% 41% - - 28% 24% 27% 28% 27%
** D.E D.E* ** **rrw_q7. When thinking about taking a leisure trip, which of the following is MOST important to you?
Unweighted base 1124 514 610 42 344 325 342 71 - - 194 220 411 299 768Base: All US Adults 1124 546 578 53 335 307 352 78 - - 200 236 423 265 747
The cost 37% 37% 37% 55% 35% 42% 34% 25% - - 40% 34% 37% 37% 38%** F.G * ** **
The ease of getting to the destination 11% 10% 12% - 10% 12% 11% 20% - - 10% 9% 12% 12% 12%** D.F* ** **
The activities available at the destination 21% 22% 20% 18% 25% 22% 19% 13% - - 19% 27% 17% 24% 23%** G * ** ** L L O
The safety of the destination 17% 17% 17% 10% 14% 15% 23% 20% - - 15% 16% 21% 14% 14%** D.E * ** ** M
Other 3% 3% 3% - 0% 2% 6% 8% - - 4% 3% 2% 3% 4%** D D.E D.E* ** **
Don't know 11% 11% 10% 16% 16% 7% 7% 13% - - 13% 10% 11% 10% 9%** E.F * ** **
rrw_q8. When thinking about taking a leisure trip, which of the following are you MORE likely to do?
Unweighted base 1124 514 610 42 344 325 342 71 - - 194 220 411 299 768Base: All US Adults 1124 546 578 53 335 307 352 78 - - 200 236 423 265 747
I typically choose my destination and then start figuring out the best dates to travel there
48% 49% 47% 34% 49% 50% 49% 37% - - 44% 44% 48% 52% 51%
** * ** ** PI typically choose which dates I want to travel on, and then start looking
at destinations24% 22% 27% 23% 22% 28% 25% 17% - - 25% 25% 25% 22% 24%
** * ** **Neither of these 15% 16% 14% 17% 11% 10% 21% 31% - - 16% 20% 13% 15% 15%

YouGov RealtimeSpring Travel Coronavirus- MarchUS_nat_int Sample: 5th - 6th March 2020
Total
I prefer to book this in person myself 5%
I prefer to book this through a travel agent 3%
Don't know 8%
Not applicable - This isn't part of my trip/someone else I travel with handles this
18%
rrw_q6_3. Activities and ToursUnweighted base 1124
Base: All US Adults 1124I prefer to book this online myself through a travel site 21%
I prefer to book this online myself directly through the company's website
21%
I prefer to book this by phone myself 6%
I prefer to book this in person myself 7%
I prefer to book this through a travel agent 5%
Don't know 13%
Not applicable - This isn't part of my trip/someone else I travel with handles this
27%
rrw_q7. When thinking about taking a leisure trip, which of the following is MOST important to you?
Unweighted base 1124Base: All US Adults 1124
The cost 37%
The ease of getting to the destination 11%
The activities available at the destination 21%
The safety of the destination 17%
Other 3%
Don't know 11%
rrw_q8. When thinking about taking a leisure trip, which of the following are you MORE likely to do?
Unweighted base 1124Base: All US Adults 1124
I typically choose my destination and then start figuring out the best dates to travel there
48%
I typically choose which dates I want to travel on, and then start looking at destinations
24%
Neither of these 15%
Black Hispanic Other (NET)No HS, High
school graduateSome college, 2-
year 4-year Post Grad Married Civil PartnershipLiving together, not married or
civil partnership
In a relationship, not living together
NET: In a relationship Single Divorced
Marital StatusRace Education
* ** * * *5% 6% 4% 6% 5% 4% 5% 6% 4% 6% - 5% 5% 9%
* ** * * *5% 4% 6% 4% 4% 2% 3% 3% 15% 2% 2% 4% 3% 4%
* ** * * *10% 15% 10% 12% 7% 3% 3% 5% 4% 4% 8% 5% 10% 9%
N * S.T.U T ** * * V.Z *
21% 21% 17% 26% 15% 10% 9% 13% 21% 23% 13% 14% 23% 20%
* S.T.U ** V.Z* * V V.Z *
133 151 72 405 380 215 124 495 24 72 44 635 297 104133 176 67 453 348 205 117 481 23 73 41 618 292 11224% 14% 21% 15% 23% 26% 25% 23% 15% 24% 26% 23% 21% 16%
* R R R AC ** AC* AC* AC AC *
13% 18% 18% 13% 24% 30% 29% 22% 8% 25% 32% 23% 21% 20%
* R R R ** * * *6% 11% 4% 5% 5% 7% 9% 7% 17% 2% - 7% 4% 9%
N * ** * * *5% 7% 3% 9% 7% 4% 5% 8% 8% 6% 11% 8% 7% 7%
* T ** * * *3% 6% 5% 4% 6% 3% 9% 5% 11% 3% 9% 5% 3% 3%
* R.T ** * * *20% 20% 19% 19% 11% 8% 8% 11% 11% 9% 9% 10% 16% 16%
N N N* S.T.U ** * * V.Z *
30% 24% 30% 34% 24% 22% 15% 25% 29% 30% 13% 25% 27% 29%
* S.T.U ** * * *
133 151 72 405 380 215 124 495 24 72 44 635 297 104133 176 67 453 348 205 117 481 23 73 41 618 292 11246% 30% 26% 38% 39% 38% 24% 35% 30% 41% 50% 37% 44% 32%P.Q * U U U ** * AB* V *9% 8% 13% 11% 11% 10% 15% 14% 11% 10% 6% 13% 10% 9%
* ** * * *11% 20% 20% 16% 21% 26% 29% 23% 34% 20% 15% 23% 21% 15%
* R R ** * * *21% 24% 23% 17% 18% 15% 21% 18% 7% 13% 16% 17% 15% 25%
N * ** * * AA*2% 2% 3% 3% 2% 5% 6% 3% 6% 2% - 3% 2% 9%
* S ** * * V.Z.AA*12% 16% 16% 16% 9% 6% 5% 7% 12% 14% 13% 8% 9% 10%
N * S.T.U ** * * V *
133 151 72 405 380 215 124 495 24 72 44 635 297 104133 176 67 453 348 205 117 481 23 73 41 618 292 112
43% 38% 40% 38% 49% 60% 61% 50% 43% 43% 52% 49% 48% 48%
* R R.S R.S ** * * *
21% 27% 27% 22% 28% 23% 26% 29% 32% 22% 26% 28% 22% 18%
* R AA ** * * *18% 16% 9% 23% 13% 10% 6% 14% 3% 14% 6% 13% 17% 24%

YouGov RealtimeSpring Travel Coronavirus- MarchUS_nat_int Sample: 5th - 6th March 2020
Total
I prefer to book this in person myself 5%
I prefer to book this through a travel agent 3%
Don't know 8%
Not applicable - This isn't part of my trip/someone else I travel with handles this
18%
rrw_q6_3. Activities and ToursUnweighted base 1124
Base: All US Adults 1124I prefer to book this online myself through a travel site 21%
I prefer to book this online myself directly through the company's website
21%
I prefer to book this by phone myself 6%
I prefer to book this in person myself 7%
I prefer to book this through a travel agent 5%
Don't know 13%
Not applicable - This isn't part of my trip/someone else I travel with handles this
27%
rrw_q7. When thinking about taking a leisure trip, which of the following is MOST important to you?
Unweighted base 1124Base: All US Adults 1124
The cost 37%
The ease of getting to the destination 11%
The activities available at the destination 21%
The safety of the destination 17%
Other 3%
Don't know 11%
rrw_q8. When thinking about taking a leisure trip, which of the following are you MORE likely to do?
Unweighted base 1124Base: All US Adults 1124
I typically choose my destination and then start figuring out the best dates to travel there
48%
I typically choose which dates I want to travel on, and then start looking at destinations
24%
Neither of these 15%
Widowed Separated Other Prefer not to say Younger than 18 18 or over NET: Any ageNot a parent /
guardianDon't know /
Prefer not to say Under $40k $40k to $80k $80k+Don't know /
Prefer not to say Urban
Marital Status Parent or guardian of any children Income Type of Area Lived in
X* ** ** ** AG.AI.AJ AG *2% 4% - 5% 9% 6% 7% 3% 11% 6% 7% 2% 5% 6%* ** ** ** AJ AJ AJ AJ* AN AN3% - - 12% 3% 3% 3% 3% 8% 3% 5% 2% 5% 3%* ** ** ** *
10% 15% 49% 16% 7% 6% 7% 8% 16% 11% 7% 2% 11% 8%* ** ** ** AH.AI* AN AN AN
24% 18% 24% 36% 12% 17% 15% 20% 27% 25% 13% 7% 26% 19%
V* ** ** ** AG AG* AM.AN AN AM.AN
47 21 5 15 274 362 603 483 38 406 314 263 141 36052 22 7 22 268 364 601 483 40 407 320 250 147 3707% 21% 13% 4% 23% 16% 19% 24% 6% 18% 20% 28% 16% 22%* ** ** ** AH.AI.AK AH AH.AI.AK * AL.AM.AO
20% 23% - 9% 24% 21% 22% 20% 22% 16% 23% 30% 19% 21%
* ** ** ** * AL AL.AO4% 16% - - 8% 8% 8% 4% - 5% 8% 7% 3% 8%* ** ** ** AJ AJ AJ *4% 4% 14% - 11% 8% 9% 6% 2% 7% 8% 9% 3% 6%* ** ** ** AJ * AO9% - - 21% 4% 4% 4% 5% 5% 5% 6% 4% 4% 4%* ** ** ** *
18% 19% 49% 14% 12% 12% 13% 13% 28% 17% 13% 7% 15% 14%* ** ** ** AG.AH.AI.AJ* AN AN AN
38% 18% 24% 53% 18% 31% 26% 27% 36% 33% 22% 15% 40% 25%
V.Y.Z* ** ** ** AG.AI AG AG AG* AM.AN AN AM.AN
47 21 5 15 274 362 603 483 38 406 314 263 141 36052 22 7 22 268 364 601 483 40 407 320 250 147 37036% 25% 13% - 32% 34% 33% 44% 7% 41% 37% 33% 31% 35%* ** ** ** AK AK AK AG.AH.AI.AK *
11% 1% 14% 2% 15% 13% 13% 8% 16% 10% 12% 13% 9% 11%* ** ** ** AJ AJ AJ *
11% 29% 24% 16% 24% 20% 22% 21% 13% 17% 20% 33% 17% 21%* ** ** ** * AL.AM.AO
23% 35% - - 18% 20% 19% 15% 6% 18% 21% 13% 14% 20%* ** ** ** * AN4% 3% - - 2% 5% 4% 3% 2% 3% 1% 5% 5% 3%* ** ** ** AG.AI AG * AM AM
15% 7% 49% 82% 10% 7% 9% 10% 55% 12% 9% 3% 24% 10%* ** ** ** AG.AH.AI.AJ* AN AN AL.AM.AN
47 21 5 15 274 362 603 483 38 406 314 263 141 36052 22 7 22 268 364 601 483 40 407 320 250 147 370
45% 41% 13% 16% 54% 49% 51% 46% 18% 42% 50% 59% 42% 47%
* ** ** ** AK AK AK AK * AL.AM.AO
21% 19% 14% 2% 23% 26% 25% 24% 25% 23% 28% 25% 19% 24%
* ** ** ** *20% 26% - 12% 11% 19% 15% 16% 12% 19% 16% 10% 12% 16%

YouGov RealtimeSpring Travel Coronavirus- MarchUS_nat_int Sample: 5th - 6th March 2020
Total
I prefer to book this in person myself 5%
I prefer to book this through a travel agent 3%
Don't know 8%
Not applicable - This isn't part of my trip/someone else I travel with handles this
18%
rrw_q6_3. Activities and ToursUnweighted base 1124
Base: All US Adults 1124I prefer to book this online myself through a travel site 21%
I prefer to book this online myself directly through the company's website
21%
I prefer to book this by phone myself 6%
I prefer to book this in person myself 7%
I prefer to book this through a travel agent 5%
Don't know 13%
Not applicable - This isn't part of my trip/someone else I travel with handles this
27%
rrw_q7. When thinking about taking a leisure trip, which of the following is MOST important to you?
Unweighted base 1124Base: All US Adults 1124
The cost 37%
The ease of getting to the destination 11%
The activities available at the destination 21%
The safety of the destination 17%
Other 3%
Don't know 11%
rrw_q8. When thinking about taking a leisure trip, which of the following are you MORE likely to do?
Unweighted base 1124Base: All US Adults 1124
I typically choose my destination and then start figuring out the best dates to travel there
48%
I typically choose which dates I want to travel on, and then start looking at destinations
24%
Neither of these 15%
Suburban/ Town Rural Other None 1 2 3 4 5 or more trips Don't know
Net: At least one trip
Canceled travel plans
Changed travel plans
Has taken extra precautions
Travel plans that have changed due to the coronavirusType of Area Lived in Number of trips planned to take
AP.AQ ** AT * ** ** * * *5% 6% - 5% 6% 7% 8% - 5% 4% 6% 4% 10% 9%
** * ** ** * * * BF3% 5% - 3% 1% 3% 9% 26% - 4% 3% 3% 11% 5%
** AU.BA* ** ** * AU * BF.BG.BH* BF7% 8% 26% 10% 3% 4% 2% - - 17% 3% 3% 4% 3%
** AU.AV.BA * ** ** AT.AU.AV.AW.BA* * *
18% 16% 22% 24% 9% 10% 3% 6% 8% 28% 8% 7% 7% 6%
** AU.AV.AW.BA * ** ** AU.AV.AW.BA* * *
537 223 4 519 255 155 51 12 14 118 487 63 89 151527 223 4 516 246 155 55 11 17 125 484 69 96 15020% 19% 24% 16% 23% 30% 31% 53% 27% 13% 27% 44% 35% 29%
** AT.AZ AT.AZ AT.AZ* ** ** * AT.AU.AZ BD.BE.BF.BG.BH.BJ* BE.BG.BH* BG
24% 17% - 19% 27% 28% 24% 7% - 12% 26% 21% 19% 22%
AR ** AT.AZ AT.AZ * ** ** * AT.AZ BH* BH* BH5% 6% - 3% 8% 7% 24% - 27% 2% 10% 11% 15% 9%
** AT AT AT.AU.AV.AZ.BA* ** ** * AT.AZ BG.BH* BG.BH* BG.BH7% 10% 29% 5% 10% 11% 6% 8% 5% 6% 10% 4% 8% 12%
** AT AT * ** ** * AT * * BG.BH5% 6% - 4% 5% 4% 2% 19% 5% 7% 5% 2% 7% 6%
** * ** ** * * *12% 15% 26% 15% 7% 7% 9% 8% 17% 26% 8% 4% 10% 9%
** AU.AV.BA * ** ** AT.AU.AV.AW.BA* * *
28% 29% 22% 36% 19% 13% 5% 6% 20% 33% 15% 15% 6% 13%
** AU.AV.AW.BA AW.BA * ** ** AU.AV.AW.BA* * *
537 223 4 519 255 155 51 12 14 118 487 63 89 151527 223 4 516 246 155 55 11 17 125 484 69 96 15038% 37% 51% 44% 34% 31% 25% 24% - 30% 31% 29% 26% 25%
** AU.AV.AW.AZ.BA * ** ** * * *11% 11% 24% 7% 20% 16% 12% 9% 6% 7% 17% 23% 14% 10%
** AT.AZ AT.AZ * ** ** * AT.AZ BD.BE.BG* BG*24% 15% - 15% 24% 36% 40% 24% 41% 11% 30% 14% 27% 34%AR ** AT.AZ AT.AU.AZ AT.AU.AZ* ** ** * AT.AU.AZ * BG.BH* BB.BE.BG.BH.BI.BJ15% 19% - 18% 16% 12% 24% 25% 54% 15% 17% 33% 28% 28%
** * ** ** * AV BF.BG.BH* BF.BG.BH* BF.BG.BH4% 2% - 5% 2% 1% - 13% - 2% 2% - - 1%
** AV.BA * ** ** * * *9% 15% 26% 12% 4% 4% - 6% - 35% 3% 1% 5% 2%
AQ ** AU.AV.AW.BA * ** ** AT.AU.AV.AW.BA* * *
537 223 4 519 255 155 51 12 14 118 487 63 89 151527 223 4 516 246 155 55 11 17 125 484 69 96 150
49% 46% 46% 41% 63% 61% 47% 38% 73% 25% 60% 68% 52% 55%
** AZ AT.AZ AT.AZ AZ* ** ** * AT.AZ BG.BH.BI* BG.BH* BG.BH
24% 25% - 23% 23% 23% 45% 56% 27% 21% 26% 26% 43% 32%
** AT.AU.AV.AZ.BA* ** ** * BH* BB.BF.BG.BH.BJ* BG.BH16% 14% 29% 21% 11% 11% 7% - - 13% 10% 4% 3% 10%

YouGov RealtimeSpring Travel Coronavirus- MarchUS_nat_int Sample: 5th - 6th March 2020
Total
I prefer to book this in person myself 5%
I prefer to book this through a travel agent 3%
Don't know 8%
Not applicable - This isn't part of my trip/someone else I travel with handles this
18%
rrw_q6_3. Activities and ToursUnweighted base 1124
Base: All US Adults 1124I prefer to book this online myself through a travel site 21%
I prefer to book this online myself directly through the company's website
21%
I prefer to book this by phone myself 6%
I prefer to book this in person myself 7%
I prefer to book this through a travel agent 5%
Don't know 13%
Not applicable - This isn't part of my trip/someone else I travel with handles this
27%
rrw_q7. When thinking about taking a leisure trip, which of the following is MOST important to you?
Unweighted base 1124Base: All US Adults 1124
The cost 37%
The ease of getting to the destination 11%
The activities available at the destination 21%
The safety of the destination 17%
Other 3%
Don't know 11%
rrw_q8. When thinking about taking a leisure trip, which of the following are you MORE likely to do?
Unweighted base 1124Base: All US Adults 1124
I typically choose my destination and then start figuring out the best dates to travel there
48%
I typically choose which dates I want to travel on, and then start looking at destinations
24%
Neither of these 15%
Will not make any future travel
plans
Has not changed or
cancelled travel plans
Did not have plans to travel None
Net: Has changed or
cancelled travel plans
Net: Traveling has been
impacted by coronavirus in
some way
Travel plans that have changed due to the coronavirus
BG.BH* *7% 4% 5% 3% 8% 9%* * BF.BG
5% 1% 4% 2% 9% 6%BF* BF * BB.BF.BG.BH BF2% 3% 11% 20% 3% 3%* BD.BE.BF.BI.BJBB.BC.BD.BE.BF.BG.BI.BJ*
2% 7% 32% 30% 7% 6%
* BB.BC.BD.BE.BF.BI.BJBB.BC.BD.BE.BF.BI.BJ*
102 303 403 112 133 324103 297 403 116 140 32421% 26% 10% 18% 39% 29%BG* BG BG* BE.BF.BG.BH.BJ BE.BG.BH
26% 30% 18% 8% 19% 23%
BH* BG.BH.BI BH * BH BH12% 7% 4% 2% 12% 9%
BG.BH* BH * BG.BH BG.BH11% 10% 4% 3% 6% 10%
BG.BH* BG.BH * BG.BH8% 3% 4% 3% 6% 7%* * BF
8% 7% 17% 28% 8% 9%* BB.BD.BE.BF.BI.BJBB.BC.BD.BE.BF.BG.BI.BJ*
14% 16% 43% 37% 9% 12%
* BC BB.BC.BD.BE.BF.BI.BJBB.BC.BD.BE.BF.BI.BJ* BC
102 303 403 112 133 324103 297 403 116 140 32435% 38% 45% 30% 27% 29%
* BD.BJ BB.BC.BD.BH.BI.BJ *10% 16% 6% 11% 17% 14%
* BG * BG BG22% 30% 13% 14% 23% 26%BG* BB.BG.BH * BB.BG BB.BG.BH30% 11% 15% 10% 29% 27%
BF.BG.BH* * BF.BG.BH BF.BG.BH- 3% 6% 2% - 0%* BJ BC.BD.BE.BI.BJ *
4% 2% 16% 34% 4% 4%* BB.BC.BD.BE.BF.BI.BJBB.BC.BD.BE.BF.BG.BI.BJ*
102 303 403 112 133 324103 297 403 116 140 324
60% 64% 35% 33% 55% 56%
BG.BH* BG.BH * BG.BH BG.BH
30% 23% 22% 12% 39% 33%
BH* BH BH * BB.BF.BG.BH BF.BG.BH8% 10% 25% 13% 4% 8%

YouGov RealtimeSpring Travel Coronavirus- MarchUS_nat_int Sample: 5th - 6th March 2020
Male FemaleGen Z (2000 and
later)Millennial (1982-
1999)Gen X (1965-
1981)Baby Boomer
(1946-1964)
Silent Generation (1928-1945)
Pre-Silent Generation (1927 and
earlier)
Other Northeast Midwest South West WhiteTotal
Gender Generation Region Race
** D.E D.E* ** ** LDon't know 13% 13% 12% 26% 18% 12% 5% 15% - - 15% 10% 14% 11% 9%
** F F F* ** **KYC_Q9a. When thinking of travel and the coronavirus, which, if any, of the following statements apply to you? Please select all that apply.
Unweighted base 1124 514 610 42 344 325 342 71 - - 194 220 411 299 768Base: All US Adults 1124 546 578 53 335 307 352 78 - - 200 236 423 265 747
I've canceled my travel plans because of the coronavirus 6% 8% 4% 12% 10% 6% 3% 1% - - 10% 3% 7% 6% 5%B ** F.G * ** ** K K
I've changed my travel plans because of the coronavirus (e.g. decided to skip a city because of an outbreak, take an airplane instead of a cruise to
a destination, etc.)9% 10% 7% 20% 14% 10% 2% 4% - - 12% 3% 10% 7% 6%
B ** F.G F * ** ** K K KI've taken extra precautions to avoid infection while traveling because of
the coronavirus (e.g., washing hands more frequently, wearing a face mask, avoiding public transit, etc.)
13% 15% 11% 23% 16% 16% 7% 10% - - 15% 12% 14% 13% 11%
** F F * ** **
I decided not to make any future travel plans because of the coronavirus 9% 8% 10% 23% 7% 7% 10% 15% - - 12% 9% 8% 10% 9%
** E* ** **I haven't canceled or changed any of my travel plans because of the
coronavirus26% 27% 26% 11% 21% 28% 34% 18% - - 21% 31% 24% 30% 31%
** D D.G * ** ** J J O.PNot applicable- I did not and still do not have any plans to travel 36% 35% 36% 24% 29% 37% 40% 52% - - 33% 39% 34% 38% 37%
** D D D.E* ** ** QNone of these 10% 9% 11% 25% 15% 7% 8% 3% - - 14% 7% 12% 8% 8%
** E.F.G * ** ** K.M KNet: Has changed or cancelled travel plans 12% 15% 10% 23% 21% 13% 4% 5% - - 15% 6% 16% 11% 9%
B ** E.F.G F * ** ** K K K
Net: Traveling has been impacted by the coronavirus in some way 29% 31% 27% 40% 37% 29% 19% 29% - - 34% 25% 31% 26% 25%
** E.F F * ** **KYC_Q10. If there was a coronavirus outbreak at the destination(s) you plan to visit this spring (i.e., from March 20th to June 20th), which ONE of the following would you be most likely to do?
Unweighted base 487 224 263 19 153 144 145 26 - - 80 96 179 132 334Base: All US Adults who are planning on taking atleast one trip
this spring484 232 251 25 150 136 144 28 - - 81 102 181 120 330
I would cancel the trip 42% 40% 44% 29% 38% 38% 50% 60% - - 47% 38% 44% 41% 45%** D.E ** ** ** * *
I would still go on the trip, but I would take precautions to avoid infection (e.g., washing hands frequently, wearing a face mask, avoiding public
transit, etc.)35% 38% 32% 43% 38% 42% 26% 24% - - 31% 37% 38% 30% 33%
** F F ** ** ** * *I wouldn't change my travel plans or behavior at all 15% 14% 15% 14% 18% 15% 12% 6% - - 11% 17% 12% 18% 15%
** ** ** ** * *Other 0% - 0% - - 1% - - - - - - 1% - 0%
** ** ** ** * *Don't know 8% 8% 8% 13% 6% 4% 12% 9% - - 11% 8% 5% 11% 7%
** E ** ** ** * *
Net: Traveling plans or behaviors would be impacted by coronavirus 77% 78% 77% 73% 75% 80% 76% 84% - - 78% 75% 82% 72% 77%
** ** ** ** * * MKYC_Q11. How comfortable or uncomfortable would you be traveling to a destination where there was a coronavirus outbreak?

YouGov RealtimeSpring Travel Coronavirus- MarchUS_nat_int Sample: 5th - 6th March 2020
Total
Don't know 13%
KYC_Q9a. When thinking of travel and the coronavirus, which, if any, of the following statements apply to you? Please select all that apply.
Unweighted base 1124Base: All US Adults 1124
I've canceled my travel plans because of the coronavirus 6%
I've changed my travel plans because of the coronavirus (e.g. decided to skip a city because of an outbreak, take an airplane instead of a cruise to
a destination, etc.)9%
I've taken extra precautions to avoid infection while traveling because of the coronavirus (e.g., washing hands more frequently, wearing a face
mask, avoiding public transit, etc.)13%
I decided not to make any future travel plans because of the coronavirus 9%
I haven't canceled or changed any of my travel plans because of the coronavirus
26%
Not applicable- I did not and still do not have any plans to travel 36%
None of these 10%
Net: Has changed or cancelled travel plans 12%
Net: Traveling has been impacted by the coronavirus in some way 29%
KYC_Q10. If there was a coronavirus outbreak at the destination(s) you plan to visit this spring (i.e., from March 20th to June 20th), which ONE of the following would you be most likely to do?
Unweighted base 487Base: All US Adults who are planning on taking atleast one trip
this spring484
I would cancel the trip 42%
I would still go on the trip, but I would take precautions to avoid infection (e.g., washing hands frequently, wearing a face mask, avoiding public
transit, etc.)35%
I wouldn't change my travel plans or behavior at all 15%
Other 0%
Don't know 8%
Net: Traveling plans or behaviors would be impacted by coronavirus 77%
KYC_Q11. How comfortable or uncomfortable would you be traveling to a destination where there was a coronavirus outbreak?
Black Hispanic Other (NET)No HS, High
school graduateSome college, 2-
year 4-year Post Grad Married Civil PartnershipLiving together, not married or
civil partnership
In a relationship, not living together
NET: In a relationship Single Divorced
Marital StatusRace Education
* S.T.U U ** * * V.Y.Z*18% 19% 24% 18% 10% 7% 7% 7% 21% 20% 16% 10% 13% 9%
N N N* S.T.U ** V.Z* V* V V *
133 151 72 405 380 215 124 495 24 72 44 635 297 104133 176 67 453 348 205 117 481 23 73 41 618 292 11210% 10% 7% 8% 4% 6% 7% 7% 7% 8% 7% 7% 6% 5%
N N * ** * * *
13% 15% 9% 9% 7% 9% 11% 8% 17% 10% 7% 8% 12% 3%
N N * ** * * AB.AC *
13% 18% 28% 12% 11% 16% 21% 12% 18% 18% 19% 14% 16% 7%
N N.O* R.S ** * AB* AB *
11% 7% 14% 9% 10% 8% 10% 9% 22% 8% 11% 9% 8% 9%
* ** * * *
14% 18% 20% 18% 28% 35% 39% 34% 15% 29% 34% 32% 17% 28%
* R R R.S AA ** AA* AA* AA AA*42% 31% 22% 44% 34% 27% 23% 32% 30% 34% 16% 31% 41% 46%
Q * S.T.U U Y ** * * Y V.Y.Z V.Y.Z*15% 16% 15% 11% 12% 10% 5% 8% 22% 7% 16% 9% 12% 7%
N N N* U ** * * V *18% 20% 14% 13% 11% 12% 15% 12% 25% 13% 11% 13% 15% 6%
N N * AC ** AC* * AC AB.AC *
30% 36% 46% 27% 28% 30% 35% 28% 37% 34% 35% 30% 31% 20%
N N.O* ** * * AB *
49 71 33 134 165 114 74 248 12 27 26 313 107 31
46 79 29 152 151 109 71 242 12 28 24 306 107 32
51% 30% 35% 47% 42% 36% 43% 45% 23% 42% 40% 44% 39% 58%P* * * * ** ** ** * **
29% 48% 37% 30% 35% 45% 31% 32% 41% 28% 45% 33% 44% 24%
* N* * R * ** ** ** V* **9% 13% 18% 17% 14% 11% 15% 15% 29% 25% 11% 16% 9% 11%* * * * ** ** ** * **- - - - - 1% - 0% - - - 0% - -* * * * ** ** ** * **
11% 9% 10% 6% 9% 8% 11% 8% 7% 5% 4% 7% 8% 7%
* * * * ** ** ** * **
80% 78% 72% 77% 77% 80% 74% 77% 64% 70% 85% 76% 83% 82%
* * * * ** ** ** * **

YouGov RealtimeSpring Travel Coronavirus- MarchUS_nat_int Sample: 5th - 6th March 2020
Total
Don't know 13%
KYC_Q9a. When thinking of travel and the coronavirus, which, if any, of the following statements apply to you? Please select all that apply.
Unweighted base 1124Base: All US Adults 1124
I've canceled my travel plans because of the coronavirus 6%
I've changed my travel plans because of the coronavirus (e.g. decided to skip a city because of an outbreak, take an airplane instead of a cruise to
a destination, etc.)9%
I've taken extra precautions to avoid infection while traveling because of the coronavirus (e.g., washing hands more frequently, wearing a face
mask, avoiding public transit, etc.)13%
I decided not to make any future travel plans because of the coronavirus 9%
I haven't canceled or changed any of my travel plans because of the coronavirus
26%
Not applicable- I did not and still do not have any plans to travel 36%
None of these 10%
Net: Has changed or cancelled travel plans 12%
Net: Traveling has been impacted by the coronavirus in some way 29%
KYC_Q10. If there was a coronavirus outbreak at the destination(s) you plan to visit this spring (i.e., from March 20th to June 20th), which ONE of the following would you be most likely to do?
Unweighted base 487Base: All US Adults who are planning on taking atleast one trip
this spring484
I would cancel the trip 42%
I would still go on the trip, but I would take precautions to avoid infection (e.g., washing hands frequently, wearing a face mask, avoiding public
transit, etc.)35%
I wouldn't change my travel plans or behavior at all 15%
Other 0%
Don't know 8%
Net: Traveling plans or behaviors would be impacted by coronavirus 77%
KYC_Q11. How comfortable or uncomfortable would you be traveling to a destination where there was a coronavirus outbreak?
Widowed Separated Other Prefer not to say Younger than 18 18 or over NET: Any ageNot a parent /
guardianDon't know /
Prefer not to say Under $40k $40k to $80k $80k+Don't know /
Prefer not to say Urban
Marital Status Parent or guardian of any children Income Type of Area Lived in
* ** ** ** AG.AI AG * AN14% 14% 72% 71% 12% 7% 9% 14% 45% 16% 7% 6% 27% 13%* ** ** ** AH AH AH.AI AG.AH.AI.AJ* AM.AN AL.AM.AN
47 21 5 15 274 362 603 483 38 406 314 263 141 36052 22 7 22 268 364 601 483 40 407 320 250 147 370- 12% - - 12% 3% 7% 6% 5% 6% 6% 5% 7% 9%* ** ** ** AH.AI.AJ AH * AQ
1% 23% 14% 9% 15% 3% 8% 9% 10% 9% 10% 8% 5% 14%
* ** ** ** AH.AI.AJ AH AH AH* AQ.AR
6% 21% - 7% 19% 10% 14% 13% 6% 12% 14% 18% 9% 16%
* ** ** ** AH.AI.AJ AH * AL.AO
17% 7% - - 11% 11% 10% 8% 2% 7% 9% 12% 10% 10%
* ** ** ** * AL
24% 16% - 9% 28% 31% 29% 24% 14% 18% 28% 41% 23% 21%
* ** ** ** AJ.AK * AL AL.AM.AO46% 23% 37% 32% 23% 40% 33% 40% 29% 44% 37% 21% 38% 35%Y.Z* ** ** ** AG.AI AG AG.AI * AN AN AN6% 10% 49% 42% 11% 6% 8% 11% 34% 11% 7% 7% 20% 11%* ** ** ** AH AH AH AG.AH.AI.AJ* AL.AM.AN1% 23% 14% 9% 22% 5% 13% 12% 15% 13% 14% 11% 10% 19%* ** ** ** AH.AI.AJ AH AH AH* AQ.AR
24% 50% 14% 16% 40% 24% 31% 27% 24% 29% 29% 33% 22% 35%
* ** ** ** AH.AI.AJ AH * AO AQ.AR
18 12 1 5 145 167 293 181 13 143 136 161 47 153
19 14 1 6 145 164 290 180 13 139 141 153 50 153
41% 23% - - 40% 51% 45% 37% 48% 44% 39% 43% 45% 37%** ** ** ** AI.AJ ** *
26% 58% 100% - 34% 28% 31% 43% 12% 36% 42% 28% 31% 44%
** ** ** ** AH.AI ** AN * AQ13% 19% - 71% 20% 11% 15% 13% 25% 12% 10% 21% 15% 13%** ** ** ** AH AH ** AL.AM *- - - - - 1% 0% - - - 1% - - -** ** ** ** ** *20% - - 29% 6% 9% 8% 7% 14% 8% 8% 8% 9% 7%
** ** ** ** ** *
67% 81% 100% - 74% 79% 77% 80% 60% 81% 81% 71% 76% 81%
** ** ** ** ** *

YouGov RealtimeSpring Travel Coronavirus- MarchUS_nat_int Sample: 5th - 6th March 2020
Total
Don't know 13%
KYC_Q9a. When thinking of travel and the coronavirus, which, if any, of the following statements apply to you? Please select all that apply.
Unweighted base 1124Base: All US Adults 1124
I've canceled my travel plans because of the coronavirus 6%
I've changed my travel plans because of the coronavirus (e.g. decided to skip a city because of an outbreak, take an airplane instead of a cruise to
a destination, etc.)9%
I've taken extra precautions to avoid infection while traveling because of the coronavirus (e.g., washing hands more frequently, wearing a face
mask, avoiding public transit, etc.)13%
I decided not to make any future travel plans because of the coronavirus 9%
I haven't canceled or changed any of my travel plans because of the coronavirus
26%
Not applicable- I did not and still do not have any plans to travel 36%
None of these 10%
Net: Has changed or cancelled travel plans 12%
Net: Traveling has been impacted by the coronavirus in some way 29%
KYC_Q10. If there was a coronavirus outbreak at the destination(s) you plan to visit this spring (i.e., from March 20th to June 20th), which ONE of the following would you be most likely to do?
Unweighted base 487Base: All US Adults who are planning on taking atleast one trip
this spring484
I would cancel the trip 42%
I would still go on the trip, but I would take precautions to avoid infection (e.g., washing hands frequently, wearing a face mask, avoiding public
transit, etc.)35%
I wouldn't change my travel plans or behavior at all 15%
Other 0%
Don't know 8%
Net: Traveling plans or behaviors would be impacted by coronavirus 77%
KYC_Q11. How comfortable or uncomfortable would you be traveling to a destination where there was a coronavirus outbreak?
Suburban/ Town Rural Other None 1 2 3 4 5 or more trips Don't know
Net: At least one trip
Canceled travel plans
Changed travel plans
Has taken extra precautions
Travel plans that have changed due to the coronavirusType of Area Lived in Number of trips planned to take
** AU.AV.AW.BA * ** ** * * * BC.BI11% 15% 26% 14% 3% 6% 1% 6% - 40% 4% 1% 3% 2%
** AU.AV.AW.BA * ** ** AT.AU.AV.AW.BA* * *
537 223 4 519 255 155 51 12 14 118 487 63 89 151527 223 4 516 246 155 55 11 17 125 484 69 96 1505% 5% - 5% 6% 7% 16% 17% 20% 2% 8% 100% 27% 12%
** AT.AU.AZ* ** ** * AT.AZ BC.BD.BE.BF.BG.BH.BI.BJ*BD.BE.BF.BG.BH* BF.BG.BH
6% 5% 24% 3% 7% 16% 48% 30% 46% 2% 17% 37% 100% 22%
** AT AT.AU.AZ AT.AU.AV.AZ.BA* ** ** * AT.AU.AZ BD.BE.BF.BG.BH*BB.BD.BE.BF.BG.BH.BI.BJ*BF.BG.BH
12% 12% 22% 6% 18% 25% 39% 35% 28% 5% 23% 27% 34% 100%
** AT.AZ AT.AZ AT.AU.AZ.BA* ** ** * AT.AU.AZ BF.BG.BH* BE.BF.BG.BH*BB.BC.BE.BF.BG.BH.BI.BJ
10% 7% - 9% 10% 7% 14% 16% 5% 10% 9% 16% 14% 12%
** * ** ** * BF.BG.BH* BF.BG.BH* BF.BG.BH
30% 27% 29% 10% 58% 50% 21% 29% 38% 6% 50% - - 8%
AP ** AT.AW.AZ.BA AT.AW.AZ AT.AZ* ** ** * AT.AW.AZ * * BB.BC.BG.BH.BI36% 37% - 67% - - - - - 48% - - - -
** AU.AV.AW.AZ.BA * ** ** AU.AV.AW.BA* * *10% 10% 26% 7% 11% 7% 6% - 5% 30% 8% - - -
** * ** ** AT.AU.AV.AW.BA* * *9% 10% 24% 6% 12% 22% 50% 46% 46% 3% 21% 100% 100% 27%
** AT.AZ AT.AU.AZ AT.AU.AV.AZ.BA* ** ** * AT.AU.AZ BD.BE.BF.BG.BH.BJ*BD.BE.BF.BG.BH.BJ* BF.BG.BH
26% 26% 46% 17% 34% 46% 75% 71% 57% 16% 44% 100% 100% 100%
** AT.AZ AT.AU.AZ AT.AU.AV.AZ.BA* ** ** * AT.AU.AZ BF.BG.BH* BF.BG.BH* BF.BG.BH
237 95 2 - 255 155 51 12 14 - 487 37 76 113
235 95 2 - 246 155 55 11 17 - 484 41 80 113
45% 44% 100% - 46% 46% 27% 15% 25% - 42% 51% 35% 32%* ** ** AW AW * ** ** ** AW ** * *
30% 34% - - 32% 30% 57% 48% 44% - 35% 23% 55% 51%
* ** ** AU.AV.BA* ** ** ** ** BE.BF.BH.BI.BJ* BE.BF.BH.BJ*15% 17% - - 13% 17% 9% 19% 23% - 15% 27% 7% 13%
* ** ** * ** ** ** ** * *0% - - - - 1% - - - - 0% - - -
* ** ** * ** ** ** ** * *10% 5% - - 9% 6% 6% 18% 8% - 8% - 3% 4%
* ** ** * ** ** ** ** * *
75% 78% 100% - 77% 76% 85% 63% 69% - 77% 73% 90% 83%
* ** ** * ** ** ** ** BF.BH.BI* BH*

YouGov RealtimeSpring Travel Coronavirus- MarchUS_nat_int Sample: 5th - 6th March 2020
Total
Don't know 13%
KYC_Q9a. When thinking of travel and the coronavirus, which, if any, of the following statements apply to you? Please select all that apply.
Unweighted base 1124Base: All US Adults 1124
I've canceled my travel plans because of the coronavirus 6%
I've changed my travel plans because of the coronavirus (e.g. decided to skip a city because of an outbreak, take an airplane instead of a cruise to
a destination, etc.)9%
I've taken extra precautions to avoid infection while traveling because of the coronavirus (e.g., washing hands more frequently, wearing a face
mask, avoiding public transit, etc.)13%
I decided not to make any future travel plans because of the coronavirus 9%
I haven't canceled or changed any of my travel plans because of the coronavirus
26%
Not applicable- I did not and still do not have any plans to travel 36%
None of these 10%
Net: Has changed or cancelled travel plans 12%
Net: Traveling has been impacted by the coronavirus in some way 29%
KYC_Q10. If there was a coronavirus outbreak at the destination(s) you plan to visit this spring (i.e., from March 20th to June 20th), which ONE of the following would you be most likely to do?
Unweighted base 487Base: All US Adults who are planning on taking atleast one trip
this spring484
I would cancel the trip 42%
I would still go on the trip, but I would take precautions to avoid infection (e.g., washing hands frequently, wearing a face mask, avoiding public
transit, etc.)35%
I wouldn't change my travel plans or behavior at all 15%
Other 0%
Don't know 8%
Net: Traveling plans or behaviors would be impacted by coronavirus 77%
KYC_Q11. How comfortable or uncomfortable would you be traveling to a destination where there was a coronavirus outbreak?
Will not make any future travel
plans
Has not changed or
cancelled travel plans
Did not have plans to travel None
Net: Has changed or
cancelled travel plans
Net: Traveling has been
impacted by coronavirus in
some way
Travel plans that have changed due to the coronavirus
* BC.BI BB.BC.BD.BE.BF.BH.BI.BJ BC.BI* BC.BI3% 3% 18% 43% 3% 3%* BB.BC.BD.BE.BF.BI.BJBB.BC.BD.BE.BF.BG.BI.BJ*
102 303 403 112 133 324103 297 403 116 140 32411% - - - 49% 21%
BF.BG.BH* * BC.BD.BE.BF.BG.BH.BJBD.BE.BF.BG.BH
14% - - - 69% 30%
BF.BG.BH* * BB.BD.BE.BF.BG.BH.BJBD.BE.BF.BG.BH
18% 4% - - 29% 46%
BF.BG.BH* BG * BF.BG.BH BB.BC.BE.BF.BG.BH.BI
100% 2% - - 13% 32%
BB.BC.BD.BF.BG.BH.BI.BJ* BG * BF.BG.BH BB.BC.BD.BF.BG.BH.BI
7% 100% - - - 5%
BC.BG.BH.BI*BB.BC.BD.BE.BG.BH.BI.BJ * BC.BG.BH.BI- - 100% - - -* BB.BC.BD.BE.BF.BH.BI.BJ *- - - 100% - -* BB.BC.BD.BE.BF.BG.BI.BJ*
18% - - - 100% 43%BF.BG.BH* * BD.BE.BF.BG.BH.BJBD.BE.BF.BG.BH
100% 5% - - 100% 100%
BF.BG.BH* BG.BH * BF.BG.BH BF.BG.BH
42 243 - 43 99 214
45 240 - 41 103 214
68% 42% - 51% 39% 42%BC.BD.BF.BI.BJ* ** BD* * BD
28% 31% - 12% 47% 43%
* BH ** * BF.BH* BE.BF.BH4% 17% - 15% 13% 12%* ** * BC*- 0% - - - -* ** * *- 9% - 22% 2% 3%
* BI.BJ ** BC.BD.BE.BF.BI.BJ* *
96% 74% - 63% 85% 85%
BF.BH.BJ* ** * BF.BH* BF.BH

YouGov RealtimeSpring Travel Coronavirus- MarchUS_nat_int Sample: 5th - 6th March 2020
Male FemaleGen Z (2000 and
later)Millennial (1982-
1999)Gen X (1965-
1981)Baby Boomer
(1946-1964)
Silent Generation (1928-1945)
Pre-Silent Generation (1927 and
earlier)
Other Northeast Midwest South West WhiteTotal
Gender Generation Region Race
Unweighted base 1124 514 610 42 344 325 342 71 - - 194 220 411 299 768Base: All US Adults 1124 546 578 53 335 307 352 78 - - 200 236 423 265 747
Very comfortable 6% 8% 4% 2% 8% 6% 5% 3% - - 7% 3% 5% 9% 6%B ** * ** ** K K.L
Somewhat comfortable 10% 11% 8% 16% 9% 13% 7% 5% - - 9% 9% 10% 10% 9%** F * ** **
Somewhat uncomfortable 24% 25% 23% 11% 29% 25% 21% 18% - - 21% 26% 21% 28% 25%** F * ** ** L O
Very uncomfortable 49% 45% 54% 42% 38% 47% 59% 70% - - 50% 54% 51% 41% 51%A ** D D.E D.E* ** ** M M P
Don't know 11% 12% 11% 30% 16% 10% 7% 4% - - 13% 9% 13% 11% 8%** E.F.G * ** **
Net: Comfortable 15% 19% 12% 17% 17% 19% 13% 8% - - 16% 12% 15% 19% 15%B ** F.G * ** ** K
Net: Uncomfortable 73% 69% 77% 53% 67% 71% 80% 88% - - 71% 80% 72% 70% 76%A ** D.E D.E* ** ** M P
Cell Contents (Column Percentages, Statistical Test Results), Statistics (Column Proportions, (95%): A/B, C/D/E/F/G/H/I, J/K/L/M, N/O/P/Q, R/S/T/U, V/W/X/Y/Z/AA/AB/AC/AD/AE/AF, AG/AH/AI/AJ/AK, AL/AM/AN/AO, AP/AQ/AR/AS, AT/AU/AV/AW/AX/AY/AZ/BA, BB/BC/BD/BE/BF/BG/BH/BI/BJ, Minimum Base: 30 (**), Small Base: 100 (*))

YouGov RealtimeSpring Travel Coronavirus- MarchUS_nat_int Sample: 5th - 6th March 2020
Total
Unweighted base 1124Base: All US Adults 1124
Very comfortable 6%
Somewhat comfortable 10%
Somewhat uncomfortable 24%
Very uncomfortable 49%
Don't know 11%
Net: Comfortable 15%
Net: Uncomfortable 73%
Cell Contents (Column Percentages, Statistical Test Results), Statistics (Column Proportions, (95%): A/B, C/D/E/F/G/H/I, J/K/L/M, N/O/P/Q, R/S/T/U, V/W/X/Y/Z/AA/AB/AC/AD/AE/AF, AG/AH/AI/AJ/AK, AL/AM/AN/AO, AP/AQ/AR/AS, AT/AU/AV/AW/AX/AY/AZ/BA, BB/BC/BD/BE/BF/BG/BH/BI/BJ, Minimum Base: 30 (**), Small Base: 100 (*))
Black Hispanic Other (NET)No HS, High
school graduateSome college, 2-
year 4-year Post Grad Married Civil PartnershipLiving together, not married or
civil partnership
In a relationship, not living together
NET: In a relationship Single Divorced
Marital StatusRace Education
133 151 72 405 380 215 124 495 24 72 44 635 297 104133 176 67 453 348 205 117 481 23 73 41 618 292 1126% 4% 5% 6% 4% 4% 12% 8% 4% 2% 5% 7% 5% 6%
* S.T ** * * *7% 15% 7% 8% 9% 12% 13% 9% 21% 12% 15% 10% 9% 9%
* ** * AC* *12% 24% 32% 16% 27% 35% 25% 26% 27% 28% 22% 26% 25% 16%
O O* R R R ** * * AB *59% 37% 41% 54% 50% 41% 44% 50% 34% 46% 46% 49% 46% 64%P.Q * T.U ** * * V.X.Z.AA*16% 20% 15% 15% 10% 8% 8% 7% 14% 12% 12% 8% 16% 6%
N N * T.U ** * * V V.Z.AB *13% 19% 12% 15% 13% 17% 24% 17% 25% 14% 19% 17% 14% 14%
* R.S ** * * AC *71% 61% 73% 70% 77% 76% 68% 76% 61% 74% 68% 75% 71% 80%
* ** * * *
Cell Contents (Column Percentages, Statistical Test Results), Statistics (Column Proportions, (95%): A/B, C/D/E/F/G/H/I, J/K/L/M, N/O/P/Q, R/S/T/U, V/W/X/Y/Z/AA/AB/AC/AD/AE/AF, AG/AH/AI/AJ/AK, AL/AM/AN/AO, AP/AQ/AR/AS, AT/AU/AV/AW/AX/AY/AZ/BA, BB/BC/BD/BE/BF/BG/BH/BI/BJ, Minimum Base: 30 (**), Small Base: 100 (*))

YouGov RealtimeSpring Travel Coronavirus- MarchUS_nat_int Sample: 5th - 6th March 2020
Total
Unweighted base 1124Base: All US Adults 1124
Very comfortable 6%
Somewhat comfortable 10%
Somewhat uncomfortable 24%
Very uncomfortable 49%
Don't know 11%
Net: Comfortable 15%
Net: Uncomfortable 73%
Cell Contents (Column Percentages, Statistical Test Results), Statistics (Column Proportions, (95%): A/B, C/D/E/F/G/H/I, J/K/L/M, N/O/P/Q, R/S/T/U, V/W/X/Y/Z/AA/AB/AC/AD/AE/AF, AG/AH/AI/AJ/AK, AL/AM/AN/AO, AP/AQ/AR/AS, AT/AU/AV/AW/AX/AY/AZ/BA, BB/BC/BD/BE/BF/BG/BH/BI/BJ, Minimum Base: 30 (**), Small Base: 100 (*))
Widowed Separated Other Prefer not to say Younger than 18 18 or over NET: Any ageNot a parent /
guardianDon't know /
Prefer not to say Under $40k $40k to $80k $80k+Don't know /
Prefer not to say Urban
Marital Status Parent or guardian of any children Income Type of Area Lived in
47 21 5 15 274 362 603 483 38 406 314 263 141 36052 22 7 22 268 364 601 483 40 407 320 250 147 3704% 1% - 9% 10% 5% 7% 5% 7% 5% 5% 9% 5% 8%* ** ** ** AH.AI.AJ AH *2% 23% 24% 7% 14% 9% 11% 9% 2% 9% 11% 12% 5% 13%* ** ** ** AH.AI.AJ.AK * AO AQ
24% 11% - 2% 28% 20% 24% 25% 16% 18% 24% 30% 26% 20%* ** ** ** AH.AI AH * AL
64% 58% 28% 4% 38% 61% 52% 48% 25% 53% 52% 44% 42% 47%AA* ** ** ** AG.AI.AJ.AK AG.AK AG.AK * AN.AO7% 7% 49% 78% 10% 5% 7% 14% 50% 14% 8% 5% 23% 13%* ** ** ** AH.AI AH AH.AI AG.AH.AI.AJ* AM.AN AL.AM.AN6% 24% 24% 16% 24% 14% 18% 13% 9% 14% 16% 21% 10% 20%* ** ** ** AH.AI.AJ AH * AL.AO AQ.AR
88% 69% 28% 6% 66% 81% 76% 73% 41% 72% 77% 74% 67% 67%Y.AA* ** ** ** AK AG.AI.AJ.AK AG.AK AK *

YouGov RealtimeSpring Travel Coronavirus- MarchUS_nat_int Sample: 5th - 6th March 2020
Total
Unweighted base 1124Base: All US Adults 1124
Very comfortable 6%
Somewhat comfortable 10%
Somewhat uncomfortable 24%
Very uncomfortable 49%
Don't know 11%
Net: Comfortable 15%
Net: Uncomfortable 73%
Cell Contents (Column Percentages, Statistical Test Results), Statistics (Column Proportions, (95%): A/B, C/D/E/F/G/H/I, J/K/L/M, N/O/P/Q, R/S/T/U, V/W/X/Y/Z/AA/AB/AC/AD/AE/AF, AG/AH/AI/AJ/AK, AL/AM/AN/AO, AP/AQ/AR/AS, AT/AU/AV/AW/AX/AY/AZ/BA, BB/BC/BD/BE/BF/BG/BH/BI/BJ, Minimum Base: 30 (**), Small Base: 100 (*))
Suburban/ Town Rural Other None 1 2 3 4 5 or more trips Don't know
Net: At least one trip
Canceled travel plans
Changed travel plans
Has taken extra precautions
Travel plans that have changed due to the coronavirusType of Area Lived in Number of trips planned to take
537 223 4 519 255 155 51 12 14 118 487 63 89 151527 223 4 516 246 155 55 11 17 125 484 69 96 1505% 5% - 5% 7% 7% 12% 19% - 1% 8% 27% 15% 8%
** AZ AZ AZ AZ* ** ** * AZ BD.BE.BF.BG.BH.BI.BJ*BE.BF.BG.BH* BE8% 8% 24% 5% 16% 16% 15% 17% 36% 1% 17% 17% 27% 19%
** AZ AT.AZ AT.AZ AT.AZ* ** ** * AT.AZ BG.BH* BE.BF.BG.BH.BJ* BE.BG.BH25% 27% - 17% 29% 38% 37% 52% 49% 10% 34% 8% 29% 31%
** AT.AZ AT.AZ AT.AZ* ** ** * AT.AU.AZ * BB.BE.BG* BB.BE.BG.BH.BJ52% 46% 51% 61% 43% 34% 32% 6% 15% 51% 37% 48% 25% 38%
** AU.AV.AW.BA BA * ** ** AV.BA* BC.BI* * BC9% 14% 26% 11% 4% 6% 3% 6% - 38% 5% - 4% 3%
** AU.BA * ** ** AT.AU.AV.AW.BA* * *13% 13% 24% 11% 23% 22% 28% 36% 36% 1% 24% 44% 42% 27%
** AZ AT.AZ AT.AZ AT.AZ* ** ** * AT.AZ BD.BE.BF.BG.BH.BJ*BD.BE.BF.BG.BH.BJ* BE.BG.BH78% 73% 51% 78% 73% 71% 69% 58% 64% 60% 71% 56% 54% 70%AP ** AZ.BA AZ * ** ** * AZ * * BC.BH.BI

YouGov RealtimeSpring Travel Coronavirus- MarchUS_nat_int Sample: 5th - 6th March 2020
Total
Unweighted base 1124Base: All US Adults 1124
Very comfortable 6%
Somewhat comfortable 10%
Somewhat uncomfortable 24%
Very uncomfortable 49%
Don't know 11%
Net: Comfortable 15%
Net: Uncomfortable 73%
Cell Contents (Column Percentages, Statistical Test Results), Statistics (Column Proportions, (95%): A/B, C/D/E/F/G/H/I, J/K/L/M, N/O/P/Q, R/S/T/U, V/W/X/Y/Z/AA/AB/AC/AD/AE/AF, AG/AH/AI/AJ/AK, AL/AM/AN/AO, AP/AQ/AR/AS, AT/AU/AV/AW/AX/AY/AZ/BA, BB/BC/BD/BE/BF/BG/BH/BI/BJ, Minimum Base: 30 (**), Small Base: 100 (*))
Will not make any future travel
plans
Has not changed or
cancelled travel plans
Did not have plans to travel None
Net: Has changed or
cancelled travel plans
Net: Traveling has been
impacted by coronavirus in
some way
Travel plans that have changed due to the coronavirus
102 303 403 112 133 324103 297 403 116 140 3242% 6% 4% 2% 17% 9%* * BD.BE.BF.BG.BH.BJ BE.BG.BH
7% 15% 3% 5% 22% 14%* BE.BG.BH * BE.BG.BH.BJ BE.BG.BH
15% 39% 15% 16% 23% 25%* BB.BE.BG.BH.BI.BJ * BB BB.BE.BG
76% 36% 64% 33% 35% 48%BB.BC.BD.BF.BG.BH.BI.BJ* BB.BC.BD.BF.BH.BI.BJ * BC BC.BD.BF.BH.BI
1% 4% 14% 44% 3% 3%* BB.BC.BD.BE.BF.BI.BJBB.BC.BD.BE.BF.BG.BI.BJ*
8% 21% 7% 7% 40% 24%* BE.BG.BH * BD.BE.BF.BG.BH.BJ BE.BG.BH
91% 75% 79% 50% 58% 73%BB.BC.BD.BF.BG.BH.BI.BJ*BB.BC.BH.BI BB.BC.BD.BH.BI * BB.BC.BH.BI