Embed Size (px)
Citation preview
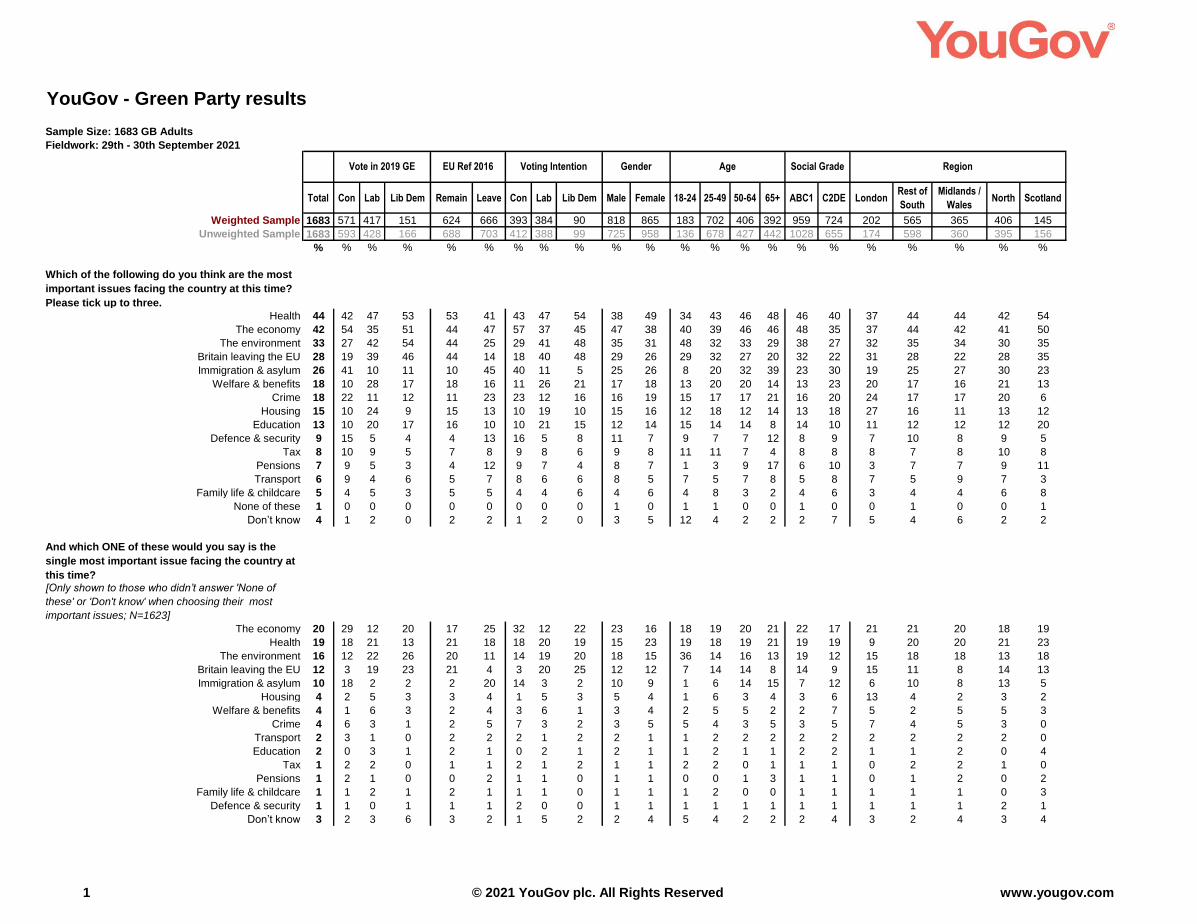
YouGov - Green Party results
Sample Size: 1683 GB Adults
Fieldwork: 29th - 30th September 2021
Total Con Lab Lib Dem Remain Leave Con Lab Lib Dem Male Female 18-24 25-49 50-64 65+ ABC1 C2DE LondonRest of
South
Midlands /
WalesNorth Scotland
Weighted Sample 1683 571 417 151 624 666 393 384 90 818 865 183 702 406 392 959 724 202 565 365 406 145
Unweighted Sample 1683 593 428 166 688 703 412 388 99 725 958 136 678 427 442 1028 655 174 598 360 395 156
% % % % % % % % % % % % % % % % % % % % % %
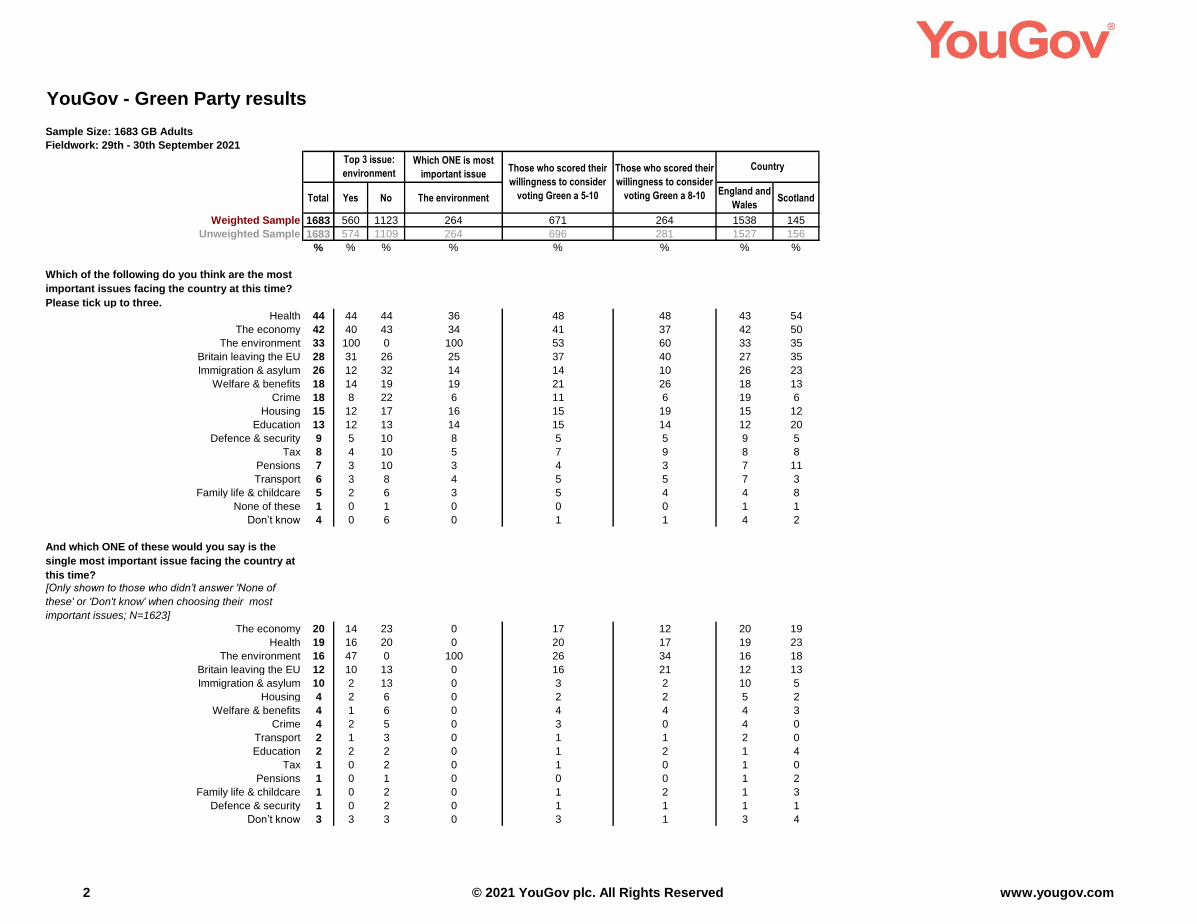
Which of the following do you think are the most
important issues facing the country at this time?
Please tick up to three.
Health 44 42 47 53 53 41 43 47 54 38 49 34 43 46 48 46 40 37 44 44 42 54
The economy 42 54 35 51 44 47 57 37 45 47 38 40 39 46 46 48 35 37 44 42 41 50
The environment 33 27 42 54 44 25 29 41 48 35 31 48 32 33 29 38 27 32 35 34 30 35
Britain leaving the EU 28 19 39 46 44 14 18 40 48 29 26 29 32 27 20 32 22 31 28 22 28 35
Immigration & asylum 26 41 10 11 10 45 40 11 5 25 26 8 20 32 39 23 30 19 25 27 30 23
Welfare & benefits 18 10 28 17 18 16 11 26 21 17 18 13 20 20 14 13 23 20 17 16 21 13
Crime 18 22 11 12 11 23 23 12 16 16 19 15 17 17 21 16 20 24 17 17 20 6
Housing 15 10 24 9 15 13 10 19 10 15 16 12 18 12 14 13 18 27 16 11 13 12
Education 13 10 20 17 16 10 10 21 15 12 14 15 14 14 8 14 10 11 12 12 12 20
Defence & security 9 15 5 4 4 13 16 5 8 11 7 9 7 7 12 8 9 7 10 8 9 5
Tax 8 10 9 5 7 8 9 8 6 9 8 11 11 7 4 8 8 8 7 8 10 8
Pensions 7 9 5 3 4 12 9 7 4 8 7 1 3 9 17 6 10 3 7 7 9 11
Transport 6 9 4 6 5 7 8 6 6 8 5 7 5 7 8 5 8 7 5 9 7 3
Family life & childcare 5 4 5 3 5 5 4 4 6 4 6 4 8 3 2 4 6 3 4 4 6 8
None of these 1 0 0 0 0 0 0 0 0 1 0 1 1 0 0 1 0 0 1 0 0 1
Don’t know 4 1 2 0 2 2 1 2 0 3 5 12 4 2 2 2 7 5 4 6 2 2
And which ONE of these would you say is the
single most important issue facing the country at
this time?
[Only shown to those who didn’t answer 'None of
these' or 'Don't know' when choosing their most
important issues; N=1623]
The economy 20 29 12 20 17 25 32 12 22 23 16 18 19 20 21 22 17 21 21 20 18 19
Health 19 18 21 13 21 18 18 20 19 15 23 19 18 19 21 19 19 9 20 20 21 23
The environment 16 12 22 26 20 11 14 19 20 18 15 36 14 16 13 19 12 15 18 18 13 18
Britain leaving the EU 12 3 19 23 21 4 3 20 25 12 12 7 14 14 8 14 9 15 11 8 14 13
Immigration & asylum 10 18 2 2 2 20 14 3 2 10 9 1 6 14 15 7 12 6 10 8 13 5
Housing 4 2 5 3 3 4 1 5 3 5 4 1 6 3 4 3 6 13 4 2 3 2
Welfare & benefits 4 1 6 3 2 4 3 6 1 3 4 2 5 5 2 2 7 5 2 5 5 3
Crime 4 6 3 1 2 5 7 3 2 3 5 5 4 3 5 3 5 7 4 5 3 0
Transport 2 3 1 0 2 2 2 1 2 2 1 1 2 2 2 2 2 2 2 2 2 0
Education 2 0 3 1 2 1 0 2 1 2 1 1 2 1 1 2 2 1 1 2 0 4
Tax 1 2 2 0 1 1 2 1 2 1 1 2 2 0 1 1 1 0 2 2 1 0
Pensions 1 2 1 0 0 2 1 1 0 1 1 0 0 1 3 1 1 0 1 2 0 2
Family life & childcare 1 1 2 1 2 1 1 1 0 1 1 1 2 0 0 1 1 1 1 1 0 3
Defence & security 1 1 0 1 1 1 2 0 0 1 1 1 1 1 1 1 1 1 1 1 2 1
Don’t know 3 2 3 6 3 2 1 5 2 2 4 5 4 2 2 2 4 3 2 4 3 4
RegionVote in 2019 GE EU Ref 2016 Voting Intention Gender Age Social Grade
1 www.yougov.com© 2021 YouGov plc. All Rights Reserved
YouGov - Green Party results
Sample Size: 1683 GB Adults
Fieldwork: 29th - 30th September 2021
Total
Weighted Sample 1683
Unweighted Sample 1683
%
Which of the following do you think are the most
important issues facing the country at this time?
Please tick up to three.
Health 44
The economy 42
The environment 33
Britain leaving the EU 28
Immigration & asylum 26
Welfare & benefits 18
Crime 18
Housing 15
Education 13
Defence & security 9
Tax 8
Pensions 7
Transport 6
Family life & childcare 5
None of these 1
Don’t know 4
And which ONE of these would you say is the
single most important issue facing the country at
this time?
[Only shown to those who didn’t answer 'None of
these' or 'Don't know' when choosing their most
important issues; N=1623]
The economy 20
Health 19
The environment 16
Britain leaving the EU 12
Immigration & asylum 10
Housing 4
Welfare & benefits 4
Crime 4
Transport 2
Education 2
Tax 1
Pensions 1
Family life & childcare 1
Defence & security 1
Don’t know 3
Which ONE is most
important issue
Yes No The environmentEngland and
WalesScotland
560 1123 264 671 264 1538 145
574 1109 264 696 281 1527 156
% % % % % % %
44 44 36 48 48 43 54
40 43 34 41 37 42 50
100 0 100 53 60 33 35
31 26 25 37 40 27 35
12 32 14 14 10 26 23
14 19 19 21 26 18 13
8 22 6 11 6 19 6
12 17 16 15 19 15 12
12 13 14 15 14 12 20
5 10 8 5 5 9 5
4 10 5 7 9 8 8
3 10 3 4 3 7 11
3 8 4 5 5 7 3
2 6 3 5 4 4 8
0 1 0 0 0 1 1
0 6 0 1 1 4 2
14 23 0 17 12 20 19
16 20 0 20 17 19 23
47 0 100 26 34 16 18
10 13 0 16 21 12 13
2 13 0 3 2 10 5
2 6 0 2 2 5 2
1 6 0 4 4 4 3
2 5 0 3 0 4 0
1 3 0 1 1 2 0
2 2 0 1 2 1 4
0 2 0 1 0 1 0
0 1 0 0 0 1 2
0 2 0 1 2 1 3
0 2 0 1 1 1 1
3 3 0 3 1 3 4
Top 3 issue:
environmentCountryThose who scored their
willingness to consider
voting Green a 5-10
Those who scored their
willingness to consider
voting Green a 8-10
2 www.yougov.com© 2021 YouGov plc. All Rights Reserved
YouGov - Green Party results
Sample Size: 1683 GB Adults
Fieldwork: 29th - 30th September 2021
Total Con Lab Lib Dem Remain Leave Con Lab Lib Dem Male Female 18-24 25-49 50-64 65+ ABC1 C2DE LondonRest of
South
Midlands /
WalesNorth Scotland
Weighted Sample 1683 571 417 151 624 666 393 384 90 818 865 183 702 406 392 959 724 202 565 365 406 145
Unweighted Sample 1683 593 428 166 688 703 412 388 99 725 958 136 678 427 442 1028 655 174 598 360 395 156
RegionVote in 2019 GE EU Ref 2016 Voting Intention Gender Age Social Grade
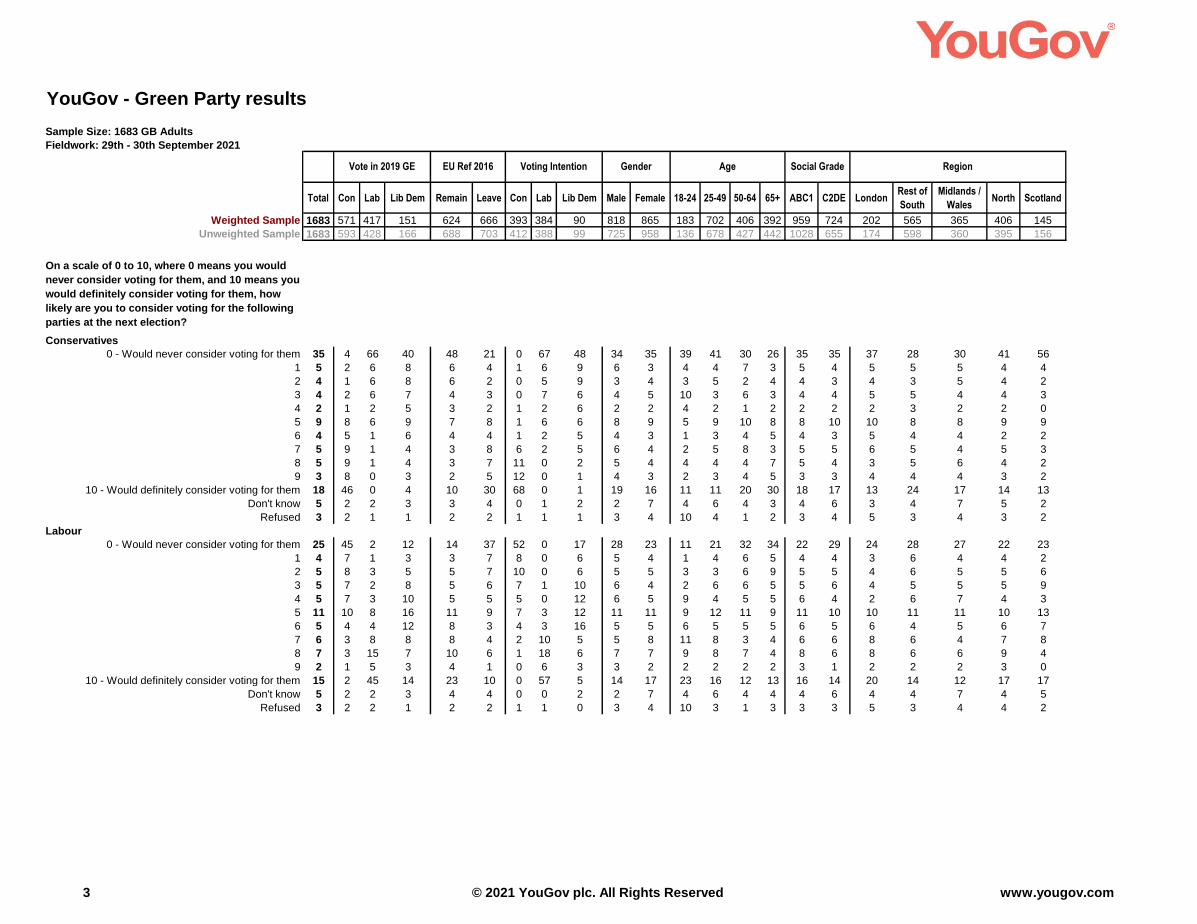
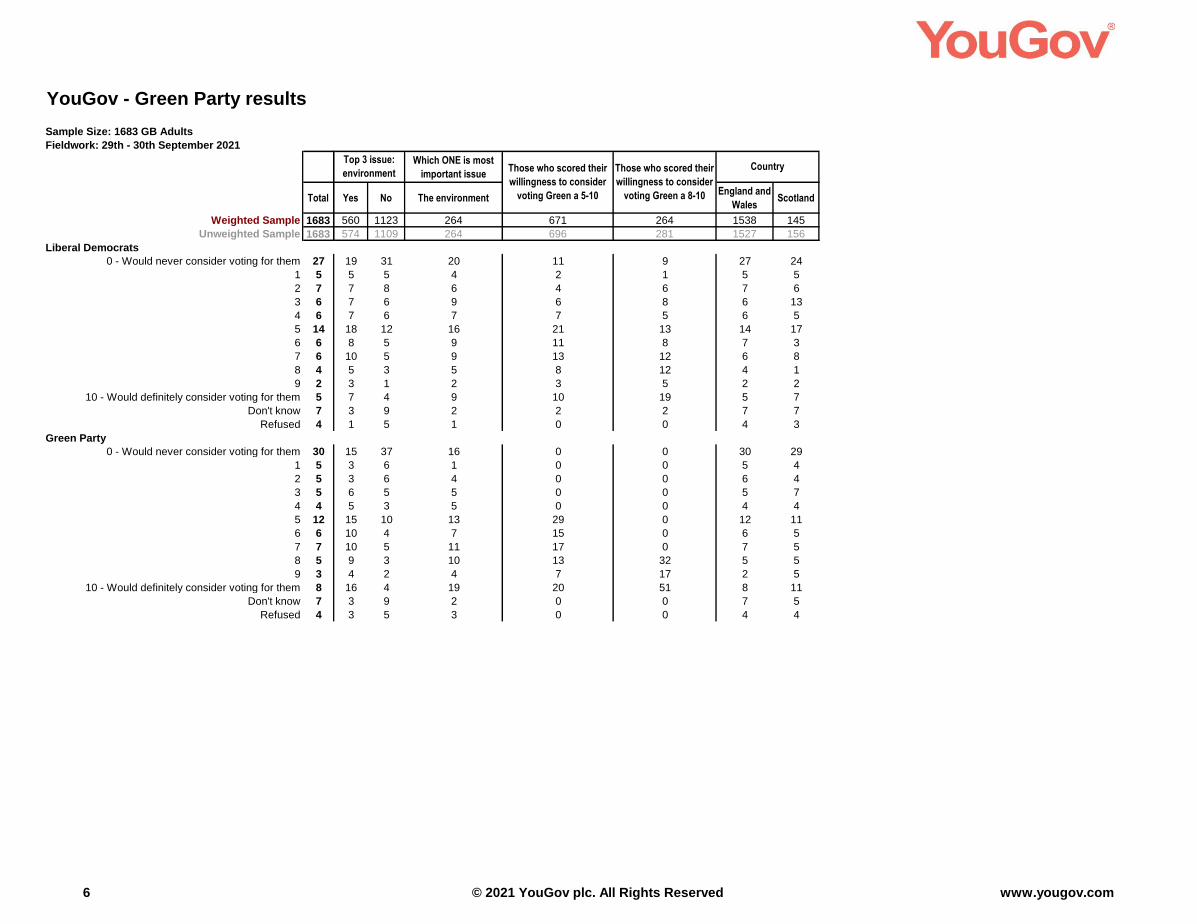
On a scale of 0 to 10, where 0 means you would
never consider voting for them, and 10 means you
would definitely consider voting for them, how
likely are you to consider voting for the following
parties at the next election?
Conservatives
0 - Would never consider voting for them 35 4 66 40 48 21 0 67 48 34 35 39 41 30 26 35 35 37 28 30 41 56
1 5 2 6 8 6 4 1 6 9 6 3 4 4 7 3 5 4 5 5 5 4 4
2 4 1 6 8 6 2 0 5 9 3 4 3 5 2 4 4 3 4 3 5 4 2
3 4 2 6 7 4 3 0 7 6 4 5 10 3 6 3 4 4 5 5 4 4 3
4 2 1 2 5 3 2 1 2 6 2 2 4 2 1 2 2 2 2 3 2 2 0
5 9 8 6 9 7 8 1 6 6 8 9 5 9 10 8 8 10 10 8 8 9 9
6 4 5 1 6 4 4 1 2 5 4 3 1 3 4 5 4 3 5 4 4 2 2
7 5 9 1 4 3 8 6 2 5 6 4 2 5 8 3 5 5 6 5 4 5 3
8 5 9 1 4 3 7 11 0 2 5 4 4 4 4 7 5 4 3 5 6 4 2
9 3 8 0 3 2 5 12 0 1 4 3 2 3 4 5 3 3 4 4 4 3 2
10 - Would definitely consider voting for them 18 46 0 4 10 30 68 0 1 19 16 11 11 20 30 18 17 13 24 17 14 13
Don't know 5 2 2 3 3 4 0 1 2 2 7 4 6 4 3 4 6 3 4 7 5 2
Refused 3 2 1 1 2 2 1 1 1 3 4 10 4 1 2 3 4 5 3 4 3 2
Labour
0 - Would never consider voting for them 25 45 2 12 14 37 52 0 17 28 23 11 21 32 34 22 29 24 28 27 22 23
1 4 7 1 3 3 7 8 0 6 5 4 1 4 6 5 4 4 3 6 4 4 2
2 5 8 3 5 5 7 10 0 6 5 5 3 3 6 9 5 5 4 6 5 5 6
3 5 7 2 8 5 6 7 1 10 6 4 2 6 6 5 5 6 4 5 5 5 9
4 5 7 3 10 5 5 5 0 12 6 5 9 4 5 5 6 4 2 6 7 4 3
5 11 10 8 16 11 9 7 3 12 11 11 9 12 11 9 11 10 10 11 11 10 13
6 5 4 4 12 8 3 4 3 16 5 5 6 5 5 5 6 5 6 4 5 6 7
7 6 3 8 8 8 4 2 10 5 5 8 11 8 3 4 6 6 8 6 4 7 8
8 7 3 15 7 10 6 1 18 6 7 7 9 8 7 4 8 6 8 6 6 9 4
9 2 1 5 3 4 1 0 6 3 3 2 2 2 2 2 3 1 2 2 2 3 0
10 - Would definitely consider voting for them 15 2 45 14 23 10 0 57 5 14 17 23 16 12 13 16 14 20 14 12 17 17
Don't know 5 2 2 3 4 4 0 0 2 2 7 4 6 4 4 4 6 4 4 7 4 5
Refused 3 2 2 1 2 2 1 1 0 3 4 10 3 1 3 3 3 5 3 4 4 2
3 www.yougov.com© 2021 YouGov plc. All Rights Reserved
YouGov - Green Party results
Sample Size: 1683 GB Adults
Fieldwork: 29th - 30th September 2021
Total
Weighted Sample 1683
Unweighted Sample 1683
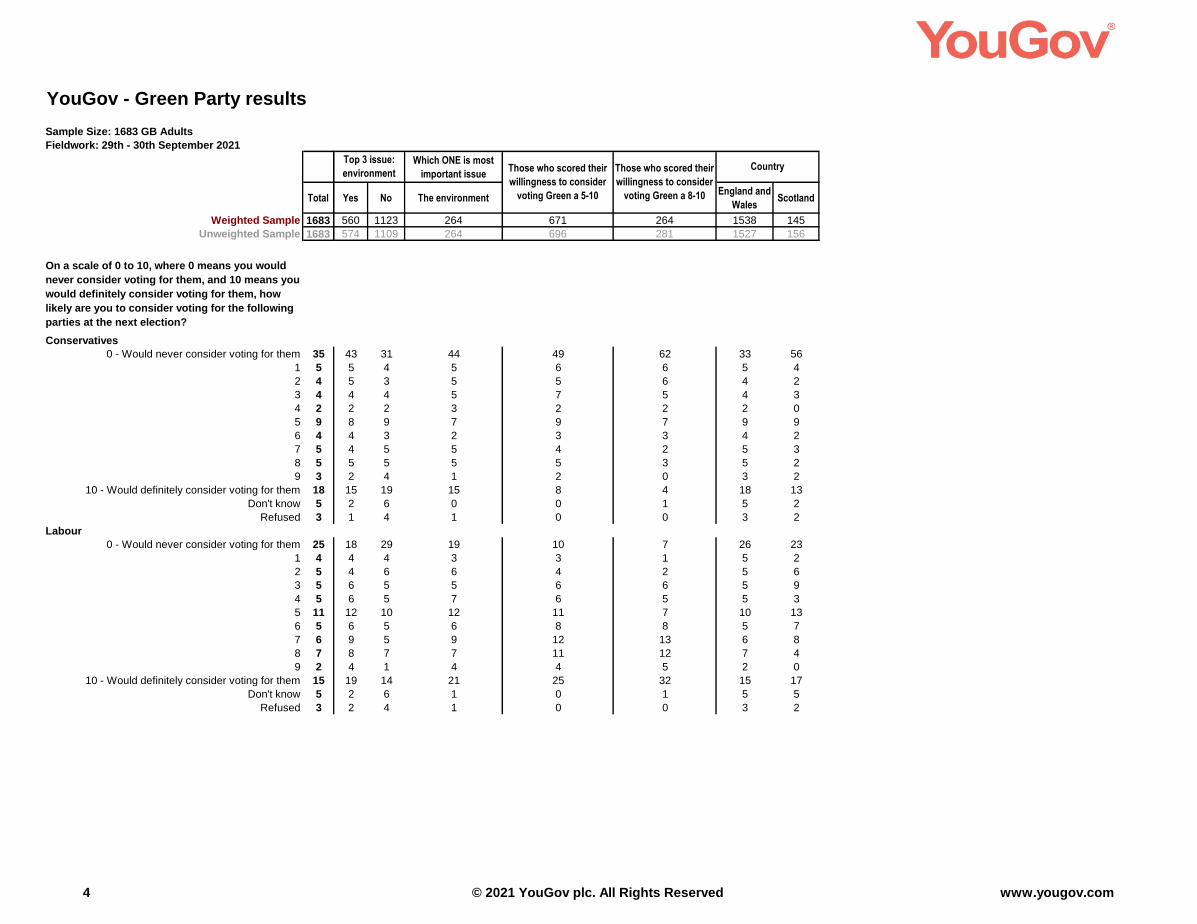
On a scale of 0 to 10, where 0 means you would
never consider voting for them, and 10 means you
would definitely consider voting for them, how
likely are you to consider voting for the following
parties at the next election?
Conservatives
0 - Would never consider voting for them 35
1 5
2 4
3 4
4 2
5 9
6 4
7 5
8 5
9 3
10 - Would definitely consider voting for them 18
Don't know 5
Refused 3
Labour
0 - Would never consider voting for them 25
1 4
2 5
3 5
4 5
5 11
6 5
7 6
8 7
9 2
10 - Would definitely consider voting for them 15
Don't know 5
Refused 3
Which ONE is most
important issue
Yes No The environmentEngland and
WalesScotland
560 1123 264 671 264 1538 145
574 1109 264 696 281 1527 156
Top 3 issue:
environmentCountryThose who scored their
willingness to consider
voting Green a 5-10
Those who scored their
willingness to consider
voting Green a 8-10
43 31 44 49 62 33 56
5 4 5 6 6 5 4
5 3 5 5 6 4 2
4 4 5 7 5 4 3
2 2 3 2 2 2 0
8 9 7 9 7 9 9
4 3 2 3 3 4 2
4 5 5 4 2 5 3
5 5 5 5 3 5 2
2 4 1 2 0 3 2
15 19 15 8 4 18 13
2 6 0 0 1 5 2
1 4 1 0 0 3 2
18 29 19 10 7 26 23
4 4 3 3 1 5 2
4 6 6 4 2 5 6
6 5 5 6 6 5 9
6 5 7 6 5 5 3
12 10 12 11 7 10 13
6 5 6 8 8 5 7
9 5 9 12 13 6 8
8 7 7 11 12 7 4
4 1 4 4 5 2 0
19 14 21 25 32 15 17
2 6 1 0 1 5 5
2 4 1 0 0 3 2
4 www.yougov.com© 2021 YouGov plc. All Rights Reserved
YouGov - Green Party results
Sample Size: 1683 GB Adults
Fieldwork: 29th - 30th September 2021
Total Con Lab Lib Dem Remain Leave Con Lab Lib Dem Male Female 18-24 25-49 50-64 65+ ABC1 C2DE LondonRest of
South
Midlands /
WalesNorth Scotland
Weighted Sample 1683 571 417 151 624 666 393 384 90 818 865 183 702 406 392 959 724 202 565 365 406 145
Unweighted Sample 1683 593 428 166 688 703 412 388 99 725 958 136 678 427 442 1028 655 174 598 360 395 156
RegionVote in 2019 GE EU Ref 2016 Voting Intention Gender Age Social Grade
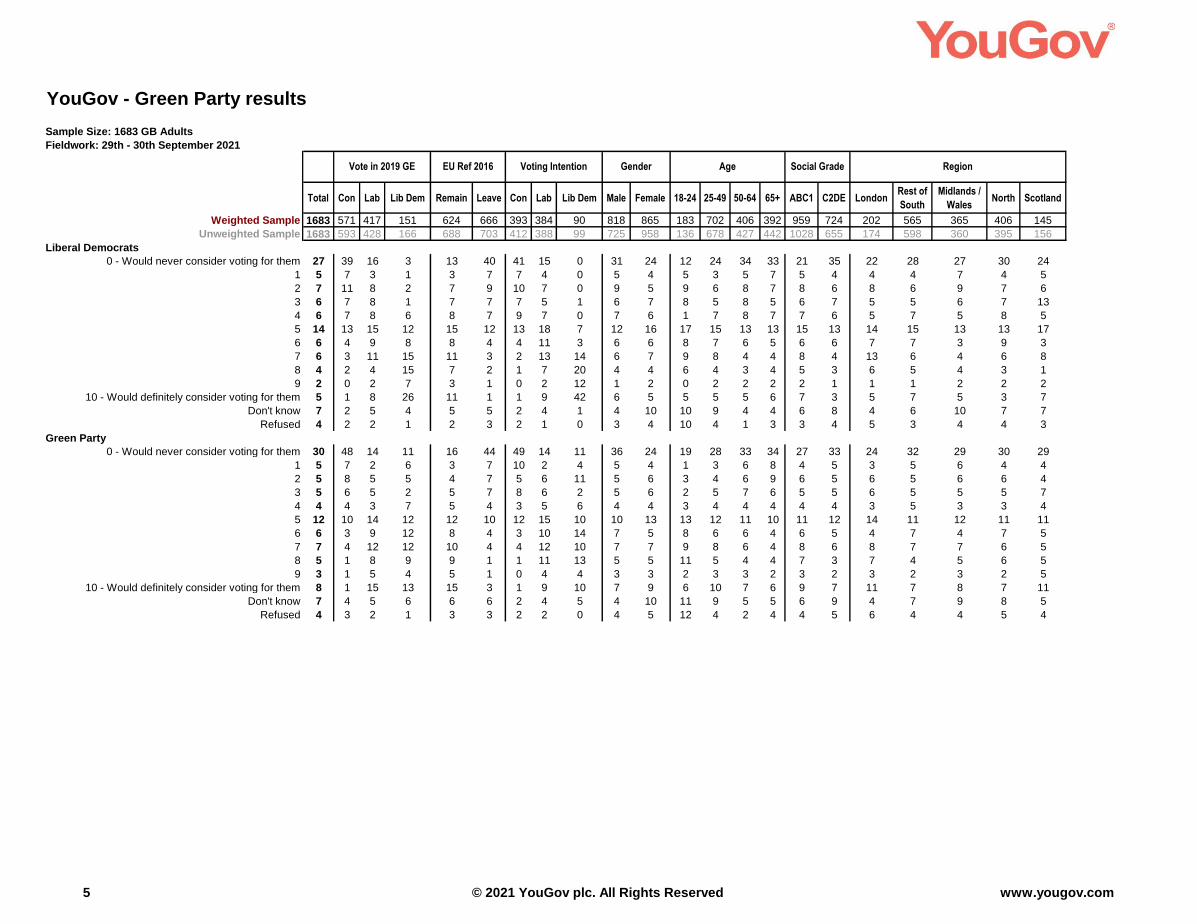
Liberal Democrats
0 - Would never consider voting for them 27 39 16 3 13 40 41 15 0 31 24 12 24 34 33 21 35 22 28 27 30 24
1 5 7 3 1 3 7 7 4 0 5 4 5 3 5 7 5 4 4 4 7 4 5
2 7 11 8 2 7 9 10 7 0 9 5 9 6 8 7 8 6 8 6 9 7 6
3 6 7 8 1 7 7 7 5 1 6 7 8 5 8 5 6 7 5 5 6 7 13
4 6 7 8 6 8 7 9 7 0 7 6 1 7 8 7 7 6 5 7 5 8 5
5 14 13 15 12 15 12 13 18 7 12 16 17 15 13 13 15 13 14 15 13 13 17
6 6 4 9 8 8 4 4 11 3 6 6 8 7 6 5 6 6 7 7 3 9 3
7 6 3 11 15 11 3 2 13 14 6 7 9 8 4 4 8 4 13 6 4 6 8
8 4 2 4 15 7 2 1 7 20 4 4 6 4 3 4 5 3 6 5 4 3 1
9 2 0 2 7 3 1 0 2 12 1 2 0 2 2 2 2 1 1 1 2 2 2
10 - Would definitely consider voting for them 5 1 8 26 11 1 1 9 42 6 5 5 5 5 6 7 3 5 7 5 3 7
Don't know 7 2 5 4 5 5 2 4 1 4 10 10 9 4 4 6 8 4 6 10 7 7
Refused 4 2 2 1 2 3 2 1 0 3 4 10 4 1 3 3 4 5 3 4 4 3
Green Party
0 - Would never consider voting for them 30 48 14 11 16 44 49 14 11 36 24 19 28 33 34 27 33 24 32 29 30 29
1 5 7 2 6 3 7 10 2 4 5 4 1 3 6 8 4 5 3 5 6 4 4
2 5 8 5 5 4 7 5 6 11 5 6 3 4 6 9 6 5 6 5 6 6 4
3 5 6 5 2 5 7 8 6 2 5 6 2 5 7 6 5 5 6 5 5 5 7
4 4 4 3 7 5 4 3 5 6 4 4 3 4 4 4 4 4 3 5 3 3 4
5 12 10 14 12 12 10 12 15 10 10 13 13 12 11 10 11 12 14 11 12 11 11
6 6 3 9 12 8 4 3 10 14 7 5 8 6 6 4 6 5 4 7 4 7 5
7 7 4 12 12 10 4 4 12 10 7 7 9 8 6 4 8 6 8 7 7 6 5
8 5 1 8 9 9 1 1 11 13 5 5 11 5 4 4 7 3 7 4 5 6 5
9 3 1 5 4 5 1 0 4 4 3 3 2 3 3 2 3 2 3 2 3 2 5
10 - Would definitely consider voting for them 8 1 15 13 15 3 1 9 10 7 9 6 10 7 6 9 7 11 7 8 7 11
Don't know 7 4 5 6 6 6 2 4 5 4 10 11 9 5 5 6 9 4 7 9 8 5
Refused 4 3 2 1 3 3 2 2 0 4 5 12 4 2 4 4 5 6 4 4 5 4
5 www.yougov.com© 2021 YouGov plc. All Rights Reserved
YouGov - Green Party results
Sample Size: 1683 GB Adults
Fieldwork: 29th - 30th September 2021
Total
Weighted Sample 1683
Unweighted Sample 1683
Liberal Democrats
0 - Would never consider voting for them 27
1 5
2 7
3 6
4 6
5 14
6 6
7 6
8 4
9 2
10 - Would definitely consider voting for them 5
Don't know 7
Refused 4
Green Party
0 - Would never consider voting for them 30
1 5
2 5
3 5
4 4
5 12
6 6
7 7
8 5
9 3
10 - Would definitely consider voting for them 8
Don't know 7
Refused 4
Which ONE is most
important issue
Yes No The environmentEngland and
WalesScotland
560 1123 264 671 264 1538 145
574 1109 264 696 281 1527 156
Top 3 issue:
environmentCountryThose who scored their
willingness to consider
voting Green a 5-10
Those who scored their
willingness to consider
voting Green a 8-10
19 31 20 11 9 27 24
5 5 4 2 1 5 5
7 8 6 4 6 7 6
7 6 9 6 8 6 13
7 6 7 7 5 6 5
18 12 16 21 13 14 17
8 5 9 11 8 7 3
10 5 9 13 12 6 8
5 3 5 8 12 4 1
3 1 2 3 5 2 2
7 4 9 10 19 5 7
3 9 2 2 2 7 7
1 5 1 0 0 4 3
15 37 16 0 0 30 29
3 6 1 0 0 5 4
3 6 4 0 0 6 4
6 5 5 0 0 5 7
5 3 5 0 0 4 4
15 10 13 29 0 12 11
10 4 7 15 0 6 5
10 5 11 17 0 7 5
9 3 10 13 32 5 5
4 2 4 7 17 2 5
16 4 19 20 51 8 11
3 9 2 0 0 7 5
3 5 3 0 0 4 4
6 www.yougov.com© 2021 YouGov plc. All Rights Reserved
YouGov - Green Party results
Sample Size: 1683 GB Adults
Fieldwork: 29th - 30th September 2021
Total Con Lab Lib Dem Remain Leave Con Lab Lib Dem Male Female 18-24 25-49 50-64 65+ ABC1 C2DE LondonRest of
South
Midlands /
WalesNorth Scotland
Weighted Sample 1683 571 417 151 624 666 393 384 90 818 865 183 702 406 392 959 724 202 565 365 406 145
Unweighted Sample 1683 593 428 166 688 703 412 388 99 725 958 136 678 427 442 1028 655 174 598 360 395 156
RegionVote in 2019 GE EU Ref 2016 Voting Intention Gender Age Social Grade
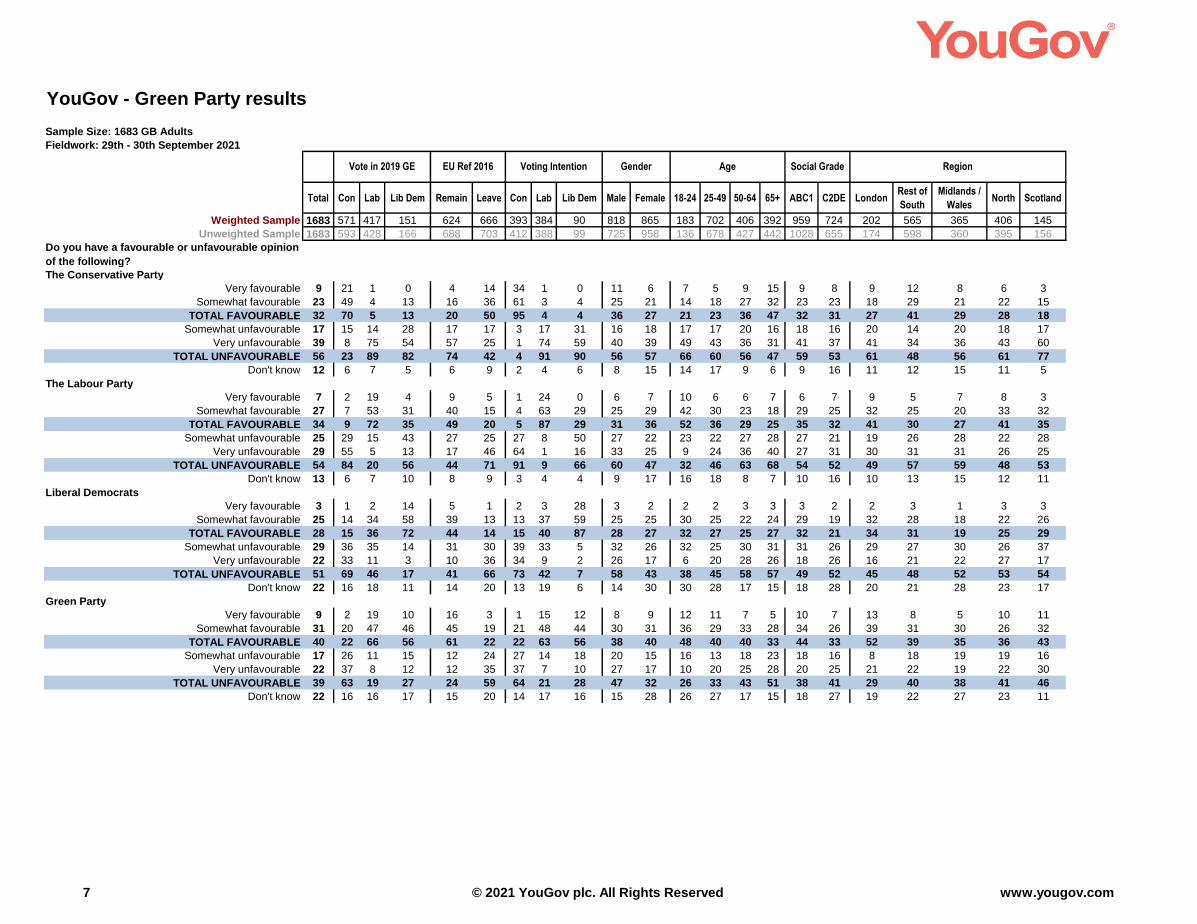
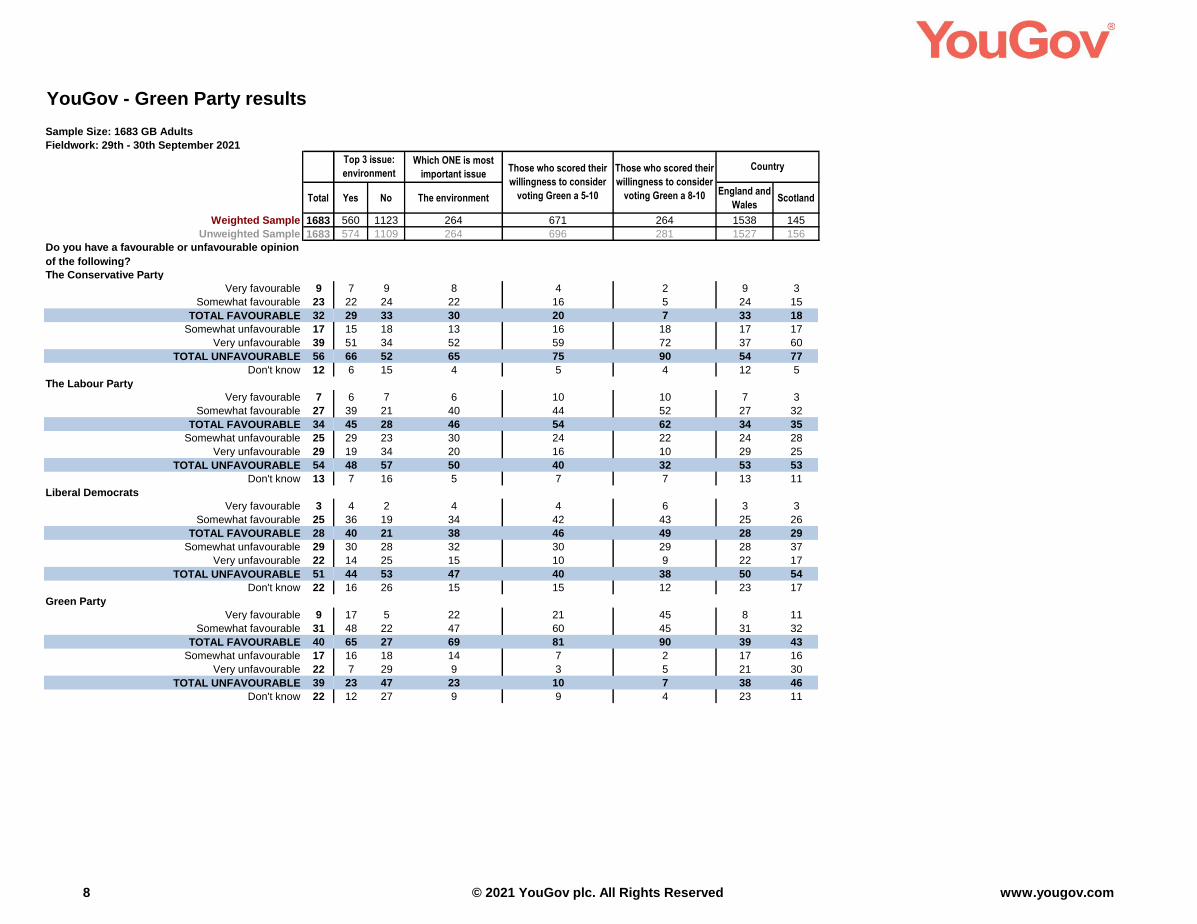
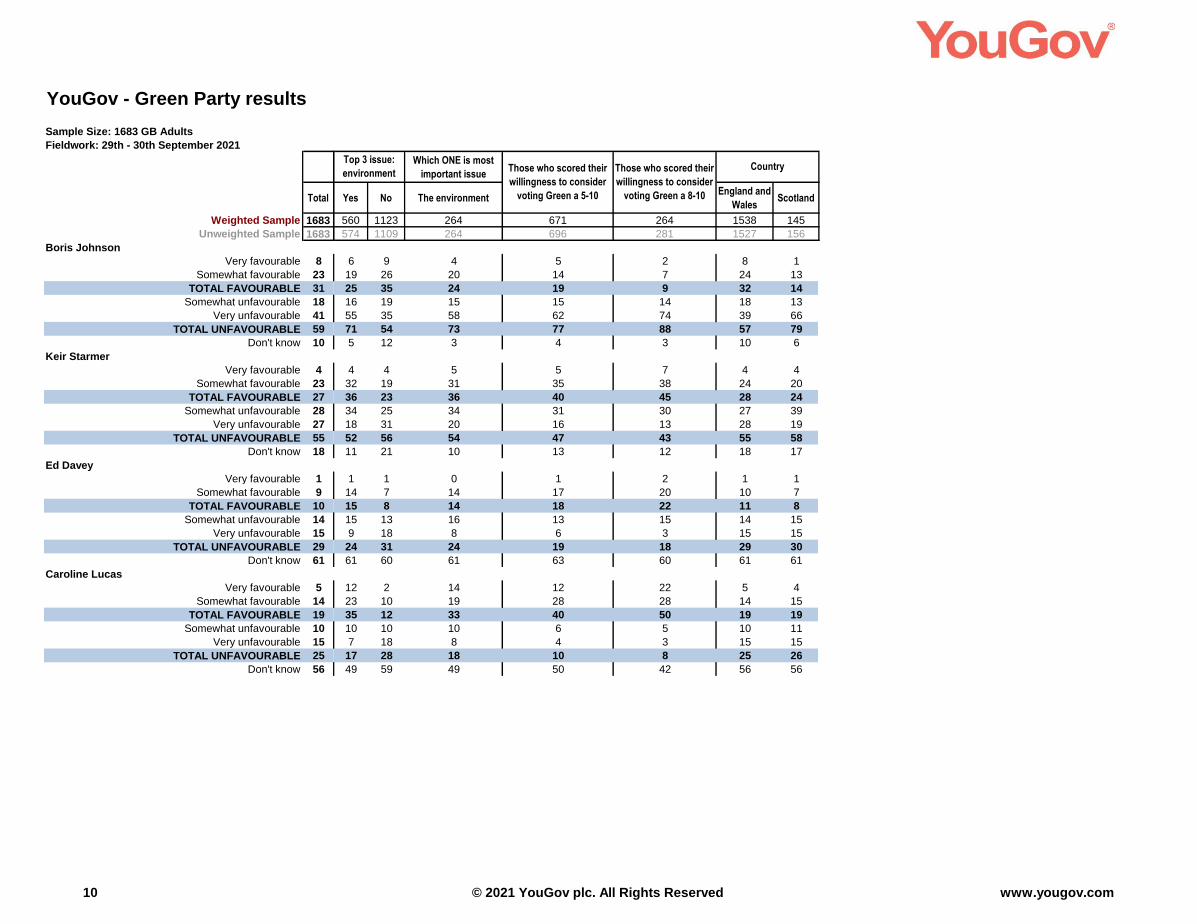
Do you have a favourable or unfavourable opinion
of the following?
The Conservative Party
Very favourable 9 21 1 0 4 14 34 1 0 11 6 7 5 9 15 9 8 9 12 8 6 3
Somewhat favourable 23 49 4 13 16 36 61 3 4 25 21 14 18 27 32 23 23 18 29 21 22 15
TOTAL FAVOURABLE 32 70 5 13 20 50 95 4 4 36 27 21 23 36 47 32 31 27 41 29 28 18
Somewhat unfavourable 17 15 14 28 17 17 3 17 31 16 18 17 17 20 16 18 16 20 14 20 18 17
Very unfavourable 39 8 75 54 57 25 1 74 59 40 39 49 43 36 31 41 37 41 34 36 43 60
TOTAL UNFAVOURABLE 56 23 89 82 74 42 4 91 90 56 57 66 60 56 47 59 53 61 48 56 61 77
Don't know 12 6 7 5 6 9 2 4 6 8 15 14 17 9 6 9 16 11 12 15 11 5
The Labour Party
Very favourable 7 2 19 4 9 5 1 24 0 6 7 10 6 6 7 6 7 9 5 7 8 3
Somewhat favourable 27 7 53 31 40 15 4 63 29 25 29 42 30 23 18 29 25 32 25 20 33 32
TOTAL FAVOURABLE 34 9 72 35 49 20 5 87 29 31 36 52 36 29 25 35 32 41 30 27 41 35
Somewhat unfavourable 25 29 15 43 27 25 27 8 50 27 22 23 22 27 28 27 21 19 26 28 22 28
Very unfavourable 29 55 5 13 17 46 64 1 16 33 25 9 24 36 40 27 31 30 31 31 26 25
TOTAL UNFAVOURABLE 54 84 20 56 44 71 91 9 66 60 47 32 46 63 68 54 52 49 57 59 48 53
Don't know 13 6 7 10 8 9 3 4 4 9 17 16 18 8 7 10 16 10 13 15 12 11
Liberal Democrats
Very favourable 3 1 2 14 5 1 2 3 28 3 2 2 2 3 3 3 2 2 3 1 3 3
Somewhat favourable 25 14 34 58 39 13 13 37 59 25 25 30 25 22 24 29 19 32 28 18 22 26
TOTAL FAVOURABLE 28 15 36 72 44 14 15 40 87 28 27 32 27 25 27 32 21 34 31 19 25 29
Somewhat unfavourable 29 36 35 14 31 30 39 33 5 32 26 32 25 30 31 31 26 29 27 30 26 37
Very unfavourable 22 33 11 3 10 36 34 9 2 26 17 6 20 28 26 18 26 16 21 22 27 17
TOTAL UNFAVOURABLE 51 69 46 17 41 66 73 42 7 58 43 38 45 58 57 49 52 45 48 52 53 54
Don't know 22 16 18 11 14 20 13 19 6 14 30 30 28 17 15 18 28 20 21 28 23 17
Green Party
Very favourable 9 2 19 10 16 3 1 15 12 8 9 12 11 7 5 10 7 13 8 5 10 11
Somewhat favourable 31 20 47 46 45 19 21 48 44 30 31 36 29 33 28 34 26 39 31 30 26 32
TOTAL FAVOURABLE 40 22 66 56 61 22 22 63 56 38 40 48 40 40 33 44 33 52 39 35 36 43
Somewhat unfavourable 17 26 11 15 12 24 27 14 18 20 15 16 13 18 23 18 16 8 18 19 19 16
Very unfavourable 22 37 8 12 12 35 37 7 10 27 17 10 20 25 28 20 25 21 22 19 22 30
TOTAL UNFAVOURABLE 39 63 19 27 24 59 64 21 28 47 32 26 33 43 51 38 41 29 40 38 41 46
Don't know 22 16 16 17 15 20 14 17 16 15 28 26 27 17 15 18 27 19 22 27 23 11
7 www.yougov.com© 2021 YouGov plc. All Rights Reserved
YouGov - Green Party results
Sample Size: 1683 GB Adults
Fieldwork: 29th - 30th September 2021
Total
Weighted Sample 1683
Unweighted Sample 1683
Do you have a favourable or unfavourable opinion
of the following?
The Conservative Party
Very favourable 9
Somewhat favourable 23
TOTAL FAVOURABLE 32
Somewhat unfavourable 17
Very unfavourable 39
TOTAL UNFAVOURABLE 56
Don't know 12
The Labour Party
Very favourable 7
Somewhat favourable 27
TOTAL FAVOURABLE 34
Somewhat unfavourable 25
Very unfavourable 29
TOTAL UNFAVOURABLE 54
Don't know 13
Liberal Democrats
Very favourable 3
Somewhat favourable 25
TOTAL FAVOURABLE 28
Somewhat unfavourable 29
Very unfavourable 22
TOTAL UNFAVOURABLE 51
Don't know 22
Green Party
Very favourable 9
Somewhat favourable 31
TOTAL FAVOURABLE 40
Somewhat unfavourable 17
Very unfavourable 22
TOTAL UNFAVOURABLE 39
Don't know 22
Which ONE is most
important issue
Yes No The environmentEngland and
WalesScotland
560 1123 264 671 264 1538 145
574 1109 264 696 281 1527 156
Top 3 issue:
environmentCountryThose who scored their
willingness to consider
voting Green a 5-10
Those who scored their
willingness to consider
voting Green a 8-10
7 9 8 4 2 9 3
22 24 22 16 5 24 15
29 33 30 20 7 33 18
15 18 13 16 18 17 17
51 34 52 59 72 37 60
66 52 65 75 90 54 77
6 15 4 5 4 12 5
6 7 6 10 10 7 3
39 21 40 44 52 27 32
45 28 46 54 62 34 35
29 23 30 24 22 24 28
19 34 20 16 10 29 25
48 57 50 40 32 53 53
7 16 5 7 7 13 11
4 2 4 4 6 3 3
36 19 34 42 43 25 26
40 21 38 46 49 28 29
30 28 32 30 29 28 37
14 25 15 10 9 22 17
44 53 47 40 38 50 54
16 26 15 15 12 23 17
17 5 22 21 45 8 11
48 22 47 60 45 31 32
65 27 69 81 90 39 43
16 18 14 7 2 17 16
7 29 9 3 5 21 30
23 47 23 10 7 38 46
12 27 9 9 4 23 11
8 www.yougov.com© 2021 YouGov plc. All Rights Reserved
YouGov - Green Party results
Sample Size: 1683 GB Adults
Fieldwork: 29th - 30th September 2021
Total Con Lab Lib Dem Remain Leave Con Lab Lib Dem Male Female 18-24 25-49 50-64 65+ ABC1 C2DE LondonRest of
South
Midlands /
WalesNorth Scotland
Weighted Sample 1683 571 417 151 624 666 393 384 90 818 865 183 702 406 392 959 724 202 565 365 406 145
Unweighted Sample 1683 593 428 166 688 703 412 388 99 725 958 136 678 427 442 1028 655 174 598 360 395 156
RegionVote in 2019 GE EU Ref 2016 Voting Intention Gender Age Social Grade
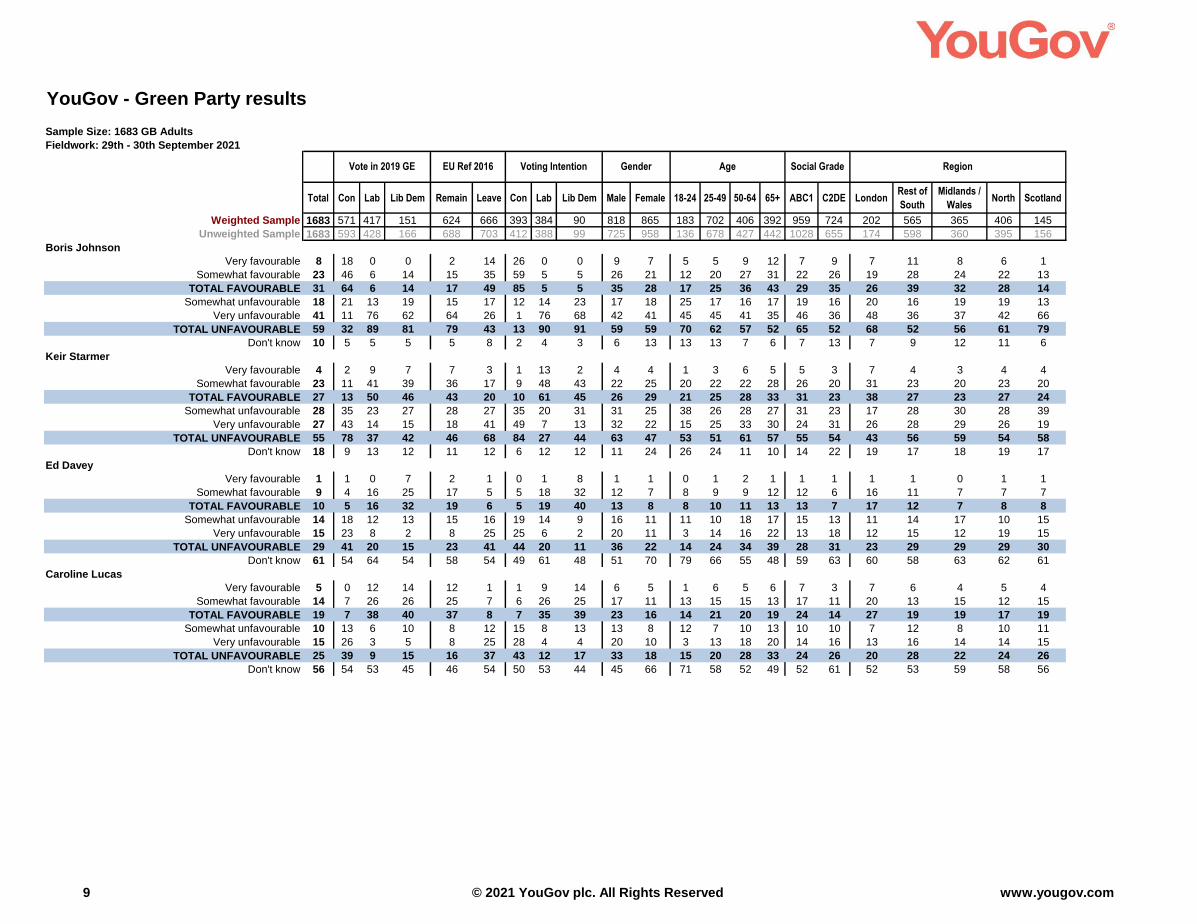
Boris Johnson
Very favourable 8 18 0 0 2 14 26 0 0 9 7 5 5 9 12 7 9 7 11 8 6 1
Somewhat favourable 23 46 6 14 15 35 59 5 5 26 21 12 20 27 31 22 26 19 28 24 22 13
TOTAL FAVOURABLE 31 64 6 14 17 49 85 5 5 35 28 17 25 36 43 29 35 26 39 32 28 14
Somewhat unfavourable 18 21 13 19 15 17 12 14 23 17 18 25 17 16 17 19 16 20 16 19 19 13
Very unfavourable 41 11 76 62 64 26 1 76 68 42 41 45 45 41 35 46 36 48 36 37 42 66
TOTAL UNFAVOURABLE 59 32 89 81 79 43 13 90 91 59 59 70 62 57 52 65 52 68 52 56 61 79
Don't know 10 5 5 5 5 8 2 4 3 6 13 13 13 7 6 7 13 7 9 12 11 6
Keir Starmer
Very favourable 4 2 9 7 7 3 1 13 2 4 4 1 3 6 5 5 3 7 4 3 4 4
Somewhat favourable 23 11 41 39 36 17 9 48 43 22 25 20 22 22 28 26 20 31 23 20 23 20
TOTAL FAVOURABLE 27 13 50 46 43 20 10 61 45 26 29 21 25 28 33 31 23 38 27 23 27 24
Somewhat unfavourable 28 35 23 27 28 27 35 20 31 31 25 38 26 28 27 31 23 17 28 30 28 39
Very unfavourable 27 43 14 15 18 41 49 7 13 32 22 15 25 33 30 24 31 26 28 29 26 19
TOTAL UNFAVOURABLE 55 78 37 42 46 68 84 27 44 63 47 53 51 61 57 55 54 43 56 59 54 58
Don't know 18 9 13 12 11 12 6 12 12 11 24 26 24 11 10 14 22 19 17 18 19 17
Ed Davey
Very favourable 1 1 0 7 2 1 0 1 8 1 1 0 1 2 1 1 1 1 1 0 1 1
Somewhat favourable 9 4 16 25 17 5 5 18 32 12 7 8 9 9 12 12 6 16 11 7 7 7
TOTAL FAVOURABLE 10 5 16 32 19 6 5 19 40 13 8 8 10 11 13 13 7 17 12 7 8 8
Somewhat unfavourable 14 18 12 13 15 16 19 14 9 16 11 11 10 18 17 15 13 11 14 17 10 15
Very unfavourable 15 23 8 2 8 25 25 6 2 20 11 3 14 16 22 13 18 12 15 12 19 15
TOTAL UNFAVOURABLE 29 41 20 15 23 41 44 20 11 36 22 14 24 34 39 28 31 23 29 29 29 30
Don't know 61 54 64 54 58 54 49 61 48 51 70 79 66 55 48 59 63 60 58 63 62 61
Caroline Lucas
Very favourable 5 0 12 14 12 1 1 9 14 6 5 1 6 5 6 7 3 7 6 4 5 4
Somewhat favourable 14 7 26 26 25 7 6 26 25 17 11 13 15 15 13 17 11 20 13 15 12 15
TOTAL FAVOURABLE 19 7 38 40 37 8 7 35 39 23 16 14 21 20 19 24 14 27 19 19 17 19
Somewhat unfavourable 10 13 6 10 8 12 15 8 13 13 8 12 7 10 13 10 10 7 12 8 10 11
Very unfavourable 15 26 3 5 8 25 28 4 4 20 10 3 13 18 20 14 16 13 16 14 14 15
TOTAL UNFAVOURABLE 25 39 9 15 16 37 43 12 17 33 18 15 20 28 33 24 26 20 28 22 24 26
Don't know 56 54 53 45 46 54 50 53 44 45 66 71 58 52 49 52 61 52 53 59 58 56
9 www.yougov.com© 2021 YouGov plc. All Rights Reserved
YouGov - Green Party results
Sample Size: 1683 GB Adults
Fieldwork: 29th - 30th September 2021
Total
Weighted Sample 1683
Unweighted Sample 1683
Boris Johnson
Very favourable 8
Somewhat favourable 23
TOTAL FAVOURABLE 31
Somewhat unfavourable 18
Very unfavourable 41
TOTAL UNFAVOURABLE 59
Don't know 10
Keir Starmer
Very favourable 4
Somewhat favourable 23
TOTAL FAVOURABLE 27
Somewhat unfavourable 28
Very unfavourable 27
TOTAL UNFAVOURABLE 55
Don't know 18
Ed Davey
Very favourable 1
Somewhat favourable 9
TOTAL FAVOURABLE 10
Somewhat unfavourable 14
Very unfavourable 15
TOTAL UNFAVOURABLE 29
Don't know 61
Caroline Lucas
Very favourable 5
Somewhat favourable 14
TOTAL FAVOURABLE 19
Somewhat unfavourable 10
Very unfavourable 15
TOTAL UNFAVOURABLE 25
Don't know 56
Which ONE is most
important issue
Yes No The environmentEngland and
WalesScotland
560 1123 264 671 264 1538 145
574 1109 264 696 281 1527 156
Top 3 issue:
environmentCountryThose who scored their
willingness to consider
voting Green a 5-10
Those who scored their
willingness to consider
voting Green a 8-10
6 9 4 5 2 8 1
19 26 20 14 7 24 13
25 35 24 19 9 32 14
16 19 15 15 14 18 13
55 35 58 62 74 39 66
71 54 73 77 88 57 79
5 12 3 4 3 10 6
4 4 5 5 7 4 4
32 19 31 35 38 24 20
36 23 36 40 45 28 24
34 25 34 31 30 27 39
18 31 20 16 13 28 19
52 56 54 47 43 55 58
11 21 10 13 12 18 17
1 1 0 1 2 1 1
14 7 14 17 20 10 7
15 8 14 18 22 11 8
15 13 16 13 15 14 15
9 18 8 6 3 15 15
24 31 24 19 18 29 30
61 60 61 63 60 61 61
12 2 14 12 22 5 4
23 10 19 28 28 14 15
35 12 33 40 50 19 19
10 10 10 6 5 10 11
7 18 8 4 3 15 15
17 28 18 10 8 25 26
49 59 49 50 42 56 56
10 www.yougov.com© 2021 YouGov plc. All Rights Reserved
YouGov - Green Party results
Sample Size: 1683 GB Adults
Fieldwork: 29th - 30th September 2021
Total Con Lab Lib Dem Remain Leave Con Lab Lib Dem Male Female 18-24 25-49 50-64 65+ ABC1 C2DE LondonRest of
South
Midlands /
WalesNorth Scotland
Weighted Sample 1683 571 417 151 624 666 393 384 90 818 865 183 702 406 392 959 724 202 565 365 406 145
Unweighted Sample 1683 593 428 166 688 703 412 388 99 725 958 136 678 427 442 1028 655 174 598 360 395 156
RegionVote in 2019 GE EU Ref 2016 Voting Intention Gender Age Social Grade
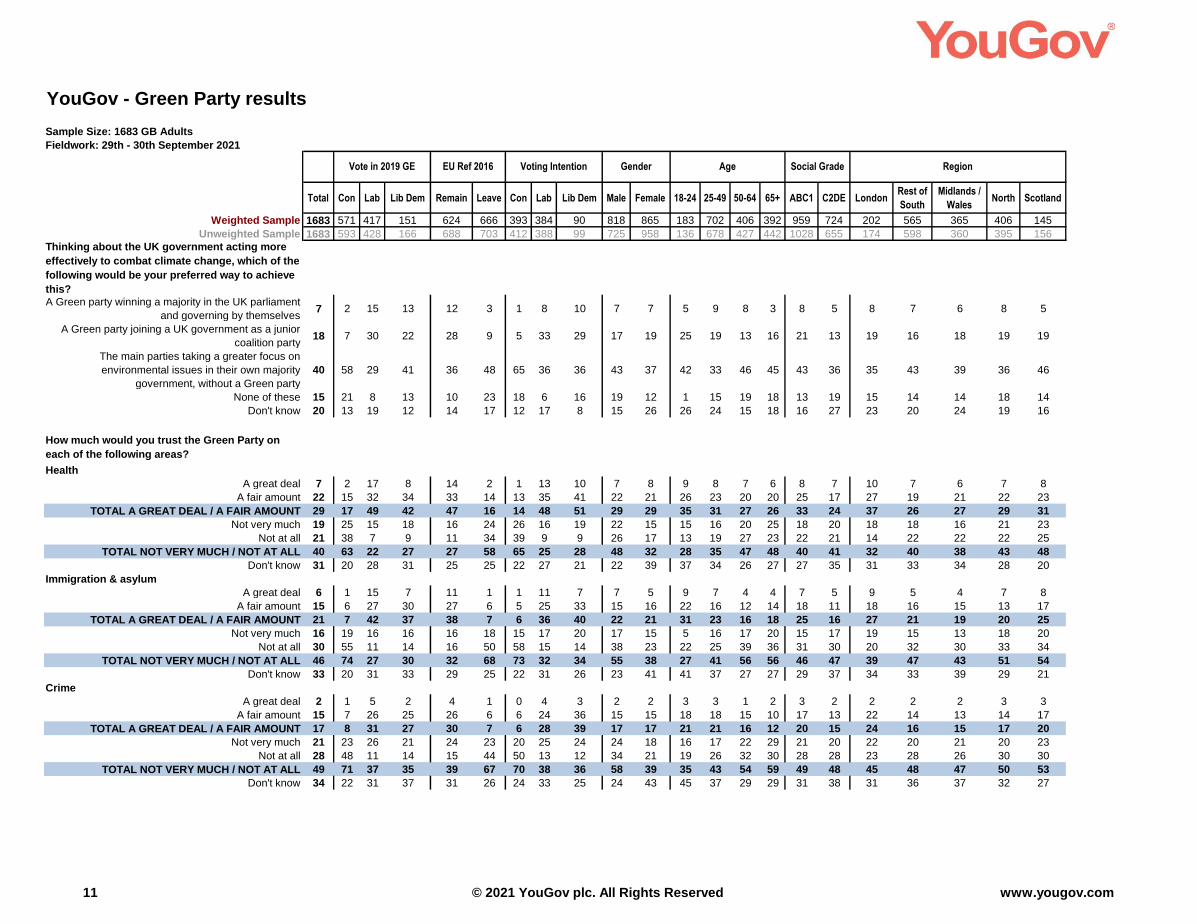
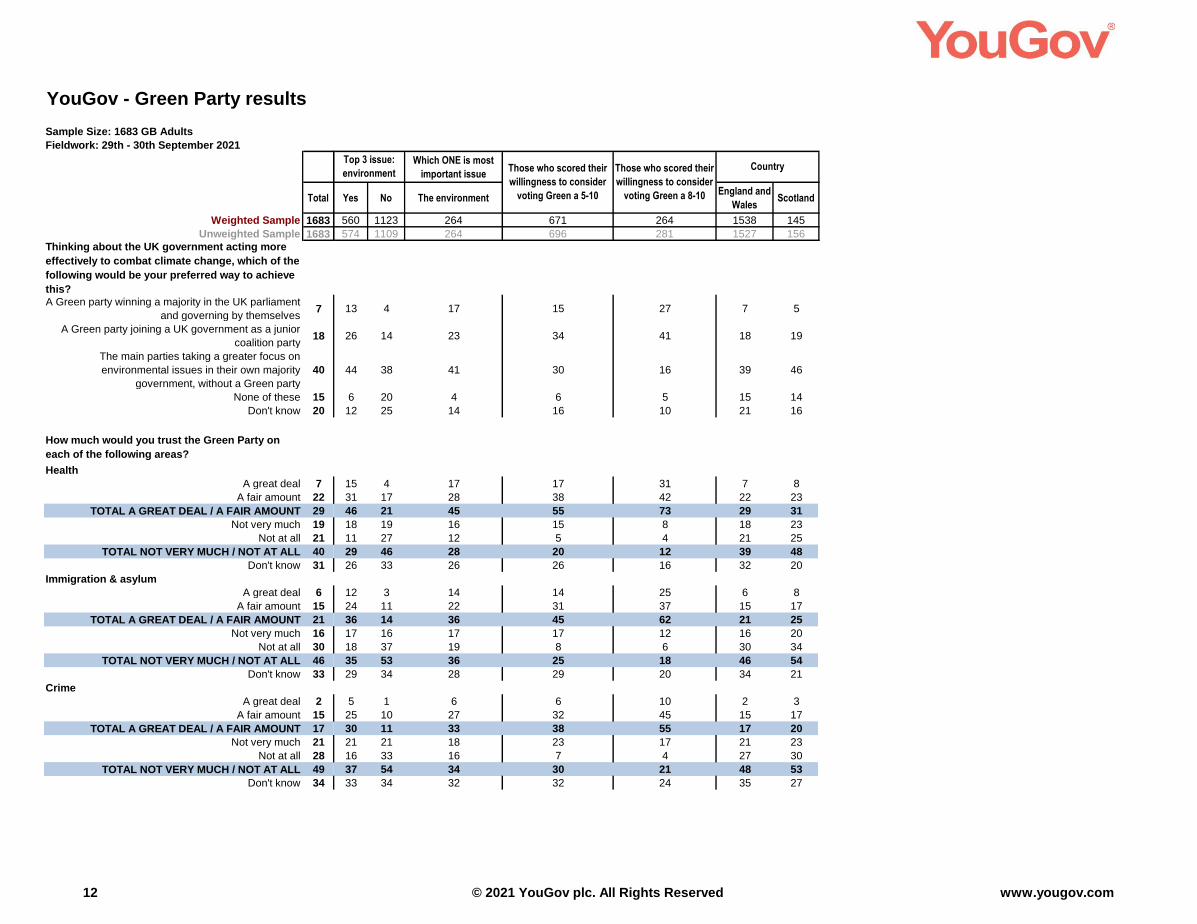
Thinking about the UK government acting more
effectively to combat climate change, which of the
following would be your preferred way to achieve
this?
A Green party winning a majority in the UK parliament
and governing by themselves7 2 15 13 12 3 1 8 10 7 7 5 9 8 3 8 5 8 7 6 8 5
A Green party joining a UK government as a junior
coalition party18 7 30 22 28 9 5 33 29 17 19 25 19 13 16 21 13 19 16 18 19 19
The main parties taking a greater focus on
environmental issues in their own majority
government, without a Green party
40 58 29 41 36 48 65 36 36 43 37 42 33 46 45 43 36 35 43 39 36 46
None of these 15 21 8 13 10 23 18 6 16 19 12 1 15 19 18 13 19 15 14 14 18 14
Don't know 20 13 19 12 14 17 12 17 8 15 26 26 24 15 18 16 27 23 20 24 19 16
How much would you trust the Green Party on
each of the following areas?
Health
A great deal 7 2 17 8 14 2 1 13 10 7 8 9 8 7 6 8 7 10 7 6 7 8
A fair amount 22 15 32 34 33 14 13 35 41 22 21 26 23 20 20 25 17 27 19 21 22 23
TOTAL A GREAT DEAL / A FAIR AMOUNT 29 17 49 42 47 16 14 48 51 29 29 35 31 27 26 33 24 37 26 27 29 31
Not very much 19 25 15 18 16 24 26 16 19 22 15 15 16 20 25 18 20 18 18 16 21 23
Not at all 21 38 7 9 11 34 39 9 9 26 17 13 19 27 23 22 21 14 22 22 22 25
TOTAL NOT VERY MUCH / NOT AT ALL 40 63 22 27 27 58 65 25 28 48 32 28 35 47 48 40 41 32 40 38 43 48
Don't know 31 20 28 31 25 25 22 27 21 22 39 37 34 26 27 27 35 31 33 34 28 20
Immigration & asylum
A great deal 6 1 15 7 11 1 1 11 7 7 5 9 7 4 4 7 5 9 5 4 7 8
A fair amount 15 6 27 30 27 6 5 25 33 15 16 22 16 12 14 18 11 18 16 15 13 17
TOTAL A GREAT DEAL / A FAIR AMOUNT 21 7 42 37 38 7 6 36 40 22 21 31 23 16 18 25 16 27 21 19 20 25
Not very much 16 19 16 16 16 18 15 17 20 17 15 5 16 17 20 15 17 19 15 13 18 20
Not at all 30 55 11 14 16 50 58 15 14 38 23 22 25 39 36 31 30 20 32 30 33 34
TOTAL NOT VERY MUCH / NOT AT ALL 46 74 27 30 32 68 73 32 34 55 38 27 41 56 56 46 47 39 47 43 51 54
Don't know 33 20 31 33 29 25 22 31 26 23 41 41 37 27 27 29 37 34 33 39 29 21
Crime
A great deal 2 1 5 2 4 1 0 4 3 2 2 3 3 1 2 3 2 2 2 2 3 3
A fair amount 15 7 26 25 26 6 6 24 36 15 15 18 18 15 10 17 13 22 14 13 14 17
TOTAL A GREAT DEAL / A FAIR AMOUNT 17 8 31 27 30 7 6 28 39 17 17 21 21 16 12 20 15 24 16 15 17 20
Not very much 21 23 26 21 24 23 20 25 24 24 18 16 17 22 29 21 20 22 20 21 20 23
Not at all 28 48 11 14 15 44 50 13 12 34 21 19 26 32 30 28 28 23 28 26 30 30
TOTAL NOT VERY MUCH / NOT AT ALL 49 71 37 35 39 67 70 38 36 58 39 35 43 54 59 49 48 45 48 47 50 53
Don't know 34 22 31 37 31 26 24 33 25 24 43 45 37 29 29 31 38 31 36 37 32 27
11 www.yougov.com© 2021 YouGov plc. All Rights Reserved
YouGov - Green Party results
Sample Size: 1683 GB Adults
Fieldwork: 29th - 30th September 2021
Total
Weighted Sample 1683
Unweighted Sample 1683
Thinking about the UK government acting more
effectively to combat climate change, which of the
following would be your preferred way to achieve
this?
A Green party winning a majority in the UK parliament
and governing by themselves7
A Green party joining a UK government as a junior
coalition party18
The main parties taking a greater focus on
environmental issues in their own majority
government, without a Green party
40
None of these 15
Don't know 20
How much would you trust the Green Party on
each of the following areas?
Health
A great deal 7
A fair amount 22
TOTAL A GREAT DEAL / A FAIR AMOUNT 29
Not very much 19
Not at all 21
TOTAL NOT VERY MUCH / NOT AT ALL 40
Don't know 31
Immigration & asylum
A great deal 6
A fair amount 15
TOTAL A GREAT DEAL / A FAIR AMOUNT 21
Not very much 16
Not at all 30
TOTAL NOT VERY MUCH / NOT AT ALL 46
Don't know 33
Crime
A great deal 2
A fair amount 15
TOTAL A GREAT DEAL / A FAIR AMOUNT 17
Not very much 21
Not at all 28
TOTAL NOT VERY MUCH / NOT AT ALL 49
Don't know 34
Which ONE is most
important issue
Yes No The environmentEngland and
WalesScotland
560 1123 264 671 264 1538 145
574 1109 264 696 281 1527 156
Top 3 issue:
environmentCountryThose who scored their
willingness to consider
voting Green a 5-10
Those who scored their
willingness to consider
voting Green a 8-10
13 4 17 15 27 7 5
26 14 23 34 41 18 19
44 38 41 30 16 39 46
6 20 4 6 5 15 14
12 25 14 16 10 21 16
15 4 17 17 31 7 8
31 17 28 38 42 22 23
46 21 45 55 73 29 31
18 19 16 15 8 18 23
11 27 12 5 4 21 25
29 46 28 20 12 39 48
26 33 26 26 16 32 20
12 3 14 14 25 6 8
24 11 22 31 37 15 17
36 14 36 45 62 21 25
17 16 17 17 12 16 20
18 37 19 8 6 30 34
35 53 36 25 18 46 54
29 34 28 29 20 34 21
5 1 6 6 10 2 3
25 10 27 32 45 15 17
30 11 33 38 55 17 20
21 21 18 23 17 21 23
16 33 16 7 4 27 30
37 54 34 30 21 48 53
33 34 32 32 24 35 27
12 www.yougov.com© 2021 YouGov plc. All Rights Reserved
YouGov - Green Party results
Sample Size: 1683 GB Adults
Fieldwork: 29th - 30th September 2021
Total Con Lab Lib Dem Remain Leave Con Lab Lib Dem Male Female 18-24 25-49 50-64 65+ ABC1 C2DE LondonRest of
South
Midlands /
WalesNorth Scotland
Weighted Sample 1683 571 417 151 624 666 393 384 90 818 865 183 702 406 392 959 724 202 565 365 406 145
Unweighted Sample 1683 593 428 166 688 703 412 388 99 725 958 136 678 427 442 1028 655 174 598 360 395 156
RegionVote in 2019 GE EU Ref 2016 Voting Intention Gender Age Social Grade
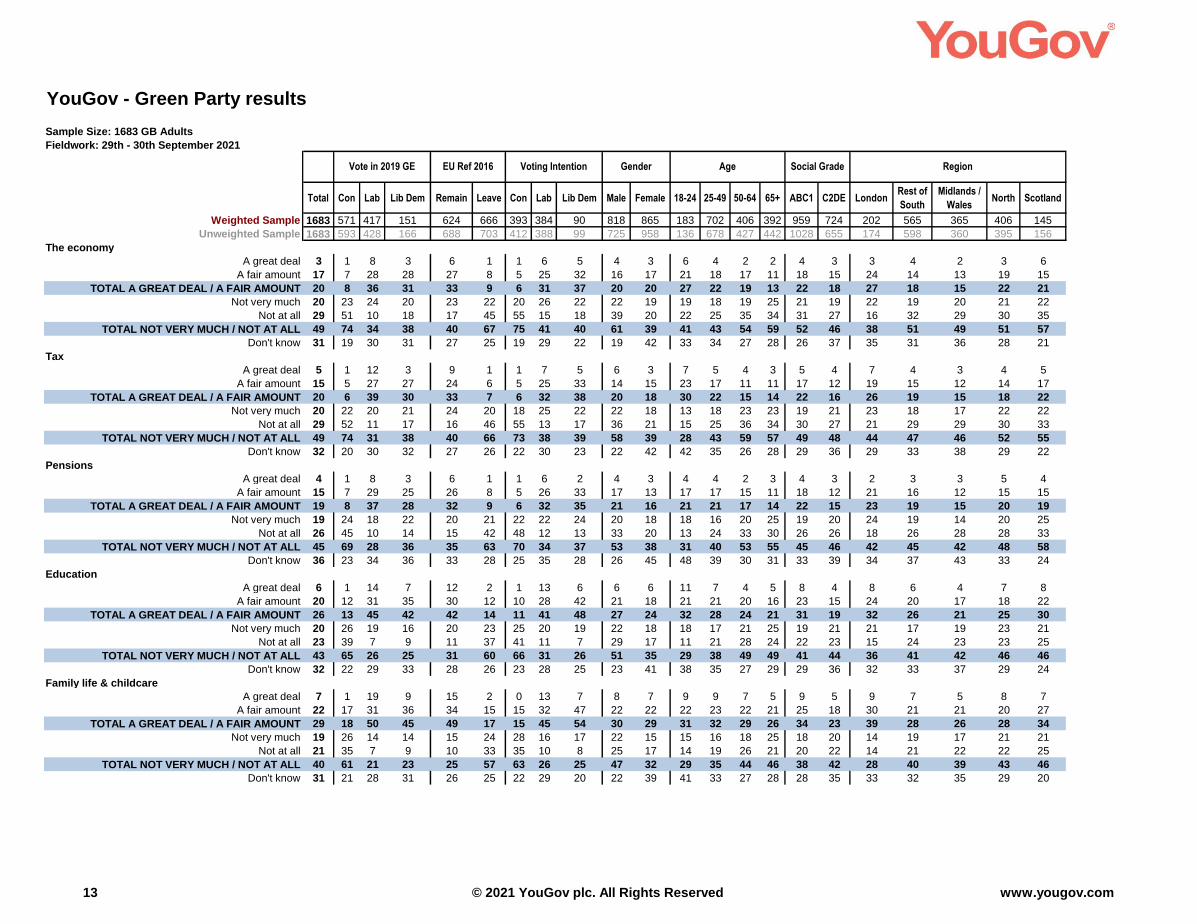
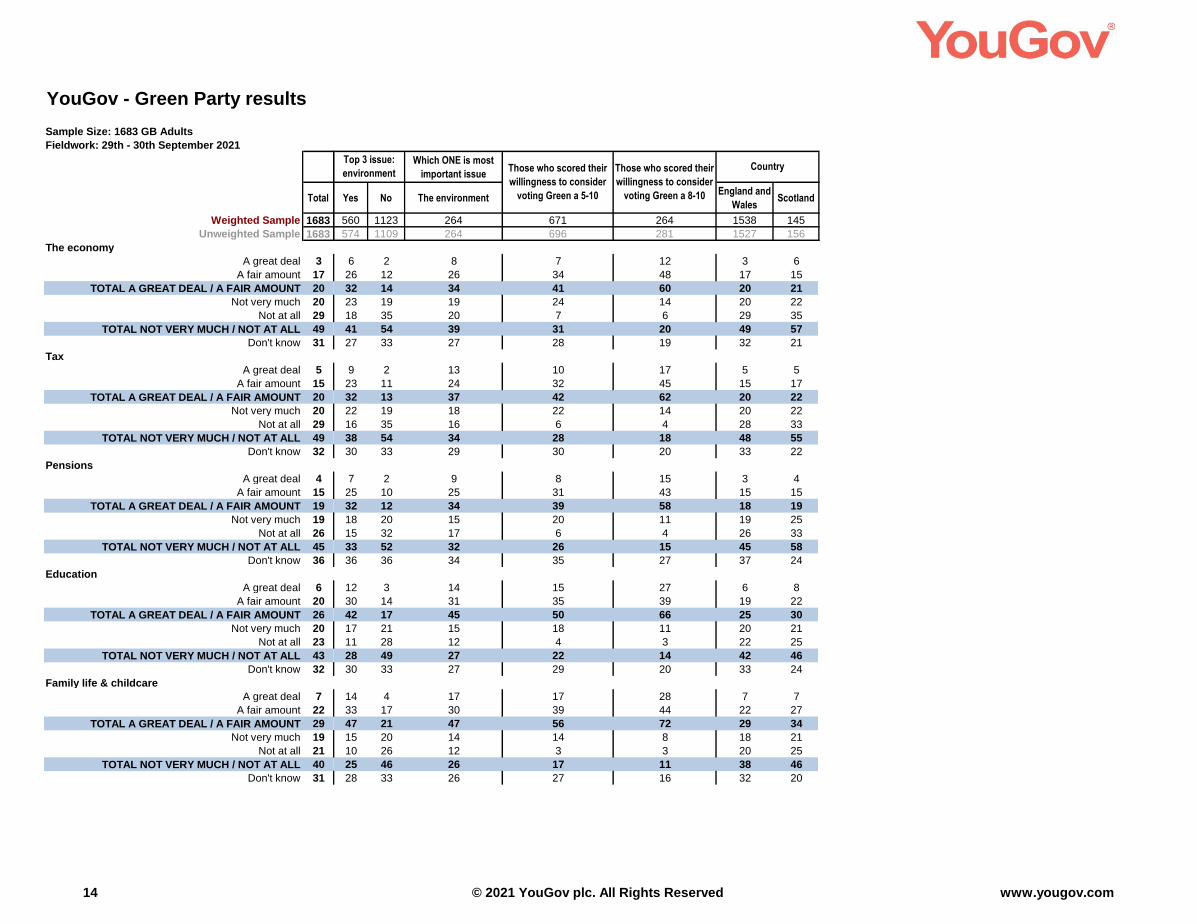
The economy
A great deal 3 1 8 3 6 1 1 6 5 4 3 6 4 2 2 4 3 3 4 2 3 6
A fair amount 17 7 28 28 27 8 5 25 32 16 17 21 18 17 11 18 15 24 14 13 19 15
TOTAL A GREAT DEAL / A FAIR AMOUNT 20 8 36 31 33 9 6 31 37 20 20 27 22 19 13 22 18 27 18 15 22 21
Not very much 20 23 24 20 23 22 20 26 22 22 19 19 18 19 25 21 19 22 19 20 21 22
Not at all 29 51 10 18 17 45 55 15 18 39 20 22 25 35 34 31 27 16 32 29 30 35
TOTAL NOT VERY MUCH / NOT AT ALL 49 74 34 38 40 67 75 41 40 61 39 41 43 54 59 52 46 38 51 49 51 57
Don't know 31 19 30 31 27 25 19 29 22 19 42 33 34 27 28 26 37 35 31 36 28 21
Tax
A great deal 5 1 12 3 9 1 1 7 5 6 3 7 5 4 3 5 4 7 4 3 4 5
A fair amount 15 5 27 27 24 6 5 25 33 14 15 23 17 11 11 17 12 19 15 12 14 17
TOTAL A GREAT DEAL / A FAIR AMOUNT 20 6 39 30 33 7 6 32 38 20 18 30 22 15 14 22 16 26 19 15 18 22
Not very much 20 22 20 21 24 20 18 25 22 22 18 13 18 23 23 19 21 23 18 17 22 22
Not at all 29 52 11 17 16 46 55 13 17 36 21 15 25 36 34 30 27 21 29 29 30 33
TOTAL NOT VERY MUCH / NOT AT ALL 49 74 31 38 40 66 73 38 39 58 39 28 43 59 57 49 48 44 47 46 52 55
Don't know 32 20 30 32 27 26 22 30 23 22 42 42 35 26 28 29 36 29 33 38 29 22
Pensions
A great deal 4 1 8 3 6 1 1 6 2 4 3 4 4 2 3 4 3 2 3 3 5 4
A fair amount 15 7 29 25 26 8 5 26 33 17 13 17 17 15 11 18 12 21 16 12 15 15
TOTAL A GREAT DEAL / A FAIR AMOUNT 19 8 37 28 32 9 6 32 35 21 16 21 21 17 14 22 15 23 19 15 20 19
Not very much 19 24 18 22 20 21 22 22 24 20 18 18 16 20 25 19 20 24 19 14 20 25
Not at all 26 45 10 14 15 42 48 12 13 33 20 13 24 33 30 26 26 18 26 28 28 33
TOTAL NOT VERY MUCH / NOT AT ALL 45 69 28 36 35 63 70 34 37 53 38 31 40 53 55 45 46 42 45 42 48 58
Don't know 36 23 34 36 33 28 25 35 28 26 45 48 39 30 31 33 39 34 37 43 33 24
Education
A great deal 6 1 14 7 12 2 1 13 6 6 6 11 7 4 5 8 4 8 6 4 7 8
A fair amount 20 12 31 35 30 12 10 28 42 21 18 21 21 20 16 23 15 24 20 17 18 22
TOTAL A GREAT DEAL / A FAIR AMOUNT 26 13 45 42 42 14 11 41 48 27 24 32 28 24 21 31 19 32 26 21 25 30
Not very much 20 26 19 16 20 23 25 20 19 22 18 18 17 21 25 19 21 21 17 19 23 21
Not at all 23 39 7 9 11 37 41 11 7 29 17 11 21 28 24 22 23 15 24 23 23 25
TOTAL NOT VERY MUCH / NOT AT ALL 43 65 26 25 31 60 66 31 26 51 35 29 38 49 49 41 44 36 41 42 46 46
Don't know 32 22 29 33 28 26 23 28 25 23 41 38 35 27 29 29 36 32 33 37 29 24
Family life & childcare
A great deal 7 1 19 9 15 2 0 13 7 8 7 9 9 7 5 9 5 9 7 5 8 7
A fair amount 22 17 31 36 34 15 15 32 47 22 22 22 23 22 21 25 18 30 21 21 20 27
TOTAL A GREAT DEAL / A FAIR AMOUNT 29 18 50 45 49 17 15 45 54 30 29 31 32 29 26 34 23 39 28 26 28 34
Not very much 19 26 14 14 15 24 28 16 17 22 15 15 16 18 25 18 20 14 19 17 21 21
Not at all 21 35 7 9 10 33 35 10 8 25 17 14 19 26 21 20 22 14 21 22 22 25
TOTAL NOT VERY MUCH / NOT AT ALL 40 61 21 23 25 57 63 26 25 47 32 29 35 44 46 38 42 28 40 39 43 46
Don't know 31 21 28 31 26 25 22 29 20 22 39 41 33 27 28 28 35 33 32 35 29 20
13 www.yougov.com© 2021 YouGov plc. All Rights Reserved
YouGov - Green Party results
Sample Size: 1683 GB Adults
Fieldwork: 29th - 30th September 2021
Total
Weighted Sample 1683
Unweighted Sample 1683
The economy
A great deal 3
A fair amount 17
TOTAL A GREAT DEAL / A FAIR AMOUNT 20
Not very much 20
Not at all 29
TOTAL NOT VERY MUCH / NOT AT ALL 49
Don't know 31
Tax
A great deal 5
A fair amount 15
TOTAL A GREAT DEAL / A FAIR AMOUNT 20
Not very much 20
Not at all 29
TOTAL NOT VERY MUCH / NOT AT ALL 49
Don't know 32
Pensions
A great deal 4
A fair amount 15
TOTAL A GREAT DEAL / A FAIR AMOUNT 19
Not very much 19
Not at all 26
TOTAL NOT VERY MUCH / NOT AT ALL 45
Don't know 36
Education
A great deal 6
A fair amount 20
TOTAL A GREAT DEAL / A FAIR AMOUNT 26
Not very much 20
Not at all 23
TOTAL NOT VERY MUCH / NOT AT ALL 43
Don't know 32
Family life & childcare
A great deal 7
A fair amount 22
TOTAL A GREAT DEAL / A FAIR AMOUNT 29
Not very much 19
Not at all 21
TOTAL NOT VERY MUCH / NOT AT ALL 40
Don't know 31
Which ONE is most
important issue
Yes No The environmentEngland and
WalesScotland
560 1123 264 671 264 1538 145
574 1109 264 696 281 1527 156
Top 3 issue:
environmentCountryThose who scored their
willingness to consider
voting Green a 5-10
Those who scored their
willingness to consider
voting Green a 8-10
6 2 8 7 12 3 6
26 12 26 34 48 17 15
32 14 34 41 60 20 21
23 19 19 24 14 20 22
18 35 20 7 6 29 35
41 54 39 31 20 49 57
27 33 27 28 19 32 21
9 2 13 10 17 5 5
23 11 24 32 45 15 17
32 13 37 42 62 20 22
22 19 18 22 14 20 22
16 35 16 6 4 28 33
38 54 34 28 18 48 55
30 33 29 30 20 33 22
7 2 9 8 15 3 4
25 10 25 31 43 15 15
32 12 34 39 58 18 19
18 20 15 20 11 19 25
15 32 17 6 4 26 33
33 52 32 26 15 45 58
36 36 34 35 27 37 24
12 3 14 15 27 6 8
30 14 31 35 39 19 22
42 17 45 50 66 25 30
17 21 15 18 11 20 21
11 28 12 4 3 22 25
28 49 27 22 14 42 46
30 33 27 29 20 33 24
14 4 17 17 28 7 7
33 17 30 39 44 22 27
47 21 47 56 72 29 34
15 20 14 14 8 18 21
10 26 12 3 3 20 25
25 46 26 17 11 38 46
28 33 26 27 16 32 20
14 www.yougov.com© 2021 YouGov plc. All Rights Reserved
YouGov - Green Party results
Sample Size: 1683 GB Adults
Fieldwork: 29th - 30th September 2021
Total Con Lab Lib Dem Remain Leave Con Lab Lib Dem Male Female 18-24 25-49 50-64 65+ ABC1 C2DE LondonRest of
South
Midlands /
WalesNorth Scotland
Weighted Sample 1683 571 417 151 624 666 393 384 90 818 865 183 702 406 392 959 724 202 565 365 406 145
Unweighted Sample 1683 593 428 166 688 703 412 388 99 725 958 136 678 427 442 1028 655 174 598 360 395 156
RegionVote in 2019 GE EU Ref 2016 Voting Intention Gender Age Social Grade
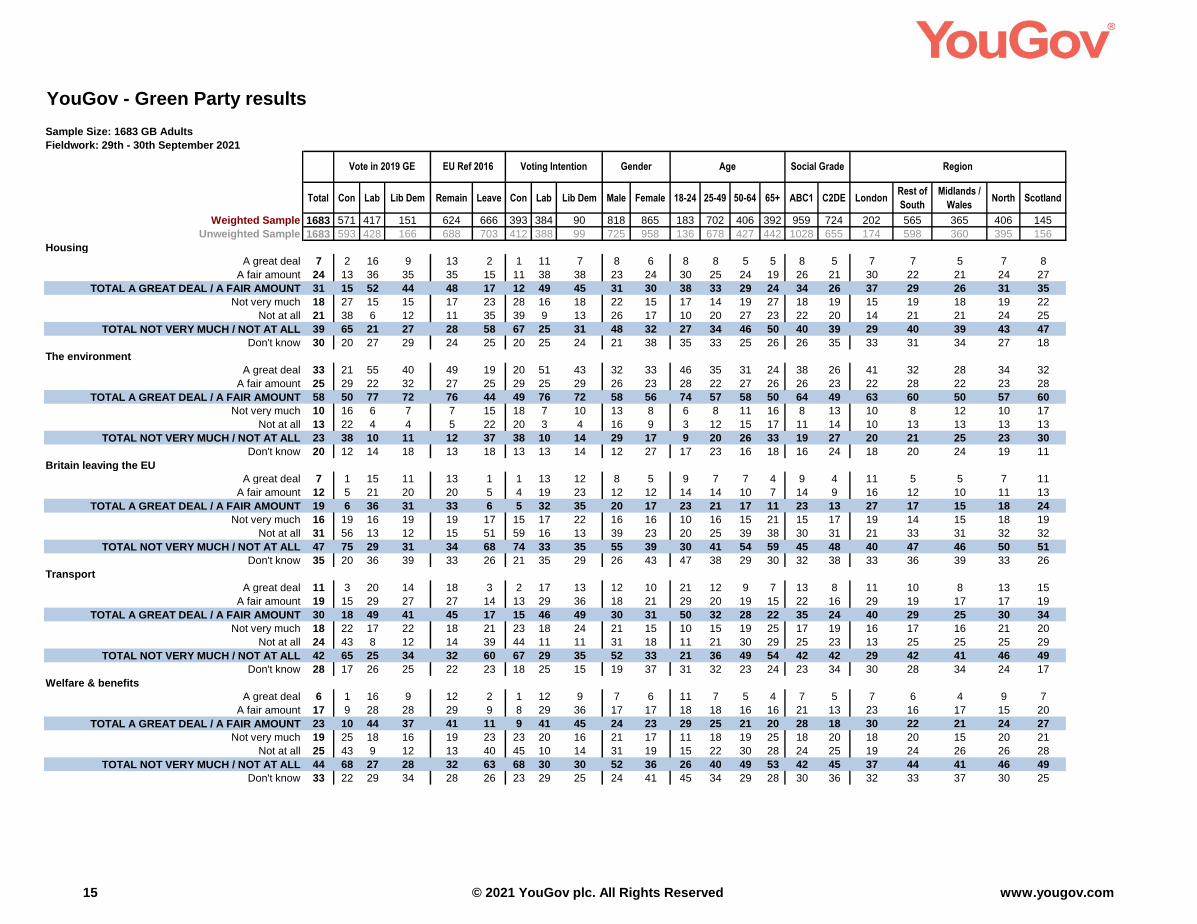
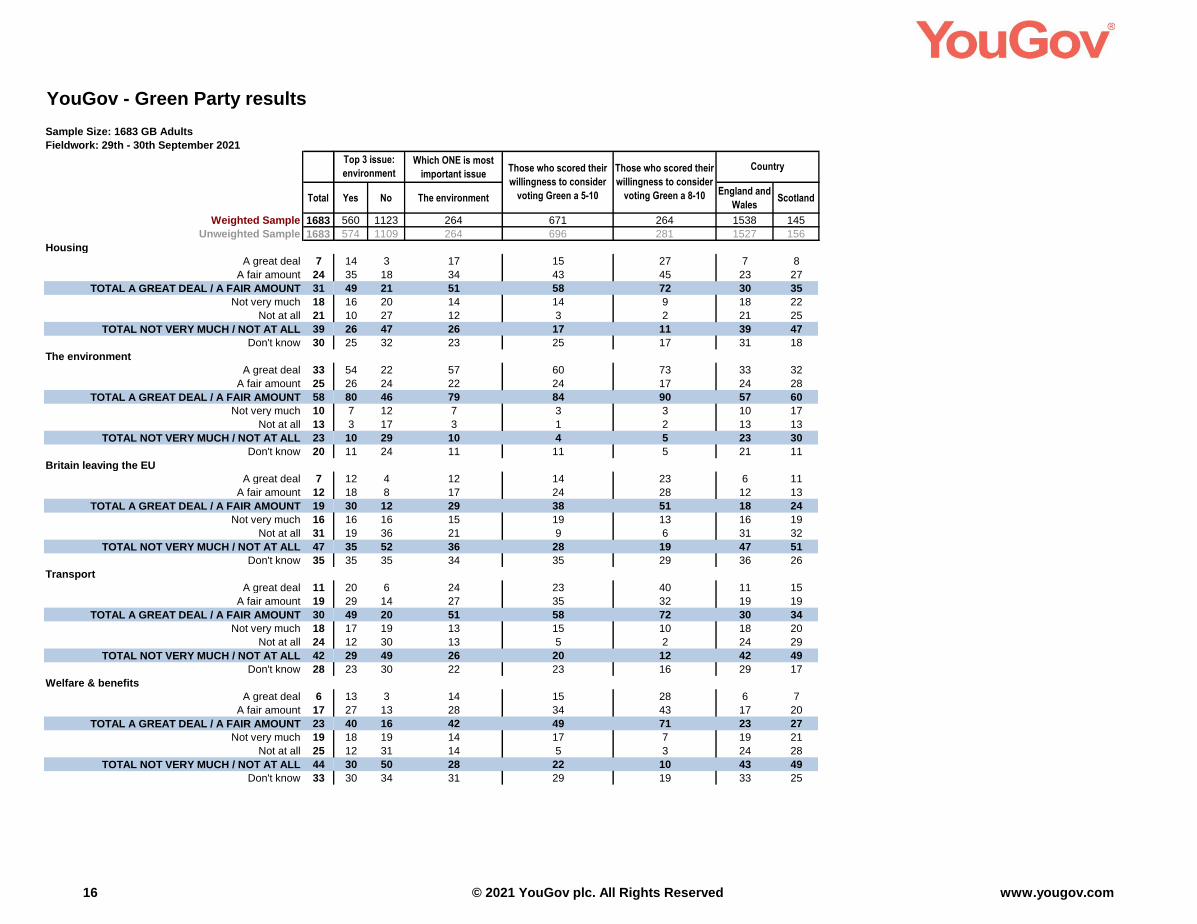
Housing
A great deal 7 2 16 9 13 2 1 11 7 8 6 8 8 5 5 8 5 7 7 5 7 8
A fair amount 24 13 36 35 35 15 11 38 38 23 24 30 25 24 19 26 21 30 22 21 24 27
TOTAL A GREAT DEAL / A FAIR AMOUNT 31 15 52 44 48 17 12 49 45 31 30 38 33 29 24 34 26 37 29 26 31 35
Not very much 18 27 15 15 17 23 28 16 18 22 15 17 14 19 27 18 19 15 19 18 19 22
Not at all 21 38 6 12 11 35 39 9 13 26 17 10 20 27 23 22 20 14 21 21 24 25
TOTAL NOT VERY MUCH / NOT AT ALL 39 65 21 27 28 58 67 25 31 48 32 27 34 46 50 40 39 29 40 39 43 47
Don't know 30 20 27 29 24 25 20 25 24 21 38 35 33 25 26 26 35 33 31 34 27 18
The environment
A great deal 33 21 55 40 49 19 20 51 43 32 33 46 35 31 24 38 26 41 32 28 34 32
A fair amount 25 29 22 32 27 25 29 25 29 26 23 28 22 27 26 26 23 22 28 22 23 28
TOTAL A GREAT DEAL / A FAIR AMOUNT 58 50 77 72 76 44 49 76 72 58 56 74 57 58 50 64 49 63 60 50 57 60
Not very much 10 16 6 7 7 15 18 7 10 13 8 6 8 11 16 8 13 10 8 12 10 17
Not at all 13 22 4 4 5 22 20 3 4 16 9 3 12 15 17 11 14 10 13 13 13 13
TOTAL NOT VERY MUCH / NOT AT ALL 23 38 10 11 12 37 38 10 14 29 17 9 20 26 33 19 27 20 21 25 23 30
Don't know 20 12 14 18 13 18 13 13 14 12 27 17 23 16 18 16 24 18 20 24 19 11
Britain leaving the EU
A great deal 7 1 15 11 13 1 1 13 12 8 5 9 7 7 4 9 4 11 5 5 7 11
A fair amount 12 5 21 20 20 5 4 19 23 12 12 14 14 10 7 14 9 16 12 10 11 13
TOTAL A GREAT DEAL / A FAIR AMOUNT 19 6 36 31 33 6 5 32 35 20 17 23 21 17 11 23 13 27 17 15 18 24
Not very much 16 19 16 19 19 17 15 17 22 16 16 10 16 15 21 15 17 19 14 15 18 19
Not at all 31 56 13 12 15 51 59 16 13 39 23 20 25 39 38 30 31 21 33 31 32 32
TOTAL NOT VERY MUCH / NOT AT ALL 47 75 29 31 34 68 74 33 35 55 39 30 41 54 59 45 48 40 47 46 50 51
Don't know 35 20 36 39 33 26 21 35 29 26 43 47 38 29 30 32 38 33 36 39 33 26
Transport
A great deal 11 3 20 14 18 3 2 17 13 12 10 21 12 9 7 13 8 11 10 8 13 15
A fair amount 19 15 29 27 27 14 13 29 36 18 21 29 20 19 15 22 16 29 19 17 17 19
TOTAL A GREAT DEAL / A FAIR AMOUNT 30 18 49 41 45 17 15 46 49 30 31 50 32 28 22 35 24 40 29 25 30 34
Not very much 18 22 17 22 18 21 23 18 24 21 15 10 15 19 25 17 19 16 17 16 21 20
Not at all 24 43 8 12 14 39 44 11 11 31 18 11 21 30 29 25 23 13 25 25 25 29
TOTAL NOT VERY MUCH / NOT AT ALL 42 65 25 34 32 60 67 29 35 52 33 21 36 49 54 42 42 29 42 41 46 49
Don't know 28 17 26 25 22 23 18 25 15 19 37 31 32 23 24 23 34 30 28 34 24 17
Welfare & benefits
A great deal 6 1 16 9 12 2 1 12 9 7 6 11 7 5 4 7 5 7 6 4 9 7
A fair amount 17 9 28 28 29 9 8 29 36 17 17 18 18 16 16 21 13 23 16 17 15 20
TOTAL A GREAT DEAL / A FAIR AMOUNT 23 10 44 37 41 11 9 41 45 24 23 29 25 21 20 28 18 30 22 21 24 27
Not very much 19 25 18 16 19 23 23 20 16 21 17 11 18 19 25 18 20 18 20 15 20 21
Not at all 25 43 9 12 13 40 45 10 14 31 19 15 22 30 28 24 25 19 24 26 26 28
TOTAL NOT VERY MUCH / NOT AT ALL 44 68 27 28 32 63 68 30 30 52 36 26 40 49 53 42 45 37 44 41 46 49
Don't know 33 22 29 34 28 26 23 29 25 24 41 45 34 29 28 30 36 32 33 37 30 25
15 www.yougov.com© 2021 YouGov plc. All Rights Reserved
YouGov - Green Party results
Sample Size: 1683 GB Adults
Fieldwork: 29th - 30th September 2021
Total
Weighted Sample 1683
Unweighted Sample 1683
Housing
A great deal 7
A fair amount 24
TOTAL A GREAT DEAL / A FAIR AMOUNT 31
Not very much 18
Not at all 21
TOTAL NOT VERY MUCH / NOT AT ALL 39
Don't know 30
The environment
A great deal 33
A fair amount 25
TOTAL A GREAT DEAL / A FAIR AMOUNT 58
Not very much 10
Not at all 13
TOTAL NOT VERY MUCH / NOT AT ALL 23
Don't know 20
Britain leaving the EU
A great deal 7
A fair amount 12
TOTAL A GREAT DEAL / A FAIR AMOUNT 19
Not very much 16
Not at all 31
TOTAL NOT VERY MUCH / NOT AT ALL 47
Don't know 35
Transport
A great deal 11
A fair amount 19
TOTAL A GREAT DEAL / A FAIR AMOUNT 30
Not very much 18
Not at all 24
TOTAL NOT VERY MUCH / NOT AT ALL 42
Don't know 28
Welfare & benefits
A great deal 6
A fair amount 17
TOTAL A GREAT DEAL / A FAIR AMOUNT 23
Not very much 19
Not at all 25
TOTAL NOT VERY MUCH / NOT AT ALL 44
Don't know 33
Which ONE is most
important issue
Yes No The environmentEngland and
WalesScotland
560 1123 264 671 264 1538 145
574 1109 264 696 281 1527 156
Top 3 issue:
environmentCountryThose who scored their
willingness to consider
voting Green a 5-10
Those who scored their
willingness to consider
voting Green a 8-10
14 3 17 15 27 7 8
35 18 34 43 45 23 27
49 21 51 58 72 30 35
16 20 14 14 9 18 22
10 27 12 3 2 21 25
26 47 26 17 11 39 47
25 32 23 25 17 31 18
54 22 57 60 73 33 32
26 24 22 24 17 24 28
80 46 79 84 90 57 60
7 12 7 3 3 10 17
3 17 3 1 2 13 13
10 29 10 4 5 23 30
11 24 11 11 5 21 11
12 4 12 14 23 6 11
18 8 17 24 28 12 13
30 12 29 38 51 18 24
16 16 15 19 13 16 19
19 36 21 9 6 31 32
35 52 36 28 19 47 51
35 35 34 35 29 36 26
20 6 24 23 40 11 15
29 14 27 35 32 19 19
49 20 51 58 72 30 34
17 19 13 15 10 18 20
12 30 13 5 2 24 29
29 49 26 20 12 42 49
23 30 22 23 16 29 17
13 3 14 15 28 6 7
27 13 28 34 43 17 20
40 16 42 49 71 23 27
18 19 14 17 7 19 21
12 31 14 5 3 24 28
30 50 28 22 10 43 49
30 34 31 29 19 33 25
16 www.yougov.com© 2021 YouGov plc. All Rights Reserved
YouGov - Green Party results
Sample Size: 1683 GB Adults
Fieldwork: 29th - 30th September 2021
Total Con Lab Lib Dem Remain Leave Con Lab Lib Dem Male Female 18-24 25-49 50-64 65+ ABC1 C2DE LondonRest of
South
Midlands /
WalesNorth Scotland
Weighted Sample 1683 571 417 151 624 666 393 384 90 818 865 183 702 406 392 959 724 202 565 365 406 145
Unweighted Sample 1683 593 428 166 688 703 412 388 99 725 958 136 678 427 442 1028 655 174 598 360 395 156
RegionVote in 2019 GE EU Ref 2016 Voting Intention Gender Age Social Grade
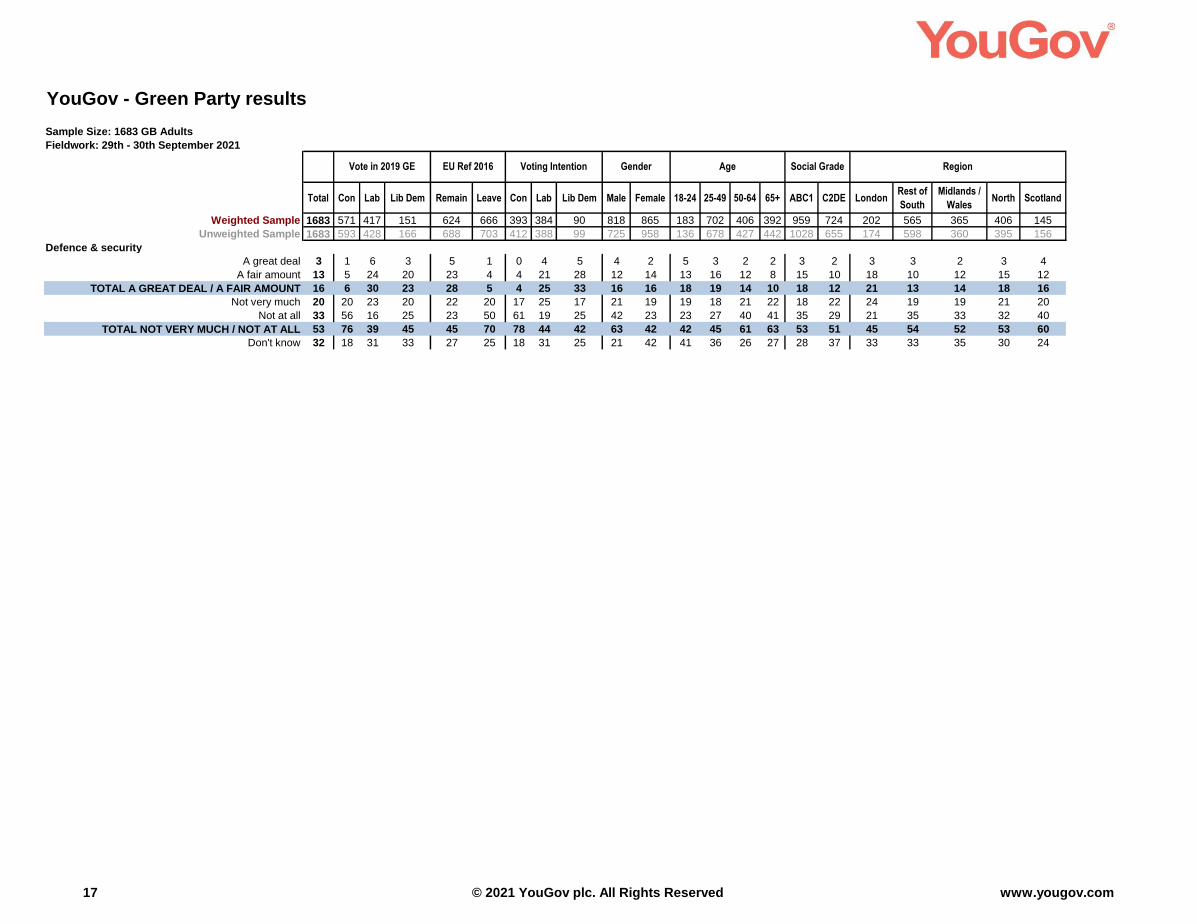
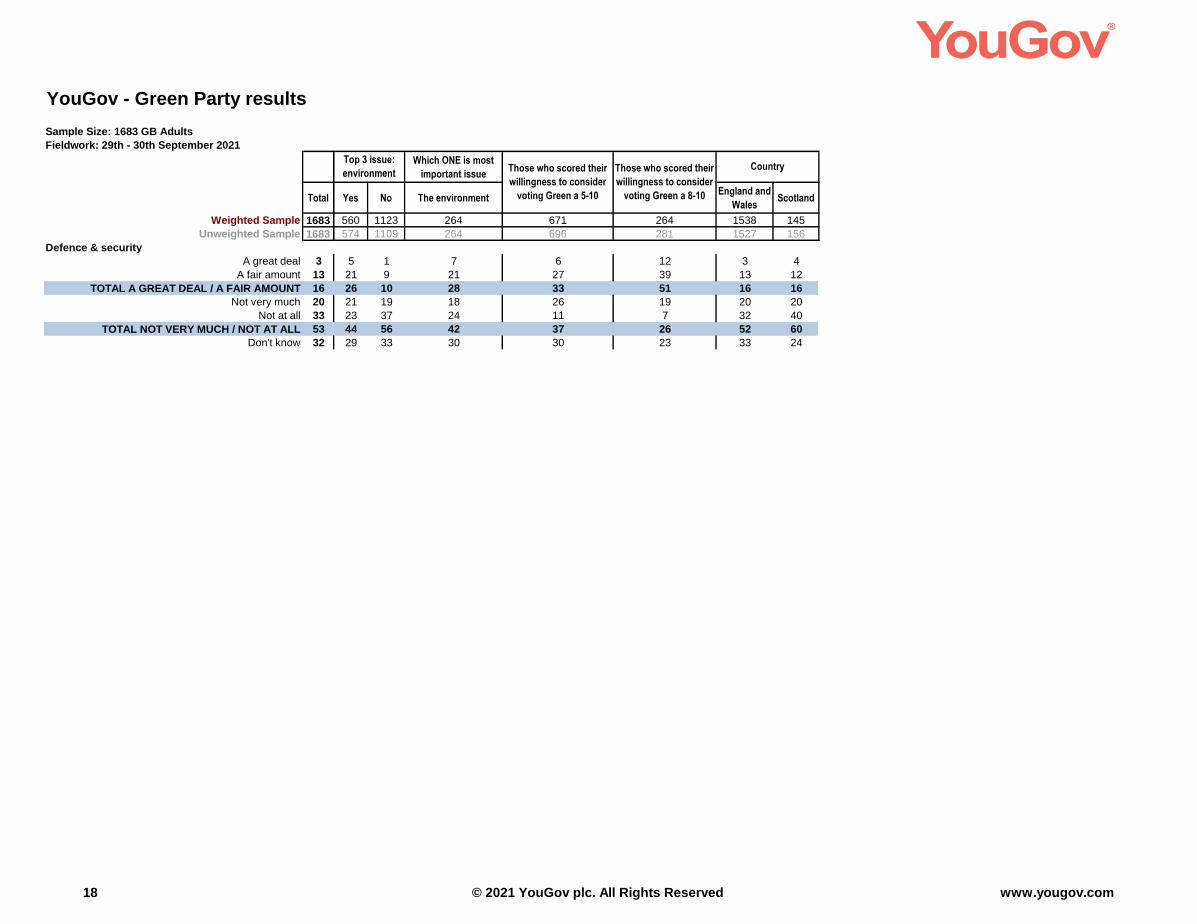
Defence & security
A great deal 3 1 6 3 5 1 0 4 5 4 2 5 3 2 2 3 2 3 3 2 3 4
A fair amount 13 5 24 20 23 4 4 21 28 12 14 13 16 12 8 15 10 18 10 12 15 12
TOTAL A GREAT DEAL / A FAIR AMOUNT 16 6 30 23 28 5 4 25 33 16 16 18 19 14 10 18 12 21 13 14 18 16
Not very much 20 20 23 20 22 20 17 25 17 21 19 19 18 21 22 18 22 24 19 19 21 20
Not at all 33 56 16 25 23 50 61 19 25 42 23 23 27 40 41 35 29 21 35 33 32 40
TOTAL NOT VERY MUCH / NOT AT ALL 53 76 39 45 45 70 78 44 42 63 42 42 45 61 63 53 51 45 54 52 53 60
Don't know 32 18 31 33 27 25 18 31 25 21 42 41 36 26 27 28 37 33 33 35 30 24
17 www.yougov.com© 2021 YouGov plc. All Rights Reserved
YouGov - Green Party results
Sample Size: 1683 GB Adults
Fieldwork: 29th - 30th September 2021
Total
Weighted Sample 1683
Unweighted Sample 1683
Defence & security
A great deal 3
A fair amount 13
TOTAL A GREAT DEAL / A FAIR AMOUNT 16
Not very much 20
Not at all 33
TOTAL NOT VERY MUCH / NOT AT ALL 53
Don't know 32
Which ONE is most
important issue
Yes No The environmentEngland and
WalesScotland
560 1123 264 671 264 1538 145
574 1109 264 696 281 1527 156
Top 3 issue:
environmentCountryThose who scored their
willingness to consider
voting Green a 5-10
Those who scored their
willingness to consider
voting Green a 8-10
5 1 7 6 12 3 4
21 9 21 27 39 13 12
26 10 28 33 51 16 16
21 19 18 26 19 20 20
23 37 24 11 7 32 40
44 56 42 37 26 52 60
29 33 30 30 23 33 24
18 www.yougov.com© 2021 YouGov plc. All Rights Reserved
YouGov - Green Party results
Sample Size: 1683 GB Adults
Fieldwork: 29th - 30th September 2021
Total Con Lab Lib Dem Remain Leave Con Lab Lib Dem Male Female 18-24 25-49 50-64 65+ ABC1 C2DE LondonRest of
South
Midlands /
WalesNorth Scotland
Weighted Sample 1683 571 417 151 624 666 393 384 90 818 865 183 702 406 392 959 724 202 565 365 406 145
Unweighted Sample 1683 593 428 166 688 703 412 388 99 725 958 136 678 427 442 1028 655 174 598 360 395 156
RegionVote in 2019 GE EU Ref 2016 Voting Intention Gender Age Social Grade
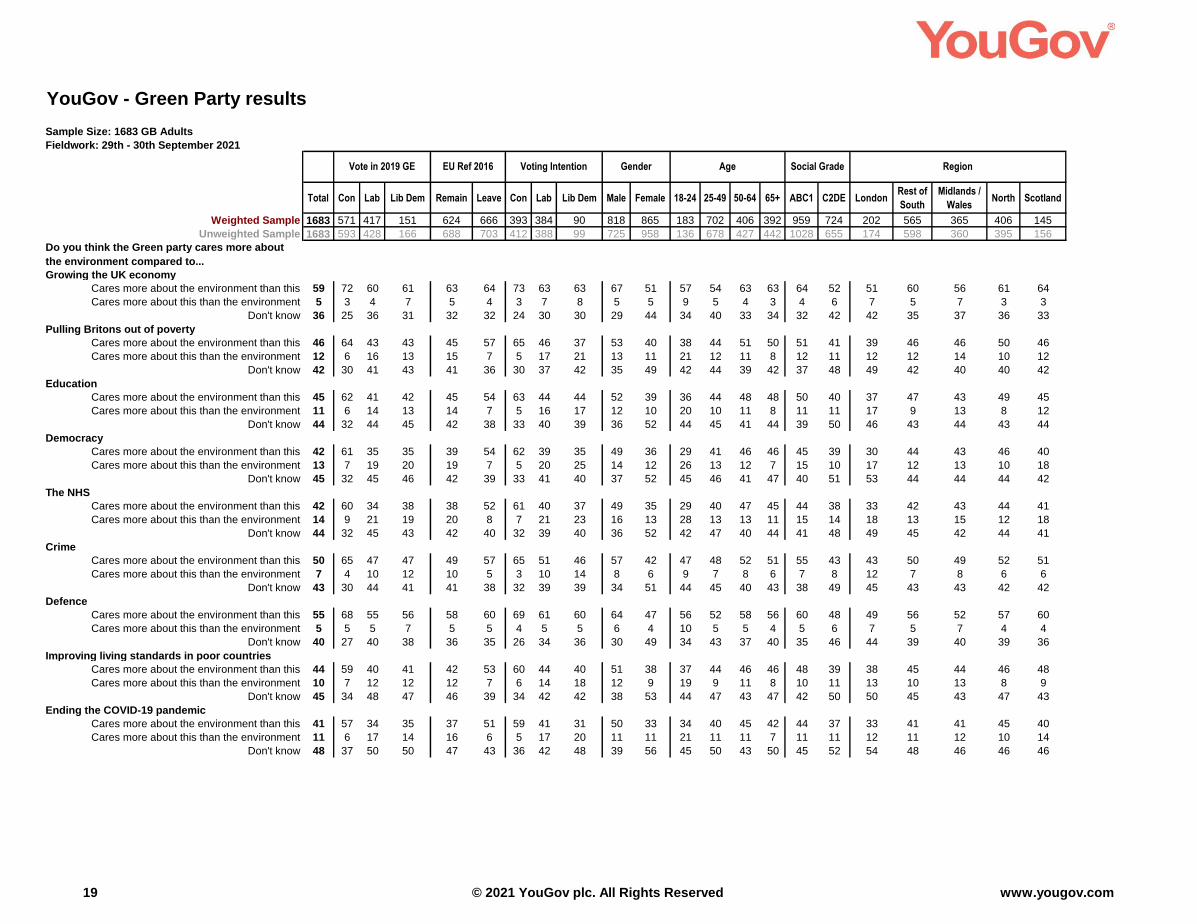
Do you think the Green party cares more about
the environment compared to...
Growing the UK economy
Cares more about the environment than this 59 72 60 61 63 64 73 63 63 67 51 57 54 63 63 64 52 51 60 56 61 64
Cares more about this than the environment 5 3 4 7 5 4 3 7 8 5 5 9 5 4 3 4 6 7 5 7 3 3
Don't know 36 25 36 31 32 32 24 30 30 29 44 34 40 33 34 32 42 42 35 37 36 33
Pulling Britons out of poverty
Cares more about the environment than this 46 64 43 43 45 57 65 46 37 53 40 38 44 51 50 51 41 39 46 46 50 46
Cares more about this than the environment 12 6 16 13 15 7 5 17 21 13 11 21 12 11 8 12 11 12 12 14 10 12
Don't know 42 30 41 43 41 36 30 37 42 35 49 42 44 39 42 37 48 49 42 40 40 42
Education
Cares more about the environment than this 45 62 41 42 45 54 63 44 44 52 39 36 44 48 48 50 40 37 47 43 49 45
Cares more about this than the environment 11 6 14 13 14 7 5 16 17 12 10 20 10 11 8 11 11 17 9 13 8 12
Don't know 44 32 44 45 42 38 33 40 39 36 52 44 45 41 44 39 50 46 43 44 43 44
Democracy
Cares more about the environment than this 42 61 35 35 39 54 62 39 35 49 36 29 41 46 46 45 39 30 44 43 46 40
Cares more about this than the environment 13 7 19 20 19 7 5 20 25 14 12 26 13 12 7 15 10 17 12 13 10 18
Don't know 45 32 45 46 42 39 33 41 40 37 52 45 46 41 47 40 51 53 44 44 44 42
The NHS
Cares more about the environment than this 42 60 34 38 38 52 61 40 37 49 35 29 40 47 45 44 38 33 42 43 44 41
Cares more about this than the environment 14 9 21 19 20 8 7 21 23 16 13 28 13 13 11 15 14 18 13 15 12 18
Don't know 44 32 45 43 42 40 32 39 40 36 52 42 47 40 44 41 48 49 45 42 44 41
Crime
Cares more about the environment than this 50 65 47 47 49 57 65 51 46 57 42 47 48 52 51 55 43 43 50 49 52 51
Cares more about this than the environment 7 4 10 12 10 5 3 10 14 8 6 9 7 8 6 7 8 12 7 8 6 6
Don't know 43 30 44 41 41 38 32 39 39 34 51 44 45 40 43 38 49 45 43 43 42 42
Defence
Cares more about the environment than this 55 68 55 56 58 60 69 61 60 64 47 56 52 58 56 60 48 49 56 52 57 60
Cares more about this than the environment 5 5 5 7 5 5 4 5 5 6 4 10 5 5 4 5 6 7 5 7 4 4
Don't know 40 27 40 38 36 35 26 34 36 30 49 34 43 37 40 35 46 44 39 40 39 36
Improving living standards in poor countries
Cares more about the environment than this 44 59 40 41 42 53 60 44 40 51 38 37 44 46 46 48 39 38 45 44 46 48
Cares more about this than the environment 10 7 12 12 12 7 6 14 18 12 9 19 9 11 8 10 11 13 10 13 8 9
Don't know 45 34 48 47 46 39 34 42 42 38 53 44 47 43 47 42 50 50 45 43 47 43
Ending the COVID-19 pandemic
Cares more about the environment than this 41 57 34 35 37 51 59 41 31 50 33 34 40 45 42 44 37 33 41 41 45 40
Cares more about this than the environment 11 6 17 14 16 6 5 17 20 11 11 21 11 11 7 11 11 12 11 12 10 14
Don't know 48 37 50 50 47 43 36 42 48 39 56 45 50 43 50 45 52 54 48 46 46 46
19 www.yougov.com© 2021 YouGov plc. All Rights Reserved
YouGov - Green Party results
Sample Size: 1683 GB Adults
Fieldwork: 29th - 30th September 2021
Total
Weighted Sample 1683
Unweighted Sample 1683
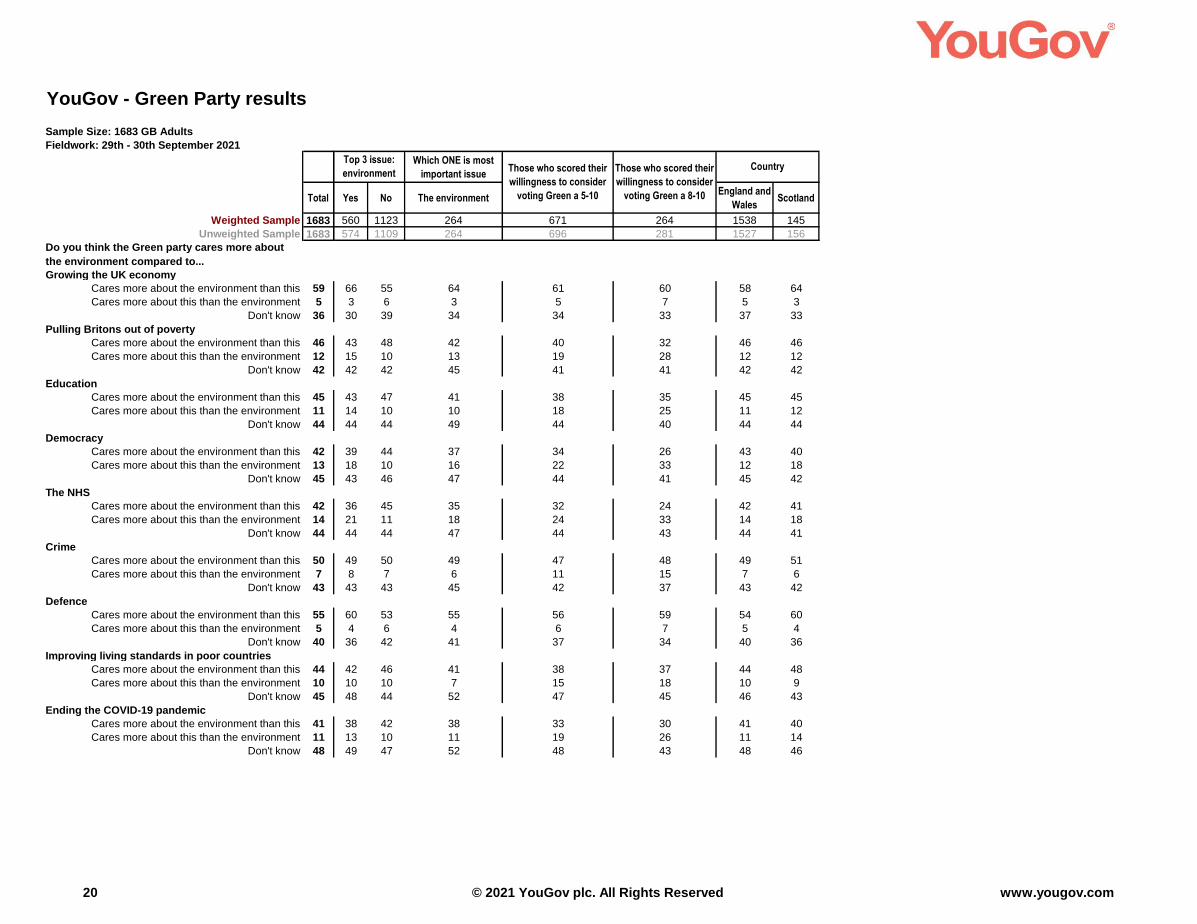
Do you think the Green party cares more about
the environment compared to...
Growing the UK economy
Cares more about the environment than this 59
Cares more about this than the environment 5
Don't know 36
Pulling Britons out of poverty
Cares more about the environment than this 46
Cares more about this than the environment 12
Don't know 42
Education
Cares more about the environment than this 45
Cares more about this than the environment 11
Don't know 44
Democracy
Cares more about the environment than this 42
Cares more about this than the environment 13
Don't know 45
The NHS
Cares more about the environment than this 42
Cares more about this than the environment 14
Don't know 44
Crime
Cares more about the environment than this 50
Cares more about this than the environment 7
Don't know 43
Defence
Cares more about the environment than this 55
Cares more about this than the environment 5
Don't know 40
Improving living standards in poor countries
Cares more about the environment than this 44
Cares more about this than the environment 10
Don't know 45
Ending the COVID-19 pandemic
Cares more about the environment than this 41
Cares more about this than the environment 11
Don't know 48
Which ONE is most
important issue
Yes No The environmentEngland and
WalesScotland
560 1123 264 671 264 1538 145
574 1109 264 696 281 1527 156
Top 3 issue:
environmentCountryThose who scored their
willingness to consider
voting Green a 5-10
Those who scored their
willingness to consider
voting Green a 8-10
66 55 64 61 60 58 64
3 6 3 5 7 5 3
30 39 34 34 33 37 33
43 48 42 40 32 46 46
15 10 13 19 28 12 12
42 42 45 41 41 42 42
43 47 41 38 35 45 45
14 10 10 18 25 11 12
44 44 49 44 40 44 44
39 44 37 34 26 43 40
18 10 16 22 33 12 18
43 46 47 44 41 45 42
36 45 35 32 24 42 41
21 11 18 24 33 14 18
44 44 47 44 43 44 41
49 50 49 47 48 49 51
8 7 6 11 15 7 6
43 43 45 42 37 43 42
60 53 55 56 59 54 60
4 6 4 6 7 5 4
36 42 41 37 34 40 36
42 46 41 38 37 44 48
10 10 7 15 18 10 9
48 44 52 47 45 46 43
38 42 38 33 30 41 40
13 10 11 19 26 11 14
49 47 52 48 43 48 46
20 www.yougov.com© 2021 YouGov plc. All Rights Reserved