Embed Size (px)
Citation preview
Spring 2010 Industry Study
Final Report Transportation Industry
The Industrial College of the Armed Forces National Defense University
Fort McNair, Washington, D. C. 20319-5062

i
TRANSPORTATION INDUSTRY 2010
ABSTRACT: Throughout history, a society’s ability to transport goods and people has been a key driver in success or failure to achieve security and prosperity. The vast and complex global transportation network of air, rail, highway, maritime, and pipeline infrastructure touches everything we use and impacts the diplomatic, information, military and economic instruments of power. In 2009, the transportation industry contributed 9.5% to U.S. Gross Domestic Product and employed 9.7% of the American workforce. However, the infrastructure that supports this industry is too old, congested, under-funded, and inefficient to achieve our desired level of national security in the future. Challenges that will impact the future of the industry include effects of the global economic crisis; increased security measures since 9/11; greater congestion from population growth centers in mega-regions; natural and man-made disasters; and increased government spending for entitlement programs and interest on the national debt. The unbalanced efforts of the federal government to fund transportation infrastructure have led to a morass of disjointed efforts. Recommendations to improve national security outcomes include development of a national transportation infrastructure strategy; establishing a non-discretionary transportation infrastructure fund; establishing a formal policy for public-private transportation partnerships; and establishing a process to prioritize and align transportation initiatives with available funds and national security objectives. Implementing these recommendations can help ensure a robust and vibrant economy and enhance national security for the United States in the future.
Mr. Gordon Hackett, Federal Emergency Management Agency, Seminar Leader COL Ghassan Abdul-Samad, Lebanon Army
LTC Mohamed Barkat, Djibouti Army LtCol Frank Battistelli, U.S. Air Force
CDR Jay Bottelson, U.S. Navy LtCol Matthew Cook, U.S. Marine Corps Ms. Maureen Cross, Dept. of the Army
Mr. Alphonse Dassonville, Dept. of the Army Mr. Craig Gibson, U.S. Coast Guard
Ms. Veronica Hiriams, U.S. Army Corps of Engineers Col Barbara Jefts, U.S. Air Force
LtCol Timothy MacGregor, U.S. Air Force CDR Chuck Miller, U.S. Navy
Ms. Amy O’Donnell, Dept. of the Navy LtCol Chuck Risio, U.S. Marine Corps
Ms. Kelly Morris, Faculty
CAPT Janet Florey, U.S. Coast Guard, Faculty Dr. Christina Lafferty, Faculty
ii
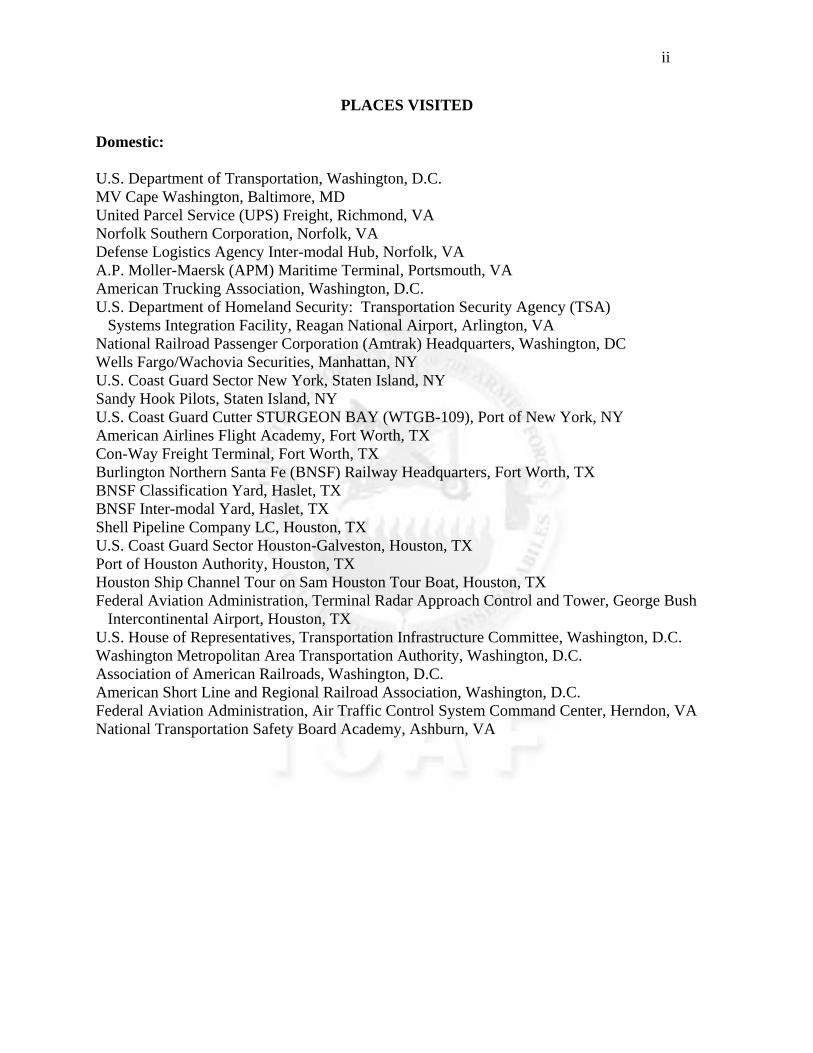
PLACES VISITED
Domestic: U.S. Department of Transportation, Washington, D.C. MV Cape Washington, Baltimore, MD United Parcel Service (UPS) Freight, Richmond, VA Norfolk Southern Corporation, Norfolk, VA Defense Logistics Agency Inter-modal Hub, Norfolk, VA A.P. Moller-Maersk (APM) Maritime Terminal, Portsmouth, VA American Trucking Association, Washington, D.C. U.S. Department of Homeland Security: Transportation Security Agency (TSA) Systems Integration Facility, Reagan National Airport, Arlington, VA National Railroad Passenger Corporation (Amtrak) Headquarters, Washington, DC Wells Fargo/Wachovia Securities, Manhattan, NY U.S. Coast Guard Sector New York, Staten Island, NY Sandy Hook Pilots, Staten Island, NY U.S. Coast Guard Cutter STURGEON BAY (WTGB-109), Port of New York, NY American Airlines Flight Academy, Fort Worth, TX Con-Way Freight Terminal, Fort Worth, TX Burlington Northern Santa Fe (BNSF) Railway Headquarters, Fort Worth, TX BNSF Classification Yard, Haslet, TX BNSF Inter-modal Yard, Haslet, TX Shell Pipeline Company LC, Houston, TX U.S. Coast Guard Sector Houston-Galveston, Houston, TX Port of Houston Authority, Houston, TX Houston Ship Channel Tour on Sam Houston Tour Boat, Houston, TX Federal Aviation Administration, Terminal Radar Approach Control and Tower, George Bush Intercontinental Airport, Houston, TX U.S. House of Representatives, Transportation Infrastructure Committee, Washington, D.C. Washington Metropolitan Area Transportation Authority, Washington, D.C. Association of American Railroads, Washington, D.C. American Short Line and Regional Railroad Association, Washington, D.C. Federal Aviation Administration, Air Traffic Control System Command Center, Herndon, VA National Transportation Safety Board Academy, Ashburn, VA

iii
International: Port of Rotterdam Authority, World Port Center, Rotterdam, Holland 598th Transportation Group, Campelle aan den Ijssel, Holland Dutch Inland Shipping Information Agency, Campelle aan den Ijssel, Holland European Union, European Commission, Directorate for Mobility and Transport, Brussels, Belgium Dutch Customs, Port of Rotterdam, Holland Maasvlatke 2, Port of Rotterdam, Holland APM Terminal, Port of Rotterdam, Holland European Container Terminal, Port of Rotterdam, Holland Flower Auction Flora Holland, Aalsmeer, Holland Heineken Nederland Supply, Zoeterwoude, Holland Van der Vlist Special Trucking, Groot Ammers, Holland Normandy Beaches and D-Day Memorial Visit, Normandy, France Union Internationale des Chemins de Fer, Paris, France French Ministry of Transport, Paris, France Central European Pipeline Management Agency, Versailles, France British Airways, London, England National Air Traffic Services, London, England Transport for London, London, England London Underground Network Operations Center, London, England
1
INTRODUCTION Throughout history, a society’s ability to transport goods and people has been a key driver in success or failure to achieve prosperity and security. “Transportation is a great enabler of economic growth, the lifeblood of commerce. It moves people to jobs and goods to the marketplace. Without strong transportation arteries, economies stagnate.”1 The rise and fall of empires have been largely the result of a society’s ability to improve diplomatic outcomes through the use of its military to secure land, sea, and air lines of supply during times of conflict. Information is also moved by the transportation system. In ancient times, runners and couriers delivered critical information to their leaders. Today, mail, electronics, and written materials are moved by nearly every mode of transport. As such, it is readily apparent that transportation capability is vital to the diplomatic, information, economic, and military instruments of power. The capability and capacity of transportation is largely defined by its supporting infrastructure. For example, the Romans thrived for centuries due in no small part to their development of roads, bridges, and waterways to reliably move goods and people throughout the empire. In fact, much of the current transportation infrastructure in Europe still uses the foundation established by the Romans.2 This is also noted by Paul Collier, renowned economist and author of The Bottom Billion: Why the Poorest Countries Are Failing and What Can Be Done About It. He states that a lack of transportation infrastructure is a major contributor to the failures of emerging poor economies, especially those in a landlocked nation, to integrate into and reap the benefits of the global economy.3 The United States’ (U.S.) transportation infrastructure is comprised of the Eisenhower interstate highway system; modern major airports and air traffic control systems; networks of pipelines; a multitude of passenger and freight rail systems; and waterways ranging from rivers and canals to deep water ports. This vast system was a key enabler to economic growth and enhanced national security in the latter half of the 20th Century. According to the U.S. Department of Transportation (DOT); the nation’s current infrastructure consists of more than “4 million miles of roads, … 600,000 bridges, 26,000 miles of commercially navigable waterways, 11,000 miles of transit lines, 500 train stations, 300 ports, and 19,000 airports.”4 This infrastructure also includes more than 140,000 miles of track, and 563 freight railroads,5 as well as 200,000-plus miles of pipeline.6 In 2009, the transportation industry contributed 9.5% to U.S. Gross Domestic Product (GDP) and employed 9.7% of the American workforce.7 However, the infrastructure is too old, congested, under-funded, and inefficient to achieve our desired level of national security and prosperity in the future. These limitations will be illustrated by analyzing the transportation industry using a Structure-Conduct-Performance (SCP) methodology based primarily on the Five Forces model developed by Harvard Professor Michael E. Porter. Challenges to maintaining, sustaining, and modernizing the nation’s transportation infrastructure will be examined with supporting essays providing illustrative examples of these difficulties. Then, the strategic outlook for this industry will be discussed with focus on the ability of the nation’s transportation infrastructure to promote U.S. national security objectives. Finally, recommendations are offered to improve this industry’s ability to support U.S. objectives and improve strategic outcomes for the foreseeable future. First, the U.S. transportation industry will be defined to establish the scope and bounds of this industry study.

2
THE INDUSTRY DEFINED
What is our nation’s transportation industry? For this study, the U.S. transportation industry consists of five primary modes of transportation: aviation, maritime, highway, rail, and pipeline. Additionally, third party logistics (3PL) companies strive to improve business efficiencies via inter-modal transportation coordination. Today, pipeline and 3PL companies focus solely on delivery of goods, while the other four modes transport both goods and people. For passenger transportation in the U.S., travel in private vehicles accounts for 88% of all person miles of travel (PMT); air travel accounts for 8% of PMT, while transit including buses and commuter trains account for 1%.8 Amtrak, the sole provider of domestic intercity rail transport,9 and the maritime sector account for the remainder of passenger transport. Many passenger trips are inter-modal; i.e., drive to the local airport, fly to the airport near the destination, and drive to final destination; but clearly passenger travel heavily favors the roads. Freight is a different matter. “U.S. seaports handle 95% of overseas trade by weight and 75% by value.”10 In fact, 88% of freight leaves the ports primarily by trucks and secondarily by rail while only 2% of freight is moved via water.11 The trucking sector is comprised of “more than 600,000 interstate motor carriers and hauls nearly every consumer good at some point in the supply chain.”12 Interestingly, both trucking and the Class I freight railroads transport 70% of all freight in the U.S.13 14 Additionally, railroads haul over 40% of all intercity freight in the U.S.15 Conversely, aviation accounts for a fairly low percentage of freight movement, making up 4.1% of the domestic commercial aviation market.16 United Parcel Service (UPS) and Federal Express (FedEx) control 92% of the nation’s courier earnings; and IBISWorld’s 2010 Courier Industry Report states, “[A]lthough there are over 8,000 establishments operating, the courier industry is really a tale of two companies: FedEx and UPS.”17 The pipeline network reliably, safely, efficiently, and economically delivers goods, primarily the nation's natural gas, crude oil and refined products such as gasoline, jet fuel, and home heating oil.18 In many cases, freight from aviation, couriers, and pipeline are transferred to other modes for delivery to the customer. These statistics imply that freight typically travels through multiple modes of transportation. These inter-modal supply chains are increasingly coordinated by 3PL companies. Finally, the industry is regulated and partially funded at the federal, state, and local levels, with the levels of regulation and funding varying from one mode to the next. Public-private partnership in terms of ownership and responsibility for the nation’s transportation infrastructure varies significantly from mode to mode. State and local governments own approximately 98% of the nation’s bridges, 97% of the nation’s roads and highways with local governments owning 77% of roadway miles.19 Similarly, the Federal Aviation Administration has responsibility for the nation’s air space and aviation infrastructure.20 Conversely, the U.S. freight railroad firms own nearly the entire rail network, 94,000 miles of which is held by the seven Class I rail companies.21 The national pipeline infrastructure represents a $31 billion investment that is mainly privately owned.22 One notable observation is that the most equitable sharing of public-private responsibility is in the maritime mode, where federal, state, local, and industry representatives share responsibility and ownership of ports such as the Port Authority of New York and New Jersey and the Port of Houston.
3
CURRENT CONDITION What is the current state of the transportation industry in the U.S.? Within the scope of the industry as defined for this study, Porter’s Five Forces model forms the basis for a SCP analysis. The five forces used by this model are: “the threat of new entrants, the bargaining power of suppliers, the bargaining power of buyers, the threat of substitutes, and rivalry among existing competitors.”23 Porter’s model examines the effects of these forces in determining the competitive structure, firm behavior, and financial performance of this industry. In an era of industry-wide deregulation, the U.S. transportation industry is still heavily regulated. At the federal government level, regulations from DOT, the Department of Homeland Security (DHS), and the Environmental Protection Agency (EPA), among others are key drivers of Porter’s forces.24 State and local governments also impose a myriad of regulations for transportation in their regions. However, some regulations’ benefit to society is questionable when proper cost-benefit analyses are conducted. A recent university assessment showed that the cost of the Federal Air Marshal Service and the cost of hardening cockpit doors on commercial aircraft were $180 million and $0.8 million per life saved, respectively.25 When compared to society’s “willingness to pay” of $1-10 million per life saved, it becomes evident that the economic cost of the Federal Air Marshal Service is not consistent with its benefit to society.26 Thus, while regulations are intended to enhance public safety and security, they increasingly impel costs upward for the industry. Regulation driving transportation costs is not unique to the U.S. Transportation costs in Europe are affected by regulations from the European Union, each nation, and the localities and cities through which goods and people are transported. How do these regulations impact costs and Porter’s forces? To operate a commercial transportation company in the U.S., mode specific equipment such as trucks, aircraft, ships, and trains; infrastructure such as airports, highways, seaports, railroads, and pipelines; and labor such as operators, maintainers, and security personnel are required. All three of these fundamental assets must be certified as compliant with all applicable regulations. To illustrate this, commercial aviation is analyzed via Porter’s model in detail. Aircraft must be designed and tested in accordance with federal standards.27 Similarly, facilities such as hangars, airports, and runways must meet regulatory guidelines.28 Finally, operators and maintainers must meet stringent requirements for training and operations.29 Substantial capital is required to pay for these fully certified and compliant assets. When coupled with tightening credit markets as a result of the global financial crisis and strong unions representing a highly skilled but limited labor pool, the availability of capital is a significant barrier to entry and the power of money and labor suppliers is high.30 These are the primary effects of regulation on the aviation sector. Beyond regulation, several other important factors contribute to the Porter model. First, the behavior of incumbents toward new entrants is a significant barrier to entry. Existing airlines have established access to routes and airports in current hub and spoke networks; developed global alliances; and demonstrated sound safety records.31 They couple these with aggressive price competition to discourage entry by start-ups.32 Next, volatility in the oil and fuel market creates fluctuating operating expenses that erode profits and weaken firm performance.33 This implies that the power of fuel suppliers along with money and labor suppliers is high. Finally, leisure travelers make up over two thirds of the customer base with business travelers as the remainder.34 The commercial aviation sector has dozens of firms globally offering essentially the same service i.e. flying safely from one destination to another on regular schedules and routes.35 While it can be argued that product differentiation occurs in terms of
4
offering premium and economy seating, mileage programs, or ala carte pricing for food, drinks, and baggage; this is not a significant means of competition in the industry.36 The customer base makes decisions based on the price of airfare rather than the availability of substitutes,37 like car, bus, or rail, as well as using communication technologies to conduct business.38 Realistically, the threat of these alternatives to air travel is relatively low and usually limited to travel within a few hundred miles.39 The minimal threat of substitutes combined with customer acceptance of current airfare structures and ala carte pricing used by many airlines to cut operating expenses indicates the bargaining power of buyers is relatively low. The examination of Porter’s forces on this sector through the SCP methodology reveals the current state of commercial aviation. The aggressive nature of price competition is manifested in the form of price wars within a mode where there is little product differentiation. This conduct resulted in Delta Airlines, American Airlines, United Airlines, and Southwest Airlines controlling over 40% of the domestic market.40 Additionally, international alliances facilitated by DOT grants of anti-trust immunity are designed to break down barriers to globalization and enable commerce.41 Subsequently, over 50% of control of the international market is held by Delta Airlines, American Airlines, United Airlines, and Continental Airlines.42 Only Southwest Airlines has made a profit every year since 2004.43 Most of the others have either undergone or flirted with bankruptcy during that same time.44 Ongoing buyouts and mergers continue to reduce the number of airlines. With a four firm concentration ratio of over 40%, the aviation industry is considered to be structured as an oligopoly.45 Applying this same SCP methodology to the entire transportation industry reveals some significant differences among the sectors. First, the passenger rail industry is generally not profitable and consequently is heavily subsidized by local, regional, state, and federal governments.46 These subsidies cover infrastructure, vehicles, and operating expenses, obscuring the true cost of passenger rail transport.47 Despite these subsidies, fare prices are relatively high compared to suitable substitutes such as buses and automobiles.48 The choice to use commuter rail systems is often based on the availability of fare subsidies and/or heightened environmental awareness.49 Commuter rail passengers are transported over a network of more than 20 rail systems serving 25 major metropolitan areas. However, these systems are not connected, which essentially creates a series of local monopolies. An exception to the norm is New York City’s extensive commuter rail system linking Connecticut, New Jersey, Pennsylvania, New York and Delaware.
Additionally, Amtrak is the only intercity passenger rail carrier and, by definition, a monopoly. It operates 310 trains daily on a 21,000-mile system paying user fees to freight railroads for use of their rights of way and supported by legislated priority over freight rail during transport. Amtrak competes with express bus and private automobiles on the shorter routes and with the commercial aviation on longer routes. Differentiation is based on amenities and comfort. For long routes, Amtrak advertises the experience, reduces hassles, and targets populations who have time to spend enjoying the trip. Overall usage has steadily increased over the past few years peaking at 28.7 million riders in 2008. In 2009, revenues were $2.3 billion; but with the exception of the Acela train, Amtrak currently runs a deficit of $10-95 per passenger on short distance runs and is reliant on federal government subsidies to fund operations.50 Conversely, Class I freight rail firms are a marginally profitable geographic duopoly that operate in cooperative competition or “coop-etition”. This allows them to share equipment, exchange loads inter-regionally and share track/rights of way intra-regionally.51 Coop-etition also extends to certain firms in the highway mode. Each Class I firm essentially acts as a 3PL

5
company by contracting with large trucking firms to haul freight the “last mile” to consumers. Freight rail has put a great deal of emphasis into shortening transit time and achieving similar reliability to trucks on routes as short as 600-750 miles while offering better tariffs.52 Within the two main geographic regions, Eastern U.S. and Western U.S., Class I rail firms differentiate based on service, contract pricing, and locations of inter-modal hubs.53 Some have also added overseas offices to support international 3PL/supply chain linkages.54 Next, 3PL companies and the trucking sector are on the perfectly competitive end of the business spectrum. The 3PL companies have virtually no barriers to entry as they are essentially service companies and don’t require substantial capital investment to operate within the industry.55 Entry barriers in the trucking industry are a little higher due to the capital requirement to lease or own a truck. However, compared to the aviation, rail, maritime, and pipeline modes, this capital expenditure is much lower. The 3PL companies essentially compete with each other because they operate across multiple modes of transportation.56 The trucking sector competes with rail, pipeline, aviation, and maritime for business. Escalating fuel costs have significantly diminished profitability of trucking firms, but have less effect on 3PL firms because they can utilize more fuel efficient modes of transported if warranted by required delivery dates.57 The maritime mode is considered the most energy efficient and reliable mode of transportation.58 However, barriers to entry are high due to the capital needed to fund the procurement, maintenance, and operation of cargo ships and ocean liners, as well as high port entry fees across the U.S.59 Additionally, protectionist legislation such as the Jones Act creates regulatory barriers to entry because of the requirement to use more expensive U.S. built and flagged ships and U.S. crews for intra-U.S. shipping.60 Most international freight enters the U.S. at our ports but only 2% travels domestically via water. Taking Europe as a whole, the situation is very similar with 3% of all freight moving via water,61 though Holland moves 46% of its goods via inland waterways.62 The U.S. shipping sector is structured as a group of regional oligopolies, while each port essentially functions as a local monopoly. The U.S. pipeline sector is moderately profitable and has a four-firm concentration ratio of 49.2% and therefore, can be considered an oligopoly.63 Once in place, little rivalry exists on a national level, though some competition is seen on a regional basis. Liquid pipelines transport more than 17% of ton-miles of freight moved in America, yet pipelines only account for 2 % of the country's freight bill.64 Just 2 to 5 cents of the cost of a gallon of gas to an end-user can be attributed to pipeline transportation, resulting in a low and predictable price for the customer.65 Pipeline companies generally do not own the products they are transporting. They simply act as intermediaries moving the product from the producers and shippers to the marketplace.66 Pipelines are not the only way to move petroleum; but compared to the highway, maritime, and rail modes, they are much more cost effective. Pipelines are, by far, America's most important petroleum distribution network, including crude oil, refined fuel and raw materials.67 The results of this SCP analysis show that the transportation industry is generally not profitable. Several modes rely on government subsidies to fund equipment, infrastructure, and operations which skews the true costs of transportation. Additionally, many modes compete with each other, which is indicative of the need to optimize and modally balance the U.S. transportation system for future economic growth and national security needs. Finally, the costs of government regulation, combined with the variance in public-private ownership/responsibility for the aging infrastructure, are clear signs that this industry is not well positioned to support economic growth and national security objectives in the future. This deficiency will be examined in more detail in the next section.
6
CHALLENGES/OUTLOOK What has happened to the U.S. transportation system in the 21st century? Far from being a key enabler of national security and economic growth, the transportation infrastructure is becoming a detriment. It is deteriorating faster than the nation can affordably refurbish and modernize it. The American population is projected to reach 420 million by 2050, and increasingly migrate into urban and suburban areas; thus, balancing the movement of people through high density mega-regions will become more challenging in the future.68 In the case of the rail mode, with the exception of government subsidies for Amtrak and commuter rail, the government has provided almost no funding for rail infrastructure until recently. The Obama Administration authorized $8 billion of American Recovery and Reinvestment Act funds for maintenance and development of rail projects throughout the country primarily focused on development of high speed passenger rail.69 This is a pittance compared to the $420 billion spent by the freight rail industry between 1980 and 2007 to improve or expand existing rail lines and maintain or upgrade equipment.70 The American Society of Civil Engineers (ASCE) gave U.S. rail infrastructure a “C-” in 2009.71 Their findings note concerns with bottlenecks and suggest that the fuel efficiency of the rail mode and diminished capacity of the highway mode will drive increased demand for freight and passenger service.72 Additionally, ASCE estimates costs of expanding rail infrastructure to meet the projected needs in 2035 at $200 billion.73 Today, Chicago is infamous for rail congestion with nearly 38,000 freight cars a day converging there, and it is expected that number will grow to 67,000 cars a day in the next twenty years.74 In Chicago, rail lines from the East and West have inadequate means to connect with each other. One option for getting freight through Chicago requires unloading containers and trucking them across town to reload them on another train, a two day trip at times.75 Another option is to snake rail cars through a maze of rail yards at an average speed of 9 miles per hour to connect with a train on the other side of the city. This can take up to 36 hours and is tremendously inefficient compared to the 55 hours for the roughly 2,000 mile rail trip from Los Angeles to Chicago.76 Congestion notwithstanding, railway safety is a major concern especially with the emphasis on high speed passenger systems. If properly funded and managed, one solution to improve safety and potentially alleviate some rail congestion is a technological innovation called Positive Train Control (PTC). PTC will be examined in more detail with a supporting essay. The highway transportation system is not in much better condition than rail and is heavily congested. “There is an enormous gap between available resources and the investment needs necessary to modernize our national surface transportation systems to meet the challenges of the 21st century.”77 Highway infrastructure projects receive as much as 80% of their monies through the Highway Trust Fund (HTF), which is funded by the gas tax, various excise taxes, and user fees. However, the current global economic crisis, coupled with rising gas prices, caused these revenue streams to drop precipitously, ultimately jeopardizing current and future highway infrastructure. “From January to September 2008, drivers drove 3.5% less compared to the same period in 2007 as gas prices rose from $3.02 to $3.71. Fewer miles driven led to fewer gallons of gas purchased resulting in a decline in gas tax revenue of $530 million.”78 Originally intended to be dedicated solely to funding highway projects, legislation passed over the years has broadened the use of the HTF to include non-transportation projects. The Federal Highway Administration, State Highway Administrations, and the ASCE, among others, agree that the nation’s highway, bridge, and tunnel infrastructure is in a state of
7
general decline. A recent and vivid example of this occurred on August 1, 2007, when an eight lane steel truss arch bridge officially known as Bridge 9340 spanning the Mississippi River on I-35W near Minneapolis, Minnesota and loaded with slow moving rush hour traffic collapsed into the river 115 feet below trapping roughly 100 vehicles in the wreckage resulting in 13 fatalities.79 The subsequent National Transportation Safety Board (NTSB) investigation determined that the primary cause of the disaster was undersized gussets supporting the weight of the original bridge, plus two extra inches of pavement and the unfortunate placement of 289 tons of construction equipment and material on the weakest point. Additionally, inspections were lacking that could have discovered these problems.80 A tragedy by any measure, this disaster is emblematic of a looming crisis in highway infrastructure that the U.S. must face now and in the years to come. Chronic increases in fuel prices, traffic congestion, and the recent global recession have significantly plagued the commercial aviation sector. The cost of fuel erodes financial performance, and, consequently, several commercial aviation firms have sought bankruptcy protection. Most have emerged from bankruptcy having shed pension plans. Cuts in wages and other benefits for their employees also make it difficult to attract qualified employees. Commercial aviation experts throughout government and industry agree that congestion is the most serious problem facing air transport today.81 Congestion increases operating costs by increasing fuel consumption due to system wide delays, creating additional time on the ground or in the air while waiting to take off or land, respectively.82 In 2007, the 20 airlines operating in the 32 busiest airports reported a 73.3% on time performance which was the second worst in history.83 Notably, 96% of delays occurred at 22 airports with 37% focused on LaGuardia, John F. Kennedy, and Newark airports.84 Contrary to popular belief, only 1% of delays were weather related. It is not uncommon for a delay in the New York City area to cascade delays throughout the system.85 Despite the fact that airlines reduced global capacity by 7% from 2008-2009, due largely to prevailing economic conditions, congestion did not ease.86 Aviation industry experts anticipate a steady growth in usage of commercial aviation consistent with anticipated economic growth of 2-3% GDP annually.87 The FAA has a goal of tripling system capacity by 2025 to accommodate this growth.88 Aviation infrastructure projects are resourced via FAA managed Airport Improvement Program (AIP) funds.89 Money from various user fees and taxes contained within the Airport and Airway Trust Fund finances the grants that typically provide 75-95% of the monies for infrastructure improvements.90 From 2009-2013, estimates of funding required to meet all domestic aviation infrastructure needs range from $49.7 to $87.4 billion.91 92 However, the global recession has reduced AIP funds, which will delay infrastructure improvements. New security measures imposed by the federal government in the wake of the attacks of September 11, 2001 (9/11) impact our transportation infrastructure. DHS was established to integrate efforts of the federal, state, and local governments to protect it from future attacks. DHS funding and emphasis has been primarily aimed at America’s airports, which is where they are most visible to the American public. In February 2002, the responsibility of passenger screening at all U.S. commercial airports was turned over to the new Transportation Security Administration (TSA). TSA hired new personnel using incentives such as increased wages and offering benefits to trained security screeners from private firms to increase the efficiency of airport security. They substantially increased training hours for both passenger and baggage screening operators. Enhanced airport security measures impose additional time and effort on the part of passengers, and in many cases security screening processes contribute to airport
8
delays and congestion. The events of 9/11 also drove programs such as the Transportation Worker Identification Credential (TWIC) to control access to our transportation infrastructure. In spite of all of this effort, unbalanced funding and emphasis across the modes have left gaps in this security network. For example, small vessels or watercraft used for recreational or commercial purposes that are less than 300 gross tons are potential threats to high-value targets, such as, liquid natural gas, petroleum, freight containers, ferries, crowded bridges, or airports. Attacks on these targets could disrupt the global economy in addition to breaching security.93 A 2006 estimate showed that a “one-week halt in the flow of cargo containers into one of America’s largest ports would cost the U.S. economy anywhere from $65 - $150 million a day.”94 A key outcome of the June 2007 Small Vessel Security Summit hosted by DHS was a move toward public-private partnership in resolving this complex and costly maritime security issue. The effects of globalization have also reshaped the maritime mode. Protectionist legislation like the Jones Act is designed to foster a strong domestic maritime industry that can mobilize rapidly in time of war or national emergency and to protect American sovereignty over domestic maritime commerce. Instead, it led to the deterioration of the U.S. Merchant Marine it was designed to protect.95 In 1960, the U.S.-flagged merchant marine fleet consisted of 2,926 ships with a capacity of 21,877,000 deadweight tons (DWT) representing 16.9% of the world's fleet.96 As of December 2007, this fleet consisted of 189 ships totaling 8,593,243 DWT representing 0.7% of the world’s fleet.97 Currently, the high quality of the 500-600 annual graduates from the seven U.S. Maritime Academies makes them a highly valuable labor source for global shipping.98 This drains the U.S. labor force of already scarce Merchant Mariners. These declining trends inhibit our ability to realize the full transportation potential of domestic waterway shipping. Yet, one method called Short Sea Shipping, which will be explored in more depth with a supporting essay shows promise for better utilization of our domestic waterways. In recent years, natural disasters ranging from storms to earthquakes have interrupted and destroyed some of our infrastructure. A key example is U.S. pipeline infrastructure in the Gulf of Mexico. Hurricanes can disrupt the offshore flow of crude oil from the Gulf of Mexico, as well as the onshore control facilities. Additionally, man-made disasters like the 2010 British Petroleum oil rig explosion off of the Louisiana coast create environmental and political problems and potentially increase congestion of other modes like rail and highway as they try to pick up the slack. Replacing even a modest-sized pipeline carrying 150,000 barrels per day would require 750 tanker trucks delivering a load every two minutes around the clock or a train with 75 tanker cars carrying 2,000 barrels each to arrive and be unloaded every day.99 A recent and unique natural disaster that grounded aviation is the current volcanic activity in Iceland. This shut down European airspace for about a week, costing the aviation sector roughly $1.7 billion.100 Finally, the unbalanced efforts of the federal government to fund transportation infrastructure have led to a morass of disjointed efforts. This is likely to worsen as the nation’s transportation infrastructure will be severely impacted by government spending on entitlements such as Social Security and Medicare along with servicing interest on the National Debt and other higher priority discretionary spending for national defense and homeland security. Yet, ideas such as the North American Free Trade Agreement (NAFTA) Super Highway, which will be explored in a third supporting essay, give cause for optimism because it shows the art of the possible by investing in inter-modal trade routes as a means to achieve economic growth and national security in the future.
9
GOVERNMENT GOALS AND ROLES As previously discussed, the transportation system is the lifeblood of commerce, and transportation infrastructure is the foundation of the system. Improving economic growth is crucial to achieving national security objectives. Transportation infrastructure impacts literally everything we consume and facilitates the movement of people and goods in the event of national emergencies. The Europeans have acknowledged this by developing a transportation strategy for the European Union to guide future projects. Similarly and more pointedly, the U.S. should develop a national transportation strategy aligned with the national security strategy. The transportation strategy would give guidance to optimize the transportation system, provide surge capacity to support national emergencies, and guide policy and plans that support national security objectives. This strategy should be under the control of the Department of Transportation coordinating with all other federal, state, and local government transportation agencies, as well as, appropriate transportation industry representatives. To resource the strategy, a non-discretionary transportation infrastructure trust fund should be established. This would be financed by revenues from taxes and fees based on actual usage rates and economic conditions such as changes in fuel prices. The ability to use these monies by state and local governments would be contingent on spending the allocations on projects that are aligned with the national transportation strategy. The strategy would be further supported by private funding from the transportation industry and other corporate beneficiaries of the system. However, this would not preclude state and local governments along with the private sector from using other funds on projects that are in their interest but not in conflict with the national strategy should they elect to do so. In recognition of the fact that transportation infrastructure is too costly for the government alone to modernize, maintain, and sustain, the federal government should establish a formal policy of public-private responsibility and investment in transportation infrastructure should be instituted. While some may feel that this is contrary to an allegedly inherently governmental function to develop and maintain this infrastructure, the fact is that the U.S. is already ceding responsibility for this infrastructure in part or in total to the private sector. Rail and pipeline infrastructure are almost completely owned by the private sector versus aviation facilities and highways which are primarily owned by the public sector. Establishing a formal policy would provide not only recognition of shared responsibility but also the requirement for shared accountability and transparency. Both the Europeans and Japanese are already investigating public-private financing opportunities for high speed rail expansion.101 Finally, the federal government should establish a process that aligns available resources with desired outcomes. This would involve comprehensive analyses incorporating both private and public sector input on infrastructure needs. Furthermore, this process would include a prioritization effort to align funded infrastructure initiatives with national security objectives. This process would mitigate the risk of unsynchronized transportation infrastructure efforts and maximize the benefit to society of the available funds. These recommendations are designed to provide a robust transportation infrastructure in an economic environment that is projected to be constrained to 2-3% growth in GDP for the foreseeable future and severely constrained in terms of government funding due to growth in entitlement spending and interest payments on the national debt. Containing these limited government funds in a non-discretionary fund provides dedicated money and enough flexibility to use them across all modes of transportation. This also breaks down existing
10
monetary and Congressional stovepipes, which can lead to greater focus on efficiencies from inter-modal transportation.
CONCLUSION In summary, with four million miles of roads, 600,000 bridges, 26,000 miles of commercially navigable waterways, 11,000 miles of transit lines, 500 train stations, 300 ports, and 19,000 airports, 140,000 miles of track, 563 freight railroads, and more than 200,000 miles of pipeline, U.S. transportation infrastructure is gargantuan in scope and intricate in complexity. In 2009, the transportation industry contributed 9.5% to U.S. GDP and employed 9.7% of the American workforce, showing its value to economic vitality and national security. However, the infrastructure is too old, congested, under-funded, and inefficient to achieve the necessary level of national security in the future. The industry is comprised of 3PL companies along with five transportation modes: air, highway, maritime, rail, and pipeline. This industry is vital to the movement of goods and people to markets and literally touches everything we consume. The industry is heavily regulated in spite of the fact that this is considered an era of deregulation, and it’s largely dependent on the global economy especially consumer spending. The industry as a whole is highly competitive in spite of the fact that different modes have evolved into competitive structures ranging from monopolies to perfect competition. However, industry performance is not robust with many firms on the brink of bankruptcy. Government funding and focus are lacking for infrastructure initiatives limiting our nation’s ability to optimize and surge transportation networks. Congestion is rampant in the rail, air, and highway modes which erodes firm financial performance. Increased security requirements have created additional private and public sector financial burdens since the attacks of September 11, 2001. Protectionist legislation is diminishing the U.S. Merchant Marine fleet, and limiting the use of our domestic waterways to transport goods via short sea shipping routes. Natural and man-made disasters along with crumbling infrastructure create costly disturbances in the global economy. The infrastructure bills are enormous, and anticipated low levels of U.S. economic growth combined with competition for government resources especially entitlement programs and interest on the national debt make it clear that the government cannot manage the infrastructure alone. Four recommendations that can enhance our ability to meet national security objectives in the future are offered. First, developing a national transportation strategy aligned with the national security strategy from which policies and plans can be developed will improve strategic outcomes. Second, establishing a non-discretionary transportation infrastructure trust fund will provide the ability to fund initiatives. Then, establishing a formal government policy of public-private partnership for transportation infrastructure will provide shared responsibility and commensurate accountability and transparency. Finally, establishing a process to align available resources with desired outcomes and prioritize efforts will ensure that society receives the maximum benefit from the nation’s transportation system. These strategic recommendations provide a framework for ensuring a robust and vibrant economy and enhancing national security in a world that is certain to be increasingly volatile, uncertain, complex, and ambiguous in the future.

11
ESSAYS ON MAJOR ISSUES Essay 1: The Legislative Mandate for Positive Train Control The Rail Safety Improvement Act of 2008 (RSIA), (PL 110-432)102 culminated almost 40 years of regulatory and industry activity aimed at making passenger and freight rail safer via positive train control (PTC).103 Its provisions cover rail lines used to haul toxic inhalation hazard (TIH) chemicals as well as those carrying passengers throughout the United States (U.S.). RSIA compliance places an undue burden on Class I freight firms. The Act has created a huge unfunded mandate and its short implementation period adds further cost while reducing future benefits. Concurrently, shippers are lobbying the Surface Transportation Board (STB) to institute price controls on TIH movement as a monopoly protection. These factors have the potential to damage the rail industry such that it does not have the capacity or capability to support expanding commerce and national security in the coming years. They may also undercut the potential for transformational operations management change within the industry.
History and Challenges for PTC An automated mechanism to avoid collisions has been considered by various federal agencies over the years. The National Transportation Safety Board (NTSB) highlighted the importance of PTC by placing it on its inaugural NTSB Most Wanted Transportation Safety Improvements list in 1990.104 However, subsequent studies by the Federal Railroad Administration (FRA) and rail industry groups consistently found the costs of PTC implementation far outweighed the benefits. The tipping point to enact PTC legislation came with the 12 September 2008 Chatsworth, California incident which killed 20 and injured hundreds. Less than three weeks later, the RSIA was signed into law by President Bush. PTC installation is a massive undertaking involving 20 commuter railroads, Amtrak, and the seven Class I freight rail companies.105 The FRA ruling mandates fully interoperable PTC on every line carrying TIH or passenger traffic as of December 2008.106 Because 70-80% of the Class I rail systems carry TIH and also support the vast majority of Amtrak routes outside of the Northeast Corridor, approximately 80,000 miles of track must be outfitted with the highly complex system.107 PTC systems use artificial intelligence (AI) and “involve robust, predictive technology.” The system generates uninterrupted data feeds to and from trains. It monitors malfunctions and operators’ actions, tracks locations of work crews and other moving equipment, and can remotely adjust speed and breaking to prevent derailments and crashes.
108
Moving PTC from the test bed to full use on Class I rail “presents formidable challenges….”109 Over the last two decades, public and private funds totaling in the hundreds of millions have been invested in research and development110 yet have not produced a complete capability. FRA research reports that the components of PTC are an “emerging technology…[and] much more developmental testing is needed.”111 For example, Class I railways plan to use a 220/221 MHz radio frequency112 for PRC communications. At present, there is no source of production for mobile or fixed antennas which prevent interference from the locomotive,113 and tower placement methodology is immature. RSIA requires complete installation of PTC by all host carriers before 31 December 2015. So, the main challenge is morphing promising technology into proven technology with highly advanced capabilities in less than five years.

12
The complexity and ubiquity of PTC system elements necessitate large financial outlays for the rail industry because rail infrastructure is privately owned by these firms. FRA estimates the cost of PTC installation at $10 to $13 billion over 20 years.114 Funding this capital expense will require diverting monies from infrastructure repair and upgrades that support future expanded capacity. The Class I carriers’ initial outlay of funds for PTC is expected to top $5 billion. That amount equates to the total annual capital expenditure budgets of the four largest Class I railroads. According to FRA, the cost-benefit analysis carries an inverse relationship of 20:1.115 The industry believes the PTC business case is poor unless it achieves “breakthrough interoperability” plus increased reliability, capacity, and safety.116 Industry advocate the American Association of Railroads (AAR) reports that 1% of rail accidents in 2008 could have been prevented by PTC.117 Conversely, PTC proponents frame the safety equation differently averring that accidents would be reduced 100-fold.118
Figure 1: Notional Architecture for Basic PTC System119 Source: FRA, North American Joint PTC Project
Competing Priorities in Rail Infrastructure PTC installation represents a major capital and infrastructure investment by the railroads. It will absorb nearly 20% of the total dollars normally allocated for upgrades and repairs over the next five years. This will divert funds which could be spent on other safety measures such as electronically controlled pneumatic brakes or improvements designed to expand line capacity. The American Society of Civil Engineers (ASCE) gave U.S. rail infrastructure a “C-” on their 2009 Report Card.120 Their findings note concerns with bottlenecks and suggest that the fuel efficiency of the rail mode and diminished capacity of the highway mode will drive increased demand for freight and passenger service.121 The cost of expanding rail infrastructure to meet the projected needs in 2035 is estimated at $200 billion.122 The Class I railroads do not have the wherewithal to independently fund this expansion on top of PTC.
13
How to Realize the Full Benefit of PTC
A robust command, control, communication, and information architecture for PTC can initiate transformational change of business operations for freight. When designed as a system of systems instead of being applied as an add-on, PTC can be much more than the next generation of signal controls. Up to 29 automated systems can be networked as part of a total PTC endeavor linking every aspect of infrastructure, equipment, personnel, customer, and operations activity.123 Data archived by this mega-system permit complex computer modeling and can result in optimal train configurations for speed, fuel efficiency, and capacity while reducing stress on equipment, monitoring its health, and producing total in-transit visibility of shipments.124 Unfortunately, the PTC regulatory timeline is so short that basic compliance may consume all resources available. Recommendations to Improve National Security Impacts of PTC and Outlook for Success
High value military cargo (e.g., rocket engines) and deployment materiel can be delivered safely and more quickly using PTC equipped rail systems. Its enhanced route planning adapts for oversize and overweight cargo, load monitoring tracks stability while AI algorithms constantly address speed and braking requirements, and the Differential Global Positioning System (DGPS) feeds give customers up-to-date information on scheduled delivery. Railroads choosing to network other computerized systems with PTC can gain geometric improvements in security. All rail cars and locomotives are equipped with automatic equipment identification tags (AEI).125 Combining consist and AEI data along with wayside sensors and DGPS gives location of critical cargo with accuracy to less than a meter. Adding a crew registration system using biometric keys further assures only authorized personnel are operating moving stock or track equipment.126 Since PTC alerts on variations from route schedules, there would be near instantaneous alarms should someone attempt to commandeer a train and over-speeding is prevented. Finally, full integration of systems offers increased agility and surge capacity for railroads guaranteeing timely handling of mobilization goods while concurrently carrying on business supporting the defense industrial complex. In its current form, the PTC mandate is unlikely to have the desired payoffs of increased rail capacity, total operational effectiveness, support for national security, and safety. Its complexity, magnitude, cost, and abbreviated timeline present daunting challenges to the industry. These barriers may preempt the efforts of farsighted railroaders who see the potential which can be unleashed by creating an integrated mega-system. Rather than hurrying installation and employing immature technology that hampers functionality, a more measured response is preferable. The risk matrix used by FRA to assess Class II line waivers could be adapted to aid in prioritizing lines for early PTC installation thus addressing those lines with the greatest risk to public safety. In addition, it is essential that the regulatory environment stabilize such that firms can make long range capital plans. Government support of limited financial incentives can also build momentum in the competitive market to launch a true transformation for railroading.
- Barbara Jefts, Col, USAF, NC
14
Essay 2: Short Sea Shipping America’s economy depends on complex, integrated supply chains reliant on the efficient transport of both freight and people.127 Transportation system’s are under duress and expected to reach crisis levels in many regions. Stressed by increasing demands, congestion, rising fuel costs, environmental concerns and neglected infrastructures American needs to take deliberate actions to enhance our freight transportation capacity. Enhancing transportation is not only expanding roads, rails, ports and infrastructures but also optimally integrating all modes to maximize available natural and capital resources.128 America must act to use all available resources, including underutilized coastlines, for freight movement.
Freight Transportation Efficiency Issues
The U.S. transportation system moves about 60 million tons of freight daily with a value of 40 billion dollars.129 Most freight enters through U.S. maritime ports with 60% of containers entering through only five ports.130 Port freight continues to increase, and a recent U.S. Chamber of Commerce study predicts freight volume will double by 2035.131 Clearly, freight movement is increasing rapidly, but transportation systems at these ports are faltering due to existing infrastructure capacity, congestion, environmental and energy efficiency issues. While maritime transportation dominates our imports and exports, domestic freight is rarely moved on water. China transports 61% and Holland 46% of their freight over their waterways.132 America moves only 2% of domestic goods over water with 88% of freight leaving the ports by trucks and rail.133 This translates to 10,500 trucks per day per mile on the U.S. interstate highway system.134 By 2035, the usage of the interstate system will peak at 50,000 trucks per day per mile or one in every four vehicles. The U.S. highway system cannot support this huge demand. One key indicator of transportation’s efficiency is congestion delays. Sixty percent of U.S. highways experience congestion.135 Delays equate to lost productivity. The Department of Transportation (DOT) estimates in 2007 that each truck delay hour costs $102.42.136 Populations continue to increase, and mega-regions along our coasts have developed. One-half of our population is anticipated to live in these areas by 2035.137 The nation’s eight largest container ports are also located in these mega-regions. America continues its focus on environmental emissions and fossil fuel dependency. The DOT ranked rail as the most energy efficient with water a close second. Related are environmental emissions. Freight trucking generates 20% of emissions while water transport only generates 2%.138 Energy and emissions are game-changers for the U.S. transportation modes.
Short Sea Shipping
Short sea shipping can reduce infrastructure demands and emissions while improving energy efficiency. Short sea shipping off loads freight from ocean vessels onto smaller coastal freight vessels bypassing trucks and rail portside. This eliminates the freight congestion on roadways around the congested mega-region port areas. Short sea shipping is optimal for hauls of at least 500 miles and hazardous materials not desired in ground transportation. This demonstrates obvious benefits to shippers and society. One 15-barge tow eliminates 1050

15
tractor-trailers from a highway, moving a ton of goods over 500 miles on 1 gallon of fuel.139 Coastal shipping is energy efficiency, provides environmental benefits, and has the potential to reduce highway congestion. Shippers select transportation methods based on total costs, delivery reliability, and schedules. Short sea shipping studies verify that trucking is the quickest mode however short sea shipping offers total cost benefits. A recent study found short sea shipping has a 35 percent lower cost for a 15-hour longer delivery differential when compared with trucking and this can create a business advantage for the shippers.140
Short Sea Shipping Barriers
Short sea shipping should be used more for domestic transportation, but it is not because of externally imposed barriers prohibiting short sea shipping from fairly competing with the surface modes for freight business. The result is coastal shipping appears overpriced when compared to other already subsidized surface modes. External policies: Maritime transportation is adversely impacted by two externally imposed government policies: the Jones Act and the Harbor Maintenance Tax. The Jones Act adversely affects short sea shipping by forcing the use of higher priced U.S. made vessels and crews. Congress received two proposals to repeal the Jones Act but neither was accepted. The result is that firms entering short sea shipping bear higher startup, capital and operating costs. The Harbor Maintenance Tax applies to all maritime movements. This fee collected on each maritime movement can add one hundred dollars per container to shipping costs.141 The surface modes have no equivalent fee. Over a billion dollars was deposited in the 2009 Treasury from harbor fees while only 43% was awarded to port maintenance projects. Collected fees exceed project levels to the benefit of the U.S. government. Several attempts to reform the Harbor Maintenance Tax Fund were submitted with no progress. Until these externally forced costs are rectified, short sea shipping cannot effectively compete for domestic transportation with the surface modes. Negative public costs: The various transportation modes create different levels of pollution, energy usage, safety incidents and infrastructure demands. Most of the maritime and rail infrastructures are privately owned and factored in their pricing. Trucks pay road fees but do not bare their full highway usage costs. A DOT study found that the government subsidizes these public factors at $1.19 per ton-mile of freight trucking. 142 “Private shippers do not make decisions that account for the full social costs when deciding their freight transportation”.143 American should remove these external differences to promote short sea shipping and fair competition.
16
Policy Recommendations
Federal and state governments should promote short sea shipping by collaborating to remove the imbalanced Harbor Tax, Jones Act burdens and unequal surface mode subsidies in the freight market. Specific government policy actions needed are: 1. Eliminate the Harbor Maintenance Tax on all domestic freight movements along our coastlines. This will eliminate an additional maritime fee that ground transportation does not pay. 2. Subsidize businesses for the additional cost burdens from the Jones Act. Suspending the Jones Act might appear a simpler solution, but this would create secondary maritime industry effects. Coastal companies should bear these costs but the government must create business tax breaks. The Defense Authorization Act of 2010 and recent MARAD efforts are attempts to reduce some of the capital investment. To allow short sea shipping startups sooner, the government should permit foreign vessel usages in the interim if a company is in the process of purchasing a U.S. vessel. Larger companies could be allowed a permanent ratio of Jones and foreign vessels to balance their capital costs and obtain high-speed vessels. 3. Federal and state governments can recoup costs fairly from the modes. The government indirectly subsidizes the modes’ differently. Imposing recoupment fees will be resisted but the costs should be leveled by either a transportation surface fee or additional gas taxes. 4. Low rate, deferred loans with tax benefits can be provided to ports to install efficient lifts, cranes and movement equipment that can quickly load vessels. Efficiency will be important to ensure productivity and maintain profits. Using our coastlines for short sea shipping is the smartest, cheapest and easiest answer to relieving our growing surface transportation issues.144 The Sea Bridge Company illustrates the national short sea shipping potential. Sea Bridge transports cargo between Florida and Texas across the Gulf of Mexico. The coastal route is 600 miles shorter than the highway. One vessel moves 300 truckloads. This saves over 29 million miles annually with a reduction of 4 million gallons of fuel and 750 thousand pounds of emissions at five cents less per mile moved.145 Imagine this efficiency repeated along all our coasts. The government should promote short sea use if we are to meet our growing port freight demands. Enough data exists to make a national coastal freight decision. The U.S. desires reduced congestion, energy usage and pollution. America is geographically blessed with many ports but we do not use our coastlines because of existing government policies. It is logical to move freight from large ships by smaller vessels, keeping long haul containers off the overcrowded roadways. Other countries routinely use their coasts for freight. Congress should remove the policy barriers and permit coastal shipping firms to self-correct and compete for shipper’s freight. As a MARAD leader said, “the question is not if but when” speaking of short sea shipping. That time is now. The U.S. government must stop studying the problem and start acting to promote coastal freight transportation.
- Amy J. O’Donnell, Dept. of Navy
17
Essay 3: The NAFTA Super Highway
The North American Free Trade Agreement (NAFTA) has profoundly affected the economic relationship between the United States (U.S.) and Mexico and paved the way for increasing cross-border trade. Mexico today, bolstered by the success of NAFTA, is planning port projects and the infrastructure to link them directly to inland port facilities in the U.S.146, 147 The U.S. also realizes the critical need to modernize and expand its aging highways as they have remained largely unchanged for decades while the trade volume has expanded multiple times. This essay will demonstrate the NAFTA benefits and the course Mexico has taken as they desire a solidified position in the future regional marketplace. Further, the essay will detail the concept of the NAFTA superhighway. Lastly, recommendations for increasing badly needed transportation tax revenues, improving and expanding America’s critical trade corridor infrastructure, and assisting Mexico in meeting their bold modernization projects will be offered. If there is one simple concept behind a fluid, lucrative international trade network, it is that infrastructure matters.148
The State of the Agreement
Signed into law in 1993, NAFTA incrementally eliminated trade barriers and tariffs. Criticized for being harmful to the U.S., NAFTA has illustrated that the free-trade concept has been prosperous for Mexico, Canada, and the U.S. by making them more competitive on the global market. According to the Office of the U.S. Trade Representative and the Free Trade Alliance, these facts demonstrate the success of the agreement: between 1993 and 2006 trade among NAFTA partners climbed 198%; agricultural exports from the U.S. to Mexico have tripled; employment in the U.S. rose 24% between 1993 and 2007 while manufacturing output rose 58%; and lastly, the largest free trade zone producing $15.3 trillion worth of goods and services annually was created.149,150 Fully implemented by 2008, the agreement has lived up to its goals of creating investment opportunities and a playing field for innovation and mutual benefit.
NAFTA and Mexico
No country has benefited more from NAFTA than Mexico. Having suffered through economic hardships, the Mexican government looked north, realizing that the stability offered by the world’s largest trading market could be their answer to a more economically viable future.151 Today, Mexico continues to face internal hurdles but the overall NAFTA benefit has given them promise. The Mexican government and trade industry has taken note and is preparing for the future, “The huge increase in Mexican foreign trade, in addition to the increase in traffic of merchandise arriving at Mexican ports with final destinations to the U.S. and Canada, is requiring a quick response from the transportation sector to improve efficiency, cost savings and cargo security.”152 Launched in 2007, the National Infrastructure Program (NIP) is a 5-year program intended to increase the quality of the country’s infrastructure.153 The NIP targets 300 infrastructure projects, requiring over $141 billion in financing, with the goal of constructing nearly 12,000 miles of highways; adding or expanding inter-modal terminals; improving rail lines and equipment; and building or expanding 4 large container terminals along the west coast.154 Challenges to the NIP abound. The global economic downturn has delayed many of the programs for 2 years.155 The U.S. Department of Commerce believes that Mexico’s NIP opens
18
the window for over $250 billion in investment opportunities for Mexican and U.S. firms through 2012.156 Providing limited assistance to Mexico is a provision of the Coordinated Border Infrastructure Program of the Safe, Accountable, Flexible, Efficient Transportation Equity Act of 2005 (SAFETEA-LU) which allows a border state to provide highway funding for use in Mexico, provided the project supports the movement of goods between the U.S. and Mexico.157 Given the shortfall in funds for U.S. highway projects, the amount of support given to Mexico through this program will be limited. As Mexico’s projects moves forward, they must strive to integrate seamlessly into a U.S. structure that has the capacity and efficiency to compliment their effort. The need to provide such structure on the U.S. side is understood and concepts detailing the ideal infrastructure are in-place and commonly referred to as ‘superhighway’ projects.
The NAFTA Superhighway
Ironically, the NAFTA superhighway exists today, as do the CANAMEX (Canada/Mexico) and the Interstate 5 (NAFTA supporting) corridors. Since the mid-1990s, the terms “superhighway” and “super-corridor” have been used to describe an existing network of highways carrying international trade along interstate highway 35 (I-35).158 Linking Mexico with Canada, this I-35 highway corridor has borne a substantial portion of the cargo associated with the free trade agreement and accounts for approximately $1 trillion in annual trade.159 The North America Super-Corridor Coalition (NASCO) is a non-profit organization with the goal of uniting public and private sectors for the goal of economic viability. As the shipping volume has grown, further burdening the aging highway infrastructure, NASCO has long realized the challenges (and opportunities) this increasing volume will pose in the future. Working to alleviate these infrastructure issues in an environment of constrained transportation budgets, NASCO has challenged Canada and Mexico, the I-35 bordering states and counties, and industry to focus on improving infrastructure through innovation and efficiency.160 However, without sizeable federal assistance, it is nearly certain that first-rate, large scale highway projects will not be attainable. As stated by Kelly Taylor in a New American article, “The NAFTA Super Highway is a venture unlike any previous highway construction project. It is actually a daisy chain of dozens of corridors and coordinated projects that are expected to stretch out for several decades, …”161 An example of a superhighway project is the Trans-Texas Corridor (TTC), a system of highways linking several high-use, Mexico border crossings into one central highway traveling north out of Texas. A project designed to solve current and projected cargo movement bottlenecks, the TTC would link, at the North Texas border, to other corridor projects paralleling (and at times incorporating) the I-35 corridor. This I-35 corridor project, could be as extensive as, “a superhighway system including tollways for passenger vehicles and trucks, lanes for commercial and freight trucks; tracks for commuter rail and high-speed freight rail; depots for all rail lines; pipelines for oil, water, and natural gas;…”162 Such a system would cover 4,000 miles and may extend up to 10 lanes wide.163 Although borne of the desire to improve Texas’ economy while solving transportation problems, the TTC concept as originally envisioned has been shelved. The TTC, as well as the entire ‘new’ superhighway concept has met with criticism and debate within the effected states and at times within the federal government. The environmental impacts of such large scale construction projects detail the significant noise, pollution and amount of land required to build a multi-lane highway and rail line corridor. Today, Texas is pursuing piecemeal improvements to
19
the existing infrastructure, which will ease some of the highway burden, but will likely not offer an over-arching solution.
Recommendations Gas Tax At the heart of the failing or insufficient transportation infrastructure is the fact that too few funds are available to cover the necessary modernization costs. As Samuel Staley of the think tank Reason Foundation notes,
“We also need to find a way to come up with billions of dollars to redesign and reconfigure our transportation network for the 21st century. That’s a big challenge because we are already facing an annual transportation deficit of at least $75 billion, according to groups such as the American Society of Civil Engineers and the National Cooperative Highway Research Program, the National Surface Transportation Policy and Revenue Commission.”164
In order to tackle infrastructure projects of the magnitude proposed in this paper, considerably more revenue than that required to merely repair and maintain the system is required. A tax rate of 18.4 cents per gallon has been unchanged and insufficient for years given construction and maintenance costs have increased significantly. According to the American Road and Transportation Builders Association, they measured “…a 15.1 percent increase in the cost of highway and street construction from October 2007 to October 2008.”165 Although significantly large raises are not likely, the gas tax must be raised as much as politically possible over a 5-year period and then indexed to vary with inflation. Unlikely to raise sufficient revenue, it is recommended that public-private partnerships providing private equity investments are also aggressively pursued.166 Transportation Corridor Projects Ten lanes of traffic and multiple rail lines bypassing today’s bottlenecks is intriguing and brings into focus the magnitude of transportation projects this county likely requires. However, constructing such super-corridor projects along several north/south U.S. routes, as originally envisioned, is politically and fiscally unfeasible. Still, the concept of drastically improving the ability to move goods through this country remains valid and is one whose time has arrived. Our federal government must develop an aggressive and comprehensive transportation policy that addresses this concern, as well as, the general aging infrastructure. All evidence points to increases in future trade between the NAFTA signatories and Asia – we must be prepared to efficiently handle this trade or the county will lag as compared to its global competition. Mexico Infrastructure Improvement Mexico’s infrastructure program is a bold step to address the country’s underdeveloped transportation infrastructure. Positioning themselves as a regional economic strength in the 21st century certainly benefits the U.S. as greater Mexican purchasing power will open new markets for our goods and services. However, Mexico can not complete the necessary projects without

20
funding assistance – already programs have been delayed due to decreased revenues and hesitant private investment. The U.S. can assist by earmarking some gas tax revenue to improve those roads and border crossings that directly support the movement of goods between countries. Additionally, bonds of companies that invest in infrastructure projects can be guaranteed by the federal government, reducing risk and making the investment more profitable.167
Conclusion
Tomorrows trade opportunities with Mexico look increasing promising as globalization offers expanded and improved markets to this trading partnership. Mexico seeks a modernized, competitive transportation network able to receive and rapidly transport to the U.S. the tremendous volume of trade expected in the future. Similarly, the U.S. continues to evaluate and upgrades its transportation system – but not nearly to the degree required of a world-class trade partner. Needed large scale improvements of the U.S. highway network are well understood but fail to clear the political hurdles as no one wants such projects in their backyard. Further, both Mexican and U.S. projects are bending under the weight of questionable financial backing and run the risk of being terminated or delayed. Revenue systems need revised and creative sources of investment need identified or both countries face the specter of missed economic opportunity.
- Edward Miller, CDR, USN
21
End Notes
1 U.S. Department of Transportation website, http://www.dot.gov/recovery, (accessed 18 March 2010). 2 NYU Press, “Chapter 1: A History of Information Highways and Byways,” Ancient Networks, http://nyupress.org/professor/webinteaching/history3.shtml, (accessed 23 April 2010). 3 Paul Collier, The Bottom Billion: Why the Poorest Countries Are Failing and What Can Be Done About It (New York: Oxford University Press, 2007), 55-57. 4 United States Government Accountability Office, “Physical Infrastructure: Challenges and Investment Options for the Nation’s Infrastructure,” Testimony Before the Committee on the Budget and the Committee on Transportation Infrastructure, U.S. House of Representatives, GAO-08-763T, (Washington DC, May 8, 2008),:9-10. 5 Association of American Railroads, "Class I Rail Statistics," http://www.aar.org/~/media/AAR/Industry%20Info/Statistics%2020090910.ashx, (accessed 23 March 2010). 6 Wilson, R.A., Transportation in America, Eighteenth Edition (Washington, D.C.: Eno Transportation Foundation, Inc., 2001). 7 Research and Innovation Technology Administration, “Pocket Guide to Transportation 2010”, Department of Transportation, (Washington, D.C., January 2010), 32 and 35. 8 TRIP, The Road Information Program, “Key Facts About America’s Road and Bridge Conditions and Federal Funding – Updated November 2005,” http://www.tripnet.org/nationalfactsheet.htm 9 Amtrak – Inside Amtrak – National Fact sheet, Amtrak Information and Facts webpage, http://www.amtrak.com/servlet/ContentServer?c=Page&pagename=am%2FLayout&cid=1246041980246, (accessed 18 May 2010). 10 Igor Likov, Richard J. Wenning, and Gregory A. Kiker, “Managing Critical Infrastructure Risks,” (Netherlands: Springer, 2007): 24. 11 Roxana Tiron, “Easing Congestion”, Seapower, 42-44 (February 2010) 12 Barbara Windsor, President and CEO of Hahn Transportation Company, speaking to the Committee on Committee on House Ways and Means Subcommittee on Select Revenue Measures, on July 23, 2009, “Highway Trust Fund Financing,” Congressional Testimony, Item 32Y1298863381, http://ezproxy6.ndu.edu/login?url=http://search.ebscohost. com/login. aspx? direct=true&db=mth&AN=32Y1298863381&site=ehost-live.
22
13 Ibid. 14 Association of American Railroads, "Overview of America's Railroads," http://www.aar.org/PubCommon/Documents/AboutTheIndustry/Overview.pdf, (accessed 17 March 2010). 15 Ibid. 16 IBIS World, “Domestic Airlines in the U.S.: 48111b,” IBIS World Industry Report, (February 2010), http://www.ibisworld.com/industry/default.aspx?indid=1125: 7-8. 17 IBIS World, “Couriers in the US: 49211,” IBIS World Industry Report, (February 2010.) http://www.ibisworld.com/reports/reportdownload.aspx?cid=1&rtid=1&e=1219&ft=pdf 18 Association of Oil Pipelines, “How Many Miles of Pipeline are There?,” Pipeline 101 Overview, http://www.pipeline101.com/, (accessed 21 April 2010). 19 U.S. Government Accountability Office, Physical Infrastructure – Challenge and Investment Options for the Nation’s Infrastructure, May 8, 2008, 4 and 5. 20 Federal Aviation Administration, “Airport Improvement Program Overview,” FAA Homepage, http://www.faa.gov/airports/aip/overview/, (accessed 21 March 2010.). 21 Association of American Railroads, "Overview of America's Railroads" 22 Association of Oil Pipelines, “About Pipelines,” Association of Oil Pipelines, http://www.aopl.org/aboutPipelines/, (accessed 21 April 2010). 23 Michael E. Porter, “The Five Competitive Forces That Shape Strategy,” Harvard Business Review, (January 2008): 80. 24 IBIS World, “Domestic Airlines in the U.S.: 48111b,” IBIS World Industry Report, (February 4, 2010), http://www.ibisworld.com/industry/default.aspx?indid=1125: 16-17. 25 Mark G. Stewart and John Mueller, “A Risk and Cost-Benefit Assessment of United States Aviation Security Measures,” Cryptome.org, http://cryptome.org/avsec-assess.pdf, March 21, 2010. 26 Ibid. 27 IBIS World, “Domestic Airlines in the U.S.: 48111b,” 16-21. 28 Ibid. 29 Ibid.
23
30 Ibid, 15-21. 31 Ibid, 15. 32 Ibid, 12-15. 33 Ibid, 18-19. 34 Ibid, 7. 35 IBIS World, “International Airlines in the U.S.: 48111a,” IBIS World Industry Report, (February 4, 2010), http://www.ibisworld.com/industry/default.aspx?indid=1124: 27. 36 IBIS World, “Domestic Airlines in the U.S.: 48111b,” 12-13. 37 Ibid. 38 Ibid, 13. 39 Ibid. 40 Ibid, 25. 41 Warren L. Dean Jr. and Jeffrey N. Shane, “Alliances, Immunity, and the Future of Aviation,” The Air and Space Lawyer, Vol. 22, Issue 4 (2010): 1-7. 42 IBIS World, “International Airlines in the U.S.: 48111a,” 27. 43 IBIS World, “Domestic Airlines in the U.S.: 48111b,” 28-30. 44 Air Transportation Association Office of Economics, “Industry Review and Outlook,” Air Transport Association, http://www.airlines.org/NR/rdonlyres/8B660F3F-C289-45E0-85DB-242928FAA212/0/ATAIndustryReview.pdf, (accessed 21 March 2010). 45 R. Glenn Hubbard and Anthony Patrick O’Brien, Economics, Second Edition, (Upper Saddle River, NJ: Pearson Prentice Hall, 2008), 442. 46 Randal O’Toole, “Defining Success--The Case Against Rail Transit,” CATO Institute, Policy Analysis: No. 663, March 24, 2010, 1. Over $100 billion dollars has been spent by local governments to construct rail transit systems over the last 40 years. Amtrak is funded by Congress and showed an operating loss of approximately $500 million is 2009. Its revenues cover no infrastructure or capital purchases. In April 2010, the CEO of Amtrak requested an additional $468 million to fund a rail car replacement program.
24
47 O’Toole, “Defining Success--The Case Against Rail Transit,” 15. Light rail fares cover approximately 30% of total operating costs, and no transit system has generated enough income to sustain capital expenditures in the past 60 years. Sustaining infrastructure costs a minimum of $250,000 per mile per year and up to $1 million per mile per year. 48 O’Toole, “Defining Success--The Case Against Rail Transit,” 13-14 49 O’Toole, “Defining Success--The Case Against Rail Transit.” 50 Abbi Sivasailam and Audrey Spalding, High-speed rail predicted to travel much slower than advertised, 2009, Show-Me Institute, St Louis MO. (accessed 16 Feb 2010). 51 Burlington Northern Santa Fe (BNSF). “BNSF Annual Report 2006.” http://www.bnsf.com/about-bnsf/financial-information/annual-reports-and-proxy-statements/pdf/2006annrpt.pdf. (accessed 18 May 2010). 52 IBIS World. “Rail Transportation in the U.S.: 48412” IBIS World Industry Report, (February, 2010): 1-40, http://www.ibisworld.com/industryus/default.aspx?indid=1150. (accessed 20 May 2010). 53 BNSF Annual Report 54 Ibid. 55 TMSi Logistics White Paper. “When Outsourcing Your Supply Chain, Know the Difference Between Asset Based and Non-asset Based 3PL Providers.” http://www.tmsilog.com/_white_papers/TMSI-057-WP%20Asset%20v%20Non-Asset%20C0A.pdf, (accessed 20 May 2010). 56 Ibid. 57 IBIS World. “Long-Distance Freight Trucking in the U.S.: 48412” IBIS World Industry Report, (January, 2010): 1-40, http://www.ibisworld.com/industryus/default.aspx?indid=1150. (accessed 20 May 2010). 58 “Maritime Industry Overview”, Transportation Industry Study, Industrial College of the Armed Forces, National Defense University, Washington, DC (Spring 2010). 59 Ibid. 60 John Frittelli, The Jones Act: An Overview, CRS Report for Congress, (2003), 1. 61 Dutch Inland Shipping Information Agency (BVB), The Power of Inland Navigation: The future of freight transport and inland shipping in Europe 2010-2011. Platform P, Rotterdam, The Netherlands. April 2009. 21.
25
62 Port of Rotterdam Authority. Port Statistics. Rotterdam, The Netherlands. http://www.portofrotterdam.com/mmfiles/Port_Statistics_2009_tcm26-64785.pdf . (accessed 19 May 2010). 63 R. Glenn Hubbard and Anthony Patrick O’Brien, Economics, Second Edition, 442. 64 Allegro Energy Group. How Pipelines Make the Oil Market Work – Their Networks, Operation and Regulation, A Memorandum Prepared for the Association of Oil Pipe Lines and the American Petroleum Institute's Pipeline Committee, December 2001. 2. 65 Association of Oil Pipelines, “About Pipelines” 66 Association of Oil Pipelines, “Introduction” 67 Association of Oil Pipelines, “About Pipelines” 68 National Surface Transportation Policy and Revenue Study Commission, “Transportation for Tomorrow,” Report of the National Surface Transportation Policy and Revenue Study Commission, 2007, 2, http://transportationfortomorrow.org/final_report/pdf/volume_1.pdf, (accessed 17 March 2010). 69 Federal Railroad Administration. “ARRA Information: FRA and the American Recovery and Reinvestment Act of 2009.” http://www.fra.dot.gov/pages/2153.shtml (accessed 18 May 2010). 70 James R. Young, "Freight Train Blues," US Infrastructure, http://www.americainfra.com/article/Freight-Train-Blues/ 71 American Society of Civil Engineers, “ASCE’s Infrastructure Report Card--2009,” http://pubs.asce.org/NR/rdonlyres/D70FC861-0CBD-4DBE-961B-D82A4E49D912/0/0209ReportCard.pdf. (accessed 27 March 2010). 72 Ibid. 73 Ibid. 74 CREATE, "The Chicago Region Environmental and Transportation Efficiency Program: National Public Benefits." http://www.createprogram.org/pdf/create_nationalpublicbenefits.pdf (accessed 27 March 2010). 75 Phillip Longman. "Back on Tracks." Washington Monthly. http://www.washingtonmonthly.com/features/2009/0901.longman.html (accessed 23 March 2010).
26
76 Jonathon Lippert. "Buffett Takes on Chicago Chokepoint with Burlington (Update2) - BusinessWeek." http://www.businessweek.com.ezproxy6.ndu.edu/news/2010-02-10/buffett-takes-on-chokepoint-in-chicago-with-burlington-northern.html (accessed 17 March 2010). 77 Peter J. Basso, Director of Program Finance Committee, speaking to the Committee on Senate Environment and Public Works, on June 25, 2009, "Impacts of Highway Trust Fund Insolvency." Congressional Testimony, Item 32Y2869109651, http://ezproxy6.ndu.edu/login ?url= http:// search.ebscohost.com/login.aspx?direct=true&db=mth&AN=32Y2869109651 &site=ehost-live (accessed 17 March 2010). 78 U.S. Government Accountability Office, Highway Trust Fund, Improved Solvency Mechanisms and Communication Needed to Help Avoid Shortfalls in the Highway Account, February 2009, 10. 79 “I-35W Bridge Fact Sheet,” Minnesota Public Radio News website, http://minnesota.publicradio.org/display/web/2007/08/03/bridge_background/?rsssource=1, (accessed 31 March 2010). 80 Frederic J. Frommer, “NTSB: Design errors factor in 2007 bridge collapse,” USA Today website, http://www.usatoday.com/news/world/2008-11-13-628592230_x.htm, (accessed 31 March 2010). 81 United States Government Accountability Office, Physical Infrastructure – Challenge and Investment Options for the Nation’s Infrastructure, May 8, 2008, 4. 82 Air Transportation Association Office of Economics, “Industry Review and Outlook 83 Jim Corridore, “Airlines,” Standard & Poor’s Industry Surveys, http://www.netadvantage.standardandpoors.com/NASApp/NetAdvantage/showIndustrySurvey.do?code=air, (accessed 9 March 2010). 84 Federal Aviation Administration, “National Plan of Integrated Airport Systems (2009-2013),” FAA Report to Congress, Washington DC (September 30, 2008), viii. 85 Ibid. 86 Ibid, 18. 87 Federal Aviation Administration, “FAA Aerospace Forecast: Fiscal Years 2009-2025,” (Department of Transportation: Washington DC, 2009), 5. 88 Bart Elias, “CRS Issue Statement on Aviation Policy,” Congressional Research Service, (January 7, 2010). 89 Federal Aviation Administration, “Airport Improvement Program Overview.”
27
90 Ibid. 91 Federal Aviation Administration, “National Plan of Integrated Airport Systems (2009-2013),” ix. 92 American Society of Civil Engineers, “Draft Issue Brief: FAA Reauthorization (H.R. 915) 17 MAR 2010,” ASCE Homepage, http://content.asce.org/files/pdf/AviationIssueBrief.pdf, (accessed 21 March 2010). 93 Ibid., 2. 94 Scott Doust, Ken Marien, Jerry Narum, and Robert Richtmyre, “United States Port Security: Regional Studies, The World Ocean,” (Class lecture, March 2010). 95 John Frittelli, The Jones Act: An Overview, 1. 96 Maritime Administration. Maritime Statistics. http://www.marad.dot.gov/library_landing_page/data_and_statistics/Data_and_Statistics.htm (accessed 19 May 2010). 97 Ibid. 98 IHS Global Insight Incorporated, "An Evaluation of Maritime policy in Meeting the Commercial and Security Needs of the United States: Report to U.S. Transportation Maritime Administration," (January 7, 2009), 51. 99 Association of Oil Pipelines, Pipeline 101 Overview. 100 Susan Stellin, “Lessons from the Icelandic Volcano Eruption,” New York Times Travel Section, http://www.nytimes.com/2010/05/02/travel/02prac.html, April 28, 2010 101 Union Internationale des Chemins de Fer (UIC), Presentation to ICAF Transportation Industry Study, Paris, France, May 10,2010. 102 Federal Railroad Administration, Press Room, “Positive Train Control Overview,” Issue Brief, updated February 20, 2009, http://fra.dot.gove/us/printcontent/1265. (accessed 25 January 2010). 103 Federal Railroad Administration, Rule: 4910-06-P. RIN 2130-AC-03, Positive Train Control Systems, January 12, 2010, http://www.fra.dot.gov/downloads/safety/PTC_Final_Rule_20100112_(FedReg)_(final).pdf. (accessed 2 February 2010).
28
104 National Transportation Safety Board, “Most Wanted Transportation Safety Improvements--Original List,” September 1990, http://www.ntsb.gov/Recs/mostwanted/original_list.thm. (accessed 26 March 2010). 105 Jeff Stagl, “Railroads have until April 16 to submit PTC Roll-Out Plans,” Progressive Railroading, February 17 2010, http://www.progressiveroading.com/pr/article.asp?id=22582. (accessed 18 February 2010). 106 Burlington Northern Santa Fe, “BNSF Announces $2.4 Billion Capital Commitment Program,” BNSF News, January 25 2010, http://www.bnsf.com/employees/communications/bnsf_today/2010/01/2010-01-25-a.html. (accessed 16 February 2010). 107 William C. Vantuono, “Railroader of the Year,” Railway Age, January 2009. http://www.railwayage.com/A/feature1.html. (accessed 18 February 2010). 108 Burlington Northern, “BNSF Announces $2.4 Billion Capital Commitment Program 109 Ramon Abelleyro, “Positive Train Control: Wireless PTC Technology Outline White Paper,” Orchard Park NY: STI-CO Industries, Inc. March 2009, http://www.tessco.com/yts/partner/manufacturer_list/vendors/sti-co/pdfs/STI-CO-Wireless-PTC-3.pdf. (accessed 18 February 2010)., 22. 110 Burlington Northern, “BNSF Announces $2.4 Billion Capital Commitment Program 111 Association of American Railroads, “The Need for Reasonable Implementation of the Positive Train Control Mandate,” AAR—Policy and Economics Department Position Paper, October 2009, http://www.aar.org/InCongress/~/media/AAR/PositionPapers/PTC%20Oct%202009.ashx (accessed 18 February 2010). 112 Ibid, 22. 113 Ibid, 23. 114 John D. Boyd, “Rails Fire Back at Chlorine Shippers on Technology,” The Journal of Commerce Online, March 18, 2010, http://www.joc.com/rail-intermodal/rails-fire-back-chlorine-shippers-technology. (accessed 21 March 2010). 115 Federal Railroad Administration, “Benefits and Costs of Positive Train Control: Report in Response to Request of Appropriations Committees.” 116 William C. Vantuono, “BNSF Starts Positive Train Control Trial—North American Viewpoint,” International Railway Journal, March 2004, available from BNET,

29
http://findarticles.com/p/articles/mi_m0BQQ/is_3_44/ai_114629906/. (accessed 16 February 2010). 117 Association of American Railroads, “The Need for Reasonable Implementation of the Positive Train Control Mandate.” 118 Steven R. Ditmeyer, “Network-Centric Railroading Utilizing Intelligent Railroad Systems.” Paper presented at the 10th International Command and Control Research and Technology Symposium: The Future of Command and Control, McLean VA, June 13-16, 2005. http://www.dodccrp.org/events/10th_ICCRTS/CD/papers/005.pdf (accessed 29 March 2010)..” 119 United States Department of Transportation, Federal Railroad Administration, “North American Joint Positive Train Control Project,” Report Number DOT/FRA/ORD-09/04, April 2009. Washington, D.C. http://www.fra.dot.gov/downloads/Research/ord0904.pdf. (accessed 29 March 2010). 120 American Society of Civil Engineers, “ASCE’s Infrastructure Report Card--2009” 121 Ibid. 122 Ibid. 123 Ibid. 124 William C. Vantuono, “Why PTC Matters More Than Ever,” Railway Age, May 2009. http://www.nxtbook.com/nxtbooks/sb/ra0509/index.php?startid=24#/26, (accessed 17 March 2010). 125 Kenneth L. Alford and Steven R. Ditmeyer, “Net-Centric Operations: Defense and Transportation Synergy,” The Journal of Defense Software Engineering, January 2007. http://www.dtic.mil/cgi-bin/GetTRDoc?AD=ADA487718&Location=U2&doc=GetTRDoc.pdf. (accessed 29 March 2010). 126 Ibid. 127 Hillestad, Richard, Ben D. Van Roo, Keenan D. Yoho, “Fast-Forward Key Issues In Modernizing the US Freight-Transportation System for Future Economic Growth”, Rand Corporation, San Monica, CA (2009) pg 6. 128 Ibid. 129 Ibid, pg xx. 130 “Maritime Industry Overview”, Transportation Industry Study, Industrial College of the Armed Forces, slide 3.

30
131 United States Chamber of Commerce – “The Transportation Challenge - Moving the U.S. Economy " http://www.uschamber.com/publications/reports/0804transportationchallenge (accessed 17 March 2010), 6. 132 Kevin Tokarski, “Maritime Administration America’s Advocate for the Maritime Industry,” presentation on 29 January 2010 to ICAF Transportation Industry Study Group. 133 Tiron, “Easing Congestion” 134 Research and Innovation Technology Administration, “Pocket Guide to Transportation 2010”, 20. 135 “Short Sea Shipping Option Shows Importance of Systematic Approach to Public Investment Decisions”, General Accounting Office, GAO-05-768, Washington, DC (July 2005), 5. 136 Research and Innovation Technology Administration, “Pocket Guide to Transportation 2010”, 48. 137 “Short Sea Shipping Option Shows Importance of Systematic Approach to Public Investment Decisions”, 4. 138 Corbett, James J, James J. Winebrake, Alex E. Farrell, “Emissions Analysis of Freight Transport Comparing Land-Side and Water-Side Short-Sea Routes: Development and Demonstration of a Decision Modeling Tool”, US Department of Transportation (2005), 3. 139 Tiron, Roxana, “Easing Congestion” 140 “Four Corridor Case Studies of Short-Sea Shipping Services”, US Department of Transportation Office of the Secretary of Maritime Administration, Ref “DTOS59-04-Q-00069 (15 August 2006), 46. 141 Tiron, Roxana, “Easing Congestion” 142 Hillestad, Richard, Ben D. Van Roo, Keenan D. Yoho, “Fast-Forward Key Issues In Modernizing the US Freight-Transportation System for Future Economic Growth,” 56. 143 Ibid. 144 Tiron, Roxana, “Easing Congestion” 145 “Sea Bridge Freight “, www.SeaBridgeFreight.com, February 11, 2010
31
146 “Procurement Opportunities: Mexico’s National Infrastructure Program,” BUYUSA.GOV—U.S. Commercial Service, (18 November 2009). 1. http://www.buyusa.gov/mexico/en/infrastructure.html. 147 “Transportation Equipment and Services,” BUYUSA.GOV—U.S. Commercial Service, (18 November 2009): 1. http://www.buyusa.gov/mexico/en/transportation.html. 148 “Transportation: Stopped at the Border,” Window on State Government, (July 1998): p.2. http://www.window.state.tx.us/border/border.html. 149 “The Benefits of NAFTA to the United States,” Free Trade Alliance, (2008). http://www.freetradealliance.org 150 “NAFTA Facts,” Office of the United Stated Trade Representative. (March 2008): p. 1. www.ustr.gov. 151 Luis Rubio, “NAFTA and Mexico.” Perspectives on the Americas, Center for Hemispheric Policy, University of Miami, 2. (17 July 2008). 152 “Transportation Equipment and Services,” BUYUSA.GOV—U.S. Commercial Service, (18 November 2009): 1. http://www.buyusa.gov/mexico/en/transportation.html. 153 “Procurement Opportunities: Mexico’s National Infrastructure Program,” BUYUSA.GOV—U.S. Commercial Service, (18 November 2009). 1. http://www.buyusa.gov/mexico/en/infrastructure.html. 154 Ibid. 155 “Transportation Equipment and Services,” BUYUSA.GOV—U.S. Commercial Service, (18 November 2009): 1. http://www.buyusa.gov/mexico/en/transportation.html. 156 “Secretary Guitierrez to Discuss Improving North American Trade and Security During Visit to Mexico,” Department of Commerce Press Release, (Washington D.C., 25 February 2008). p. 1. http://www.commerce.gov/NewsRoom/PressReleases_FactSheets/PROD01_005259. 157 Kelly Taylor, “Coming Through! The NAFTA Super Highway,” in Infowars.com (New American, August 2006): p. 3. http://www.infowars.com/articles/nwo/nafta_superhighway_coming_through.htm. 158 “NASCO – Myth vs. Fact,” North America’s SuperCorridor Coalition, Inc., (2009). http://www.nascocorridor.com/commondetail.asp?id=2190. 159 Ibid.

32
160 Ibid. 161 Kelly Taylor, “Coming Through! The NAFTA Super Highway.” 162 Ibid. 163 Steve Watson, “NASCO-Ron Paul is “Confused” About…NAFTA Superhighway,” in Infowars.com, (18 December 2007): p. 2. http://www.bibliotecapleyades.net/sociopolitica/ sociopol_globalization11.htm. 164 Samuel Staley, “Gas Tax Increase or Private Capital?,” Reason Foundation, (16 July 2008): p. 1. http://reason.org/news/printer/gas-tax-increase-or-private-ca 165 Jon Schmitz, “Gasoline tax unable to fill federal highway fund’s tank,” Post-Gazette.com, (Pittsburgh Post Gazette: 25 January 2009): p. 1. http://www.post-gazette.com/pg/09025/ 944323-85.stm. 166 Ibid. 167 Walter Russell Mead, and Jeff Faux, “Beyond NAFTA: A Forum,” The Nation, (28 May 2001): p.1. http://www.thenation.com/doc/20010528/forum/2
33
Bibliography
“The Benefits of NAFTA to the United States.” Free Trade Alliance. (2008).
http://www.freetradealliance.org. “Four Corridor Case Studies of Short-Sea Shipping Services”, US Department of Transportation
Office of the Secretary of Maritime Administration, Ref “DTOS59-04-Q-00069,15 August 2006.
“I-35W Bridge Fact Sheet,” Minnesota Public Radio News,
http://minnesota.publicradio.org/display/web/2007/08/03/bridge_background/?rsssource=1, (accessed 31 March 2010).
“Maritime Industry Overview”, Transportation Industry Study, Industrial College of the Armed
Forces, National Defense University, Washington, DC (Spring 2010). “NAFTA Facts.” Office of the United States Trade Representative. (March 2008). www.ustr.gov. “NASCO – Myth vs. Fact.” North America’s SuperCorridor Coalition, Inc. (2009).
http://www.nascocorridor.com/commondetail.asp?id=2190. “Procurement Opportunities: Mexico’s National Infrastructure Program.” BUYUSA.GOV—U.S.
Commercial Service. (18 November 2009). pp. 1-3. http://www.buyusa.gov/mexico/en/infrastructure.html.
“Secretary Guitierrez to Discuss Improving North American Trade and Security During Visit to
Mexico.” Department of Commerce Press Release. (Washington D.C., 25 February 2008). p. 1. http://www.commerce.gov/NewsRoom/PressReleases_FactSheets/PROD01_005259
“Sea Bridge Freight “, www.SeaBridgeFreight.com, (accessed 11 February 2010). “Short Sea Shipping Option Shows Importance of Systematic Approach to Public Investment
Decisions”, General Accounting Office, GAO-05-768, Washington, DC, July 2005 “Transportation Equipment and Services.” BUYUSA.GOV—U.S. Commercial Service. (18
November 2009). pp. 1-4. http://www.buyusa.gov/mexico/en/transportation.html. “Transportation: Stopped at the Border.” Window on State Governmet. (July 1998). pp. 1-9.
http://www.window.state.tx.us/border/border.html. “When Outsourcing Your Supply Chain, Know the Difference Between Asset Based and Non-
asset Based 3PL Providers.” TMSi Logistics White Paper. http://www.tmsilog.com/_white_papers/TMSI-057-WP%20Asset%20v%20Non-Asset%20C0A.pdf, (accessed 20 May 2010).
34
Abelleyro, Ramon. “Positive Train Control: Wireless PTC Technology Outline White Paper.”
Orchard Park NY: STI-CO Industries, Inc. March 2009. http://www.tessco.com/yts/partner/manufacturer_list/vendors/sti-co/pdfs/STI-CO- Wireless-PTC-V23.pdf. (accessed 16 February 2010).
Air Transportation Association Office of Economics. “Industry Review and Outlook.” Air
Transport Association. http://www.airlines.org/NR/rdonlyres/8B660F3F-C289-45E0-85DB-242928FAA212/0/ATAIndustryReview.pdf.
Alford, Kenneth L. and Steven R. Ditmeyer. “Net-Centric Operations: Defense and
Transportation Synergy.” The Journal of Defense Software Engineering, January 2007. http://www.dtic.mil/cgi- bin/GetTRDoc?AD=ADA487718&Location=U2&doc=GetTRDoc.pdf. (accessed 29 March 2010).
Allegro Energy Group. How Pipelines Make the Oil Market Work – Their Networks, Operation
and Regulation, A Memorandum Prepared for the Association of Oil Pipe Lines and the American Petroleum Institute's Pipeline Committee, December 2001
American Society of Civil Engineers. “ASCE’s Infrastructure Report Card--2009.”
http://pubs.asce.org/NR/rdonlyres/D70FC861-0CBD-4DBE-961B- D82A4E49D912/0/0209ReportCard.pdf. (accessed 27 March 2010).
———. “Draft Issue Brief: FAA Reauthorization (H.R. 915) 17 Mar 2010.” ASCE Homepage.
http://content.asce.org/files/pdf/AviationIssueBrief.pdf. Amtrak – Inside Amtrak – National Fact sheet,
http://www.amtrak.com/servlet/ContentServer?c=Page&pagename=am%2FLayout&cid=1246041980246 , (accessed 18 May 2010).
Association of American Railroads. "Class I Rail Statistics."
http://www.aar.org/~/media/AAR/Industry%20Info/Statistics%2020090910.ashx (accessed 23 March 2010).
———. “The Need for Reasonable Implementation of the Positive Train Control Mandate.”
AAR—Policy and Economics Department Position Paper. October 2009. http://www.aar.org/InCongress/~/media/AAR/PositionPapers/PTC%20Oct%202009. ashx. (accessed 16 February 2010).
———. "Overview of America's Railroads."
http://www.aar.org/PubCommon/Documents/AboutTheIndustry/Overview.pdf (accessed 17 March 2010).
Association of Oil Pipelines, Pipeline 101 Overview, http://www.pipeline101.com/, (accessed 21
April 2010).

35
———, About Pipelines, http://www.aopl.org/aboutPipelines/, (accessed 21 April 2010). Basso, Peter J. Director of Program Finance Committee, speaking to the Committee on Senate Environment and Public Works, on June 25, 2009. "Impacts of Highway Trust Fund Insolvency." Congressional Testimony, Item 32Y2869109651. Http://ezproxy6.ndu. edu/login?url= http:// search.ebscohost.com/login.aspx?direct=true&db=mth&AN =32Y2869109651&site=ehost-live (accessed 17 March 2010). Boyd, John D. “Rails Fire Back at Chlorine Shippers on Technology.” The Journal of
Commerce, March 18, 2010. http://www.joc.com/rail-intermodal/rails-fire-back- chlorine-shippers-technology. (accessed 21 March 2010).
Burlington Northern Santa Fe. “BNSF Announces $2.4 Billion Capital Commitment
Program.” BNSF News, January 25 2010. http://www.bnsf.com/employees/communications/bnsf_today/2010/01/2010-01-25- a.html. (accessed 16 February 2010).
———. “BNSF Annual Report 2006.” http://www.bnsf.com/about-bnsf/financial-
information/annual-reports-and-proxy-statements/pdf/2006annrpt.pdf Collier, Paul. The Bottom Billion: Why the Poorest Countries Are Failing and What Can Be
Done About It. New York: Oxford University Press, 2007. Corbett, James J, James J. Winebrake, and Alex E. Farrell, “Emissions Analysis of Freight
Transport Comparing Land-Side and Water-Side Short-Sea Routes: Development and Demonstration of a Decision Modeling Tool”, US Department of Transportation, 2005.
Corridore, Jim. “Airlines.” Standard & Poor’s Industry Surveys.
http://www.netadvantage.standardandpoors.com/NASApp/NetAdvantage/showIndustrySurvey.do?code=air.
CREATE. "The Chicago Region Environmental and Transportation Efficiency Program:
National Public Benefits." http://www.createprogram.org/pdf/create_nationalpublicbenefits.pdf (accessed 27 March 2010).
Dean, Warren L. Jr. and Jeffrey N. Shane. “Alliances, Immunity, and the Future of Aviation.”
The Air and Space Lawyer, Vol. 22, Issue 4 (2010): 1-7, http://proquest.umi.com/pqdweb?index=null&did=1955909101&SrchMode=5&Fmt=3&retrieveGroup=0&VInst=PROD&VType=PQD&RQT=309&VName=PQD&TS=1269033046&clientId=3921&cfc=1
Ditmeyer, Steven R. “Network-Centric Railroading Utilizing Intelligent Railroad Systems.”
Paper presented at the 10th International Command and Control Research and

36
Technology Symposium: The Future of Command and Control, McLean VA, June 13-16, 2005. http://www.dodccrp.org/events/10th_ICCRTS/CD/papers/005.pdf (accessed 29 March 2010).
Doust, Scott, Ken Marien, Jerry Narum, and Robert Richtmyre. “United States Port Security:
Regional Studies, the World Ocean.” (March 2006). Dutch Inland Shipping Information Agency (BVB), The Power of Inland Navigation: The future
of freight transport and inland shipping in Europe 2010-2011. Platform P, Rotterdam, The Netherlands. April 2009.
Elias, Bart. “CRS Issue Statement on Aviation Policy.” Congressional Research Service.
Washington, DC, January 7, 2010. Federal Aviation Administration. “2009-2013 FAA Flight Plan.” Department of Transportation:
Washington, DC. http://www.faa.gov/about/plans_reports/. ———. “Airport Improvement Program Overview.” Department of Transportation: Washington,
DC. http://www.faa.gov/airports/aip/overview/. ———. “FAA Aerospace Forecast: Fiscal Years 2009-2025.” Department of Transportation:
Washington, DC, 2009. ———. “National Plan of Integrated Airport Systems (2009-2013).” Department of
Transportation: Washington, DC. http://www.faa.gov/airports/planning_capacity/npias/. September 30, 2008.
Federal Railroad Administration. “ARRA Information: FRA and the American Recovery and
Reinvestment Act of 2009.” Department of Transportation: Washington, DC. http://www.fra.dot.gov/pages/2153.shtml (accessed 18 May 2010).
———. “Benefits and Costs of Positive Train Control: Report in Response to Request of
Appropriations Committees, “Washington D.C., August 2004. Department of Transportation: Washington, DC. http://www.fra.dot.gov/downloads/safety/ptc_ben_cost_report.pdf. (accessed 21 March 2010).
———. “North American Joint Positive Train Control Project.” Report Number DOT/ FRA/
ORD- 09/04, April 2009. Department of Transportation: Washington, DC. http://www.fra.dot.gov/downloads/Research/ord0904.pdf. (accessed 29 March 2010).
———. "Positive Train Control Overview." Department of Transportation: Washington, DC.
http://www.fra.dot.gov/Pages/1265.shtml (accessed 30 March 2010).
37
———. "Preliminary National Rail Plan." Department of Transportation: Washington, DC.
http://www.fra.dot.gov/Downloads/RailPlanPrelim10-15.pdf (accessed 31 March 2010). ———. Rule: 4910-06-P. RIN 2130-AC-03, Positive Train Control Systems. Department of
Transportation: Washington, DC. January 12, 2010. http://www.fra.dot.gov/downloads/safety/PTC_Final_Rule_20100112_(FedReg)_(fin al).pdf. (accessed 2 February 2010).
———. Press Room Issue Brief. “Positive Train Control Overview.” Department of
Transportation: Washington, DC.. Updated February 20, 2009. http://fra.dot.gove/us/printcontent/1265. (accessed 25 January 2010).
———. Research Results. “The North American Joint Positive Train Control (NAJPTC)
Project.” Department of Transportation: Washington, DC. RR09-05, April 2009. http://www.fra.dot.gov/Downloads/Research/rr0905.pdf. (accessed 15 February 2010).
Fritelli, John, The Jones Act: An Overview, CRS Report for Congress, (2003). Frommer, Frederic J. “NTSB: Design errors factor in 2007 bridge collapse,” USA Today
website, http://www.usatoday.com/news/world/2008-11-13-628592230_x.htm, (accessed 31 March 31 2010).
Hillestad, Richard, Ben D. Van Roo, and Keenan D. Yoho, “Fast-Forward Key Issues In
Modernizing the US Freight-Transportation System for Future Economic Growth”, Rand Corporation, San Monica, CA ,2009.
Hubbard, R. Glenn and Anthony Patrick O’Brien. Economics, Second Edition. Upper Saddle
River, NJ: Pearson Prentice Hall, 2008. IBIS World. “Couriers in the U.S.: 49211.” IBIS World Industry Report,
http://www.ibisworld.com/reports/reportdownload.aspx?cid=1&rtid=1&e=1219&ft=pdf (accessed 17 February 2010).
———. “Domestic Airlines in the U.S.: 48111b.” IBIS World Industry Report, (February 4,
2010): 1-42, http://www.ibisworld.com/industry/default.aspx?indid=1125. ———. “International Airlines in the U.S.: 48111a.” IBIS World Industry Report, (February 4,
2010): 1-41, http://www.ibisworld.com/industry/default.aspx?indid=1124. ———. “Long-Distance Freight Trucking in the U.S.: 48412” IBIS World Industry Report,
(January, 2010): 1-40, http://www.ibisworld.com/industryus/default.aspx?indid=1150. ———. “Rail Transportation in the U.S.: 48412” IBIS World Industry Report, (February, 2010):
1-40, http://www.ibisworld.com/industryus/default.aspx?indid=1133.

38
IHS Global Insight Incorporated, “An Evaluation of Maritime Policy in Meeting the Commercial
and Security Needs of the United States: Report to the U.S. Transportation Maritime Administration, (2009).
Likov, Igor, Richard J. Wenning, and Gregory A. Kiker. “Managing Critical Infrastructure
Risks,” (2007) Lippert, Jonathon. "Buffett Takes on Chicago Chokepoint with Burlington (Update2) -
BusinessWeek." http://www.businessweek.com.ezproxy6.ndu.edu/news/2010-02-10/buffett-takes-on-chokepoint-in-chicago-with-burlington-northern.html (accessed 17 March 2010).
Longman, Phillip. "Back on Tracks." Washington Monthly.
http://www.washingtonmonthly.com/features/2009/0901.longman.html (accessed 23 March 2010).
Maritime Administration. Maritime Statistics. Department of Transportation: Washington, DC
http://www.marad.dot.gov/library_landing_page/data_and_statistics/Data_and_Statistics.htm (accessed 19 May 2010).
Mead, Walter Russell, and Jeff Faux, “Beyond NAFTA: A Forum,” The Nation, (28 May 2001):
p.1. http://www.thenation.com/doc/20010528/forum/2. National Surface Transportation Policy and Revenue Study Commission, “Transportation for
Tomorrow,” Report of the National Surface Transportation Policy and Revenue Study Commission, 2007, http://transportationfortomorrow.org/final_report/pdf/volume_1.pdf, (accessed 17 March 2010).
National Transportation Safety Board. “Most Wanted Transportation Safety Improvements--
Original List.” September 1990. Department of Transportation: Washington, DC http://www.ntsb.gov/Recs/mostwanted/original_list.thm. (accessed 26 March 2010).
NYU Press, “Chapter 1: A History of Information Highways and Byways,” Ancient Networks,
http://nyupress.org/professor/webinteaching/history3.shtml, (accessed 23 April 2010). O’Toole, Randal. “Defining Success--The Case Against Rail Transit,” CATO Institute, Policy
Analysis: No. 663, March 24, 2010. Port of Rotterdam Authority. Port Statistics. Rotterdam, The Netherlands. April 2009.
http://www.portofrotterdam.com/mmfiles/Port_Statistics_2009_tcm26-64785.pdf . (accessed 19 May 2010).
Porter, Michael E. “The Five Competitive Forces That Shape Strategy.” Harvard Business
Review, (January 2008): 80-93.

39
Research and Innovation Technology Administration, “Pocket Guide to Transportation 2010”,
Department of Transportation, Washington, DC, January 2010 Rubio, Luis. “NAFTA and Mexico.” Perspectives on the Americas, Center for Hemispheric
Policy, University of Miami, 1-4. (17 July 2008). Schmitz, Jon. “Gasoline tax unable to fill federal highway fund’s tank,” Post-Gazette.com,
(Pittsburgh Post Gazette: 25 January 2009): p. 1. http://www.post-gazette.com/pg/09025/ 944323-85.stm.
Sivasailam, Abbi & Audrey Spaulding. High Speed Rail Predicted to Travel Much Slower Than
Advertised, 2009, Show-Me Institute, St. Louis, MO (accessed 16 February 2010) Stagl, Jeff. “Railroads have until April 16 to submit PTC Roll-Out Plans.” Progressive
Railroading: Industry News, February 17 2010. http://www.progressiveroading.com/pr/article.asp?id=22582. (accessed 18 February 2010).
Staley, Samuel, “Gas Tax Increase or Private Capital?,” Reason Foundation, (16 July 2008): 1.
http://reason.org/news/printer/gas-tax-increase-or-private-ca. Stellin, Susan. “Lessons from the Icelandic Volcano Eruption,” New York Times Travel Section,
http://www.nytimes.com/2010/05/02/travel/02prac.html, April 28, 2010 Stewart, Mark G. and John Mueller. “A Risk and Cost-Benefit Assessment of United States
Aviation Security Measures.” Cryptome.org. http://cryptome.org/avsec-assess.pdf. Taylor, Kelly. “Coming Through! The NAFTA Super Highway.” in Infowars.com. (New
American, August 2006).1-5. http://www.infowars.com/articles/nwo/nafta_superhighway_ coming_through.htm.
Tiron, Roxana, “Easing Congestion”, Seapower, February 2010 Tokarski, Kevin, “Maritime Administration America’s Advocate for the Maritime Industry”,
presentation, 29 January 2010 to ICAF Transportation Industry Study Group. TRIP, The Road Information Program. “Key Facts About America’s Road and Bridge
Conditions and Federal Funding – Updated November 2005,” http://www.tripnet.org/nationalfactsheet.htm. (accessed 5 March 2010).
Union Internationale des Chemins de Fer (UIC), Presentation to ICAF Transportation Industry
Study, Paris, France, May 10, 2010.
40
United States Chamber of Commerce – “The Transportation Challenge - Moving the U.S.
Economy " http://www.uschamber.com/publications/reports/0804transportationchallenge (accessed 17 March 2010).
United States Department of Transportation website, “DOT Information Related to the American
Recovery and Reinvestment Act of 2009 (Recovery Act)” http://www.dot.gov/recovery, March 18, 2010.
United States Government Accountability Office. "Freight Transportation: National Policy and
Strategies can Help Improve Freight Mobility." United States Government Accountability Office. http://www.gao.gov/new.items/d08287.pdf (accessed 30 March 2010).
———. Highway Trust Fund, Improved Solvency Mechanisms and Communication Needed to
Help Avoid Shortfalls in the Highway Account. Report to the Committee on Environment and Public Works, U.S. Senate, Washington, D.C., Government Printing Office, 2009.
———. “Physical Infrastructure: Challenges and Investment Options for the Nation’s
Infrastructure.” Testimony Before the Committee on the Budget and the Committee on Transportation Infrastructure, U.S. House of Representatives, GAO-08-763T. Washington DC, May 8, 2008.
Vantuono, William. "2010 FREIGHT RAIL OUTLOOK." RailwayAge Magazine.
http://www.railwayage.com/in-this-issue/2010-freight-rail-outlook.html (accessed 23 March 2010).
———. “BNSF Starts Positive Train Control Trial—North American Viewpoint.”
International Railway Journal, March 2004, available through BNET, http://findarticles.com/p/articles/mi_m0BQQ/is_3_44/ai_114629906/. (accessed 16 February 2010).
———. “Why PTC Matters More Than Ever.” Railway Age, May 2009.
http://www.nxtbook.com/nxtbooks/sb/ra0509/index.php?startid=24#/26. Accessed 17 March 2010.
———. Editor. “Railroader of the Year.” Railway Age, January 2009.
http://www.railwayage.com/A/feature1.html. (accessed 16 February 2010). Wabtec Corporation. “ETMS.” http://www.wabtec.com/railroad/etms.asp. (accessed 16
February 2010). Watson, Steve. “NASCO-Ron Paul is “Confused” About…NAFTA Superhighway.” in
Infowars.com. (18 December 2007). pp. 1-6. http://www.bibliotecapleyades.net/sociopolitica/ sociopol_globalization11.htm.
41
Wilson, R.A., Transportation in America, Eighteenth Edition (Washington, D.C.:
EnoTransportation Foundation, Inc., 2001). Windsor, Barbara, President and CEO of Hahn Transportation Company, speaking to the
Committee on Committee on House Ways and Means Subcommittee on Select Revenue Measures, on July 23, 2009, “Highway Trust Fund Financing,” Congressional Testimony, Item 32Y1298863381, http://ezproxy6.ndu.edu/login?url=http://search.ebscohost. com/login. aspx? direct=true&db=mth&AN=32Y1298863381&site=ehost-live.
Young, James R. "Freight Train Blues - Lead Features - Infrastructure US | GDS Publishing."
US Infrastructure. http://www.americainfra.com/article/Freight-Train-Blues/ (accessed 3/17/2010).