Embed Size (px)
Citation preview


IEEE LOLE Working Group Meeting July 21-22, 2016
2
Alex Crawford Southwest Power Pool [email protected]
SPP LOLE Efforts
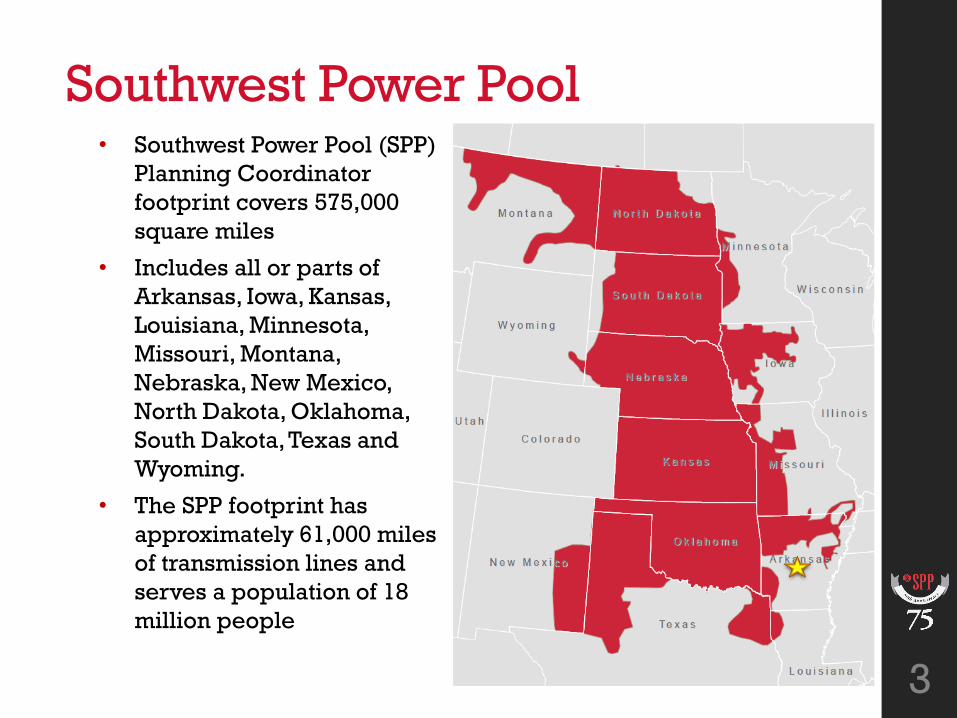
Southwest Power Pool
3
• Southwest Power Pool (SPP)
Planning Coordinator
footprint covers 575,000
square miles
• Includes all or parts of
Arkansas, Iowa, Kansas,
Louisiana, Minnesota,
Missouri, Montana,
Nebraska, New Mexico,
North Dakota, Oklahoma,
South Dakota, Texas and
Wyoming.
• The SPP footprint has
approximately 61,000 miles
of transmission lines and
serves a population of 18
million people

SPP Planning Reserve Margin
• Planning Reserve Margin Requirement is based on Entity’s forecasted peak, not SPP peak
• Current PRM Requirement Each Load Serving Member’s Minimum Required Reserve
Margin is 13.6%. If a Load Serving Member’s System Capacity is comprised of at least 75% hydro-based generation, then such Load Serving Member’s Minimum Required Reserve Margin is 9.89% Requirement set in 1998
• Future PRM Requirement Each Load Responsible Entities (LRE) Minimum Required
Planning Reserve Margin is 12.0%. If a LRE’s System Capacity is comprised of at least 75% hydro-based generation, then such LRE’s Minimum Required Planning Reserve Margin is 9.89% June 2017 effective date
Summer Peak Season reserve margin requirement
4

SPP Application of the “1 in 10” Criteria
• LOLE is measured in days/year (1day/10year criteria)
• SPP equates any event, regardless of duration, in a day, to a daily event (i.e., any one or more hours in a day equates to a day-long event)
5

LOLE Study Characteristics
• Software used: GridView
• Calculates LOLE for SPP Entities
• Uses nodal model with NERC LTRA Demand and Capacity forecast incorporated to create a GridView model
• Monte Carlo analysis (probabilistic analysis)
• Load multipliers chosen randomly
• Generator outages based on maintenance schedule and random through Equivalent Forced Outage Rates (EFOR)
• Minimum of 3000 simulations/year performed (26,280,000 hours)
• LOLE analysis performed on years 2 and 5
• Typical runtime is approximately 75 hours for each study
6

LOLE Data Inputs
• Area load shapes
• Thermal / Variable Generation data
• Historical wind shapes
• Flowgate and Contingency data
• Transactions (Imports / Exports)
• Load uncertainty data
• Nodal transmission topology
• Generation outage data
• Operational guidelines 7
LOLE
Uncertainty
Capacity
Load
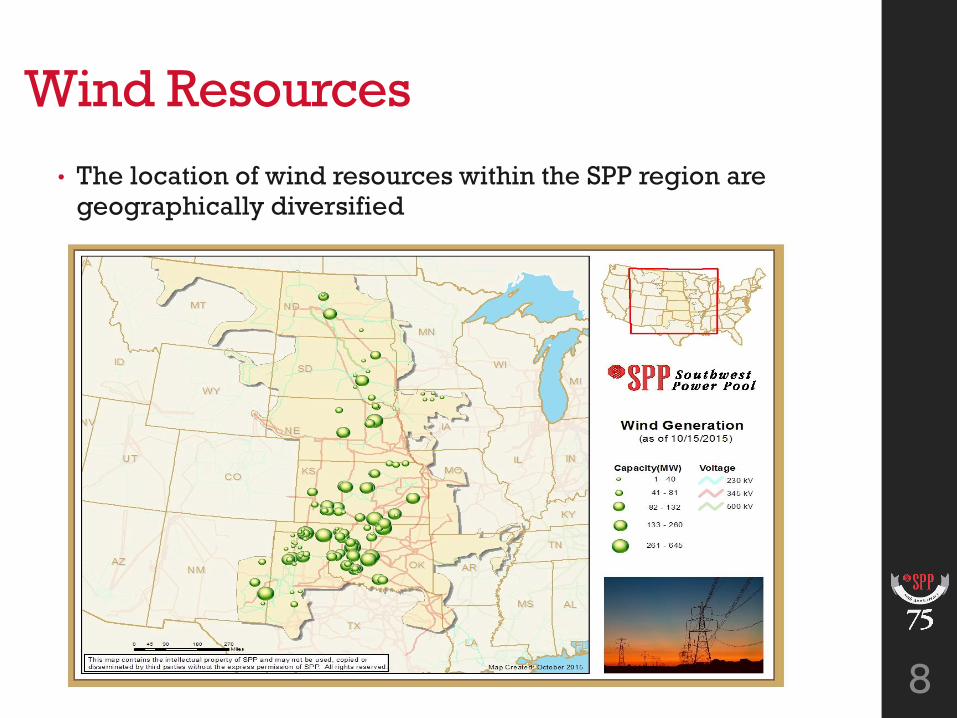
Wind Resources
• The location of wind resources within the SPP region are geographically diversified
8

Wind Resources
• The example shows four historical hourly wind output values for five years and the normalized, averaged hourly wind shape value compared historical values
9

Additional Assumptions
• Nodal modeling of topology, bus, load, and generator data
• Incorporation of flowgate and contingent elements information
• Monitor branches 230 kV and above
• Monitor all branch interfaces with external regions
• Adjustment of reserve margin by increase of load
10
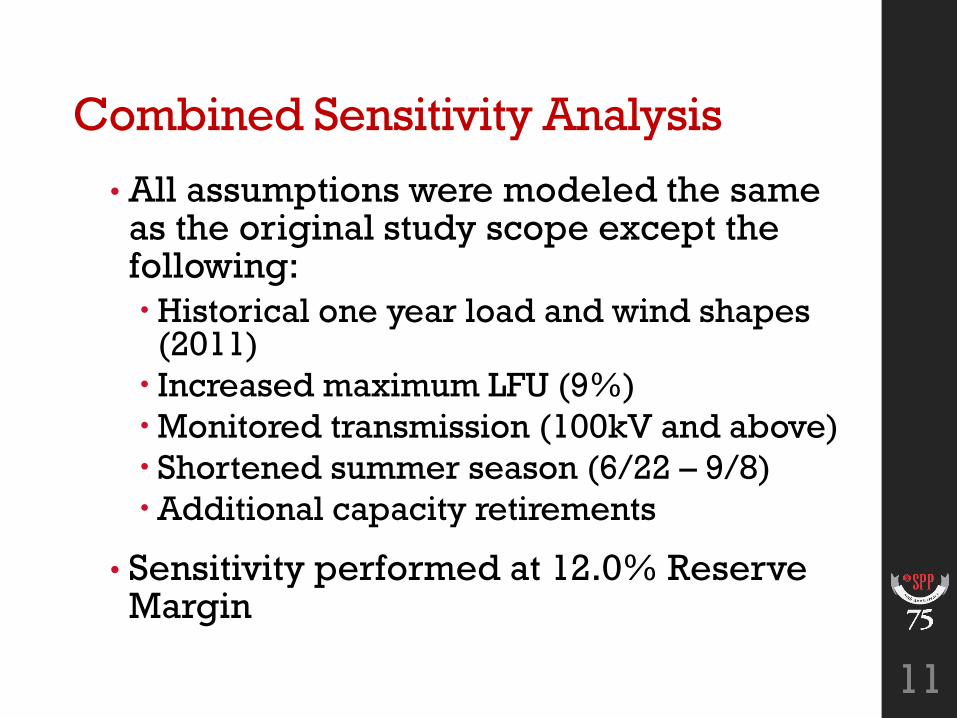
Combined Sensitivity Analysis
• All assumptions were modeled the same as the original study scope except the following:
Historical one year load and wind shapes (2011)
Increased maximum LFU (9%)
Monitored transmission (100kV and above)
Shortened summer season (6/22 – 9/8)
Additional capacity retirements
• Sensitivity performed at 12.0% Reserve Margin
11

Combined Sensitivity Analysis
12

Impacts of adjusting SPP Reserve Margin
• Goal is to maintain reliability as economically as possible
• Benefits of a lower Planning Reserve Margin
Financial savings due to reduction in generation investment
Could align with generation retirements due to EPA regulation
Demonstrates the value of Transmission upgrades
13

LOLE Hurdles and Issues in SPP
• How to incorporate wind uncertainty variability
• Forced outage modeling for partial outages
• How to incorporate transmission availability
• Forced outage rates for interregional transactions
• Modeling energy availability of demand response programs and behind-the-meter resources
• Hydro availability limitations
• Seasonal limitations
14

Questions
15
Are there any questions?