Embed Size (px)
Citation preview
International Conference on Communication, Media, Technology and Design 24 - 26 April 2014, Istanbul – Turkey
250
Sports and Social Media: Twitter Usage Patterns during the 2013 Super Bowl Broadcast Hyeoncheol Lee Department of Computer & Information Sciences, Towson University Youngsub Han Department of Computer & Information Sciences, Towson University Kwangmi Ko Kim Dept. of Mass Communication and Communication Studies, Towson University [email protected] Yanggon Kim, Ph.D. Department of Computer & Information Sciences, Towson University ABSTRACT This study explores how Twitter users reproduced or contested the Super Bowl XLVII in reaction to a real-time televised broadcast. The diffusion of innovation theory is adopted as a framework for this study since it provides a systematic explanation of how an innovation is communicated through communication channels in a social system. Guided by this theory, this study aims to analyze Twitter patterns and its usage amounts at a macro-level in the context of media convergence. Instead of relying on the audience’s responses, this study adopts a hybrid approach, combining a data-mining approach to collect, filter and analyze a massive amount of tweets with manual content analysis. This study used all possible tweets about the Super Bowl game, not just Twitter feeds of high profile organizations, such as NFL. This macro-level analysis sheds light on when people are more engaged during a broadcast. Implications for researchers and professionals are addressed. Since Twitter was launched in 2006, the number of tweets a day has increased from 300,000 in 2008 to 200 million in 2011, and to 340 million by February 2013, making it one of the fastest growing social media platforms (“200 million Tweets,” 2011; “What is Twitter?” 2012). According to the Pew Research Center’s Internet & American Life Project, 15% of online adults in the U.S. used Twitter in 2012. While the overall Twitter adoption remains steady, the proportion of online adults who use Twitter on a typical day has increased to 8% in 2012 from 4% in 2011 and 2% in 2010. African-Americans, urban and suburban residents, and young adults (ages 18-29) have been identified as heavy Twitter users (Smith & Brenner, 2012). Technologies, including social media and mobile delivery systems, have diversified the sports consumption habits and patterns, and further allowed them to produce their own versions of sports events through various social media platforms (Hutchins, 2011). Instead of consuming one-time broadcast through TV within a designated and fixed time frame, the audiences watch all or portions of sports events whenever and wherever they want. In addition, they use mobile phones at live events to capture meaningful moments or share their experiences with friends or families who might be watching the event on television. Twitter is particularly being used in the institutional and cultural reorganization of media sport for the digital age and plays a vital role in “Telepresence,” where people keep in touch without physically being in touch (Tomlinson, 2007; Hutchins 2011). In 2013, 108.41 million viewers, a 3 million decrease from 2012’s viewership, tuned in to Super Bowl XLVII (“Super Bowl Ratings Decline,” 2013). According to Nielsen measures, the game earned an average overnight household rating of 46.3, meaning that 46.3% of households with TVs were watching this program, making it the second-highest-rated Super Bowl in 27 years, and still the biggest TV event of the year (“CBS Claims Record Super Bowl Ratings in Early Tally,” 2013). With such a large viewership, it is no wonder that the Super Bowl is also one of the most popular advertising venues, despite a hefty average cost of $3.5 million per 30-second spot. Highlighting the growing presence of the Super Bowl on social media, Advertising Age, a major advertising and marketing trade journal, partnered with Bluefin Labs, a Cambridge-based social TV analytics company, and reported in 2012 that more than 12.2 million social media comments were tracked during and after the game, primarily on Twitter and Facebook. Reportedly, this was a 578% increase from 2011, which had 1.8 million posts and exchanged comments (Dumenco, 2012).
The 2013 Super Bowl XLVII was considered one of the most exciting games, yielding a final score of 34 - 31 with 7 touchdowns, 6 field goals, and one safety. Particularly, this year’s Super Bowl game kept the audience’s attention to the last minute, making the time between 10:30 pm and 10:45 pm the most watched part of the game (“CBS Claims,” 2013). In addition, the game yielded several NFL records, such as the touchdown by a 190-yard kick-
International Conference on Communication, Media, Technology and Design 24 - 26 April 2014, Istanbul – Turkey
251
return (4th touchdown), a touchdown by a quarterback, and a 34-minute blackout due to a power outage, marked the dynamic nature of the game. Therefore, the 2013 Super Bowl game would provide good case material to examine multimedia experiences between television and Twitter. As more audiences are multitasking during TV viewing, it becomes important for media, marketing and advertising professionals to gain a better understanding of audience behavior, focusing on how they use specific platforms. This study focuses on Twitter, one of the fastest growing forms of new media, and explores how Twitter users reproduced or contested the Super Bowl XLVII in reaction to a real-time televised broadcast. It aims to capture and analyze Twitter patterns and its usage amounts at a macro-level in the context of media convergence by using a data-mining approach.
LITERATURE REVIEW AND RESEARCH QUESTIONS The Audience’s Media Use in the Media Convergence Era Early studies on the audience’s media use indicate that traditional media use, such as television viewing, declined because of the increase in Internet use (Coffey & Stipp, 1997). Later, researchers observed that Internet use may not necessarily reduce time people spent on other media (Cooper & Tang, 2009). When facing an expanded media menu, media users increasingly use two or more media simultaneously, or use one media to encourage or enhance a different medium use. A common assumption held by social psychologists and technology adoption researchers is that few media can fulfill all the goals audiences seek. Accordingly, the audiences select certain media based on their perceived functionality (Ferguson & Perse, 2000; Lin, 2006; Papacharissi & Rubin, 2000). Literature on this indicates similar motives or functions on why people choose certain types of media. Papacharissi and Rubin (2000) summarized five motivations—interpersonal utility, pastime, information-seeking, convenience, and entertainment—that predict Internet use. Lin (2006) found that motives such as infotainment, escape, and interpersonal communication were related to overall Webcast viewing interest. Further, Hong and Raney (2007) demonstrated that entertainment, information, and perceived interactivity explained why people visited sports sites. Technology adoption literature further suggests that perceived usefulness, perceived ease of use, attitude, social norms, and perceived behavioral control have an impact on the adoption and actual use of new technologies (e.g., Lederer, Maupin, Sena, & Zhuang, 2000; Porter & Donthu, 2006). Porter and Donthu (2006) suggest that perceptions regarding usefulness and ease of use influenced online media use. Kaye (1998) found that the perceived informational learning and interaction utilities could predict use of the popular Web sites. Lin (2006) demonstrated that perceived utilities acted as a significant predictor of the adoption of Webcasting. Sports, New Media, and Twitter Transformed sports consumption patterns through new technologies have generated solid literature on the growing importance of the Internet and social media in sports media. Overall, literature on sports and new media has focused on small segments of audiences, such as sports bloggers, sports fans, online streamed sports events viewers, sport video gamers and Internet sports community members (Conway, 2010; Crawford & Gosling, 2009; Plymire, 2009; Oates, 2009; Schultz and Sheffer, 2011; Jone, 2010; Tang and Cooper, 2012; Cheever, 2009). One line of literature on this focuses on the gender differences in the social media use. Lam (2001) found that compared to their female counterparts, males were more likely to use streaming videos or Webcasting, while Lin (2004) observed that being female (instead of male) was a better predictor of the adoption of Webcasting. Surveying about 5,000 U.S. adults, Schultz and Sheffer (2011) reported that there was almost no gender difference for the overall social media use for sports. However, among those who identified themselves as “regular” or “occasional” users of the social media for sports, they found that women showed significantly higher levels of social media use for sports than men. In their analysis of the audience’s multiplatform experiences with the 2008 Beijing Olympic Games, Tang and Cooper (2012) found that men and women spent similar amounts of total time watching the Olympics on various platforms, including an NBC broadcast outlet. At the same time, men spent more time watching sports events and newscasts and are more motivated to watch sports than women. Overall, previous literature shows inconsistent results in terms of the relationship between gender groups and their use of new media. Another line of literature on sports and new media is about the social and information functions that new media play in the world of sports media. Sanderson and Kassing (2011) observed three specific ways in which blogs and Twitter significantly played a role in sports media: transformative, adversarial, and integrative. With a transformative function, blogs and Twitter allowed professional athletes to bypass “the voices” of journalists and to gain more control over what information gets presented to their fans and the public, as well as, how they are represented. In addition, blogs and Twitter made relational conflict between athletes and sport reporters or sports organizations more visible to the public and enabled athletes to be more assertive in rebutting or nullifying any inaccurate elements in sports reporting. While these transformative and adversarial functions of blogs and Twitter benefit athletes, the audiences also benefit by receiving sports information from multiple sources. Sanderson and Kassing (2011) noted that blogs and Twitter integrate “the perspectives of athletes, sports journalists, and fans into sports media stories” (p. 120).
International Conference on Communication, Media, Technology and Design 24 - 26 April 2014, Istanbul – Turkey
252
Overall, the current literature on sports and social media has covered the motivations of sports audiences, the usage of social media including Twitter, and the social media consumption for sports by demographic groups. What is still missing is the understanding of Twitter use in the context of real-time broadcast. Twitter is currently the most publicized online media platform where digital instantaneity is manifest (Hutchins, 2011), and Twitter has had a significant impact on the social landscape of professional sports (Wertheim, 2011). Even so, little research has been conducted to analyze Twitter usage and its patterns while a sports event is broadcasting. As research on Twitter is still in its infancy, it would be interesting and important to build an understanding of how Twitter is utilized while a sports event broadcasts on TV. Instead of relying on the audience’s response, this study adopts the diffusion of innovation theory as a theoretical framework and analyzes the tweet usage patterns through a hybrid approach, combining a data-mining approach to collect, filter and analyze a massive amount of tweets with manual content analysis. The Diffusion of Innovation Theory The diffusion of innovation theory is adopted as a framework for this study since it provides a systematic explanation of how an innovation is communicated through communication channels among social members (Rogers, 2003). The theory posits that certain factors influence the diffusion process, and previous studies identified variables influencing the diffusion process into three clusters: the characteristics of diffusion networks (e.g., a group’s tie strength), the impact of innovation sharers (e.g., opinion leaders), and the nature/characteristics of the innovation itself (Chu, 2009; Steffes & Burgee, 2009; Wejnert, 2002). Here, the innovation can be an idea, practice, or object that is perceived as relatively new by individuals (Rogers, 2003). This theory provides an insight on understanding how information has been disseminated in social media. Out of the three factors, this study focuses only on the third factor, the characteristics of innovation itself. According to the diffusion theory, perceived attributes of innovations are influential in impacting individuals’ attitudes and behaviors which further affect the rate of innovation diffusion (Rogers, 2003). This study regards the Super Bowl game as innovation and considers that the dynamic nature of the game and contexts of the game might influence the process of communications in social media. In other words, the nature of the game itself may exert an influence on sharing behavior as it draws more attentions or interests among users. As an exploratory study, this study tries to answer the following research questions rather than to test any specific hypothesis: 1. How does the overall number of tweets differ between a game day and non-game day? 2. How does the overall number and usage of tweets correspond to real-time contexts of the game, such as scoring moments and other dynamic moments? Do some scoring moments have more tweets? What is the relationship between non-scoring moments and the number of tweets at those times? 3. Does the nature of the game have any relation with commercial-related tweets? Has the number of commercial-related tweets increased during dynamic or scoring moments? 4. What major topics in commercial-related tweets were exchanged during the 2013 Super Bowl game? METHODS AND PROCEDURES Main Method of Data Analysis: As survey, experiment, and content-analysis methods are conventional research methods in the mass communication field, the data-mining techniques are well-adopted in the computer science field and allow researchers to handle a huge amount of data and discover knowledge and information from those data sets (Byun et al., 2012; King, Li and Chan, 2009). As the amount of tweets on Super Bowl games is enormous, it is not possible to retrieve, filter, analyze, and visualize them without automated-tools and well-defined approaches. For this reason, data-mining techniques and computational data analyzing approaches, such as topic detection, were applied in this study. Such an approach is not new as a hybrid approach to computational and manual methods has received recognition to handle Big Data generated by internet and social media (Bruns & Burgess, 2012; Lewis, Zamith, and Hermida, 2013). Study Period: The Super Bowl XLVII was held on Sunday, Feb. 3, 2013. Two other Sundays (one week prior to the game and one week following the game) were chosen as references to compare to the Super Bowl game day. So, tweets of three days (January 27, Feb. 3, and Feb. 10) from 6:00 pm to 11:59 pm were collected. Data “Population” and “Sample” for the Analysis: Data “Population” includes all tweets exchanged on each of three Sundays. Out of this data set, the data “sample” is comprised of Super Bowl-related tweets. To identify this sample data set, several keywords were used for a filtering process in the following three categories: the 2013 Super Bowl (e.g., any words related to the title of the game), related people (e.g., names of coaches and players), and American football terms (e.g., touchdowns and field goals). Only tweets written in English were collected due to the nature of the algorithm we developed. For example, if someone tweeted about the Super Bowl in English from India, those tweets were included in data set. All tweets were grouped by minute to track the movements of the tweets related to the Super Bowl game during broadcasting. Then, the total number of tweets per minute was visualized with line graphs. To examine the trends of Twitter use, we analyzed the number of total tweets against specific dynamic moments of the game. Commercial-related tweets were identified by using keywords including names of brands and commercials broadcasted in Super Bowl 2013, and the contents of selected tweets were content analyzed to find major topics.
International Conference on Communication, Media, Technology and Design 24 - 26 April 2014, Istanbul – Turkey
253
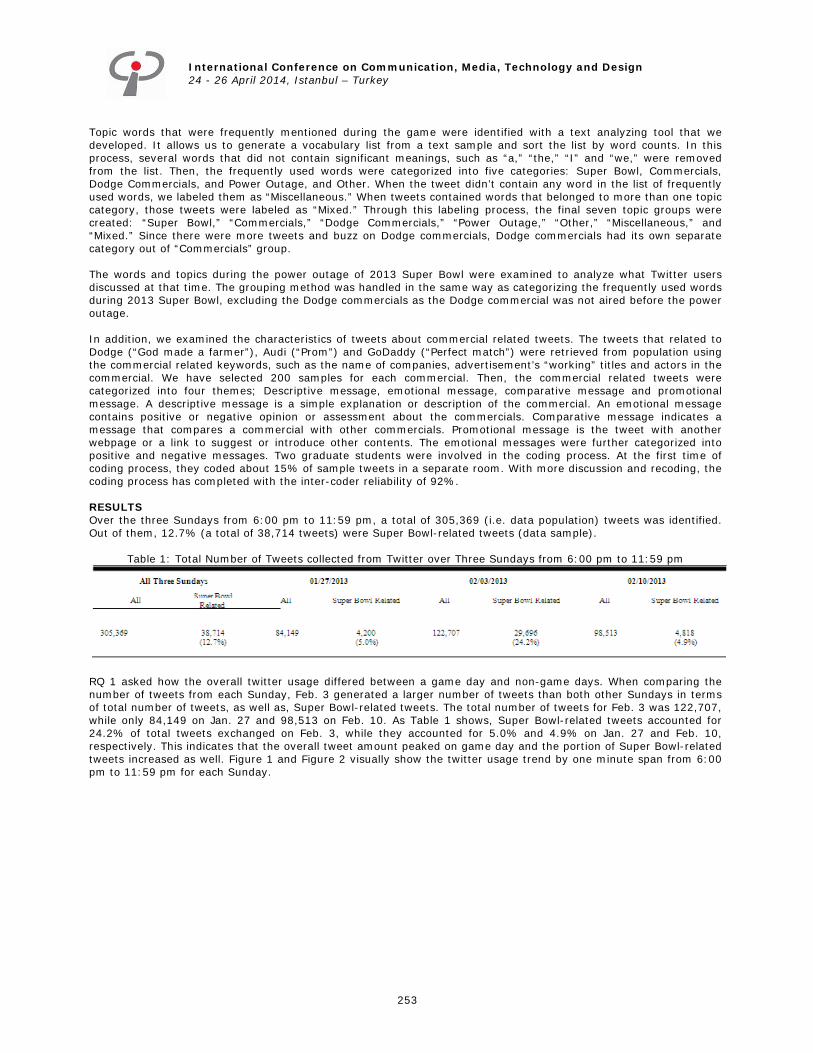
Topic words that were frequently mentioned during the game were identified with a text analyzing tool that we developed. It allows us to generate a vocabulary list from a text sample and sort the list by word counts. In this process, several words that did not contain significant meanings, such as “a,” “the,” “I” and “we,” were removed from the list. Then, the frequently used words were categorized into five categories: Super Bowl, Commercials, Dodge Commercials, and Power Outage, and Other. When the tweet didn’t contain any word in the list of frequently used words, we labeled them as “Miscellaneous.” When tweets contained words that belonged to more than one topic category, those tweets were labeled as “Mixed.” Through this labeling process, the final seven topic groups were created: “Super Bowl,” “Commercials,” “Dodge Commercials,” “Power Outage,” “Other,” “Miscellaneous,” and “Mixed.” Since there were more tweets and buzz on Dodge commercials, Dodge commercials had its own separate category out of “Commercials” group. The words and topics during the power outage of 2013 Super Bowl were examined to analyze what Twitter users discussed at that time. The grouping method was handled in the same way as categorizing the frequently used words during 2013 Super Bowl, excluding the Dodge commercials as the Dodge commercial was not aired before the power outage. In addition, we examined the characteristics of tweets about commercial related tweets. The tweets that related to Dodge (“God made a farmer”), Audi (“Prom”) and GoDaddy (“Perfect match”) were retrieved from population using the commercial related keywords, such as the name of companies, advertisement’s “working” titles and actors in the commercial. We have selected 200 samples for each commercial. Then, the commercial related tweets were categorized into four themes; Descriptive message, emotional message, comparative message and promotional message. A descriptive message is a simple explanation or description of the commercial. An emotional message contains positive or negative opinion or assessment about the commercials. Comparative message indicates a message that compares a commercial with other commercials. Promotional message is the tweet with another webpage or a link to suggest or introduce other contents. The emotional messages were further categorized into positive and negative messages. Two graduate students were involved in the coding process. At the first time of coding process, they coded about 15% of sample tweets in a separate room. With more discussion and recoding, the coding process has completed with the inter-coder reliability of 92%. RESULTS Over the three Sundays from 6:00 pm to 11:59 pm, a total of 305,369 (i.e. data population) tweets was identified. Out of them, 12.7% (a total of 38,714 tweets) were Super Bowl-related tweets (data sample).
Table 1: Total Number of Tweets collected from Twitter over Three Sundays from 6:00 pm to 11:59 pm
RQ 1 asked how the overall twitter usage differed between a game day and non-game days. When comparing the number of tweets from each Sunday, Feb. 3 generated a larger number of tweets than both other Sundays in terms of total number of tweets, as well as, Super Bowl-related tweets. The total number of tweets for Feb. 3 was 122,707, while only 84,149 on Jan. 27 and 98,513 on Feb. 10. As Table 1 shows, Super Bowl-related tweets accounted for 24.2% of total tweets exchanged on Feb. 3, while they accounted for 5.0% and 4.9% on Jan. 27 and Feb. 10, respectively. This indicates that the overall tweet amount peaked on game day and the portion of Super Bowl-related tweets increased as well. Figure 1 and Figure 2 visually show the twitter usage trend by one minute span from 6:00 pm to 11:59 pm for each Sunday.
International Conference on Communication, Media, Technology and Design 24 - 26 April 2014, Istanbul – Turkey
254
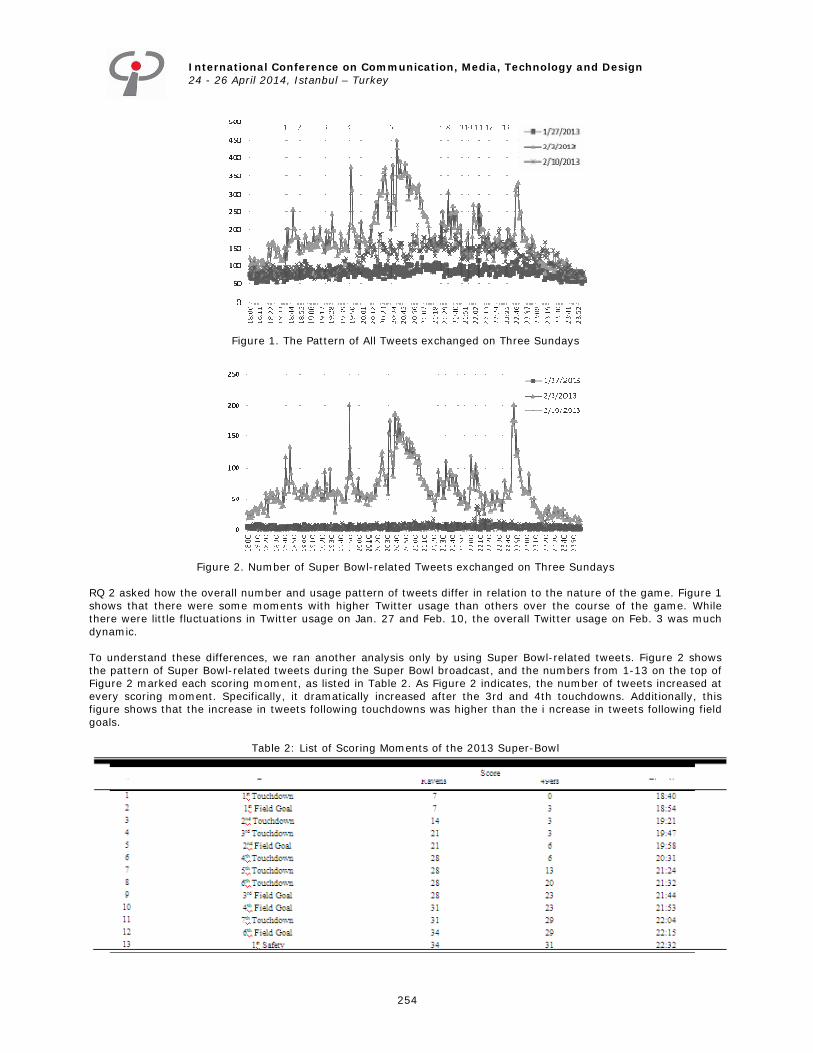
Figure 1. The Pattern of All Tweets exchanged on Three Sundays
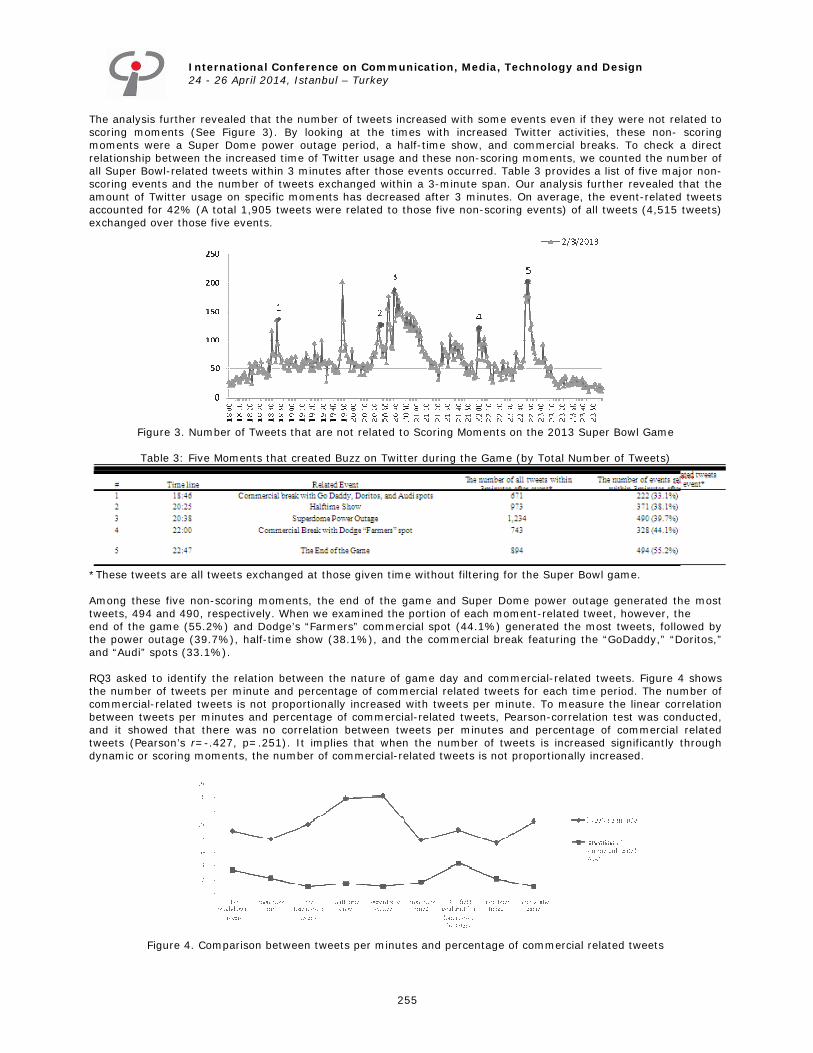
Figure 2. Number of Super Bowl-related Tweets exchanged on Three Sundays
RQ 2 asked how the overall number and usage pattern of tweets differ in relation to the nature of the game. Figure 1 shows that there were some moments with higher Twitter usage than others over the course of the game. While there were little fluctuations in Twitter usage on Jan. 27 and Feb. 10, the overall Twitter usage on Feb. 3 was much dynamic. To understand these differences, we ran another analysis only by using Super Bowl-related tweets. Figure 2 shows the pattern of Super Bowl-related tweets during the Super Bowl broadcast, and the numbers from 1-13 on the top of Figure 2 marked each scoring moment, as listed in Table 2. As Figure 2 indicates, the number of tweets increased at every scoring moment. Specifically, it dramatically increased after the 3rd and 4th touchdowns. Additionally, this figure shows that the increase in tweets following touchdowns was higher than the i ncrease in tweets following field goals.
Table 2: List of Scoring Moments of the 2013 Super-Bowl
International Conference on Communication, Media, Technology and Design 24 - 26 April 2014, Istanbul – Turkey
255
The analysis further revealed that the number of tweets increased with some events even if they were not related to scoring moments (See Figure 3). By looking at the times with increased Twitter activities, these non- scoring moments were a Super Dome power outage period, a half-time show, and commercial breaks. To check a direct relationship between the increased time of Twitter usage and these non-scoring moments, we counted the number of all Super Bowl-related tweets within 3 minutes after those events occurred. Table 3 provides a list of five major non-scoring events and the number of tweets exchanged within a 3-minute span. Our analysis further revealed that the amount of Twitter usage on specific moments has decreased after 3 minutes. On average, the event-related tweets accounted for 42% (A total 1,905 tweets were related to those five non-scoring events) of all tweets (4,515 tweets) exchanged over those five events.
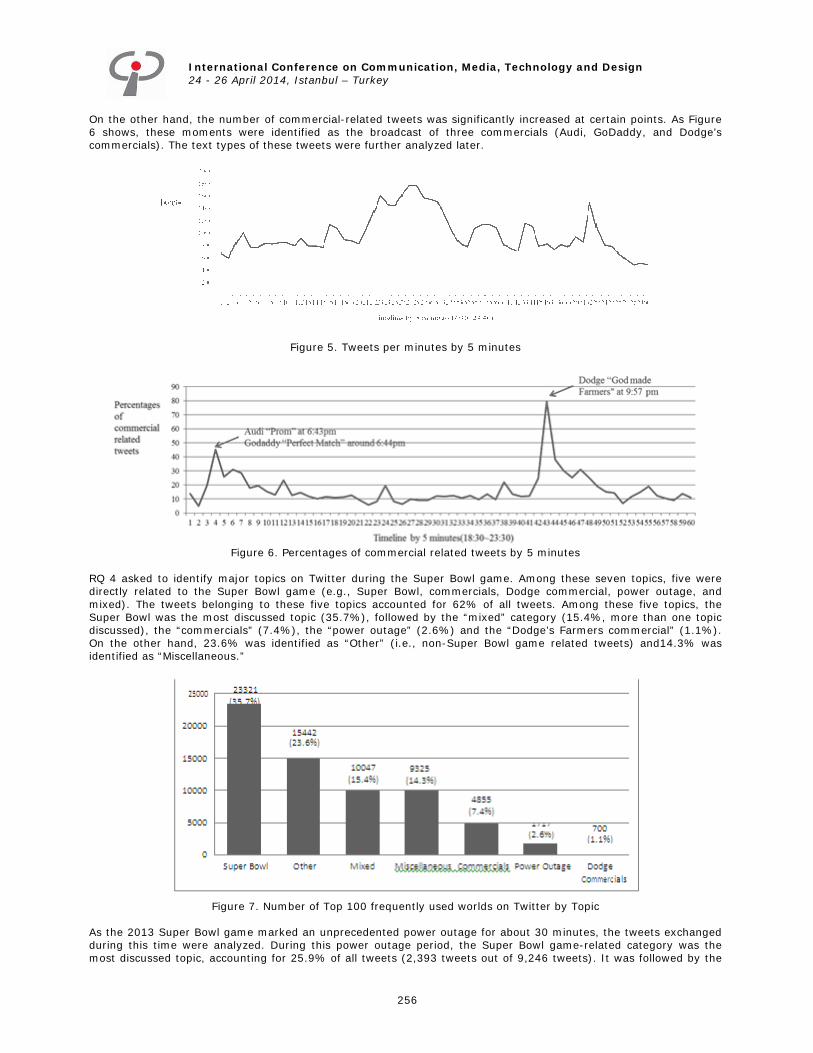
Figure 3. Number of Tweets that are not related to Scoring Moments on the 2013 Super Bowl Game
Table 3: Five Moments that created Buzz on Twitter during the Game (by Total Number of Tweets)
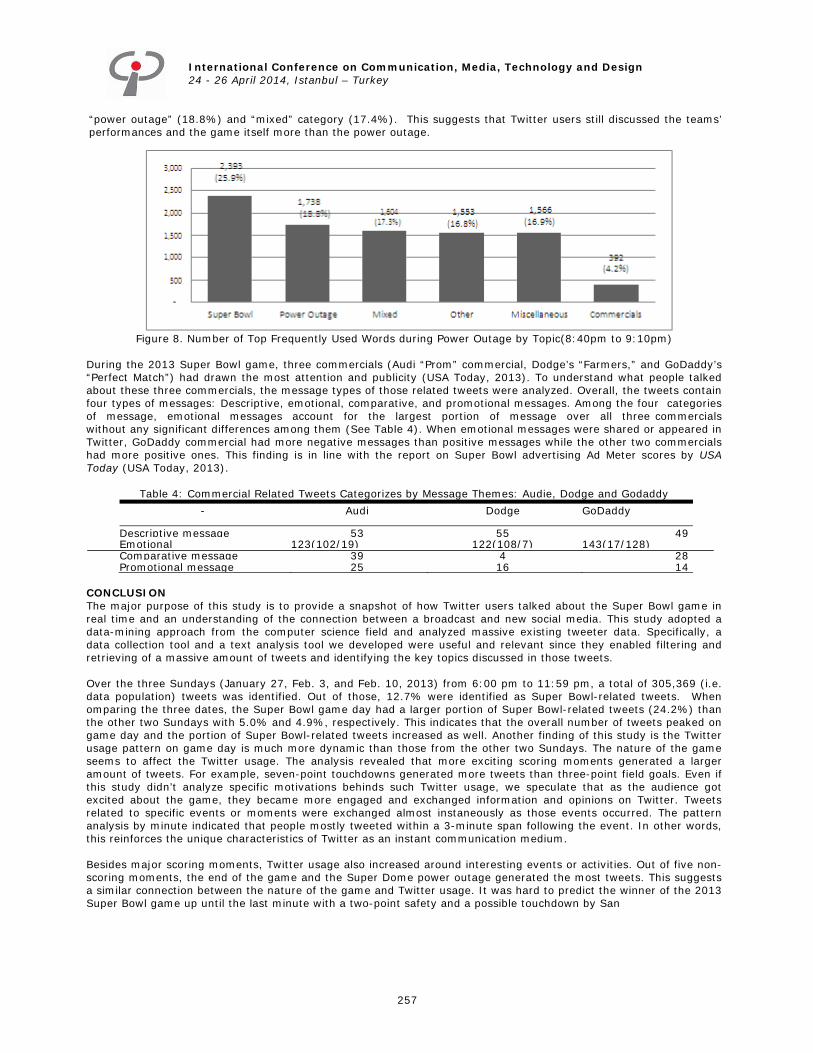
*These tweets are all tweets exchanged at those given time without filtering for the Super Bowl game. Among these five non-scoring moments, the end of the game and Super Dome power outage generated the most tweets, 494 and 490, respectively. When we examined the portion of each moment-related tweet, however, the end of the game (55.2%) and Dodge’s “Farmers” commercial spot (44.1%) generated the most tweets, followed by the power outage (39.7%), half-time show (38.1%), and the commercial break featuring the “GoDaddy,” “Doritos,” and “Audi” spots (33.1%). RQ3 asked to identify the relation between the nature of game day and commercial-related tweets. Figure 4 shows the number of tweets per minute and percentage of commercial related tweets for each time period. The number of commercial-related tweets is not proportionally increased with tweets per minute. To measure the linear correlation between tweets per minutes and percentage of commercial-related tweets, Pearson-correlation test was conducted, and it showed that there was no correlation between tweets per minutes and percentage of commercial related tweets (Pearson’s r=-.427, p=.251). It implies that when the number of tweets is increased significantly through dynamic or scoring moments, the number of commercial-related tweets is not proportionally increased.
Figure 4. Comparison between tweets per minutes and percentage of commercial related tweets
International Conference on Communication, Media, Technology and Design 24 - 26 April 2014, Istanbul – Turkey
256
On the other hand, the number of commercial-related tweets was significantly increased at certain points. As Figure 6 shows, these moments were identified as the broadcast of three commercials (Audi, GoDaddy, and Dodge’s commercials). The text types of these tweets were further analyzed later.
Figure 5. Tweets per minutes by 5 minutes
Figure 6. Percentages of commercial related tweets by 5 minutes
RQ 4 asked to identify major topics on Twitter during the Super Bowl game. Among these seven topics, five were directly related to the Super Bowl game (e.g., Super Bowl, commercials, Dodge commercial, power outage, and mixed). The tweets belonging to these five topics accounted for 62% of all tweets. Among these five topics, the Super Bowl was the most discussed topic (35.7%), followed by the “mixed” category (15.4%, more than one topic discussed), the “commercials” (7.4%), the “power outage” (2.6%) and the “Dodge’s Farmers commercial” (1.1%). On the other hand, 23.6% was identified as “Other” (i.e., non-Super Bowl game related tweets) and14.3% was identified as “Miscellaneous.”
Figure 7. Number of Top 100 frequently used worlds on Twitter by Topic
As the 2013 Super Bowl game marked an unprecedented power outage for about 30 minutes, the tweets exchanged during this time were analyzed. During this power outage period, the Super Bowl game-related category was the most discussed topic, accounting for 25.9% of all tweets (2,393 tweets out of 9,246 tweets). It was followed by the
International Conference on Communication, Media, Technology and Design 24 - 26 April 2014, Istanbul – Turkey
257
“power outage” (18.8%) and “mixed” category (17.4%). This suggests that Twitter users still discussed the teams’ performances and the game itself more than the power outage.
Figure 8. Number of Top Frequently Used Words during Power Outage by Topic(8:40pm to 9:10pm)
During the 2013 Super Bowl game, three commercials (Audi “Prom” commercial, Dodge’s “Farmers,” and GoDaddy’s “Perfect Match”) had drawn the most attention and publicity (USA Today, 2013). To understand what people talked about these three commercials, the message types of those related tweets were analyzed. Overall, the tweets contain four types of messages: Descriptive, emotional, comparative, and promotional messages. Among the four categories of message, emotional messages account for the largest portion of message over all three commercials without any significant differences among them (See Table 4). When emotional messages were shared or appeared in Twitter, GoDaddy commercial had more negative messages than positive messages while the other two commercials had more positive ones. This finding is in line with the report on Super Bowl advertising Ad Meter scores by USA Today (USA Today, 2013).
Table 4: Commercial Related Tweets Categorizes by Message Themes: Audie, Dodge and Godaddy
- Audi Dodge GoDaddy
Descriptive message 53 55 49 Emotional 123(102/19) 122(108/7) 143(17/128) Comparative message 39 4 28 Promotional message 25 16 14
CONCLUSION The major purpose of this study is to provide a snapshot of how Twitter users talked about the Super Bowl game in real time and an understanding of the connection between a broadcast and new social media. This study adopted a data-mining approach from the computer science field and analyzed massive existing tweeter data. Specifically, a data collection tool and a text analysis tool we developed were useful and relevant since they enabled filtering and retrieving of a massive amount of tweets and identifying the key topics discussed in those tweets. Over the three Sundays (January 27, Feb. 3, and Feb. 10, 2013) from 6:00 pm to 11:59 pm, a total of 305,369 (i.e. data population) tweets was identified. Out of those, 12.7% were identified as Super Bowl-related tweets. When omparing the three dates, the Super Bowl game day had a larger portion of Super Bowl-related tweets (24.2%) than the other two Sundays with 5.0% and 4.9%, respectively. This indicates that the overall number of tweets peaked on game day and the portion of Super Bowl-related tweets increased as well. Another finding of this study is the Twitter usage pattern on game day is much more dynamic than those from the other two Sundays. The nature of the game seems to affect the Twitter usage. The analysis revealed that more exciting scoring moments generated a larger amount of tweets. For example, seven-point touchdowns generated more tweets than three-point field goals. Even if this study didn’t analyze specific motivations behinds such Twitter usage, we speculate that as the audience got excited about the game, they became more engaged and exchanged information and opinions on Twitter. Tweets related to specific events or moments were exchanged almost instaneously as those events occurred. The pattern analysis by minute indicated that people mostly tweeted within a 3-minute span following the event. In other words, this reinforces the unique characteristics of Twitter as an instant communication medium. Besides major scoring moments, Twitter usage also increased around interesting events or activities. Out of five non-scoring moments, the end of the game and the Super Dome power outage generated the most tweets. This suggests a similar connection between the nature of the game and Twitter usage. It was hard to predict the winner of the 2013 Super Bowl game up until the last minute with a two-point safety and a possible touchdown by San
International Conference on Communication, Media, Technology and Design 24 - 26 April 2014, Istanbul – Turkey
258
Francisco. The dynamic nature of the game was well reflected by the unusually high ratings, which also translated to increased Twitter usage. Also, an unprecedented power outage during the game also marked an increase in Twitter usage. Even though tweets about the power outage during this period increased, it was an unexpected finding that Super Bowl game-related tweets (25.9%) still exceeded the tweets about the power outage (18.8%). Overall, these findings are in line with the diffusion of innovation theory of media as it predicted that the spread of innovation would be different depending on the nature of innovation. On the other hands, this study also yielded an interesting finding that commercial-related tweets were not influenced by the nature of the game. They are rather affected by the nature of commercials. When broadcast commercials were “controversial” as in the case of GoDaddy’s or emotional as in Dodge’s commercials, the tweets surrounding these commercials have increased regardless the scoring moments or other noted moments. This finding has some implications for the advertising industry. First, the placement of ads during the Super Bowl Game might not be as important as advertising and media professionals consider. It is the industry norm that placing advertising in the first quarter costs more than running it in the final quarter. If we could assume that the number of commercial - related tweets indicates the power of advertising effects, we can say that the effects of advertising were more related to the creative nature of advertising rather than to their placements within a program. This speculation leads to the second implication, which is the importance of creative aspects particularly in the mega events such as the Super Bowl game. Implementing ads with strong or controversial creative might be more important for generating buzz among the audiences. These findings and speculations require further systematic analysis in future studies. One of major contributions of this study is that this study is based on all possible tweets about the Super Bowl game from individual users who used Twitter to engage with the game, not just Twitter feeds of high profile organizations, such as NFL. This macro-level analysis sheds light on when people are more engaged during a broadcast. This exploratory study can be further extended and applied to any historical, cultural, or social events, such as the broadcast of the Academy Awards ceremony (The Oscars), the President Inauguration Ceremony, or natural disasters. Such analysis would provide more opportunities for us to understand how and when people tweet. This study is not without limitations. It did not provide an in-depth analysis of the Twitter contents at a micro-level. Accordingly, the motivations or reasons on why people tweeted at certain moments are unknown. In addition, the relationships among Twitter users discussing this topic were not analyzed in this study, and this study does not provide an insight to the understanding of how closely people are connected or who a key player is in the networked world. Adding these areas in the analysis would provide a good literature on the diffusion of innovation theory by examining their roles in the communication process. Future studies could consider such limitations to enhance a better understanding of Twitter and Twitter usage. One suggestion is to compare tweets and retweets in terms of their contents, motivations, and user relationships. One of the unique characteristics of Twitter as a social media platform is the capability of retweeting. The analysis of differences in tweets and retweets might allow us to explore underlying motivations for retweets. This would further provide implications for various organizations and business communities to develop effective communication through Twitter. REFERENCES Bruns, A. & Burgess, J. (2012). Researching news discussion on Twitter: New methodologies. Journalism Studies,13 (5-6), 801-814. Byun, C, Kim, Y, Lee, H, & Kim, K. K. (2012). Automated Twitter data collecting tool and case study with rule- based
analysis. Proceedings of the 14th International Conference on Information Integration and Web- based Applications & Services, 196-204, doi: 10.1145/2428736.2428768
CBS claims record Super Bowl ratings in early tally: Early figures do not include half hour during blackout (February 04, 2013). Advertising Age. Retrieved from www.adage.com.
Cheever, N. (2009). Televised combat sports and men: The uses and gratifications of viewing mixed martial arts. Journal of Sports Media, 4, 24-53.
Chu, S. C. (2009). Determinants of consumer engagement in electronic word-of-mouth in social networking sites. University of Texas at Austin, Austin, USA.
Coffey, S. & Stipp, H. (1997). The interactions between computer and television usage. Journal of Advertising Research, 37(2), 61-67.
Conway, S. (2010). It’s in the game and above the game: An analysis of the users of sports videogames. Convergence, 16, 334-354.
Cooper, R. & Tang, T. (2009). Predicting audience exposure to television in today’s media environment: An empirical integration of active-audience and structural theories. Journal of Broadcasting & Electronic Media, 53(3), 400-418.
Crawford, G. & Gosling, V.K. (2009). More than a game: sports-themed video games and player narratives. Sociology of Sport Journal, 26, 50-66.
Dumenco, S. (2012, Feb. 6), “Five amazing facts about social media and the Super Bowl,” Advertising Age, Retrieved from http://adage.com.proxy-tu.researchport.umd.edu/article/special-report-super-bowl/amazing- facts-social-media-super-bowl/232545/
International Conference on Communication, Media, Technology and Design 24 - 26 April 2014, Istanbul – Turkey
259
Ferguson, D.A. & Perse, e.M. (2000). The world wide web as a functional alternative to television. Journal of Broadcasting & Electronic Media, 44(2), 155-174.
Hong, M. & Raney, A. (2007). Online sports fans’ motive research: Does interactivity lead motives or follow them. The 2007 National Communication Association Annual Convention, Chicago.
Hutchins, B. (2011). The acceleration of media sport culture: Twitter, telepresence and online messaging Information, Communication & Society, 14 (2). 237-257.
Jone, D. (2010, April 15). The new revolution of sports blogs: Crass vs. content. Paper presented at the national convention of the Broadcast Education Association. Las Vegas, NV.
Kaye, B.K. (1998). Uses and gratifications of the world wide web: From couch potato to web potato. New Jersey Journal of Communication, 6(1), 21-40.
King, I., Li, J. & Chan, K. Tong. (2009). A brief survey of computational approaches in social computing. Proceedings of the 2009 international joint conference on Neural Networks. 2699-2706. Lam, K. (2001). Stream dreams: Broadband and rich media may force TV to take a backseat. American Demographics, 1(1), 12-14. Lederer, A.L., Maupin, D.J., Sena, M.P. & Zhuang, Y. (2000). The technology acceptance model and the world wide
web. Decision Support Systems, 29(3), 269-282. Lewis, S.C., Zamith, R, and Hermida, A. (2013). Content analysis in an era of big data: A hybrid approach to
computational and manual methods. Journal of Broadcasting & Electronic Media, 57 (1), 34-52. Lin, C.A. (2006). Technology fluidity and on-demand webcasting adoption. Telematics & Informatics, 25(2), 84-98.
Lin, C.A. (2004). Webcasting adoption: Technology fluidity, user innovativeness, and media substitution. Journal of Broadcasting & Electronic Media, 48(3), 446-465.
Oates, T.P. (2009). New media and repackaging of NFL fandom. Sociology of Sport Journal, 26, 31-49. Papacharissi, Z. & Rubin, A.M. (2000). Predictors of Internet use. Journal of Broadcasting & Electronic Media,
44(2), 175-196. Plymire, D.C. (2009). Remediating football for the post human future: Embodiment and subjectivity in sport video
games. Sociology of Sport Journal, 26, 17-30.
Rogers, E. M. (2003). Diffusion of innovations (5th Ed.). New York, NY: Free Press. Porter, C.E. & Donthu, N. (2006). Using the technology acceptance model to explain how attitudes determine Internet usage: The role of perceived access barriers and demographics. Journal of Business Research, 59(9), 999-1007. Sanderson, J. & Kassing, J.W. (2011). Tweets and blogs: Transformative, adversarial, and integrat ive developments
in sports media. In A.C. Billings (Ed.). Sports Media: Transformation, Integration, and Consumption. New York: Routledge, 114-127.
Schultz, B. & Sheffer, M. L. (2011). Factors influencing sports consumption in the era of new media. Web Journal of Mass Communication Research, 37, 1-11.
Smith, A. & Brenner, J. (2012). Twitter use 2012. Pew Research Center’s Internet & American Life Project. Retried from http://pewinternet.org/Reports/2012/Twitter-Use2012.aspx
Super Bowl ratings decline: Audience stop defying gravity (February 04, 2013). Advertising Age. Retrieved from www.adage.com
Steffes, E. M. & Burgee, L.E. (2009). Social ties and online word of mouth. Internet Research, 19(1), 42-59. Tang, T. & Cooper, R. (2012). Gender, sports, and new media: Predictors of viewing during the 2008 Beijing Olympics. Journal of Broadcasting & Electronic Media, 56 (1), 75-91. doi: Tomlinson, J. (2007). The Culture of
Speed: The Coming of Immediacy. London: Sage. USA Today (2014, Jan 6). Ad Meter 2013: The most popular ads of Super Bowl XLVII. Retrieved from
http://admeter.usatoday.com/story/sports/ad-meter/super-bowl/2014/01/03/ad-meter-story-2013-the-results/4294831/
Wejnert, B. (2002). Integrating models of diffusion of innovations: a conceptual framework. Annual Review of Sociology, 28, 297-326.
Wertheim, J. (2011, July 14). Twitter is now a permanent part of the sports firmament. Sports Illustrated. Retrieved from http://sportsillustrated.cnn.com/2011/writers/jon_wertheim/06/29/twitter.thinkpiece/index.html
200 million Tweets per day (2011), Twitter, Retrieved from http://blog.twitter.com/2011/06/200-million-tweets-per- day.html
What is Twitter? (2012). Twitter, Retrieved from https://business.twitter.com/en/basics/what-is twitter