Embed Size (px)
Citation preview

NSW Injury Risk Management Research Centre, University of New South Wales
SPORT/LEISURE INJURIES
IN NEW SOUTH WALES
Trends in sport/leisure injury hospitalisations (2003-2005) and the prevalence of non-hospitalised injuries (2005)
Rebecca Mitchell, Soufiane Boufous, Caroline F Finch
July 2008
UNSW, SYDNEY NSW 2052, AUSTRALIA Telephone: +61 (2) 9385 4207, Facsimile: +61 (2) 9385 6040,
http://www.irmrc.unsw.edu.au
ISBN 978-0-9804866-3-6
Published by: NSW Injury Risk Management Research Centre
University of New South Wales, Sydney NSW 2052, Australia
Telephone: +61 (2) 9385 4207 Facsimile: +61 (2) 9385 6040 http://www.irmrc.unsw.edu.au Recommended citation: Mitchell R. Boufous S. Finch CF. Sport/leisure injuries in New South Wales: Trends in sport/leisure injury hospitalizations (2003-2005) and the prevalence of non-hospitalised injuries (2005). Sydney: New South Wales Injury Risk Management Research Centre, July 2008.
Table of Contents List of Tables...........................................................................................................................i List of Figures ........................................................................................................................ii Acknowledgements ...............................................................................................................1 Executive Summary...............................................................................................................2 Introduction............................................................................................................................5 PART A. SPORT/LEISURE INJURY HOSPITALISATIONS IN NSW.....................................7
Data Used and Analysis .......................................................................................................7 Trends in Overall Injury Rates..............................................................................................9 Trends in Sport/Leisure Specific Injury Hospitalisation Rates ............................................12 Trends in Injury Characteristics..........................................................................................13 In-hospital Procedures/Treatments for Sport/Leisure Injury ...............................................20 Implications ........................................................................................................................22 Recommendations .............................................................................................................27
PART B. Self-reported injuries related to organised sport in NSW.................................29 Data Used and Analysis .....................................................................................................29 Participation in Organised Sport.........................................................................................30 Proportion of Injured Organised Sport Participants ............................................................31 Treatment for most recent injury ........................................................................................32 Implications ........................................................................................................................33 Recommendations .............................................................................................................33
REFERENCES ......................................................................................................................35 APPENDIX 1 ICD-10-AM SPORT/LEISURE ACTIVITY CODES..........................................37 APPENDIX 2 PARTICIPATION IN SPORT AND RECREATIONAL ACTIVITIES DATA FROM ERASS ..................................................................................................................................44 APPENDIX 3 COMMON PRINCIPAL PROCEDURES GIVEN TO SPORT/LEISURE INJURY HOSPITALISATION CASES NSW-BASED HOSPITALISATIONS OF NSW RESIDENTS, 2003–2005.............................................................................................................................46 APPENDIX 4 SPORTS INJURY QUESTIONS FROM THE NSW POPULATION HEALTH SURVEY PROGRAM ............................................................................................................49

LIST OF TABLES Table A.1 Annual number and rate of sport/leisure injury hospitalisations of NSW
residents according to age group and sex, NSW, 2003–2005.........................................10 Table A.2 Overall age group and sex specific sport/leisure injury hospitalisation
rates of NSW residents in NSW, 2003–2005...................................................................11 Table A.3 Comparison of age group and sex specific population and participation-
adjusted sport/leisure injury hospitalisation rates – NSW-based hospitalisations of NSW residents, 2003–2005.........................................................................................12
Table A.4 Population sport/leisure injury hospitalisations of NSW residents according to ICD-10-AM activity codes, NSW, 2003–2005..............................................15
Table A.5 Participation-based sport/leisure injury hospitalisations of NSW residents aged 15+ years for select ICD-10-AM activity codes, NSW, 2003–2005.........................16
Table A.6 Most common external causes (mechanism) of sport/leisure injuries resulting in sport/leisure injury hospitalisation of NSW residents by year, NSW, 2003–2005.......................................................................................................................17
Table A.7 The twenty most common principal diagnoses of sport/leisure injury hospitalisations of NSW residents in NSW, 2003–2005 ..................................................19
Table A.8 The twenty most common principal procedures given to sport/leisure injury hospitalisation cases of NSW residents in NSW, 2003–2005 ................................21
Table A.10 The ten most common principal procedures for sport/leisure injury hospitalisation cases of NSW residents by age group in NSW, 2003–2005....................23
Table A.11 The ten most common principal procedures for sport/leisure injuries resulting in sport/leisure injury hospitalisation of NSW for selected team ball sports in NSW, 2003–2005..............................................................................................24
Table A.12 The ten most common principal procedures for sport/leisure injury hospitalisations of NSW residents for selected wheeled sports, equestrian activities, and ice and snow sports in NSW, 2003–2005 .................................................25
Table B.1 Percentage of individuals who participated in organised sport in the previous 12 months by age group and gender, 2005 NSW Population Health Survey .............................................................................................................................30
Table B.2 Distribution of the reported hours per week spent participating in organised sport in the previous 12 months by gender, 2005 NSW Population Health Survey ..................................................................................................................31
Table B.3 Frequency of reported injury amongst those who played organised sport in the previous 12 months by age group and gender, 2005 NSW Population Health Survey ..................................................................................................................31
Table B.4 Distribution of the number of injuries sustained by those who played organised sport in the previous 12 months by gender, 2005 NSW Population Health Survey ..................................................................................................................32
Table B.5 Proportion of injured individuals injured playing organised sport in the last 12 months by treatment type and gender, 2005 NSW Population Health Survey............32
i

LIST OF FIGURES Figure A.1 Comparison of the annual distribution of the mechanism of sport/leisure
injuries resulting in hospitalisation of NSW residents in NSW, 2003–2005 .....................14
Figure A.2 Comparison of the annual distribution of the nature of injury (according
to principal diagnosis) of sport/leisure injury hospitalisations of NSW residents
in NSW, 2003–2005 ........................................................................................................18
Figure A.3 Comparison of the annual distribution of the body region (according to
principal diagnosis) of sport/leisure injury hospitalisations of NSW residents in
NSW, 2003–2005 ...........................................................................................................18
Figure A.4 Comparison of the distribution of the locations where the events leading
to sport/leisure injury hospitalisation of NSW residents occurred in NSW, 2003–
2005.................................................................................................................................20
ii
ACKNOWLEDGEMENTS
This project was funded by the NSW Sporting injuries Committee (NSWSIC) under its Research and Injury Prevention Scheme.
Rebecca Mitchell was supported by the NSW Injury Risk Management Research Centre (IRMRC) core funding, which is provided by the NSW Department of Health, the NSW Roads and Traffic Authority, and the NSW Motor Accidents Authority. Dr Soufiane Boufous was supported by the NSWSIC grant at the IRMRC during the analysis phase of this project; he contributed to the writing of this report as a Visiting Fellow at the IRMRC. Professor Caroline Finch was supported by an NHMRC Principal Research Fellowship and worked on this report in her capacity as an IRMRC Professorial Visiting Fellow and Research Professor in Human Movement Science at the University of Ballarat.
The authors would like to thank the Centre for Epidemiology and Research at the NSW Health Department for providing access to the Health Outcomes and Information Statistical Toolkit (HOIST) to access the sport/leisure injury hospitalisation and NSW Population Health Survey data analysed in this study.
The National Centre for Classification in Health provided the list of ICD-10-AM third edition sport/leisure activity codes reproduced in this report.
Comments on the draft report were received with thanks from: A/Prof Ann Williamson (IRMRC), Dr Shauna Sherker (IRMRC), Ms Sonya Jenkins (NSWSIC), Ms Karina Ryan (NSWSIC) and Ms Rosemary Perry (NSW Sport and Recreation) and NSW Health.
1

EXECUTIVE SUMMARY
Detailed information about the incidence and causes of sport/leisure injuries in NSW is needed to identify priority groups for action and suitable prevention and control measures. This report is the third in a series describing the pattern of sport/leisure injuries in NSW prepared by the NSW Injury Risk Management Research Centre (IRMRC). Previous reports have described sport/leisure injury deaths during 2000-2002 and sport/leisure injury hospitalisations during 2003-2004. The second report in the series also described the socio-demographic profile of sport/leisure injuries in NSW and discussed the quality and completeness of the International Classifications of Diseases (ICD-10-AM) coding schemes for identifying sport/leisure injury cases.
This report adds to information published in the previous reports by:
• adding an additional year to the description of sport/leisure injury hospitalisations to enable some trends in injury rates to be assessed for the 3-year period 2003 to 2005 (Part A). Rates are given for both the NSW resident population and as participation-based rates for 15+ year olds. This is important for assessing whether current preventive efforts are having an impact on sport/leisure injury hospitalisation rates in NSW;
• describing, for the first time, the range of in-hospital procedures that sport/leisure injury cases receive (Part A). To our knowledge, this information has not been described at the population level before. This is important for determining the severity of hospitalised sport/leisure injuries and to inform the delivery of health and medical services for sport/leisure injury treatment in NSW; and
• describing the self-reported experience of injuries during organised sporting activities from a population-based survey of NSW adults aged 16+ years in terms of age-and sex- specific rates and the most common sources of injury treatment (Part B). This is important for determining how common sport/leisure injuries are in the general community and the extent to which routine data collections of sport/leisure injury hospitalisations provide coverage of all such injuries.
Overall, the annual average rate of sport/leisure injury hospitalisations in NSW was 192.4 per 100,000 head of population, during 2003-2005. Rugby (union and league), soccer, football unspecified, and cycling were the activities most commonly conducted at the time of the injurious incident that resulted in sport/leisure injury hospitalisations. This indicates that severe sport/leisure injury is a significant issue in this State. An important limitation of the injury hospitalisation data, which has implications for the targeting of appropriate prevention strategies is that it is not possible to determine specifically if injuries occurred during organised sport, informal sport or leisure.
There has been an increase in sport/leisure injury hospitalisation rates over the period 2003-2005, though this was not statistically significant. This suggests that either currently implemented safety programs are not fully effective in preventing sport/leisure injuries or that not enough preventive effort is directed towards this important cause of injury morbidity in NSW. The fact that most participation-based injury hospitalisation rates were not significantly increased in 2005, relative to 2003, suggests that these trends are unlikely to be explained by increasing numbers of participants in these sports at least for the age groups with participation data. Some caution is needed in interpreting these trends as they are based on three time points only and the participation data does not cover all age ranges.
2
Participation-based injury hospitalisation rates appear to have increased for Australian rules football and cricket but declined in rugby football and equestrian activities during 2003-2005. On a per head of population basis, injury rates have increased significantly for motorcycle sports and football (unspecified). The specific reasons for these trends are not able to be determined from this data and changes in coding practices, as reflected in trends in the categories of football, unspecified and other specified sport and leisure activity may have contributed to these observations.
The most common in-hospital procedures received for hospitalised sport/leisure injury reflect the severity of these injuries. They were most commonly reductions of radius fractures, knee reconstructions, reductions of ankle/toe factures and CT scans of the brain. It would also appear that sport/leisure injuries account for almost 60% of all knee reconstructions for injury hospitalisations in NSW, as well as more than 40% of all repairs of ankle/foot tendons/ligaments and more than one-third of all reductions of fractures to the tibia shaft.
It is known that hospitalisations only relate to the most severe sports injury cases and many sports injuries do not require hospitalisation. Moreover, the probability of admission to hospital is dependent on other factors such as the availability of surgical procedures and specialist staff to manage severe sport/leisure injury. This means that many more sport/leisure injuries occur in NSW that are treated outside of the formal hospital setting. To get an indication of the extent to which sport/leisure injuries in NSW residents are likely to require treatment in a hospital, information about the population incidence of all sport/leisure injury is required. One potentially valuable source of population-level sport/leisure injury frequency is from large scale population health surveys, such as those conducted by NSW Health. Information from respondents of the 2005 NSW Adult Health Survey is used to describe organised sport participation habits, the proportion of participants injured during this activity and the most common sources of sport/leisure injury treatment.
Almost one-in four adults who are participated in organised sport over 12 months reported being injured during this participation, highlighting the frequency with which such injuries occur. Most of these injuries were minor, however, with about 50% of cases either being self-treated or receiving no treatment for their injuries. Hospitalisation for an organised sport injury was not common, with under 3% of injured organised sport participants reporting this level of care. A further 6% of injured organised sport participants received treatment at an emergency department, indicating a relatively large proportion of injuries that are not included in usual estimates of the burden of sport/leisure injuries based on routinely collected health sector data in NSW.
Recommendations for Injury Prevention and Sports Safety Given there has been no reduction in overall sport/leisure injury rates in NSW during 2003-2005, the extent to which effective sport/leisure safety programs have been developed and fully implemented in NSW needs to be determined. A strategic state-wide approach to sports safety, which includes the development of a sports policy framework involving government and non-government agencies, in conjunction with the development of safety guidelines for sports bodies to implement, needs to be adopted for the whole of NSW to reduce these rates in the future 1.
Rugby, soccer, cycling, Australian rules football, cricket, and motorcycle sports should be the prime focus of increased injury prevention attention in NSW because of their predominance in the sport/leisure injury hospitalisation statistics and/or their association with increasing injury rates over the 2003-2005 period.
Given that almost one-in four adults injure themselves whilst playing organised sport in a 12 month period, and about half of these require some form of treatment, sports injury prevention should receive priority attention in both injury prevention and physical activity promotion activities in NSW.
Males should be a particular focus of sports prevention efforts, given the higher proportion of them self-reporting injury during organised sport participation, across all age groups aged 16+ years.
3

Recommendations for Improved Injury Surveillance in NSW Consideration should be given towards the development of detailed routine injury surveillance systems for the sport/leisure activities with high or increasing injury hospitalisation rates, to continue to monitor these injury trends in specific sports and to guide intervention priorities and evaluation. Such systems will most likely require a multi-agency response including from Government departments of health and sport, the NSW Sporting Injuries Committee and peak sports bodies. The resulting surveillance should be wide, across many contexts and levels of participation, to determine the extent to which such injuries are related to organised sport participation.
Consideration should be given by agencies collecting routine injury and sport participation data to develop and use consistent definitions to aid standardisation of the identification of sports injuries and the calculation of robust participation-based injury rates.
Consideration should be given to enhancements to the ICD-10-AM coding manual that would allow the phase of play/actual activity at the time of injury to be reported (even if as a narrative) and for the type of activity to be properly differentiated between organised sport, informal sport and general play.
Solely using sport/leisure injury data from routinely collected hospital separations databases to estimate the burden of sport/leisure injury in NSW underestimates the public health burden associated with sport/leisure injury in NSW. Consideration should be given to assessing the feasibility of enhancing or establishing new routinely collected data collections to describe the burden of sport/leisure injuries on health service delivery and individuals. Different models for sport/leisure injury surveillance within various health care settings that commonly treat sport/leisure injuries such as emergency departments, sports medicine clinics, physiotherapist practices and general practitioners, in particular, should be explored.
Future NSW Population Health Survey questions about sport injury would be improved by the inclusion of additional questions requesting information about the type of sport /leisure activity at the time of injury, the type of injury sustained, and the time taken off work, school or daily activities as a result of the injury.
Recommendations for Further Research A formal assessment of participation-based injury rates should be undertaken for children, using the latest ABS participation data.
Reasons for the relatively high level of unspecified and non-specific ICD-10-AM activity codes needs to be explored specifically for sport/leisure injury so that potential solutions for reducing these data inadequacies can be developed and implemented.
Given the relevance of data about the medical/surgical procedures received in hospital for health service planning, it is recommended that future research quantifies the full range of procedures received by hospitalised sport/leisure injury patients, in terms of their frequency, medical cost and public health burden.
4

INTRODUCTION
Sport and leisure activities (hereafter referred to as sport/leisure) play a prominent role in the lives of many Australians. In 2002, just under two-thirds of Australians aged 18+ years (62.4% of the adult population), representing around 9.1 million individuals, stated that they had participated in physical activities for recreation, exercise or sport in the previous 12 months 2. Participation and involvement in sport/leisure has many benefits for individuals, such as increased physical fitness, improved health and increased social interaction 3.
Participation in sport can be at the elite or professional level, or as part of a broader-based organised sport, such as team-based competitions, or as part of school-based sport; it can also be more informal, such as for leisure, general recreation or backyard games. In Australia, around 4.6 million individuals aged 18 years or over (about half of all those participating in physical activities) stated that they participated in organised sports and physical recreation during the 12 months prior to 2002 2.
Unfortunately, participation in various sports, across all levels of participation from elite athletes to recreational players, can be associated with a risk of injury 4. To inform population level prevention strategies, it is necessary to know the incidence and patterns of sport/leisure injury occurrence. In New South Wales (NSW), sport/leisure injuries have resulted in death and in injuries severe enough to require hospitalisation 5 6. Sport/leisure injuries can also involve presentations to emergency departments, general practitioners, visits to allied health professionals, such as physiotherapists, or may just require basic first aid and rest 7 8.
Sport/leisure injuries have been estimated to account for 13.9%-38.3% of all hospitalised injury in NSW 6. They were estimated to cost around $92.4 million in NSW during 1998-99 - $40 million in direct costs and $52.4 million in mortality and morbidity costs 9. Other significant impacts of sport/leisure injuries are their effect on an individual’s capacity to participate in further sport/leisure, their capacity to perform work or attend school, or to participate in other activities of daily living or social activities 4.
Detailed information about the incidence and causes of sport/leisure injuries in NSW is needed to identify priority groups for action and suitable prevention and control measures 5 6. This report is the third in a series describing the pattern of sport/leisure injuries in NSW prepared by the NSW Injury Risk Management Research Centre (IRMRC). Previous reports have described sport/leisure injury deaths during 2000-2002 5 6 and sport/leisure injury hospitalisations during 2003-2004 5 6. The second report in the series also described the socio-demographic profile of sport/leisure injuries in NSW and discussed the quality and completeness of the International Classifications of Diseases (ICD-10-AM) coding schemes for identifying sport/leisure injury cases 5 6.
This report adds to information published in the previous reports by:
• adding an additional year to the description of sport/leisure injury hospitalisations to enable some trends in injury rates to be assessed for the period 2003 to 2005 (Part A). This is important for assessing whether current preventive efforts are having an impact on sport/leisure injury hospitalisation rates in NSW;
• describing, for the first time, the range of in-hospital procedures that hospitalised sport/leisure injury cases receive (Part A). This is important for determining the severity of hospitalised sport/leisure injuries and to inform the delivery of health and medical services for sport/leisure injury treatment in NSW; and
5

• describing the self-reported experience of injuries during organised sporting activities from a population-based survey of NSW adults aged 16+ years in terms of age-and sex- specific rates and the most common sources of injury treatment (Part B). This is important for determining how common sport/leisure injuries are in the general community and the extent to which routine data collections of sport/leisure injury hospitalisations provide coverage of all such injuries.
Each part of this report begins with an overall statement of the issue being discussed and a full description of the methods and information sources used. The results from the relevant analyses are presented with an accompanying discussion of the implications of the findings for injury prevention and monitoring. Where relevant, some recommendations for improving the quality of the data collections and coding schemes are also given.
6

PART A. SPORT/LEISURE INJURY HOSPITALISATIONS IN NSW
Part A of this report describes trends in the frequency and rate of sport/leisure injury hospitalisations, of NSW residents in NSW-based hospitals, over the period 2003 to 2005. Rates are given for both the NSW resident population and, for 15+ year olds, as participation-based rates. In doing, so it provides an additional year of data to that included in previous IRMRC reports 5 6. It also enables an assessment of whether current broad-based sport/leisure injury preventive efforts are having an impact on hospitalised sport/leisure injury rates in NSW.
A description of the treatment provided to hospitalised sport/leisure injury patients, in terms of the most common procedures undertaken, is also provided. To our knowledge, this information has not been described at the population level before. This information is important for determining the severity of hospitalised sport/leisure injuries and to inform the delivery of health and medical services for sport/leisure injury treatment in NSW.
Data Used and Analysis
The NSW Admitted Patients Data Collection (APDC) (in previous reports this was named the Inpatient Statistics Collection, or ISC) includes details of all sport/leisure injury hospitalisations in NSW. It records all inpatient separations (discharges, transfers and deaths) from all public, private and repatriation hospitals, private day procedures centres and public nursing homes in NSW. Hospitals are required to submit details for every inpatient and for every episode of care. An episode of care either ends by the patient ending a period of stay in hospital (by discharge, transfer or death) or by the patient becoming a different type of patient within the same period of stay in hospital (e.g. the patient is admitted for an acute injury then later becomes a rehabilitation patient) 10. Hereafter, the term “hospitalisation” should be taken to represent “hospital separation”.
Due to the nature of the hospital data, the number of sport/leisure injuries hospitalisations is not equivalent to the number of incident cases. Patients who had been readmitted or transferred from one hospital to another and, in some instances, even within the same hospital, for treatment of the same injury may be recorded more than once. In the absence of a direct means to identify incident cases in the NSW APDC, the 'mode of separation' variable was used to exclude transfers and statistical discharges or transfers within the same hospital in order to minimise multiple counting of cases.
For the purposes of this report, only hospitalisations of NSW residents at NSW-based hospitals were extracted from the APDC. This was to ensure consistency with the previous IRMRC reports and because the available participation and population data only relate to NSW residents.
As with the two previous IRMRC sport/leisure injury reports 5 6, the ICD-10-AM third edition 11 was used to select appropriate cases for 2003 and 2004. The fourth edition was used for the 2005 data. The differences in respect to the coding of sport/leisure injury in the two editions were minor. Cases selected included all hospital separations in NSW, of NSW residents of any age, with an ICD-10-AM principal diagnosis indicating an injury, excluding poisoning (i.e. S00-T35, T66-T71, T73, T75, T95-T98) and an 'activity at the time of injury' code referring to sport/leisure activity (i.e. U50-U72) during the three calendar year period of 2003 to 2005. A detailed list of all relevant ICD-10-AM, third edition activity codes included is provided in Appendix 1. These codes were included on the assumption that the majority of cases selected would be related to participation in sport/leisure. For example, cycling was included, as it was assumed the majority of cases would be related to participation in cycling as a sport or leisure activity, rather than transportation to work. This assumption has also been made in prior analyses of sports injury cases treated at hospital 5 6 12. Sport/leisure activities have been classified in this report according to the ICD-10-AM groupings 11. Issues relating to the completeness
7
and other limitations of the ICD-10-AM activity and place codes have been reported in detail in the previous IRMRC sports injury report 5 6.
The ICD-10-AM allows for the coding of place of occurrence of injury, which includes, among other categories, sports or athletics areas. However, this criterion was not used to select cases because our previous analyses 5 6 showed that use of the activity-codes, alone, identified most sports injury cases. Furthermore, some cases injured on a sport ground might not necessarily have been actually participating in a sport at the time; they may have been spectators, coaches, referees or passers-by, for example. Also, it is not necessarily true that all sport/leisure injuries will occur only in sports or athletics areas, and may also occur in schools, or natural settings.
Due to significant changes in the ICD-10-AM codes related to sport/leisure activities since 1998, this report only focuses on sport/leisure injury hospitalisations for the calendar years 2003 to 2005, for which the consistent revisions of the ICD-10-AM coding (in respect to sport/leisure injury) was used. Compared to previous versions of ICD-10-AM, the version used to code these three years of data contains a more detailed description of various sports, with 260 different categories provided by the ICD-10-AM 'activity while injured'. Unlike the ICD-10, and the earlier versions of ICD-10-AM, there is no simple delineation between sport/leisure and, unfortunately, this makes it impossible to identify injuries solely related to participation in organised sports. For example, if someone was injured while participating in football, it is not known if this was as a team member in a competitive game or as part of a kick-to-kick session in the backyard.
The frequency and rates of sport/leisure injuries were calculated in each year and for subgroups of interest, such as age and gender, as well as sport and activity type. The denominators used were the mid-year NSW population estimates (in the relevant subgroup) from Australian Bureau of Statistics (ABS) data obtained from HOIST 10. Year-specific hospitalised rates were age standardised to the 2001 Australian population to adjust for any differences that may have arisen from a change in the age structure of the population over the 2003-2005 period. All of the population data used in both numerators and denominators were restricted to NSW residents.
Information on the likely population at risk (i.e. the number of participants in sport/leisure) was derived from the relevant Exercise, Recreation and Sport Surveys (ERASS) 13-15. For consistency and direct comparability purposes, the same participation data was used in this report as for the previous IRMRC reports. The ERASS used telephone surveys to collect information on the participation of people aged 15+ years in physical activity for exercise, leisure and sport during the 12 months prior to the interview (Appendix 2). At the time of conducting the analyses for this report (mid 2007), there were no recent reliable estimates of child participation rates. For this reason, the participation-based rates provided in this report are only for people aged 15+ years. It is acknowledged that children’s participation in organised sport was reported by the Australian Bureau of Statistics (ABS) in October 2007 and it is recommended that further work is undertaken in the future to determine appropriate sport/leisure injury rates in children.
In the ERASS survey, participation means active 'playing' participation and does not include coaching, refereeing and spectating or activities related to work or household chores. Participation figures include both organised and non-organised sport and practice and training sessions for these activities. The surveys used a random sample stratified by state and territory and the sample was selected from the Electronic White Pages; one person was randomly selected per dwelling to complete the interview.
While the classification of all sport/leisure activities in the sport/leisure injury hospitalisation data generally agrees with that of the ERASS participation data, caution is needed when examining participation rates for some individual sports or activities. This particularly applies to the category of 'other football' (rugby unspecified, touch football and other specified football, such as American tackle, Gaelic, Gridiron) and 'football unspecified', which do not have corresponding categories in the participation data. Those categories that refer to participation in 'other' or 'unspecified' sports and activities as defined by ICD-10-AM were included in this report. While such categories do not provide detailed information about the activity being undertaken at the time of injury, they need to be included
8

in the assessment of the overall burden, from a numerator point of view. Unfortunately, these cases cannot be included in participation-based rates.
Ninety-five percent confidence intervals (95% CI) were calculated for various rates. Poisson regression was used to examine the statistical significance of changes in the trend of sport/leisure hospitalised injuries rates over three years. Direct comparisons of the 95% CI for rates pertaining to particular subgroups of interest, across the three years, were used to identify significant changes in those rates (i.e. with non-overlapping CI). Whilst it is acknowledged that this approach has some statistical limitations, the fact that there were only three time points for the assessment of the trends, precludes a much more detailed analyses of them.
In all data presentations, cells with total case numbers less than five have not been shown in the tables in order to maintain confidentiality.
All analyses were conducted using SAS, version 8.02 16.
Trends in Overall Injury Rates
Over the three-year period 2003 to 2005, there were 38,557 sport/leisure injury hospitalisations in NSW, with an overall annual age-standardised rate of 192.4 sport/leisure injury hospitalisations per 100,000 persons (95% CI 190.5-194.3). The overall rate of sport/leisure injury hospitalisations did not change significantly over the three year period. Age-standardised rates increased from 189.3/100,00 person in 2003 to 193.6 per 100,000 in 2005, but this increase was not statistically significant.
The average annual age-standardised sport/leisure injury hospitalisation rate for males (294.3 per 100,000 population) was around three times higher than the rate for females (91.7 per 100,000 population) (Table A.1). Males in all age groups, except for those aged 80+, had higher sport/leisure injury hospitalisation rates than females. Males aged 10-14 years (846.9 per 100,000 population) and 15-19 years (843.1 per 100,000 population), and females aged 10-14 years (275.6 per 100,000 population) or 5-9 years (213.9 per 100,000 population) had the highest average annual sport/leisure injury hospitalisation rates (Table A.2). Whilst the population-based hospitalisation rates increased in males over 2003-2005 (from 289.3 to 298.8), this was not statistically significant.
After adjusting for the estimated number of individuals aged 15+ years engaging in sport/leisure pursuits in the calculation of rates, males had just over 3.5 times the rate of sport/leisure injury hospitalisations as females (320.5 versus 84.8 per 100,000 participants, respectively). Males of all ages had higher rates of sport/leisure injury hospitalisation for sport/leisure injuries than females. Of those individuals who participated in sport/leisure activities, both males (759.3 per 100,000 participants) and females (129.9 per 100,000 participants) aged 15-24 years had the highest sport/leisure injury hospitalisation rate (Table A.3). In all cases, the participation-based rates were greater than the population-based rates, as would be expected, as the former are based on smaller denominators.
9

Table A.1 Annual number and rate of sport/leisure injury hospitalisations of NSW residents according to age group and sex, NSW, 2003–2005
2003 + 2004 + 2005 +
n Rate (95% CI) n Rate (95% CI) n Rate (95% CI)
Gender
Male 9,536 289.3 * (283.5, 295.1) 9,844 291.9 * (286.1, 297.6) 10,133 298.8 * (293.0, 304.6)
Female 3,021 90.5 * (87.3, 93.7) 2,945 86.3 * (83.2, 89.5) 3,078 89.6 * (86.5, 92.8
Age group(years)
0-4 269 62.3 (54.9, 69.8) 277 65.4 (57.7, 73.1) 258 60.2(52.9, 67.6
5–9 1,208 267.9 (252.8, 283.0) 1,228 281.3 (265.6, 297.0) 1,111 251.5(236.8, 266.3)
10–14 2,551 559.3 (537.6, 580.9) 2,624 569.5 (547.8, 591.2) 2,631 572.4(550.6, 594.2)
15–19 2,177 484.7 (464.4, 505.0) 2,288 500.8 (480.3, 521.2) 2,367 521.2(500.3, 542.1)
20–24 1,448 329.4 (312.4, 346.3) 1,525 323.3 (307.1, 339.5) 1,624 350.7(333.7, 367.7)
25–29 1,262 268.7 (253.9, 283.5) 1,231 273.1 (257.8, 288.3) 1,341 289.6(274.1, 305.1)
30–34 982 194.1 (182.0, 206.2) 954 183.3 (171.7, 194.9) 1,008 194.8(182.8, 206.8)
35–39 663 133.0 (122.9, 143.1) 726 153.6 (142.4, 164.7) 791 160.2(149.0, 171.3)
40–44 565 110.8 (101.7, 120.0) 559 107.5 (98.6, 116.4) 634 122.6(113.1, 132.2)
45–49 464 100.8 (91.6, 110.0) 401 83.2 (75.0, 91.3) 431 88.7(80.3, 97.1)
50–54 269 62.1 (54.7, 69.6) 263 60.2 (52.9, 67.5) 293 66.1(58.5, 73.6)
55–59 195 53.2 (45.8, 60.7) 209 49.9 (43.1, 56.6) 200 48.3 (41.6, 55.0)
60–64 128 44.4 (36.7, 52.1) 153 49.4 (41.5, 57.2) 140 43.8 (36.6, 51.1)
65–69 99 40.7 (32.7, 48.7) 82 31.5 (24.7, 38.3) 111 42.1 (34.3, 49.9)
70–74 106 47.2 (38.2, 56.1) 93 43.5 (34.6, 52.3) 111 51.1 (41.6, 60.7)
75–79 87 46.7 (36.9, 56.5) 78 39.9 (31.0, 48.7) 88 45.7 (36.2, 55.2)
80+ 84 38.0 (29.9, 46.1) 98 38.9 (31.2, 46.6) 72 28.7(22.1, 35.3)
Total 12,557 189.3 * (186.0, 192.6) 12,789 188.5 * (185.3, 191.8) 13,211 193.6 * (190.3, 196.9)
* Age-standardised rate per 100,000 population. + 2003-2004, ICD-10-AM 3rd Edition; 2005, ICD-10-AM 4th Edition
10

Table A.2 Overall age group and sex specific sport/leisure injury hospitalisation rates of NSW residents in NSW, 2003–2005
Males Females Persons
Age group (years)
n Rate (95% CI) n Rate (95% CI) n Rate (95% CI)
0–4 480 72.7 (66.2, 79.2) 324 51.9 (46.3, 57.6) 804 62.6 (58.3, 66.9)
5–9 2,161 317.2 (303.8, 330.5) 1,386 213.9 (202.7, 225.2) 3,547 266.9 (258.1, 275.6)
10–14 5,961 843.1 (821.8, 864.4) 1,845 275.6 (263.0, 288.1) 7,806 567.1 (554.5, 579.6)
15–19 5,900 846.9(825.4, 868.4) 932 140.5 (131.4, 149.5) 6,832 502.3 (490.4, 514.2)
20–24 3,934 562.0 (544.5, 579.5) 663 98.3 (90.8, 105.8) 4,597 334.5 (324.8, 344.1)
25–29 3,243 468.3 (452.2, 484.4) 591 85.5 (78.6, 92.4) 3,834 277.1 (268.4, 285.9)
30–34 2,385 311.0 (298.5, 323.4) 559 72.0 (66.0, 77.9) 2,944 190.7 (183.8, 197.6)
35–39 1,623 221.7 (211.0, 232.5) 557 76.0 (69.7, 82.3) 2,180 148.8 (142.6, 155.0)
40–44 1,277 164.7 (155.6, 173.7) 481 62.4 (56.8, 68.0) 1,758 113.7 (108.4, 119.0)
45–49 899 126.3 (118.0, 134.5) 397 55.4 (50.0, 60.9) 1,296 90.7 (85.8, 95.7)
50–54 565 86.1 (79.0, 93.2) 260 39.6 (34.7, 44.4) 825 62.8 (58.5, 67.1)
55–59 345 56.9 (50.9, 62.9) 259 43.6 (38.3, 48.9) 604 50.3 (46.3, 54.4)
60–64 223 48.2 (41.9, 54.5) 198 43.5 (37.5, 49.6) 421 45.9 (41.5, 50.3)
65–69 163 43.1 (36.5, 49.7) 129 33.2 (27.4, 38.9) 292 38.1 (33.7, 42.4)
70–74 162 51.8 (43.8, 59.8) 148 43.2 (36.2, 50.1 310 47.3(42.0, 52.5)
75–79 104 40.4 (32.6, 48.2) 149 47.0 (39.5, 54.5) 253 44.0 (38.6, 49.5)
80+ 88 33.5 (26.5, 40.5) 166 36.0 (30.6, 41.5) 254 35.1 (30.8, 39.4)
Total 29,513 294.3 * (290.9, 297.2) 9,044 91.7 * (89.9, 93.6) 38,557 192.4 * (190.5, 194.3)
* Age-standardised rate per 100,000 population.
11

Table A.3 Comparison of age group and sex specific population and participation-adjusted sport/leisure injury hospitalisation rates – NSW-based hospitalisations of NSW
residents, 2003–2005
Age group (years)
n Rate per 100,000 population (95% CI) Rate per 100,000 participants (95% CI)
MALES 15–24 9,834 704.1 (690.2,718.0) 759.3 (744.3,774.3)
25–34 5,628 385.6 (375.5,395.7) 435.4 (424.0,446.8)
35–44 2,900 192.4 (185.4,199.4) 233.1 (224.6,241.6)
45–54 1,464 107.0 (101.5,112.5) 133.7 (126.9,140.5)
55–64 568 53.1 (48.7,57.5) 69.8 (64.1,75.5)
65+ 517 42.7 (39.0,46.4) 66.0 (60.3,71.7) Total 20,911 261.0 (257.5,264.5) * 320.5 (316.2,324.8) *
FEMALES
15–24 1,595 119.2 (113.4,125.0) 129.9 (123.5,136.3)
25–34 1,150 78.3 (73.8,82.8) 93.2 (87.8,98.6)
35–44 1,038 69.0 (64.8,73.2) 84.6 (79.5,89.7)
45–54 657 47.8 (44.1,51.5) 60.6 (56.0,65.2)
55–64 457 43.6 (39.6,47.6) 57.5 (52.2,62.8)
65+ 592 39.2 (36.0,42.4) 65.3 (60.0,70.6) Total 5,489 66.6 (64.8,68.4) * 84.8 (82.6,87.0) *
PERSONS
15–24 11,429 417.9 (410.3,425.5) 452.9 (444.6,461.2)
25–34 6,778 231.5 (226.0,237.0) 268.3 (261.9,274.7)
35–44 3,938 130.8 (126.7,134.9) 159.3 (154.3,164.3)
45–54 2,121 77.4 (74.1,80.7) 97.3 (93.2,101.4)
55–64 1,025 48.4 (45.4,51.4) 63.7 (59.8,67.6)
65+ 1,109 40.8 (38.4,43.2) 65.6 (61.7,69.5) Total 26,400 162.4 (160.4,164.4) * 203.1(200.7,205.5) *
*Age-standardised rate per 100,0o0 population or per 1000,000 participants, as indicated in the column heading
Trends in Sport/Leisure Specific Injury Hospitalisation Rates
Rugby (league and union) and soccer had the highest sport/leisure injury hospitalisation rates per 100,000 population of all sports (Table A.4). Other common sport/leisure activities being performed at the time of injury were football (unspecified), Australian rules football, cycling, skating and rollerblading, motorcycle sports, equestrian activities, and ice and snow sports (Table A.4).
Table A.4 also shows trends in population-based injury rates across specific sport/leisure categories. On a population basis, injury rates were significantly increased in 2005, relative to 2003, for the three categories of:
• football, unspecified – this result is likely to reflect changes in coding practice as it is not possible to determine which football codes the larger number of cases belong to, though, on a
12

proportionate participation basis, it would be expected that many cases would be associated with one of the two rugby codes
• motorcycle (inc. dirt bike racing and jumping)
• other specified sport and exercise activity – this result is unlikely to reflect a true increase in the number of injuries in any one activity, because it is a general category of many activities.
There was also a significant decline in the rate of hospitalisations in the leisure activity, not elsewhere classified category between 2003 and 2005. It is possible that this decline reflects the increases in the two categories of football, unspecified and other specified sport and exercise activity noted above.
Table A.5 shows participation-based injury rates across specific sport/leisure categories in 15+ year olds. After taking into account participation rates for people aged 15+ years, the following sport/leisure activities were associated with apparent statistically significant increases in injury hospitalisation rates (per 100,000 participants) in 2003 compared to 2005:
• Australian rules football
• cricket.
Participation-based injury hospitalisation rates with apparently lower participation-based rates in 2005 than in 2003 were:
• football, rugby (league, union); and
• equestrian activities.
However, these results for the football codes, in particular, need to be interpreted with some caution because of the high numbers of “football unspecified” hospitalisations, which could not be related to football participation data. It is possible that the injury rates in Table A.5 are under estimates, given these unspecified cases.
Trends in Injury Characteristics
There were no significant trends in the mechanisms of the injuries leading to sport/leisure injury hospitalisation across 2003-2005 (Figure A.1). Overall, falls (40.2%), transport accidents (16.8%), and being struck by or struck against objects (15.6%) were the three most common injury mechanisms that resulted in sport/leisure injury hospitalisation (Figure A.1).
13
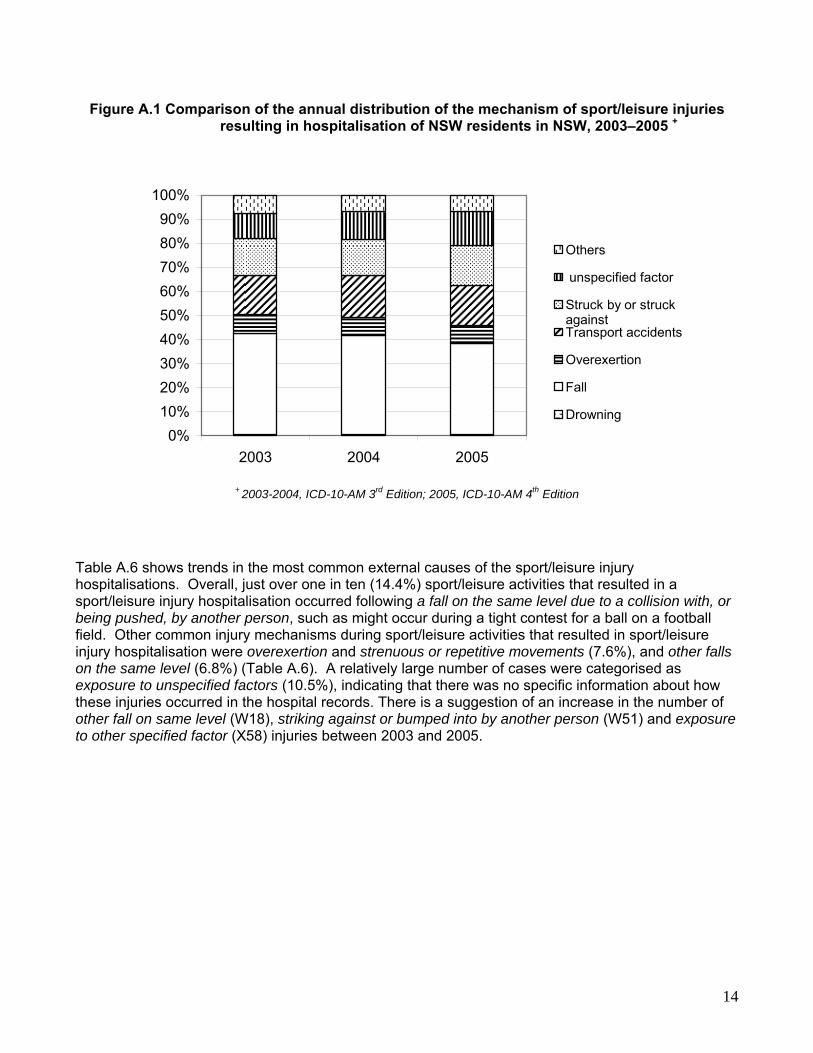
Figure A.1 Comparison of the annual distribution of the mechanism of sport/leisure injuries resulting in hospitalisation of NSW residents in NSW, 2003–2005 +
0%10%20%30%40%50%60%70%80%90%
100%
2003 2004 2005
Others
unspecified factor
Struck by or struckagainstTransport accidents
Overexertion
Fall
Drowning
+ 2003-2004, ICD-10-AM 3rd Edition; 2005, ICD-10-AM 4th Edition
Table A.6 shows trends in the most common external causes of the sport/leisure injury hospitalisations. Overall, just over one in ten (14.4%) sport/leisure activities that resulted in a sport/leisure injury hospitalisation occurred following a fall on the same level due to a collision with, or being pushed, by another person, such as might occur during a tight contest for a ball on a football field. Other common injury mechanisms during sport/leisure activities that resulted in sport/leisure injury hospitalisation were overexertion and strenuous or repetitive movements (7.6%), and other falls on the same level (6.8%) (Table A.6). A relatively large number of cases were categorised as exposure to unspecified factors (10.5%), indicating that there was no specific information about how these injuries occurred in the hospital records. There is a suggestion of an increase in the number of other fall on same level (W18), striking against or bumped into by another person (W51) and exposure to other specified factor (X58) injuries between 2003 and 2005.
14

Table A.4 Population sport/leisure injury hospitalisations of NSW residents according to ICD-10-AM activity codes, NSW, 2003–2005
2003 + 2004 + 2005 +
Sport/leisure activity n Rate * (95% CI) n Rate * (95% CI) n Rate * (95% CI)
Team ball sports Football, rugby (league,
union) 1,475 22.1 (20.9, 23.2) 1,577 23.4 (22.3, 24.6) 1,585 23.2 (22.1, 24.4)
Football, soccer 1,384 20.7 (19.6, 21.8) 1,505 22.4 (21.2, 23.5) 1,522 22.3 (21.2, 23.4) Football, Australian rules 449 6.7 (6.1, 7.3) 453 6.7 (6.1, 7.3) 450 6.6 (6.0, 7.2) Football, other specified 309 4.6 (4.1, 5.1) 280 4.2 (3.7, 4.6) 361 5.3 (4.7, 5.8) Football, unspecified 729 10.9 (10.1, 11.7) 843 12.5 (11.7, 13.4) 919 13.5 (12.6, 14.3) Basketball 287 4.3 (3.8, 4.8) 298 4.4 (3.9, 4.9) 325 4.8 (4.2, 5.3) Netball 275 4.1 (3.6, 4.6) 266 4.0 (3.5, 4.4) 340 5.0 (4.5, 5.5)
Team bat or stick sports Cricket 252 3.8 (3.3, 4.2) 250 3.7 (3.3, 4.2) 293 4.3 (3.8, 4.8) Field hockey 52 0.8 (0.6, 1.0) 59 0.9 (0.7, 1.1) 60 0.9 (0.7, 1.1)
Individual water sports Surfing and boogie.
boarding 219 3.3 (2.8, 3.7) 272 4.0 (3.6, 4.5) 277 4.1 (3.6, 4.5)
Swimming 157 2.3 (2.0, 2.7) 193 2.9 (2.5, 3.3) 157 2.3 (1.9, 2.7)
Ice and snow sports 417 6.2 (5.6, 6.8) 424 6.3 (5.7, 6.9) 407 6.0 (5.4, 6.5)
Individual athletic activities 185 2.8 (2.4, 3.2) 196 2.9 (2.5, 3.3) 178 2.6 (2.2, 3.0)
Acrobatic sports 115 1.7 (1.4, 2.0) 104 1.5 (1.2, 1.8) 117 1.7 (1.4, 2.0)
Racket sports Squash 78 1.2 (0.9, 1.4) 58 0.9 (0.6, 1.1) 41 0.6 (0.4, 0.8) Other racquet sports 182 2.7 (2.3, 3.1) 160 2.4 (2.0, 2.7) 191 2.8 (2.4, 3.2)
Target and precision sports 127 1.9 (1.6, 2.2) 130 1.9 (1.6, 2.3) 140 2.1 (1.7, 2.4)
Combative sports 166 2.5 (2.1, 2.9) 146 2.2 (1.8, 2.5) 168 2.5 (2.1, 2.8)
Equestrian activities 429 6.4 (5.8, 7.0) 445 6.6 (6.0, 7.2) 443 6.5 (5.9, 7.1)
Wheeled motor and non-motor sports
Cycling 561 8.4 (7.7, 9.1) 659 9.8 (9.0, 10.5) 650 9.5 (8.8, 10.3) Skating and rollerblading 493 7.4 (6.7, 8.0) 477 7.1 (6.5, 7.7) 521 7.6 (7.0, 8.3) Motorcycle (inc. dirt bike
racing and jumping) 457 6.8 (6.2, 7.5) 600 8.9 (8.2, 9.6) 621 9.1 (8.4, 9.8)
Other wheeled motor sports 57 0.9 (0.6, 1.1) 77 1.1 (0.9, 1.4) 73 1.1 (0.8, 1.3)
Other specified sport and exercise activity 1,543 23.1 (21.9, 24.2) 1,516 22.5 (21.4, 23.7) 1,739 25.5 (24.3, 26.7)
Leisure activity, not elsewhere classified 2,159 32.3 (30.9, 33.7) 1,801 26.8 (25.5, 28.0) 1,633 23.9 (22.8, 25.1)
Total 12,557 189.3 (186.0, 192.6) 12,789 188.5 (185.3, 191.8) 13,211 193.6 (190.3, 196.9) * Age-standardised rate per 100,000 population.
+ 2003-2004, ICD-10-AM 3rd Edition; 2005, ICD-10-AM 4th Edition
Note: The above table does not list of all available codes, rather it lists the most commonly reported codes only. In cases, where only a small number of cases were reported (e.g. unspecified team ball sports, or other team ball sport), these have been combined into one of the last two categories in this table.
15

16
Table A.5 Participation-based sport/leisure injury hospitalisations of NSW residents aged 15+
years for select ICD-10-AM activity codes, NSW, 2003–2005
2003 + 2004 + 2005 +
Sport/leisure activity n Rate (95% CI) n Rate (95% CI) n Rate (95% CI)
Team ball sports Football, rugby (league,
union) 1,086 793.9 (748.6, 839.2) 1,130 678.3 (640.1, 716.5) 1,161 585.2 (551.6, 618.7) Football, soccer 997 268.9 (252.4, 285.3) 1,118 267.2 (251.8, 282.7) 1129 293.6 (276.5, 310.7) Football, Australian rules 331 630.5 (564.7, 696.2) 340 788.9 (708.4, 869.3) 342 994.2 (889.3, 1,099.0) Basketball 206 120.4 (104.1, 136.7) 185 134.4(115.2, 153.7) 207 135.8 (117.3, 154.3) Netball 200 134.9 (116.3, 153.4) 185 121.2 (103.8, 138.5) 265 157.5 (138.5, 176.4)
Team bat or stick sports
Cricket 195 103.4 (89.0, 117.8) 200 91.4 (78.8, 104.0) 240 147.3 (128.7, 166.0)
Individual water sports Surfing and boogie
boarding 204 136.3 (117.7, 154.8) 224 96.4 (83.9, 109.0) 242 137.3 (120.0, 154.5) Swimming 79 8.6 (6.7, 10.5) 107 11.1 (9.0, 13.2) 94 10.8 (8.6, 13.0)
Ice and snow sports 372 422.7 (380.7, 464.8) 371 277.1 (249.3, 304.9) 347 362.6 (324.5, 400.7)
Individual athletic activities 132 3.8 (3.1, 4.4) 129 3.6 (3.0, 4.2) 115 4.2 (3.5, 5.0)
Acrobatic sports 19 # 18 131.1 (79.0, 183) 19 83.0 (45.7, 120.3)
Racquet sports 246 39.5 (34.6, 44.4) 199 29.8 (25.7, 34.0) 215 36.0 (31.2, 40.8) Target and precision
sports 113 17.7 (14.4, 21.0) 119 16.8 (13.8, 19.8) 126 18.1 (14.9, 21.3)
Equestrian activities 289 617.5 (548.6, 686.5) 311 464.9 (414.4, 515.3) 307 427.0 (379.3, 474.6)
Wheeled motor and non-motor sports
Motor sports 402 857.1 (777.0, 937.3) 517 711.1 (652.1, 770.2) 550 971.7 (890.9, 1,052.5) Cycling 293 72.5 (64.2, 80.7) 344 71.4 (63.9, 78.9) 344 72.5 (64.9, 80.2)
Note: only ICD-10-AM activity code categories with comparable ABS participation data are able to be presented. * Age-standardised rate per 100,000 participants.
+ 2003-2004, ICD-10-AM 3rd Edition; 2005, ICD-10-AM 4th Edition # Participation data not available for 2003
Figure A.2 shows that there was no change in the overall distribution of the nature of injury in the sport/leisure injury hospitalisation cases over 2003-2005. Just over half (55.2%) of all injuries that occurred during sport/leisure activities that resulted in hospitalisation were fractures, as expected, given that hospitalisation data represent the severe end of the sport/leisure injury spectrum. Sprains or strains (7.9%), dislocations (7.1%), and open wounds (5.9%) were also common types of injuries that resulted in sport/leisure injury hospitalisation (Figure A.2).
Figure A.3 compares the annual distribution of the principal injured body region and shows no significant trends over 2003-2005. Just less than three-quarters (71.5%) of all sport/leisure injuries involved the upper (41.1%) or lower (30.4%) limbs. Injuries to the head (17.1%) were also common for among sport/leisure injury hospitalisations (Figure A.3).

Table A.6 Most common external causes (mechanism) of sport/leisure injuries resulting in sport/leisure injury hospitalisation of NSW residents by year, NSW, 2003–2005
2003 + 2004 + 2005 +
ICD-10-AM code ICD 10 description
n % n % n %
W03 Fall on same level due to collision with, or pushing by, another person
1,768 14.1 1,877 14.7 1,891 14.3
X50 Overexertion and strenuous or repetitive movements
976 7.8 962 7.5 1,004 7.6
W18 Other fall on same level 747 5.9 764 6.0 1,124 8.5
W01 Fall on same level from slipping, tripping and stumbling
721 5.7 671 5.2 677 5.1
W02 Fall involving ice skates, skis, roller skates or skateboards
670 5.3 641 5.0 704 5.3
W50 Hit, struck, kicked, twisted, bitten or scratched by another person
643 5.1 633 4.9 688 5.2
W21 Striking against or struck by sports equipment
608 4.8 586 4.6 662 5.0
W09 Fall involving playground equipment 571 4.5 568 4.4 471 3.6
W51 Striking against or bumped into by another person
461 3.7 473 3.7 631 4.8
V80 Animal rider or occupant of animal-drawn vehicle injured in transport accident
408 3.2 438 3.4 425 3.2
V18 Other fall on same level 404 3.2 437 3.4 386 2.9
V28 Motorcycle rider injured in non-collision transport accident
362 2.9 390 3.0 394 3.0
W19 Unspecified fall 283 2.3 266 2.1 284 2.1
V19 Pedal cyclist injured in other and unspecified transport accident
217 1.7 256 2.0 284 2.1
V29 Motorcycle rider injured in other and unspecified transport accident
147 1.2 196 1.5 182 1.4
W22 Striking against or struck by other objects 137 1.1 144 1.1 164 1.2
W17 Other fall from one level to another 136 1.1 135 1.1 135 1.0
W16 Diving or jumping into water causing injury other than drowning
94 0.7 107 0.8 109 0.8
X59 Exposure to unspecified factor 1,311 10.4 1,479 11.6 1,244 9.4
X58 Exposure to other specified factors 246 2.0 253 2.0 338 2.6
All other injury mechanism 1,647 13.1 1,513 11.8 1,414 10.7
Total 12,577 100.0 12,789 100.0 13,211 100.0
+ 2003-2004, ICD-10-AM 3rd Edition; 2005, ICD-10-AM 4th Edition
17

Figure A.2 Comparison of the annual distribution of the nature of injury (according to principal diagnosis) of sport/leisure injury hospitalisations of NSW residents in NSW, 2003–
2005 +
0%10%20%30%40%50%60%70%80%90%
100%
2003 2004 2005
Other
Intracranial injury
Injury to internalorganInjury to muscle &tendonFracture
Sprain or strain
Dislocation
Open wound
Superficial injury
+ 2003-2004, ICD-10-AM 3rd Edition; 2005, ICD-10-AM 4th Edition
Figure A.3 Comparison of the annual distribution of the body region (according to principal diagnosis) of sport/leisure injury hospitalisations of NSW residents in NSW, 2003–
2005 +
0%
10%
20%
30%
40%
50%
60%
70%
80%
90%
100%
2003 2004 2005
OtherLower limbUpper limbTrunkNeckHead
+ 2003-2004, ICD-10-AM 3rd Edition; 2005, ICD-10-AM 4th Edition
18

Table A.7 lists the 20 most common principal diagnoses of the sport/leisure injury hospitalisations. Overall, fractures of the forearm (19.8%) and lower leg, including ankle, (11.8%) were the two most common specific principal diagnoses that led to a sport/leisure injury hospitalisation. Other common principal diagnoses were dislocations, sprains and strains of joints and ligaments of the knee (8.1%), fractures at the wrist and hand level (7.4%), fractures of the shoulder and upper arm (5.4%), and fractures of the skull and facial bones (5.2%) (Table A.7). Comparison of the distributions in each year, suggests a possible increase in the number of dislocation, sprain and strain of joints and ligaments of knee (S83) and fracture at wrist and hand level (S62) injuries in 2005 compared to 2003.
Table A.7 The twenty most common principal diagnoses of sport/leisure injury hospitalisations of NSW residents in NSW, 2003–2005
ICD
10-AM code
ICD 10 description 2003 + 2004 + 2005 +
n % n % n % S52 Fracture of forearm 2,572 20.5 2,523 19.7 2,557 19.4
S82 Fracture of lower leg, including ankle
1,474 11.7 1,607 12.6 1,486 11.2
S83 Dislocation, sprain and strain of joints and ligaments of knee
895 7.1 1,042 8.2 1,193 9.0
S62 Fracture at wrist and hand level 849 6.8 933 7.3 1,056 8.0
S42 Fracture of shoulder and upper arm
653 5.2 696 5.4 717 5.4
S02 Fracture of skull and facial bones 650 5.2 679 5.3 691 5.2
S06 Intracranial injury 608 4.8 594 4.6 639 4.8
S43 Dislocation of shoulder joint 388 3.1 408 3.2 439 3.3
S86 Injury of muscle and tendon at lower e.g. level
417 3.3 359 2.8 367 2.8
S09 Other and unspecified injuries of head
377 3.0 346 2.7 349 2.6
S01 Open wound of head 385 3.1 348 2.7 343 2.6
S22 Fracture of rib(s), sternum and thoracic spine
198 1.6 183 1.4 181 1.4
S19 Other and unspecified injuries of neck
185 1.5 162 1.3 159 1.2
S72 Fracture of femur 170 1.4 173 1.4 183 1.4
S63 Dislocation, sprain and strain of joints and ligaments at wrist and hand level
160 1.3 146 1.1 164 1.2
S92 Fracture of foot, except ankle 166 1.3 140 1.1 168 1.3
S39 Other and unspecified injuries of abdomen, lower back and pelvis
142 1.1 135 1.1 138 1.0
S00 Superficial injury of head 125 1.0 133 1.0 126 1.0
S32 Fracture of lumbar spine and pelvis 112 0.9 145 1.1 135 1.0
S81 Open wound of lower leg 112 0.9 127 1.0 121 0.9
All other diagnoses 1,919 15.2 1,910 15.0 1,999 15.1
Total 12,557 100.0 12,789 100.0 13,211 100.0 + 2003-2004, ICD-10-AM 3rd Edition; 2005, ICD-10-AM 4th Edition
19

There was no significant difference in the places where the sport/leisure injury hospitalisations occurred during 2003-2005 (Figure A.4). Overall, sports and athletic areas (44.9%) were the most common location where sport/leisure injury occured. However, 41.0% of the locations were identified as either other specified locations (12.7%) or unknown locations (28.3%) (Figure A.4).
Figure A.4 Comparison of the distribution of the locations where the events leading to sport/leisure injury hospitalisation of NSW residents occurred in NSW, 2003–2005 +
0%10%20%30%40%50%60%70%80%90%
100%
2003 2004 2005
Unknown
Other
Trade and serviceareaStreet and highway
Sports and athleticsareaSchool
Home
+ 2003-2004, ICD-10-AM 3rd Edition; 2005, ICD-10-AM 4th Edition
In-hospital Procedures/Treatments for Sport/Leisure Injury Examining the principal procedures performed on admission to hospital following a sport/leisure injury identified a wide range of hospital-based treatments or procedures. Table A.8 lists the 20 most commonly received in-hospital procedures, as determined from the principal procedure code for each case, received for sport/leisure injury hospitalisations during 2003-2005. A fuller list is given in Appendix 3.
The most common principal procedures performed were closed reductions of fractures of the radius (12.8%), reconstruction procedures on the knee (5.3%), open reductions of fractures of the ankle or toe (4.2%), and computerised tomography (CT scan) of the brain (3.8%) (Table A.8).
The principal procedures conducted on a sport/leisure hospitalisation cases, as a proportion of procedures conducted for all injuries, ranged from 6.0% to 59.2%. Reconstruction of the knee (59.2%), the repair of tendons or ligaments in the ankle or foot (43.1%), and closed reductions of the fracture of the shaft of the tibia (39.6%) were all principal procedures commonly conducted for sport/leisure injury. These sport/leisure cases accounted for over one-third of the types of procedures conducted in all hospitalised injuries (Table A.8).
Table A.8 also presents the relative contribution of sport/leisure injuries to all injury cases requiring each principal procedure. For example, 59.2% of all injury hospitalisation cases receiving reconstruction procedures on knee were associated with sport/leisure, suggesting that this procedure is particularly relevant to sport/leisure injuries. Other categories of particular relevance to sport/leisure injuries (accounting for 25% or more of all such principal procedures) are: repair of tendon or ligament of ankle or foot (43.1%), closed reduction of fracture of shaft of tibia (39.6%), reduction of dislocation
20

of clavicle, scapula or shoulder (31.1%), closed reduction of phalanx of hand (29.8%), open reduction of fracture of shaft of tibia (28.3), reduction of fracture of shaft of radius and ulna (27.9%) and closed reduction of fracture of radius (26.7%).
Table A.8 The twenty most common principal procedures given to sport/leisure injury hospitalisation cases of NSW residents in NSW, 2003–2005
ICD-10-AM procedure code
Procedure Sport/leisure
injuries n
% of all sport/leisure injury cases
with this principal
procedure
% of all all-cause injury
hospitalisations with this principal
procedure that were associated with sport/leisure 1
1427 Closed reduction of fracture of radius 4,946 12.8 26.7
1522 Reconstruction procedures on knee 2,033 5.3 59.2
1539 Open reduction of fracture of ankle or toe 1,638 4.2 23.5
1952 Computerised tomography of brain 1,457 3.8 11.2
1916 Generalised allied health interventions 1,149 3.0 6.0
1542 Repair of tendon or ligament of ankle or foot 964 2.5 43.1
1429 Open reduction of fracture of radius 857 2.2 20.0
1431 Reduction of fracture of shaft of radius and ulna 820 2.1 27.9
1402 Reduction of dislocation of clavicle, scapula or shoulder
789 2.0 31.1
1509 Closed reduction of fracture of shaft of tibia 717 1.9 39.6
1635 Repair of wound of skin and subcutaneous tissue
682 1.8 6.3
1454 Closed reduction of phalanx of hand 669 1.7 29.8
1365 Reduction of fracture of nasal bone 615 1.6 18.5
1959 Computerised tomography of spine 611 1.6 16.4
1457 Open reduction of fracture of phalanx of hand 603 1.6 19.5
1413 Closed reduction of fracture of humerus or elbow
568 1.5 22.6
1453 Closed reduction of fracture of metacarpus of hand
411 1.1 17.6
1566 Excision procedures on other musculoskeletal sites
409 1.1 6.2
1456 Open reduction of fracture of metacarpus of hand
405 1.1 16.9
1510 Open reduction of fracture of shaft of tibia 397 1.0 28.3
1 Percentage of all instances of this procedure performed for injury hospitalizations that related to sport/leisure injury.
21

The ten most common types of principal procedures performed during a sport/leisure injury hospitalisation differed by age group. As a proportion of all such procedures, reduction of fractures of the shaft of the radius and ulna (48.2%) and closed reduction of fractures of the ulna or olecranon (47.8%) were procedures conducted for children aged <9 years, accounting for the highest proportion of these two procedures compared to all other age groups (Table A.10). For youths aged 10-19 years, closed reduction of fractures of the ankle or toe (63.4%), and for individuals aged 20-44 years, repairs of tendons or ligaments of the ankle or foot (73.5%) represented the most common procedures conducted for these age groups. The majority of arthroplasties of the hip (83.9%) were conducted for individuals aged 70+ years.
The ten most common principal procedures following a hospitalised sport/leisure injury also varied by sport/leisure activity. Of the reduction of fractures of the mandible or maxilla performed for all sport/leisure hospitalised injuries, just less than one-third were for rugby-related injuries (union and league). Likewise, just less than one-third of all closed reduction fractures of the shaft of the tibia were performed for soccer-related injuries. Of the repairs of tendons or ligaments of the ankle or foot, 16.1% were for netball-related injuries (Table A.11).
Of the repairs of ligaments or capsules of the phalangeal joint of the hand performed for all sport/leisure hospitalised injuries, 39.7% were performed for ice and snow sport/leisure injuries. Around 17% of all reductions of fractures of the pelvis or femur were performed for motorcycling-related injuries. Just over one in ten of all excision procedures on other musculoskeletal sites (13.9%) were performed for injuries received while cycling and closed reductions of fractures of the radius (11.7%) were common skating and rollerblading injuries.
Implications
Overall, the annual average age-standardised rate of sport/leisure injury hospitalisations in NSW was 192.4 per 100,000 head of population, during 2003-2005. This indicates that severe sport/leisure injury is a significant issue in this State.
Importantly, this analysis of routinely collected hospitalisation data for NSW, has shown that there has been a non-statistically significant increase in sport/leisure injury hospitalisation rates over the period 2003-2005. This suggests that either currently implemented safety programs are not fully effective in preventing sport/leisure injuries or that not enough preventive effort is directed towards this important cause of hospitalised injury morbidity in NSW. The fact that most participation-based injury hospitalisation rates did not increase significantly in 2005, relative to 2003 (at least in adults aged 15+ years), suggests that these trends are unlikely to be explained solely by increasing numbers of participants in these sports. Notwithstanding these trends, rugby (union and league), soccer, football unspecified, and cycling were the activities most commonly conducted at the time of the injurious incident that resulted in sport/leisure injury hospitalisations.
There is a suggestion that participation-based injury hospitalisation rates may have increased for the sports of Australian rules football and cricket, but declined in rugby, football and equestrian activities. On a per head of population basis, injury rates appear to have increased significantly for motorcycle sports and football (unspecified). However, given the large number of “football unspecified” cases, these trends need to be interpreted with caution. The specific reasons for these trends are not able to be determined from this data and changes in coding practices, as reflected in trends in the categories of football, unspecified and other specified sport and leisure activity may have contributed to these observations. Unfortunately, this data does not distinguish whether the injuries were assigned to a specific activity that occurred during formal sport or more leisure time forms of the activity (e.g. kick-to-kick in a park or at home).
22
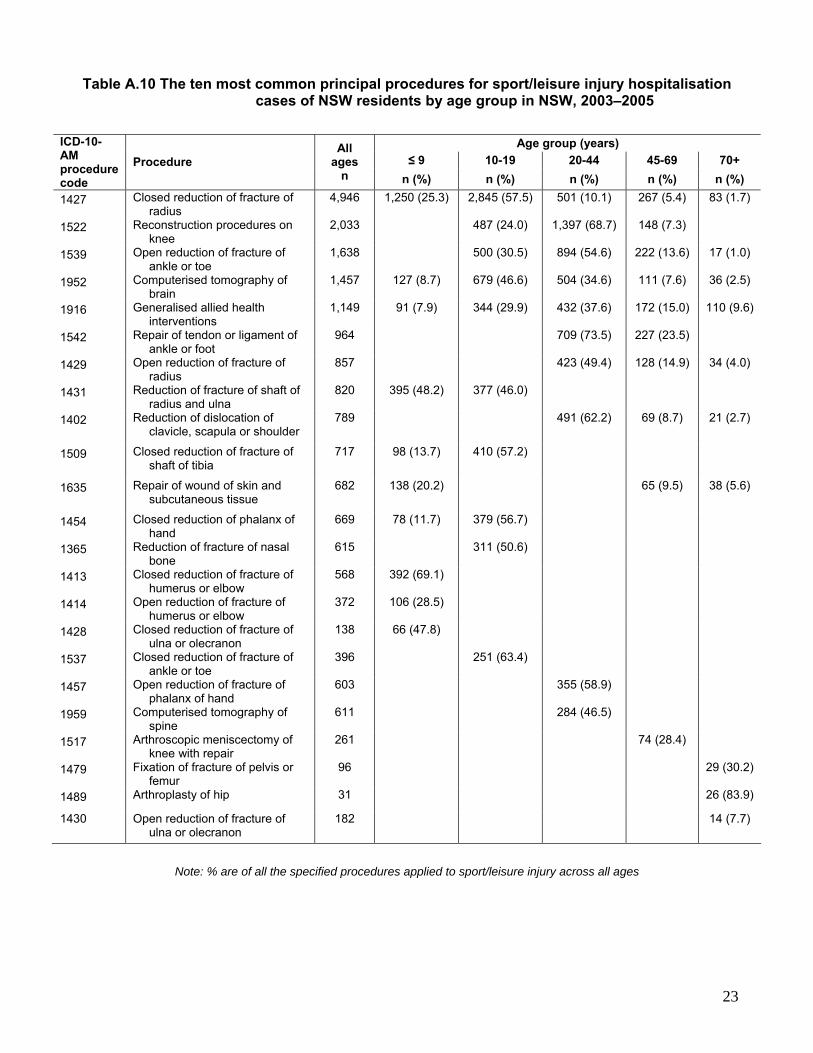
Table A.10 The ten most common principal procedures for sport/leisure injury hospitalisation cases of NSW residents by age group in NSW, 2003–2005
Age group (years) ≤ 9 10-19 20-44 45-69 70+
ICD-10-AM procedure code
Procedure All
ages n n (%) n (%) n (%) n (%) n (%)
1427 Closed reduction of fracture of radius
4,946 1,250 (25.3) 2,845 (57.5) 501 (10.1) 267 (5.4) 83 (1.7)
1522 Reconstruction procedures on knee
2,033 487 (24.0) 1,397 (68.7) 148 (7.3)
1539 Open reduction of fracture of ankle or toe
1,638 500 (30.5) 894 (54.6) 222 (13.6) 17 (1.0)
1952 Computerised tomography of brain
1,457 127 (8.7) 679 (46.6) 504 (34.6) 111 (7.6) 36 (2.5)
1916 Generalised allied health interventions
1,149 91 (7.9) 344 (29.9) 432 (37.6) 172 (15.0) 110 (9.6)
1542 Repair of tendon or ligament of ankle or foot
964 709 (73.5) 227 (23.5)
1429 Open reduction of fracture of radius
857 423 (49.4) 128 (14.9) 34 (4.0)
1431 Reduction of fracture of shaft of radius and ulna
820 395 (48.2) 377 (46.0)
1402 Reduction of dislocation of clavicle, scapula or shoulder
789 491 (62.2) 69 (8.7) 21 (2.7)
1509 Closed reduction of fracture of shaft of tibia
717 98 (13.7) 410 (57.2)
1635 Repair of wound of skin and subcutaneous tissue
682 138 (20.2) 65 (9.5) 38 (5.6)
1454 Closed reduction of phalanx of hand
669 78 (11.7) 379 (56.7)
1365 Reduction of fracture of nasal bone
615 311 (50.6)
1413 Closed reduction of fracture of humerus or elbow
568 392 (69.1)
1414 Open reduction of fracture of humerus or elbow
372 106 (28.5)
1428 Closed reduction of fracture of ulna or olecranon
138 66 (47.8)
1537 Closed reduction of fracture of ankle or toe
396 251 (63.4)
1457 Open reduction of fracture of phalanx of hand
603 355 (58.9)
1959 Computerised tomography of spine
611 284 (46.5)
1517 Arthroscopic meniscectomy of knee with repair
261 74 (28.4)
1479 Fixation of fracture of pelvis or femur
96 29 (30.2)
1489 Arthroplasty of hip 31 26 (83.9)
1430 Open reduction of fracture of ulna or olecranon
182 14 (7.7)
Note: % are of all the specified procedures applied to sport/leisure injury across all ages
23

Table A.11 The ten most common principal procedures for sport/leisure injuries resulting in sport/leisure injury hospitalisation of NSW for selected team ball sports in NSW,
2003–2005
Sport Rugby,
union and league
Soccer Australian
rules football
Basketball Netball ICD-10-AM procedure code
Procedure All ages n
n (%) n (%) n(%) n (%) n (%) 1427 Closed reduction of fracture of
radius 4,946 426 (8.6) 677 (13.7) 126 (2.5) 140 (2.8) 131 (2.6)
1522 Reconstruction procedures on knee
2,033 216 (10.6) 458 (22.5) 56 (2.8) 65 (3.2) 185 (9.1)
1539 Open reduction of fracture of ankle or toe
1,638 244 (14.9) 332 (20.3) 80 (4.9) 24 (1.5) 16 (1.0)
1952 Computerised tomography of brain
1,457 245 (16.8) 99 (6.8) 55 (3.8) 24 (1.6) 15 (1.0)
1916 Generalised allied health interventions
1,149 129 (11.2)
1542 Repair of tendon or ligament of ankle or foot
964 163 (16.9) 56 (5.8) 155 (16.1)
1429 Open reduction of fracture of radius
857 109 (12.7) 24 (2.8) 23 (2.7)
1431 Reduction of fracture of shaft of radius and ulna
820 92 (11.2) 12 (1.5)
1402 Reduction of dislocation of clavicle, scapula or shoulder
789 138 (17.5) 24 (3.0)
1509 Closed reduction of fracture of shaft of tibia
717 223 (31.1)
1635 Repair of wound of skin and subcutaneous tissue
682
1454 Closed reduction of phalanx of hand
669 113 (16.9) 47 (7.0) 51 (7.6) 34 (5.1)
1365 Reduction of fracture of nasal bone
615 124 (20.2) 39 (6.3)
1365 Reduction of fracture of nasal bone
615 26 (4.2)
1959 Computerised tomography of spine
611 137 (22.4)
1457 Open reduction of fracture of phalanx of hand
603 42 (7.0) 29 (4.8) 20 (3.3)
1453 Closed reduction of fracture of metacarpus of hand
411 32 (7.8)
1456 Open reduction of fracture of metacarpus of hand
405 36 (8.9)
1510 Open reduction of fracture of shaft of tibia
397 100 (25.2)
1537 Closed reduction of fracture of ankle or toe
396 94 (23.7)
1366 Reduction of fracture of mandible or maxilla
350 108 (30.9) 33 (9.4)
1503 Arthroscopic excision of knee 342 16 (4.7)
Note: % are of all the specified procedures applied to sport/leisure injury across all ages
24

Table A.12 The ten most common principal procedures for sport/leisure injury hospitalisations
of NSW residents for selected wheeled sports, equestrian activities, and ice and snow sports in NSW, 2003–2005
Sport
Motorcycling Cycling Skating & rollerblading Equestrian Ice &
snow
ICD-10-AM procedure code
Procedure All
ages n
n (%) n (%) n (%) n (%) n(%) 1427 Closed reduction of fracture of
radius 4,946 150 (3.0) 258 (5.2) 579 (11.7) 137 (2.8) 75 (1.5)
1522 Reconstruction procedures on knee
2,033 337 (16.6)
1539 Open reduction of fracture of ankle or toe
1,638 69 (4.2) 33 (2.0) 64 (3.9) 32 (2.0) 45 (2.7)
1952 Computerised tomography of brain
1,457 69 (4.7) 110 (7.5) 50 (3.4) 87 (6.0) 31 (2.1)
1916 Generalised allied health interventions
1,149 88 (7.7) 61 (5.3) 29 (2.5) 93 (8.1) 40 (3.5)
1429 Open reduction of fracture of radius
857 64 (7.5) 63 (7.4) 58 (6.8) 33 (3.9) 31 (3.6)
1431 Reduction of fracture of shaft of radius and ulna
820 38 (4.6) 76 (9.3) 19 (2.3)
1402 Reduction of dislocation of clavicle, scapula or shoulder
789 17 (2.2)
1509 Closed reduction of fracture of shaft of tibia
717 66 (9.2) 45 (6.3) 27 (3.8)
1635 Repair of wound of skin and subcutaneous tissue
682 88 (12.9)
1959 Computerised tomography of spine
611 49 (8.0) 33 (5.4) 55 (9.0)
1413 Closed reduction of fracture of humerus or elbow
568 37 (6.5)
1566 Excision procedures on other musculoskeletal sites
409 56 (13.7) 57 (13.9)
1510 Open reduction of fracture of shaft of tibia
397 41 (10.3)
1414 Open reduction of fracture of humerus or elbow
372 19 (5.1) 23 (6.2)
1628 Other debridement of skin and subcutaneous tissue
301 43 (14.3)
1486 Reduction of fracture of pelvis or femur
266 45 (16.9)
1517 Arthroscopic meniscectomy of knee with repair
261 24 (9.2)
1963 Computerised tomography of abdomen and pelvis
253 23 (9.1)
1401 Reduction of fracture of clavicle or shoulder
252 36 (14.3)
1415 Closed reduction of dislocation of humerus or elbow
188 17 (9.0)
1465 Repair of ligament or capsule of phalangeal joint of hand
63 25 (39.7)
Note: % are of all the specified procedures applied to sport/leisure injury across all ages
25

There were no significant trends across 2003-2005 in the patterns of injury mechanisms, external causes, nature of injury, body region injured or place of injury. However, there was an indication of a possible increase in the number of dislocation/strain/sprains of the knee and fractures of the wrist/hand between 2003 and 2005. Overall, falls were the most common injury mechanism for hospitalised sport/leisure injuries, representing around 40% of all sport/leisure admissions. The most common nature of injury for hospitalised sport/leisure injuries were fractures and the most commonly injured body regions were the upper limbs, lower limbs, and head.
As the hospitalisation data and ABS participation data use different definitions of sport/leisure, the participation-based rates need to be interpreted with some caution. The ABS participation data used related to participation in organised sport or physical activity, whereas the hospitalisation data could not distinguish between formal and informal participation. This means that the numerator and denominator used in the rate calculations are not fully comparable. There is a need for a consistent definition of a sports injury to be adopted and used in NSW to aid in the standardisation of the identification of sports injuries and the calculation of robust participation-based figures.
The rates of sport/leisure injury hospitalisations in this report were calculated using both the total population and the number of participants as the denominator data. Use of the total population as the denominator in an incidence rate calculation is likely to underestimate the true risk of a hospitalised sport/leisure injury as not all of the population participates in sport/leisure activities. Using the number of participants should provide a better estimate of injury risk. However, this data is hampered by low survey sample sizes, different definitions to the hospitalised injury data and participant information not being collected for each sport 13-15 At the time of writing this report, comparable participation data for children was not available and so the participation-based rates have been restricted to 15+ year olds. It is recommended that a formal assessment of participation-based injury rates be calculated for children at a future time.
As noted in previous IRMRC reports, the identification of sport/leisure injuries in hospitalisation data would be assisted by the improved coding of both the activity performed at time of incident and the place of incident coding. 5 6 The interested reader is referred to the report Sports and leisure injury hospitalisations in NSW, 2003-2004: sociodemographic and geographic patterns and sport-specific profiles 6 for a detailed discussion of this issue and the implications for injury rates. It is likely that some injury hospitalisation cases with unspecified or missing activity codes were truly associated with sport/leisure. However, as they were not able to be identified as such, the analysis of the sport/leisure injury hospitalisation data in this report should be considered to be an underestimate of the true rate of sport/leisure injury hospitalisations in NSW.
The relatively large number of unspecified sport/leisure activity codes (including football, unspecified) suggests that the specificity of actual sport or leisure activity identified in ICD-10-AM coded data could be improved. For example, an average of 26.9% of cases were coded as other specified sport and exercise activity or leisure activity, not elsewhere classified (U70), though a decline in the number of the latter did decrease over the 3-year period. This relatively high level of non-specific coding could either reflect a need to obtain further information regarding the circumstances surrounding the incident that led to the hospital admission or could represent a lack of suitable classification codes in ICD-10-AM to identify sport/leisure injuries. As there are currently 260 sport/leisure injury codes in the ICD-10-AM from which to select, the lack of suitable classification codes from which to select appears unlikely.
Particularly in relation to the football codes, the ability to be able to identify the specific type of sporting code that was being played at the time of the injury, such as the differentiation between rugby union or rugby league, is crucial in order to determine the injury incidence rates of each of these different sports 5 6. Over the three years of sport/leisure injury hospitalisation data examined for this report, there were 3,441 sport/leisure injury hospitalisations where the activity was coded as either other specified or unspecified football. Similarly, the distinction between different sporting settings, such as indoor or outdoor cricket, should be able to be identified in all data collections. It may be that further training related to data collection and classification or the addition of a narrative text field to
26

sport/leisure injury hospitalisation data could assist in the appropriate identification of particular sporting activities.
Solely using ICD-10-AM to classify sport/leisure injury hospitalisation data means that there is no scope to record specific detail regarding the type of activity performed at the time of the incident. For example, if the sporting activity was identified as cricket, no information is available regarding whether the player was batting, bowling, or fielding when the injury occurred, nor what phase of activity was being undertaken, such as training or competition. This specific type of information is often necessary to identify effective injury prevention strategies for specific sports.
This report has also provided a listing of the most common procedures received in hospital for the principal injury diagnosis for sport/leisure injury cases. As expected by the nature of the data collection, such procedures reflect the severity of hospitalised injury as evidenced by the most common being reductions of radius fractures, knee reconstructions, reductions of ankle/toe factures and CT scans of the brain. It would also appear that sport/leisure injuries account for almost 60% of all knee reconstructions for injury hospitalisations in NSW, as well as more than 40% of all repairs of ankle/foot tendons/ligaments and more than one-third of all reductions of fractures to the tibia shaft. As some injury patients admitted to hospital have more than one injury, it is likely that the actual number of such procedures for sport/leisure injury is more than that reported here. Given the relevance of data about the procedures received to health service planning, it is recommended that future research explores the full range of procedures received by hospitalised sport/leisure injury patients.
Recommendations
Given there has been no reduction in overall sport/leisure injury rates in NSW during 2003-2005, the extent to which effective sport/leisure safety programs have been developed and fully implemented in NSW needs to be determined. A strategic state-wide approach to sports safety, which includes the development of a sports policy framework involving government and non-government agencies, in conjunction with the development of safety guidelines for sports bodies to implement, needs to be adopted for the whole of NSW to reduce these rates in the future.
Rugby, soccer, cycling, Australian rules football, cricket, and motorcycle sports should be the prime focus of increased injury prevention attention in NSW because of their predominance in the sport/leisure injury hospitalisation data and/or their association with increasing injury rates over the 2003-2005 period.
Detailed routine injury surveillance systems should be developed and implemented especially for the activities with high or increasing injury rates, to continue to monitor these injury trends in specific sports. Such surveillance should be wide, across many contexts and levels of participation, to determine the extent to which such injuries are related to organised sport participation.
Consideration should be given by agencies collecting routine injury and sport participation data to develop and use consistent definitions to aid the standardisation of the identification of sports injuries and the calculation of robust participation-based injury rates.
Consideration should be given to enhancements to the ICD-10-AM coding manual that would allow the phase of play/actual activity at the time of injury to be reported (even if as a narrative) and for the type of activity to be properly differentiated between organised sport, informal sport and general play.
A formal assessment of participation-based injury rates should be undertaken for children, using the latest ABS participation data.
Reasons for the relatively high level of unspecified on non-specific ICD-10-AM activity codes for sport/leisure injury needs to be explored so that potential solutions for reducing these data inadequacies can be developed and implemented.
27

28
Given the importance of data about the medical/surgical procedures received in hospital for health service planning, it is recommended that future research quantifies the full range of procedures received by hospitalised sport/leisure injury patients, in terms of their frequency, medical cost and public health burden.

PART B. SELF-REPORTED INJURIES RELATED TO ORGANISED SPORT IN NSW
Part A of this report described trends in the rate and profile of hospitalised sport/leisure injury cases in NSW for the period 2003-2005. It is known from other Australian studies 7 8 17 18 that hospitalisations are only the tip of the iceberg in that they only relate to the most severe sports injury cases and many sports injuries do not require hospitalisation. This means that many more sport/leisure injuries occur in NSW that are treated outside of the formal hospital setting. To get an indication of the extent to which sport/leisure injuries in NSW residents are likely to require treatment in a hospital, information about the population incidence of all sport/leisure injury is required. One potentially valuable source of population-level sport/leisure injury frequency is from large scale population health surveys, such as those conducted by NSW Health
Part B of this report therefore describes the self-reported injury experience of NSW adults aged 16+ years during organised sporting activities. Information from respondents of the 2005 NSW Population Health Survey is used to describe organised sport participation habits and the proportion of participants injured during this activity by age and sex. The responses provided about the most common sources of treatment for sport/leisure injury provide evidence for the likely underreporting of the burden of sport/leisure injury cases in NSW, which is often estimated based on hospitalisation data alone. Moreover, this information about the distribution of treatment sources is important for determining how common sport/leisure injuries are in the general community and the extent to which routine data collections, such as sport/leisure injury hospitalisations, provide coverage of all such injuries.
Data Used and Analysis
This part of the report describes the self-reported experience of injuries during organised sporting activities of individuals 16+ years in NSW, as determined from the 2005 NSW Population Health Survey 19.
Overall, 13,701 respondents were sampled in the 2005 NSW Adult Health Survey conducted by NSW Health 20. The overall response rate was 57.7% (completed interviews divided by completed interviews and refusals). Information on organised sport participation and the subsequent occurrence of a sport/leisure injury are based on 2,414 respondents aged 16 years and over who participated in the sports-related questions in the 2005 NSW Population Health Survey10.
The full details concerning the development of the survey and the methods used are described elsewhere 20 A two-stage cluster sample design was used, with the sample stratified by each of the eight NSW Area Health Services (AHS). Within each AHS, households were randomly selected using a computer-generated list of telephone numbers. Respondents were then randomly selected from each household for a computer-assisted telephone interview.
Interviews were conducted continuously from February to December 2005 20. Households that were selected for a telephone interview that had postal addresses in the electronic phone book were sent a letter describing the aims and methods of the survey two weeks before the initial attempt at telephone contact. A 1800 free call telephone number was provided in the letter for potential respondents to verify the authenticity of the survey and to ask any questions they may have regarding the survey prior to survey commencement. Interviews were conducted by trained Health Survey Program computer assisted telephone interview (CATI) interviewers. Up to seven call backs were made to establish initial contact with a household and up to five call backs were made to contact a selected respondent. Most respondents (98.1%) were interviewed in English. During each interview, information obtained from all respondents included demographic factors such as age, gender, residence, income and
29

education levels; health behaviours (for example, physical activity); health status, and health service use.
Respondents who reported participating in organised sport or an activity as part of a club or association or high school whether for training, fitness or competition in the past 12 months were asked to indicate whether they had sustained an injury related to sport during the same period. Those who reported a sport/leisure injury were asked, on average, how many times they had been injured playing sport (including training) in the last 12 months and the type of medical treatment that they received as a result of their most recent injury. The questions regarding sports injury (see Appendix 4) were field tested prior to inclusion in the survey.
The analysis was undertaken using SAS statistical software, version 8.02 16. The SURVEYMEANS procedure was used to analyse the data and calculate proportions of reported organised sport/leisure injury and treatment by age and/or gender. Ninety-five per cent confidence intervals (95% CI) were calculated for the estimates. A sampling weight was applied to adjust for differences in the probabilities of selection among respondents. These differences were due to the varying number of people living in each household, the number of residential telephone connections for the household, and the varying sampling fraction in each AHS.
Participation in Organised Sport
A total of 2,414 respondents aged 16+ years (25.4% of all respondents; 95% CI 24.2-26.6) stated that they had participated in organised sport or an activity as part of a club or association or high school for training, fitness or competition.
People aged 16-24 years most commonly reported participating in organised sport. Overall, more males (30.2%; 95% CI 28.3-32.1) reported organised sport participation than females (20.7%; 95% CI 19.4-22.1) (Table B.1). Participation decreased with age, especially between the 16-24 and 25-34 year age groups.
Table B.1 Percentage of individuals who participated in organised sport in the previous 12 months by age group and gender, 2005 NSW Population Health Survey
Age (years) Males
% (95% CI) Females
% (95% CI) Persons
% (95% CI) 16-24 49.3 (43.6, 54.9) 40.5 (35.4, 45.6) 44.8 (41.0, 48.7) 25-34 34.8 (29.5, 40.2) 22.1 (18.7, 25.5) 28.4 (25.2, 31.6) 35-44 29.7 (25.1, 34.2) 19.2 (16.0, 22.3) 24.4 (21.6, 27.2) 45-54 25.7 (21.8, 29.5) 15.4 (12.8, 18.0) 20.6 (18.2, 22.9) 55-64 20.5 (17.2, 23.9) 15.7 (13.4, 18.0) 18.1 (16.1, 20.1) 65+ 19.3 (16.8, 21.9) 12.4 (10.7, 14.1) 15.5 (14.0, 17.0) All ages 30.2 (28.3, 32.1) 20.7 (19.4, 22.1) 25.4 (24.2, 26.6)
Note: Estimates based on 11,273 respondents to the survey. Excludes 7 respondents whose sport participation was not
stated.
On average, females reported playing around 4.0 (95% CI 3.5-4.5) hours per week of sport in the previous 12 months compared to males who reported an average of 5.3 (95% CI 4.7-6.0) hours of sport each week in the prior 12 months (Table B.2).
30
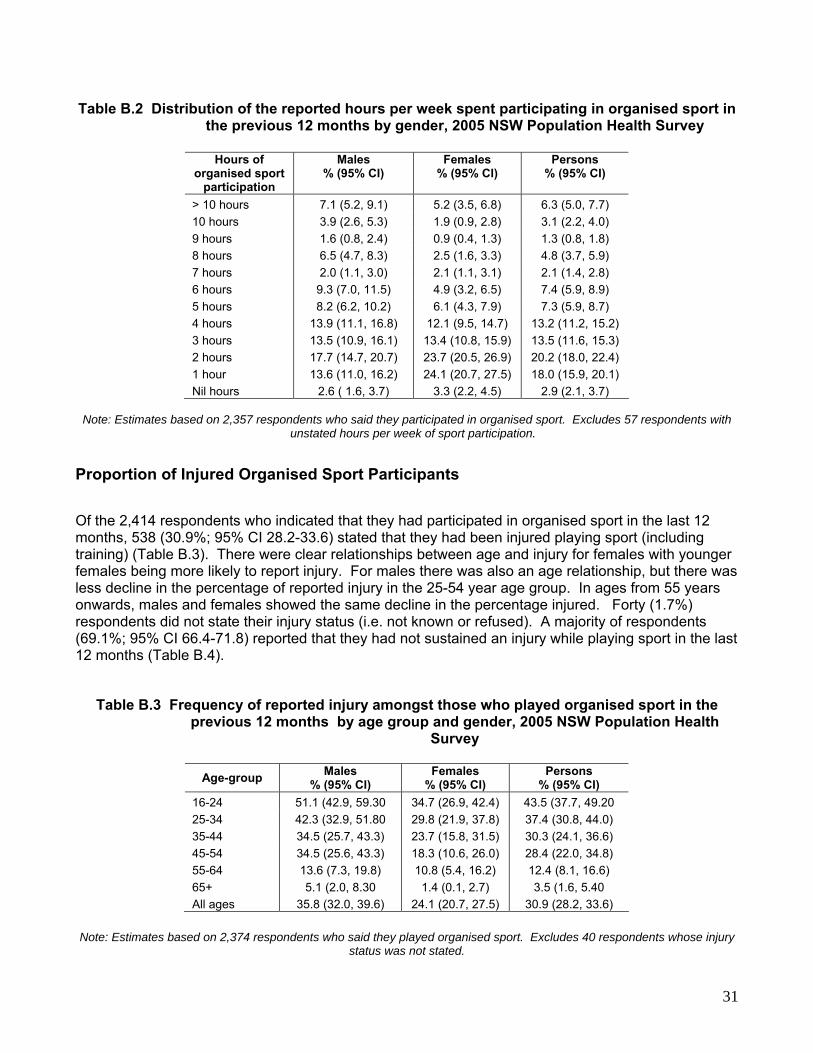
Table B.2 Distribution of the reported hours per week spent participating in organised sport in the previous 12 months by gender, 2005 NSW Population Health Survey
Hours of
organised sport participation
Males % (95% CI)
Females % (95% CI)
Persons % (95% CI)
> 10 hours 7.1 (5.2, 9.1) 5.2 (3.5, 6.8) 6.3 (5.0, 7.7) 10 hours 3.9 (2.6, 5.3) 1.9 (0.9, 2.8) 3.1 (2.2, 4.0) 9 hours 1.6 (0.8, 2.4) 0.9 (0.4, 1.3) 1.3 (0.8, 1.8) 8 hours 6.5 (4.7, 8.3) 2.5 (1.6, 3.3) 4.8 (3.7, 5.9) 7 hours 2.0 (1.1, 3.0) 2.1 (1.1, 3.1) 2.1 (1.4, 2.8) 6 hours 9.3 (7.0, 11.5) 4.9 (3.2, 6.5) 7.4 (5.9, 8.9) 5 hours 8.2 (6.2, 10.2) 6.1 (4.3, 7.9) 7.3 (5.9, 8.7) 4 hours 13.9 (11.1, 16.8) 12.1 (9.5, 14.7) 13.2 (11.2, 15.2) 3 hours 13.5 (10.9, 16.1) 13.4 (10.8, 15.9) 13.5 (11.6, 15.3) 2 hours 17.7 (14.7, 20.7) 23.7 (20.5, 26.9) 20.2 (18.0, 22.4) 1 hour 13.6 (11.0, 16.2) 24.1 (20.7, 27.5) 18.0 (15.9, 20.1) Nil hours 2.6 ( 1.6, 3.7) 3.3 (2.2, 4.5) 2.9 (2.1, 3.7)
Note: Estimates based on 2,357 respondents who said they participated in organised sport. Excludes 57 respondents with
unstated hours per week of sport participation.
Proportion of Injured Organised Sport Participants
Of the 2,414 respondents who indicated that they had participated in organised sport in the last 12 months, 538 (30.9%; 95% CI 28.2-33.6) stated that they had been injured playing sport (including training) (Table B.3). There were clear relationships between age and injury for females with younger females being more likely to report injury. For males there was also an age relationship, but there was less decline in the percentage of reported injury in the 25-54 year age group. In ages from 55 years onwards, males and females showed the same decline in the percentage injured. Forty (1.7%) respondents did not state their injury status (i.e. not known or refused). A majority of respondents (69.1%; 95% CI 66.4-71.8) reported that they had not sustained an injury while playing sport in the last 12 months (Table B.4).
Table B.3 Frequency of reported injury amongst those who played organised sport in the previous 12 months by age group and gender, 2005 NSW Population Health
Survey
Age-group Males % (95% CI)
Females % (95% CI)
Persons % (95% CI)
16-24 51.1 (42.9, 59.30 34.7 (26.9, 42.4) 43.5 (37.7, 49.20 25-34 42.3 (32.9, 51.80 29.8 (21.9, 37.8) 37.4 (30.8, 44.0) 35-44 34.5 (25.7, 43.3) 23.7 (15.8, 31.5) 30.3 (24.1, 36.6) 45-54 34.5 (25.6, 43.3) 18.3 (10.6, 26.0) 28.4 (22.0, 34.8) 55-64 13.6 (7.3, 19.8) 10.8 (5.4, 16.2) 12.4 (8.1, 16.6) 65+ 5.1 (2.0, 8.30 1.4 (0.1, 2.7) 3.5 (1.6, 5.40 All ages 35.8 (32.0, 39.6) 24.1 (20.7, 27.5) 30.9 (28.2, 33.6)
Note: Estimates based on 2,374 respondents who said they played organised sport. Excludes 40 respondents whose injury
status was not stated.
31

Table B.4 Distribution of the number of injuries sustained by those who played organised sport in the previous 12 months by gender, 2005 NSW Population Health Survey
Number if injuries sustained during organised sport
Males % (95% CI)
Females % (95% CI)
Persons % (95% CI)
> 5 injuries 3.2 (1.7, 4.7) 1.7 (0.5, 2.90 2.5 (1.5, 3.600 5 injuries 0.8 (0.1, 1.6) 1.2 (0.1, 2.3) 1 (0.4, 1.6) 4 injuries 1.9 (0.8, 2.90 0.7 (0.1, 1.2) 1.4 (0.7, 2.0) 3 injuries 4.3 (2.5, 6.1) 2.5 (1.2, 3.7) 3.5 (2.3, 4.7) 2 injuries 10.3 (7.8, 12.70 6.8 (4.6, 9.0) 8.8 (7.1, 10.5) 1 injury 15.3 (12.5, 18.2) 11.2 (8.9, 13.6) 13.6 (11.7, 15.6) No injuries 64.2 (60.4, 68.0) 75.9 (72.5, 79.3) 69.1 (66.4, 71.8)
Note: Estimates based on 2,374 respondents who said they played organised sport. Excludes 40 respondents where the
number of injuries sustained was not stated.
Treatment for most recent injury
Of the 538 respondents who stated that they were injured playing organised sport in the previous 12 months, 16.4% (95%CI 12.3-20.6) did not receive any treatment for their most recent injury. One-third (33.9%; 95%CI 28.8-39.0) self-treated their injury or were treated by a partner, parent or friend; around one-quarter (26.6%; 95%CI 21.8-31.4) received treatment from a physiotherapist and 15.6% (95%CI 11.9-19.4) of injured respondents received treatment from a general practitioner, family doctor or sports doctor (Table B.5). Only 2.8% (95%CI 1.2-4.4) of organised sport/leisure injures were reported to require admission to hospital and 6.1% (95%CI 3.5-8.7) were reported to involve a presentation to an emergency department.
Table B.5 Proportion of injured individuals injured playing organised sport in the last 12 months by treatment type and gender, 2005 NSW Population Health Survey
Source of treatment Males
% (95% CI) Females
% (95% CI) Persons
% (95% CI) Treated self 33.9 (27.5, 40.4) 33.8 (25.8, 41.7) 33.9 (28.8, 39.00 Physiotherapist 24.7 (18.7, 30.70) 30.5 (22.5, 38.4) 26.6 (21.8, 31.4) No treatment 18.0 (12.4, 23.5) 13.3 (8.1, 18.5) 16.4 (12.3, 20.6) General practitioner 16.1 (11.3, 21.0) 14.6 (8.7, 20.4) 15.6 (11.9, 19.4) Chiropractor, osteopath or acupuncturist 5.1 (1.7, 8.4) 10.3 (5.2, 15.5) 6.8 (4.0, 9.6) Emergency department 7.0 (3.5, 10.6) 4.2 (1.3, 7.2) 6.1 (3.5, 8.7) Masseur 4.0 (0.9, 7.2) 3.5 (0.8, 6.2) 3.9 (1.5, 6.2) Admitted to hospital 3.5 (1.2, 5.8) 1.4 (0.1, 2.7) 2.8 (1.2, 4.4) Sports trainer 2.0 (0.0, 4.2) 0.4 (0.0, 1.1) 1.5 (0.0, 3.00 Dentist or orthodontist 0.4 (0.0, 0.9) 0.0 (0.0, 0.0) 0.3 (0.0, 0.6) Naturopath or alternative health practitioner 0.2 (0.0, 0.5) 0.8 (0.0, 2.0) 0.4 (0.0, 0.8) Other 0.2 (0.0, 0.5) 0.2 (0.0, 0.05) 0.2 (0.0, 0.4)
Note: Estimates based on 534 respondents who said they played organised sport and sustained an injury. Excludes 40 respondents whose type of treatment was not stated. Respondents could indicate more than one response, so percentage
will total more than 100 per cent.
32

Implications
This analysis of the 2005 NSW Population Health Survey described population-level participation in organised sport and associated injuries that occurred in the course of this participation for a population-representative sample of NSW adults. Males both participated more in organised sport and were injured during such activity more frequently than females. The proportion of individuals who stated that they participated in organised sport in the last 12 months declined steadily as age increased.
Almost one-in four adults who participated in organised sport in the previous 12 months reported being injured during this sport participation, highlighting the frequency with which such injuries occur. Most of these injuries were minor, however with about 50% of cases either self-treating or receiving no treatment for their injuries. Hospitalisation for an organised sport injury was not common, with under 3% of injured organised sport participants reporting this level of care. A further 6% of injured organised sport participants received treatment at an emergency department, indicating a relatively large proportion of injuries that are not included in usual estimates of the burden of sport/leisure injuries based on routinely collected health sector data in NSW. More than half of the people with self-reported injuries had sustained two or more injuries during organised sport participation in the previous 12 months.
A limitation of the 2005 NSW Population Health Survey was that it did not ask about the type of sport played at the time of the most recent injury and so specific sport injury priorities cannot be determined from this data.
In future, information from the NSW Population Health Survey would be improved by the inclusion of additional sport/leisure questions, such as the type of sport played at the time of injury, the type of injury sustained, and the time taken off work, school or daily activities as a result of a sport/leisure injury. These questions were successfully pilot tested by the NSW Population Health Survey program and the feasibility of including them into the next edition of the NSW PopulationHealth Survey should be considered. This additional information would be useful as it would allow both the type of sport played at the time of the injury and the type of injury to be identified, and would also provide a proxy measure of the impact of the injury on the individual’s daily life. In addition, obtaining information regarding the experience of sport/leisure injuries of children aged 15 years or less should be considered for the next NSW Child Health Survey as young children, particularly those aged 10-14 years, represent the highest rate of hospitalised sport/leisure injuries in NSW.
Recommendations
Given that almost one-in four adults who participated in organised sport over a 12 month period injure themselves whilst undertaking this activity, and about half of these require some form of treatment, sports injury prevention should received priority attention in both injury prevention and physical activity promotion activities in NSW.
Males should be a particular focus of sports prevention efforts, given the higher proportion of them self-reporting injury during organised sport participation, across all age groups from 16 years onwards.
Solely using sport/leisure injury data from the NSW APDC to estimate the burden of sport/leisure injury in NSW underestimates the public health burden associated with sport/leisure injury in this State. Consideration should be given to assessing the feasibility of enhancing or establishing new routinely collected data collections to describe the burden of sport/leisure injuries on health service delivery and individuals. Different models for sport/leisure injury surveillance within various health
33

34
care settings that commonly treat sport/leisure injuries such as emergency departments, physiotherapist practices and general practitioners, in particular, should be explored.
Future NSW Population Health Survey questions about sport injury would be improved by the inclusion of additional questions requesting information about the type of sport played at the time of injury, the type of injury sustained, and the time taken off work, school or daily activities as a result of a sport/leisure injury.

REFERENCES 1. Poulos R, Donaldson A, Elkington J, C F. Understanding the barriers and bridges to the
development and implementation of evidence-informed sports injury prevention policy in NSW. A report for the NSW Sporting Injuries Committee. Sydney: University of New South Wales, 2008.
2. Australian Bureau of Statistics. Sport and Recreation: A Statistical Overview, Australia, 2007 (Edition 1). Catalogue no. 4156.0. Canberra Australian Bureau of Statistics, 2007.
3. Warburton D, Nicol C, Bredin S. Health benefits of physical activity: the evidence. Canadian Medical Association Journal 2006; 174(6):801-809.
4. Finch CF, Owen N. Injury prevention and promoting physical activity: what is the nexus? Journal of Science and Medicine in Sport 2001; 4: 77-87.
5. Boufous S, Dennis R, Finch C. A profile of hospitalisations and deaths due to sport and leisure injuries in New South Wales, 2000-2004. Sydney, Australia: NSW Injury Risk Management Research Centre, 2006. Available from www.irmrc.unsw.edu.au.
6. Finch C, Boufous S, Dennis R. Sports and leisure injury hospitalisations in NSW, 2003-2004: sociodemographic and geographic patterns and sport-specific profiles: NSW Injury Risk Management Research Centre, 2007. Available from www.irmrc.unsw.edu.au.
7. Cassell E, Finch C, Stathakis V. The epidemiology of medically-treated sport and active recreation injuries in the Latrobe Valley, Victoria. British Journal of Sports Medicine 2003; 37.:405-409.
8. Finch C, Cassell E. The public health impact of injury during sport and active recreation. Journal of Science & Medicine in Sport 2006;9: 490-497.
9. Potter Forbes M, Atkin C. Injury costs!A valuation of the burden of injury in New South Wales 1998-1999: NSW Injury Risk Management Research Centre, University of New South Wales, Sydney, 2003.
10. Centre for Epidemiology and Research. Health Outcomes and Information Statistical Toolkit (HOIST). Inpatient Statistics Collection. Sydney: Australia: NSW Department of Health, 2006.
11. National Centre for Classification in Health. The International Statistical Classification of Diseases and Related Health Problems, 10th Revision, Australian Modification (ICD-10-AM). 3rd Edition: Sydney: National Centre for Classification in Health, 2002.
12. Finch C, Valuri G, Ozanne-Smith J. Sport and active recreation injuries in Australia: evidence from emergency department presentations. British Journal of Sports Medicine 1998;32:220-225.
13. Standing Committee on Recreation and Sport. Participation in exercise, recreation and sport annual report 2003, from http://www.ausport.gov.au/scorsresearch/erass2003.asp, 2004.
14. Standing Committee on Recreation and Sport. Participation in exercise, recreation and sport annual report 2004, from http://www.ausport.gov.au/fulltext/2005/scors/ERASS2004.pdf, 2005.
15. Standing Committee on Recreation and Sport. Participation in exercise, recreation and sport annual report 2005, from http://www.ausport.gov.au/scorsresearch/erass2005.asp, 2006.
16. SAS Institute. SAS: statistical software. Version 8.02. Cary (NC): SAS Institute Inc 2000.
17. Lower T. Sport injury patterns in urban and rural accident and emergency units. Australian Journal of Rural Health 1996; 4:28-32.
18. Mummery W, Schofield G, Spence J. The epidemiology of medically attended sport and recreational injuries in Queensland. Journal of Science and Medicine in Sport 2002;5(4):307-320.
19. Centre for Epidemiology and Research. New South Wales Population Health Survey 2005 (HOIST). Sydney: NSW Department of Health, 2005.
35

20. Centre for Epidemiology and Research. 2005 Report on Adult Health from the New South Wales Population Health Survey. Sydney: NSW Department of Health, 2006: Available online at www.health.nsw.gov.au/publichealth/surveys/index.asp.
36

APPENDIX 1 ICD-10-AM SPORT/LEISURE ACTIVITY CODES
Reproduced with permission from the National Centre for Classification in Health.
37

38

39

40

41
42

43

APPENDIX 2 PARTICIPATION IN SPORT AND RECREATIONAL ACTIVITIES DATA FROM
ERASS
The Exercise, Recreation and Sport Survey (ERASS) is a joint initiative of the Australian Sports
Commission and the state and territory agencies responsible for sport and recreation. The following
participation data for NSW and associated information are reproduced with permission.
Participation figures used in this report were based o n the following ERASS questions: The following
questions are about physical activities you have participated in during the last 12 months for exercise,
recreation or sport. Do not include any activities that were part of work or household and garden
chores.
Q1 During the last 12 months did you participate in any physical activities for exercise, recreation or
sport?
Yes.......................................................1 Go to Q2
No......... ..............................................2 Go to Q6
Don’t know.................................................9 Go to Q6
Q2 What activities did you participate in?
Up to maximum of 10 activities to be coded
Participation in sport and recreational activities in NSW, 2003–2005 1
Age group (years)
Males Females Persons
15-24 1,295,200 1,228,300 2,523,500 25-34 1,292,700 1,233,700 2,526,400 34-44 1,244,100 1,227,600 2,471,700 45-54 1,095,100 1,084,900 2,180,000 55-64 814,200 795,000 1,609,200 65 and over 783,800 907,100 1,690,800 Total 6,525,000 6,476,600 13,001,600
44

Participation in selected sports and physical activities in NSW, 2003–2005 1,2
2003 2004 2005
Sport/leisure activity Males Females Persons Males Females Persons Males Females Persons Football, rugby (League, Union) 118,100 18,700 136,800 153,100 13,500 166,600 193,800 4,600 198,400
Football, Australian Rules 45,900 6,600 52,500 39,000 4,000 43,100 29,500 4,900 34,400
Football, soccer (indoor and outdoor) 288,300 82,500 370,800 304,900 92,400 418,400 N/A N/A N/A
Netball 9,800 138,500 148,300 14,200 138,500 152,700 27,000 141,400 168,300
Cricket (indoor and outdoor) 164,900 23,700 188,600 197,000 21,900 218,900 145500 17,400 162,900
Basketball 119,400 51,700 171,100 85,400 52,200 137,600 103,900 48,500 152,400
Hockey (outdoor) 15,400 25,500 40,800 29,200 35,400 64,600 8,700 23,900 32,600
Racquet sports (tennis, squash other racquet sports)
368,500 254,600 623,100 398,500 275,600 674,100 317,600 270,700 588,200
Ice and snow sports 62,400 25,600 88,000 79,600 54,300 133,900 61,800 33,900 95,700
Individual athletic activities3 1,469,100 2,010,100 3,479,200 1,446,100 2,155,400 3,601,500 1,465,500 2,227,200 3,692,700
Acrobatic sports N/A N/A N/A 3,600 14,700 18,300 2,100 20,800 22,900
Target and precision sports3 470,400 167,800 638,200 539,300 168,900 708,300 420,900 174,700 595,600 Equestrian sports 20,500 26,300 46,800 11,600 55,300 66,900 25,900 46,000 71,900 Motor sports (motor cycle and other wheeled
motor sports) 43,600 3,300 46,900 70,000 2,700 72,700 49,700 6,900 56,600
Swimming 431,600 483,900 915,600 470,500 491,300 961,800 404,800 466,900 871,700 Surfing and boogie. boarding 133,800 15,900 149,700 192,700 39,500 232,300 153,000 23,300 176,300 Cycling 294,900 109,400 404,300 324,100 157,600 481,700 325,400 148,900 474,200 Skating and rollerblading (roller sports) 25,000 7,200 32,200 17,400 15,200 32,700 25,000 3,200 28,200
1Adapted from the Participation and Exercise, Recreation and Sport Annual Reports, 2003 to 2005. 2 Excluded in 2003 were badminton from racquet sports, acrobatic sports, and carpet bowls from target and precision sports. Soccer was
excluded in 2005. 3 Individual athletic activities includes: bushwalking, other walking, running, aerobics, triathlon, and track and field. 4 Target and precision sports includes: darts, shooting sports, golf, carpet bowls, lawn bowls and tenpin bowling.
45

APPENDIX 3 COMMON PRINCIPAL PROCEDURES GIVEN TO SPORT/LEISURE INJURY
HOSPITALISATION CASES NSW-BASED HOSPITALISATIONS OF NSW RESIDENTS, 2003–2005
ICD-10-AM procedure code Procedure n % 1427 Closed reduction of fracture of radius 4,946 12.8 1522 Reconstruction procedures on knee 2,033 5.3
1539 Open reduction of fracture of ankle or toe 1,638 4.2
1952 Computerised tomography of brain 1,457 3.8
1916 Generalised allied health interventions 1,149 3.0
1542 Repair of tendon or ligament of ankle or foot 964 2.5
1429 Open reduction of fracture of radius 857 2.2
1431 Reduction of fracture of shaft of radius and ulna 820 2.1
1402 Reduction of dislocation of clavicle, scapula or shoulder 789 2.0
1509 Closed reduction of fracture of shaft of tibia 717 1.9
1635 Repair of wound of skin and subcutaneous tissue 682 1.8
1454 Closed reduction of phalanx of hand 669 1.7
1365 Reduction of fracture of nasal bone 615 1.6
1959 Computerised tomography of spine 611 1.6
1457 Open reduction of fracture of phalanx of hand 603 1.6
1413 Closed reduction of fracture of humerus or elbow 568 1.5
1453 Closed reduction of fracture of metacarpus of hand 411 1.1
1566 Excision procedures on other musculoskeletal sites 409 1.1
1456 Open reduction of fracture of metacarpus of hand 405 1.1
1510 Open reduction of fracture of shaft of tibia 397 1.0
1537 Closed reduction of fracture of ankle or toe 396 1.0
1414 Open reduction of fracture of humerus or elbow 372 1.0
1366 Reduction of fracture of mandible or maxilla 350 0.9
1503 Arthroscopic excision of knee 342 0.9
1628 Other debridement of skin and subcutaneous tissue 301 0.8
46

ICD-10-AM procedure code Procedure n % 1486 Reduction of fracture of pelvis or femur 266 0.7
1517 Arthroscopic meniscectomy of knee with repair 261 0.7
1963 Computerised tomography of abdomen and pelvis 253 0.7
1401 Reduction of fracture of clavicle or shoulder 252 0.7
1554 Other application, insertion or removal procedures on other musculoskeletal sites
225 0.6
1508 Open reduction of fracture of tibial plateau 213 0.6
1368 Reduction of fracture of zygomatic bone 209 0.5
1962 Computerised tomography of abdomen 196 0.5
1415 Closed reduction of dislocation of humerus or elbow 188 0.5
2015 Magnetic resonance imaging 185 0.5
1430 Open reduction of fracture of ulna or olecranon 182 0.5
1572 Other repair procedures on tendon of other musculoskeletal sites 178 0.5
1965 Computerised tomography of limb 178 0.5
1404 Other repair procedures on shoulder 170 0.4
1458 Closed reduction of dislocation of joint of hand 169 0.4
1466 Repair of tendon of hand 152 0.4
1538 Open reduction of fracture of calcaneum, talus or metatarsus
143 0.4
1956 Computerised tomography of facial bone and/or paranasal sinus (and brain)
142 0.4
406 Other repair procedures on mouth, palate or uvula 141 0.4
1428 Closed reduction of fracture of ulna or olecranon 138 0.4
1455 Open reduction of fracture of carpus 118 0.3
1870 Interventions involving assistive or adaptive device, aid or equipment 116 0.3
1636 Repair of nail 113 0.3
560 Application, insertion or removal procedures on chest wall, mediastinum or diaphragm
108 0.3
1520 Other repair procedures on knee or leg 102 0.3
1605 Removal of foreign body from skin and subcutaneous tissue with incision 98 0.3
1479 Fixation of fracture of pelvis or femur 96 0.2
1716 Reconstruction of orbital cavity 96 0.2
1500 Internal fixation of fracture of femoral condyle 95 0.2
1501 Other incision procedures on knee 92 0.2
1459 Open reduction of dislocation of joint of hand 81 0.2
47

48
ICD-10-AM procedure code Procedure n % 83 Repair of nerve or nerve trunk 75 0.2
1495 Immobilisation of fracture of fibula, patella or tibia 75 0.2
1507 Closed reduction of fracture of tibial plateau 75 0.2
1506 Reduction of dislocation of knee or patella 74 0.2
1606 Incision and drainage of skin and subcutaneous tissue 67 0.2
236 Other repair procedures on eyelid 65 0.2
1405 Reconstruction procedures on shoulder 64 0.2
1465 Repair of ligament or capsule of phalangeal joint of hand 63 0.2
569 Continuous ventilatory support 62 0.2
1487 Reduction of dislocation of hip 62 0.2
1540 Closed reduction of dislocation of ankle or foot 58 0.2
Other procedures 2,311 6.0
Missing/no procedure 8,049 20.9
Total 38,557 100.0

APPENDIX 4 SPORTS INJURY QUESTIONS FROM THE NSW POPULATION
HEALTH SURVEY PROGRAM
Q1. In the last 12 months have you participated in organised sport or activity as part of a club or association or high school, whether for training, fitness or competition? Please do not include recreational walking. 1. Yes 2. No → END OF MODULE X Don't know → END OF MODULE R Refused → END OF MODULE
Q2. In the last 12 months, on average, how many hours per week did you spend playing sport (including training)? 1. [SPECIFY HOURS] ________________________ X Don't know R Refused
Q3. In the last 12 months, on average, how many times have you been injured playing sport (including training)? 1. [SPECIFY TIMES] ________________________ X Don't know R Refused
Q4. What treatment did you receive as a result of your most recent injury? 1. None 2. Treated self (including treated by partner, parent, or friend) 3. Sports trainer 4. Emergency department presentation 5. Hospital admission 6. General practitioner, family doctor, or sports doctor 7. Physiotherapist 8. Chiropractor, osteopath, or acupuncturist 9. Naturopath or alternative health practitioner 10. Dentist or orthodontist 11. Masseur 12. Other [SPECIFY] ________________________ X Don't know R Refused
49