Embed Size (px)
Citation preview
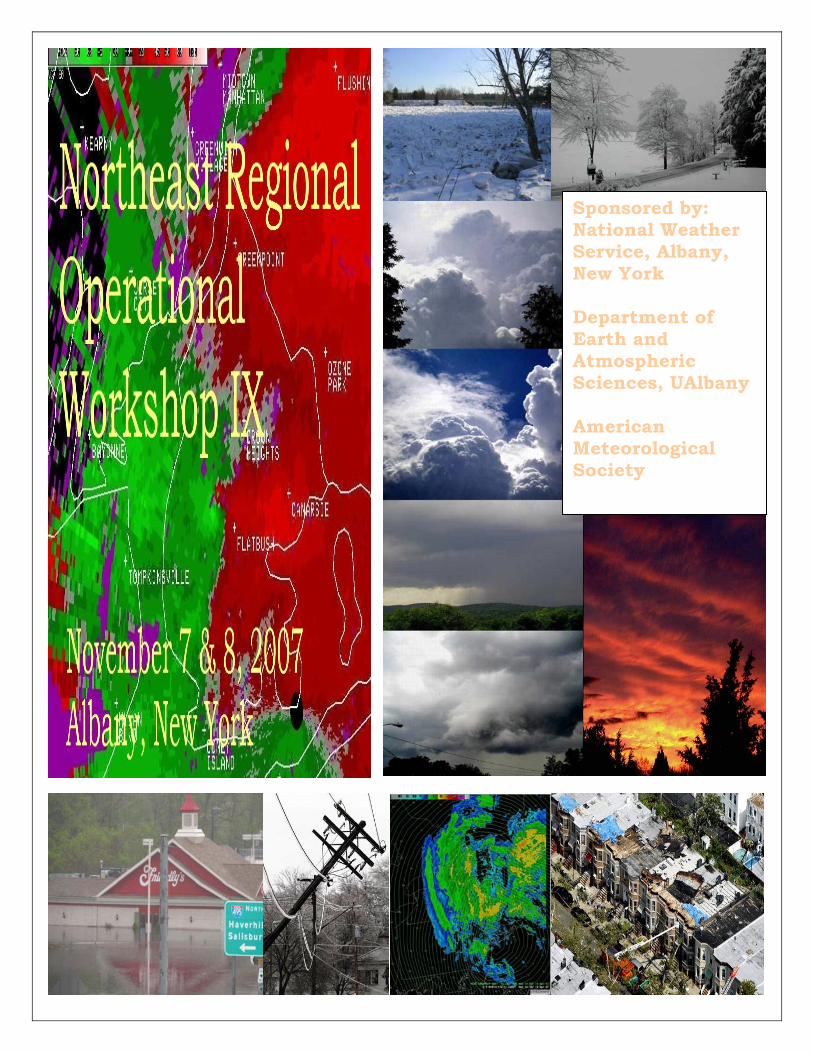
Sponsored by: National Weather Service, Albany, New York Department of Earth and Atmospheric Sciences, UAlbany American Meteorological Society
Agenda Northeast Regional Operational Workshop IX
Albany, New York Wednesday, November 7, 2007
9:00 am Welcoming Remarks Eugene P. Auciello, Meteorologist In Charge Warren R. Snyder, Science & Operations Officer National Weather Service, Albany, New York Session A – Warm Season Topics / Convection Session Chair – Thomas Wasula 9:05 am A Case Study on the August 25, 2007 Severe Weather Event in Eastern New York and Western New England Brian J. Frugis NOAA/National Weather Service, Albany, NY 9:25 am The 19 June 2007 Fulton County Hail Monster Joseph P. Villani NOAA/National Weather Forecast Office, Albany, New York 9:45 am A Tale of Two Consecutive Severe Weather Derailments across the Northeast Thomas A. Wasula NOAA/National Weather Service, Albany, New York 10:05 am The June 19, 2007 Delaware County Flash Flood: A Meteorological and Hydrological Analysis Michael Schaffner NOAA/National Weather Service Forecast Office, Binghamton, New York 10:25-10:45 am Break 10:45 am 17 August 2007 “Sudden” Northwest Flow Severe Weather Event: A Near-Miss for the 2007 Little League World Series Matt Steinbugl NOAA/National Weather Service, State College, Pennsylvania 11:05 am Enhanced Northeasterly Winds in the Western Gulf of Maine Daniel St. Jean NOAA/National Weather Service, Gray Maine
11:25 am Using the WSR-88D Storm Structure Product to Develop a Climatology of Northern New England Thunderstorms as a Function of Large-Scale Flow Evan M. Lowery Department of Chemical, Earth, Atmospheric, and Physical Sciences, Plymouth State University, Plymouth, New Hampshire 11:45 am Warm Season Thunderstorm Patterns Over the New Jersey Area Alan M. Cope NOAA/National Weather Service, Mount Holly, New Jersey 12:05-1:30pm Lunch Session B – Cool Season Topics / Winter Weather Session Chair – Neil Stuart 1:30 pm Recurving Typhoons as Precursors to an Early Season Arctic Outbreak over the Continental U.S. Heather Archambault Department of Earth and Atmospheric Sciences, University at Albany, State University of New York, Albany, New York 1:50 pm Flow Channeling in the Mohawk and Hudson Valleys: A Multiscale Case Study of Mohawk-Hudson Convergence Michael E. Augustyniak Department of Earth and Atmospheric Sciences, University at Albany State University of New York, Albany, New York Hugh W. Johnson IV NOAA/NWS, Weather Forecast Office, Albany, New York 2:10 pm Environments of Non-Significant Cool Season Severe Weather Events in the Southeastern United States William A. Komaromi Department of Earth and Atmospheric Sciences, University at Albany, State University of New York, Albany, New York 2:30 pm Forecast Issues Associated with the Valentine’s Day, St. Patrick’s Day and Tax/Patriots Day 2007 Storms Neil A. Stuart NOAA/National Weather Service, Albany, New York 2:50 pm The Great New York City/New Jersey Flood of April 2007: A NCEP/Hydrometeorological Prediction Center Perspective Mike Brennan Hydrometeorological Prediction Center NOAA/National Weather Service, National Centers for Environmental Prediction

3:10 -3:30 pm Break 3:30 pm Synoptic and Mesoscale Overview of Three Severe Convective Events over Long Island in 2007 Kelly Lombardo School of Marine and Atmospheric Sciences, Stony Brook University, State University of New York, Stony Brook, New York 3:50 pm Verification of Extratropical Cyclones Within NCEP Forecast Models Using An Automated Tracking Algorithm Brian A. Colle School of Marine and Atmospheric Sciences, Stony Brook University, State University of New York, Stony Brook, NewYork 4:10 pm An Investigation of Cold-Air Cyclogenesis along the East Coast of the United States Christopher J. Warren Department of Chemical, Earth, Atmospheric, and Physical Sciences Plymouth State University, Plymouth, New Hampshire Session C - Keynote Presentation and Discussion Introduction – Eugene P. Auciello 4:30 pm Computer Modeling of the Global Climate and its Role in the Assessment of Climate Change Keith W. Dixon NOAA/Geophysical Fluid Dynamics Laboratory (GFDL) Princeton, New Jersey 6:00 pm ADJOURN
Agenda Northeast Regional Operational Workshop IX
Albany, New York Thursday, November 8, 2007
Session D – CSTAR Projects and Related Topics Session Chair - Joseph P. Villani 9:00 am Predecessor Rain Events in Tropical Cyclones Lance F. Bosart Department of Earth and Atmospheric Sciences, University at Albany, State University of New York, Albany, New York 9:20 am A Comparison of Two Tropical Cyclones from the 2007 Season with Regards to Predecessor Rainfall Event (PRE) Development Michael L. Jurewicz, Sr. NOAA/National Weather Service, Binghamton, New York 9:40 am Life-Cycle of Tropical Storm Erin (2007) Thomas J. Galarneau, Jr Department of Earth and Atmospheric Sciences, University at Albany, State University of New York, Albany, New York 10:00 am Warm-Season Lake-/Sea-Breeze Severe Weather in the Northeast Patrick H. Wilson Department of Earth and Atmospheric Sciences, University at Albany, State University of New York, Albany, New York 10:20-10:50 am Break 10:50 am A Severe Weather Outbreak Associated with A Great Lakes Cutoff Cyclone Nicholas D. Metz Department of Earth and Atmospheric Sciences, University at Albany, State University of New York, Albany, New York 11:10 am Between the Observations – Examination of Two Tornadic Events in Southeastern New York William Goodman NOAA/National Weather Service, Upton, New York
11:30 am An Unusual Pathway to Oceanic Cyclogenesis: Linking “Perfect Storms” in the North Atlantic Ocean Jason M. Cordeira Department of Earth and Atmospheric Science, University at Albany, State University of New York, Albany, New York 11:50 – 1:30 pm Lunch Session E – Modeling and Ensemble Forecasting Session Chair - Warren R. Snyder 1:30 pm What’s New at NCEP? An Update on the HPC Winter Weather Desk and Recent Changes to the NCEP Model Suite Michael J. Brennan NOAA/National Weather Service, National Center For Evironmental Prediction/Hydrometeorological Prediction Center 1:50 pm AWIPS Procedures, Visualizations, and Forecast Strategies to Identify Severe Weather Potential Josh Korotky NOAA/National Weather Service, Pittsburgh, Pennsylvania 2:10 pm Using Short Range Ensemble Forecasts with Deterministic Model Guidance to Identify Severe Weather Threats Josh Korotky NOAA/National Weather Service, Pittsburgh, Pennsylvania 2:30 pm Customization of a Mesoscale Numerical Weather Prediction System for Energy Industry Applications Anthony P. Praino. IBM Thomas J. Watson Research Center Yorktown Heights, New York 2:50-3:10 pm Break 3:10 pm High Resolution Numerical Prediction in Steep Terrain: The MAP D-PHASE Project R. McTaggart-Cowan Numerical Weather Prediction Research Division, Meteorological Service of Canada, Dorval, Quebec, Canada 3:30 pm Ensembling Mesoscale Model Data:CLENSEMBLE Christopher Mello NOAA/National Weather Service, Cleveland, Ohio
3:50 pm Regional Ensemble Forecasts of the 7 February 2007 Lake Effect Snow Event Justin Arnott NOAA/National Weather Service, Binghamton, New York 4:10 pm Using 925 mb Temperatures to Improve Operational River Forecasts During Mixed Precipitation Events Ronald S.W. Horwood NOAA/National Weather Service, Taunton, Massachusetts 4:30 pm Assessing the Predictability of Band Formation and Evolution during Three Recent Northeast U.S. Snowstorms David R. Novak NOAA/National Weather Service, Eastern Region Headquarters, Scientific Services Division, Bohemia, New York 4:50 pm An Update on the Stony Brook Storm Surge Modeling System: Improvements and Simulation of Past Hurricane Events Tom DiLiberto School of Marine and Atmospheric Sciences, Stony Brook University, State University of New York, Stony Brook, New York 5:10 pm ADJOURN 6:30pm CSTAR Dinner at Buca di Beppo Italian Restaurant 44 Wolf Road, Colonie, New York NROW X will be held November 5-7, 2008* *Unless conflict exists with AMS Severe Local Storms Conference then October 22-24
A Case Study on the August 25, 2007 Severe Weather Event in Eastern New York and Western New England
Brian J. Frugis
NOAA/National Weather Service, Albany, NY The 25 August 2007 severe weather event was one of the most widespread severe weather events of the 2007 summer across eastern New York and western New England, prompting 24 severe thunderstorm warnings. Out of these 24 warnings, 17 individual severe weather events were confirmed across the Albany National Weather Service Forecast Office County Warning Area (CWA), with the majority of these storms producing damaging winds, downing trees and power lines. The 25 August 2007 event was similar to most Northeastern United States summer severe weather outbreaks with a warm, moist air mass in place ahead of a cold frontal boundary. However, the extent of this tropical air mass in place across the region was remarkable in the fact that dewpoints of 22-25 °C and temperatures of 32-35 °C as far north as northern New York contributed to extreme instability. For example, the 1800 UTC Albany, NY (ALB) sounding indicated Convective Available Potential Energy (CAPE) values of 4800 J/kg. In addition to the extreme instability, 30 kts of 0-6 km shear, and a dry layer of air between 700-400 mb supported the damaging thunderstorms that developed from the mid afternoon into the evening hours. This study will examine both the synoptic and mesoscale environments and determine which factors were most crucial in the creation of damaging thunderstorms. Radar data from the Albany (KENX) radar will be examined to determine the reflectivity and velocity values in several of the most damaging thunderstorms. In addition, this study will take a look at the utility of intermediate soundings (i.e.,1800 UTC ALB Sounding), as well as the mesoscale data available to the forecasters on the Advanced Weather Integrated Processing System (AWIPS) computer system.
The 19 June 2007 Fulton County Hail Monster
Joseph P. Villani NOAA/National Weather Forecast Office, Albany, New York
A severe thunderstorm produced tennis ball size hail (2.60 inches in diameter) in the town of Lassellville, in Fulton County, New York (NY) during the mid afternoon hours of 19 June 2007. Hail this large is very rare for Upstate NY. This presentation will address the environmental conditions that led to the development of the severe thunderstorm, as well as radar signatures associated with the production of the large hail. During the early afternoon of 19 June 2007, thunderstorms originated along a pre-frontal surface trough well ahead of a cold front advancing eastward through the Great Lakes. The trough provided the focus for convective development as it moved across Central NY during the early afternoon. The atmosphere was conducive for severe convection, as surface temperatures were 30oC to 34oC and surface dewpoints were between 19oC and 21oC, which resulted in surface based convective available potential energy (CAPE) values of 2000 to 3000 J kg-1. The large instability supported the formation of deep updrafts. The flow in the lower to mid levels of the troposphere was fairly weak, with no more than 10 m s-1 of wind evident on the VAD wind profile (VWP) from the Albany (KENX) radar during the time of development. However, farther west the flow aloft was stronger, with 20 m s-1 of flow at 3 km above the ground seen on the VWP from the Montague (KTYX) radar. This resulted in a greater magnitude of vertical wind shear close to where the thunderstorm of interest developed. The KENX radar was used to interrogate the severe thunderstorm that produced the large hail. The storm developed in Central Herkimer County between 1930 and 1945 UTC and propagated eastward. Shortly after 2000 UTC, the storm began to deviate to the right (southeast) as it crossed into Western Fulton County. Soon after the storm advanced into Fulton County, the reflectivity core ascended to unusually high levels as the storm maintained a deep, persistent updraft. Between 2030 and 2115 UTC, reflectivity values of at least 60 dBZ reached to heights of 12 km, while 50 dBZ values were evident at heights as high as 14 km. These heights were well above the -20oC level, which was 7.5 km. The Vertically Integrated Liquid (VIL) reached a peak of 80 kg m-2, and values of between 70 and 80 persisted from 2015 UTC to 2110 UTC. Echo Tops reached a height of 14 km. The magnitude and heights of the Reflectivity, VIL, and Echo Tops were anomalous for Upstate NY, and consistent with what would be expected to produce very large hail. Additional aspects of the storm structure as visualized with GR2Analyst software will be shown during the presentation.
A Tale of Two Consecutive Severe Weather Derailments across the Northeast
Thomas A. Wasula
NOAA/National Weather Service, Albany, New York
Alicia C. Wasula Hudson Valley Community College, Troy, New York
On 5-6 July 2007, two severe weather “events” (one null) occurred across the Northeast. The 5 July 2007 event was over-forecasted; multiple severe thunderstorm watch boxes were issued that afternoon for much of upstate New York (NY), northern Pennsylvania and portions of New England. A cluster of convection formed ahead of a lake breeze and a prefrontal trough over western NY, however, less than a dozen widely scattered severe weather reports [damaging winds greater than 50 knots (58 mph)] occurred that day, with no severe weather occurring across the Albany forecast area. Overall, this day turned out to be a null event in terms of the anticipated widespread severe weather occurring. The 6 July 2007 event was a completely different situation; the degree of instability, amount of deep shear and extent of widespread convection was in question prior to 1200 UTC. No severe thunderstorm watch boxes were issued, however, over 50 severe weather reports of damaging winds in excess of 50 knots (58 mph) and large hail (greater than 1.9 cm) occurred across eastern NY and New England after 1600 UTC. The sparse severe weather on the 5 July was likely due to weak mid-level lapse rates, convective inhibition, unfavorable jet dynamics and lack of sufficient heating in the boundary layer due to clouds after a warm frontal passage in the morning. The 6 July featured the passage of a surface cold front through eastern NY and New England in the morning with a pronounced dew point gradient in its wake. The 1200 UTC sounding at Albany yielded surface based CAPE of around 2000 J kg-1, low wet bulb zero heights approximately 9 kft, and marginal mid-level lapse rates due to a cold pool associated with an upper level trough traversing through the Northeast. This talk will take a multi-scale analysis approach to understand the convective environments that produced the severe weather null event on 5 July, and the widespread severe weather outbreak on 6 July. There will be a heavy emphasis on the utilization of observational data to find clues that led to the lack of severe weather on one day, and copious severe weather events the next day. Implications of the results on severe weather situational awareness will also be discussed.

The June 19, 2007 Delaware County Flash Flood: A Meteorological and Hydrological Analysis
Michael Schaffner and Michael Evans
NOAA/National Weather Service Forecast Office, Binghamton, New York The first part of this presentation will be a meteorological analysis of an extreme flash flood that occurred in central New York on June 19, 2007. The second part of the presentation focuses on the hydrology of the event. This flood produced millions of dollars of damage, washed away several houses, and resulted in 4 fatalities. The meteorological analysis indicated that the environment associated with this event contained many characteristics previously found with convective flash floods. Important elements included weak large-scale forcing for ascent, a moist environment favorable for high precipitation efficiency, a strong low-level jet associated with a broad zone of moisture flux convergence over the flash flood zone, and a thermal structure characterized by a deep, narrow convective available potential energy profile. Local topography also likely played a role, by channeling low-level southerly flow northward into a convergence zone on the southern edge of a developing convective complex. The hydrological analysis indicated that extreme flash flooding occurred in small, steep, heavily forested stream basins with 3-hour rainfall that doubled the 24-hour 100 year rainfall extreme for the area. Minor flooding began when estimated rainfall totals exceeded 2.00 inches, while major flooding began when estimated rainfall totals exceeded 4.00 inches. Peak rainfall during this event eventually exceeded 10 inches. An estimation of the flow along one of the streams involved in the flood was in excess of a 500-year return flow, consistent with extreme rainfall rates. Brief, extremely rapid rates of rise on area streams were likely caused by debris pileups giving way behind highway bridges.
17 August 2007 “Sudden” Northwest Flow Severe Weather Event: A Near-Miss for the 2007 Little League World Series
Matt Steinbugl
NOAA/National Weather Service, State College, Pennsylvania An isolated thunderstorm rapidly developed over Central Pennsylvania shortly after 1600 UTC 17 August 2007. The thunderstorm developed over north-central Clinton County, and rapidly intensified into a rotating supercell as it moved eastward into Lycoming County. The storm made a right turn taking it through Williamsport, Pennsylvania just prior to the first pitch of the 2007 Little League World Series and fittingly produced baseball sized hail. Early forecasts from both the Storm Prediction Center (SPC) and the State College Weather Forecast Office (CTP) did not mention potential for thunderstorms or precipitation over northeast Pennsylvania. This was largely due to uncertainty pertaining to the southeastward progression of a diffuse surface cold front and subsequent infiltration of a much drier post-frontal airmass (anomalously low precipitable water values). High resolution model data effectively resolved the complex and intricate surface features which played a major role in the storm mode. This data also correctly displayed key low-level moisture parameters which eventually lead to moderate instability in the warm sector. The primary forcing mechanism for large scale ascent was undoubtedly the exit region of a distinct 120kt upper level jet streak embedded within northwest flow aloft. A weak surface low developed near Williamsport with an attendant warm front extending eastward into New Jersey. Despite pronounced drying in the mid and upper troposphere evident in the water vapor satellite imagery, high resolution model data showed a plume of low-level moisture increasing over much of eastern Pennsylvania ahead of the thermally indirect ageostrophic circulation associated with the left exit region of the upper jet. Early afternoon heating of the moist boundary layer resulted in moderate instability over central and southeastern Pennsylvania as mixed layer CAPE exceeded 1000 Jkg-1. Below unidirectional deep layer shear on the order of 45 to 50kts, the presence of the warm front created a favorable backed low-level wind profile which contributed to the formation of rotating storms with potential splits enhancing large hail potential. The rotating supercell produced a corridor of hail and wind damage that extended from just west of Williamsport south-southeastward through Northumberland, Montour and Columbia counties in the State College CWA. This storm continued eastward into the Philadelphia/Mt. Holly and Binghamton CWAs producing 2” diameter hail and destructive winds. Despite the presence of several radar detected tornado vortex signatures (TVS), there were no confirmed tornadoes during this event. This case study will examine the large-scale features typically common with northwest flow events. These features will be compared to those associated with this event. Additionally, mesoscale details contained primarily within high resolution model data will be examined. WSR-88D reflectivity and velocity data will be displayed in order to analyze storm structure, investigate rotational signatures and show high reflectivity cores aloft.
Enhanced Northeasterly Winds in the Western Gulf of Maine
Daniel Michaud and Samuel T. K. Miller Plymouth State University, Plymouth, New Hampshire
Daniel St. Jean
NOAA/National Weather Service, Gray Maine In May 2005 enhanced northeasterly winds and coastal flooding along the mid and southern coast of Maine resulted in approximately $1M (USD) in damage. This mesoscale event was poorly predicted by human forecasters and Numerical Weather Prediction (NWP) models. Enhanced northeasterly wind regimes of this type are a fairly common occurrence in coastal regions of the western Gulf of Maine. Previous studies have shown that Gulf of Maine northeasterly wind speeds (and directions) are consistently under-forecast both by forecasters and by NWP guidance. Two joint COMET Partners Projects between Plymouth State University’s Judd Gregg Meteorology Institute and the Gray, Maine National Weather Service Forecast Office have begun laying the foundation for the understanding and future prediction of these events. Details of the relevance of this research will be presented, as well as a synoptic classification for northeasterly wind events. Conceptual models will be presented to demonstrate the dynamic forcing for these events. The results of two representative case studies will be shown, and finally, a discussion of predictability challenges with these northeasterly wind events will be offered.
Using the WSR-88D Storm Structure Product to Develop a Climatology of Northern New England Thunderstorms as a Function
of Large-Scale Flow
Evan M. Lowery Department of Chemical, Earth, Atmospheric, and Physical Sciences,
Plymouth State University, Plymouth, New Hampshire This study examines thunderstorm development as a function of large-scale flow over mountainous terrain. A 5-year climatology (2003 – 2007) of the Gray/Portland, ME (GYX) forecast area during the warm-season months (April - September) was developed. Thunderstorms were identified using the WSR-88D Storm Structure product and surface METAR observations. A three month sample (Jun – Aug 2005) of National Lightning Detection Network (NLDN) lightning data was used to determine the correlation of storm maximum VIL values with the number of cloud-to-ground lightning strikes within 25 km of a storm. It was determined that 91% of storms with VIL ≥ 23 kg m-2 have more than one lightning strike. VIL = 23 kg m-2 was chosen as a minimum threshold for identifying storms. Thunderstorms identified met the following criteria: There had to be at least one surface METAR report of thunder or lightning on the day of an identified storm within 124 nm of GYX. Storms had to last longer than one volume scan and pass through a range of 25 - 125 km of GYX. While within this range, they had to have at least one reflectivity value of 50 dBz or higher and a cell-based VIL value of at least 23 kg m-2. Storm lifecycles were monitored by logging the start time/location, maximum intensification time/location (max dVIL/dt), maximum intensity time/location (max VIL), maximum weakening time/location (max –dVIL/dt), and end time/location. Proximity soundings using the North American Regional Reanalysis (NARR) dataset were generated within three hours prior to each storm’s start time in order to determine the large scale flow aloft and thermodynamic environment present during storm development. Storms were stratified by 700 and 925 hPa flow regimes to represent both steering winds above underlying terrain and surface winds respectively. A total of 2365 thunderstorms were identified during the five year period. 1735 (65.8%) of these storms occurred on days having SPC storm reports within the GYX forecast area. July had the greatest number of storms (893), while April had the fewest number (9). Diurnally, there were two peaks in storm frequency occurring at 20Z and 6Z with 320 and 50 storms respectively. Additionally, there were two minimums occurring at 11Z and 03Z with 17 and 31 storms respectively. After storms were stratified by their 700 hPa flow regime, it was found that storm development was predominantly associated with SW flow (1572 storms). Storms in this flow having maximum VIL values ≥ 40 kg m-2 tended to develop along the spine of the mountains of central NH and southwest ME. While less intense storms (VIL < 40 kg m-2) had no noticeable patterns of development. Closer to the surface (925 hPa), SW flow again was predominant with 1700 storms. There were noticeably more storms having SE flow (246) than at 700 hPa (45). SE

and NE flow storms were clustered along and to the windward side of the NH and ME mountains indicating that upslope winds enhanced storm development. There was no correlation between higher CAPE values and more intense storms. On the contrary, Total Totals (TT) and K-Index (KI) values were nearly fixed at 45 and 28 respectively in all flow regimes. This indicated that an environment with TT and KI values less than 45 and 28 respectively would have little chance of reaching all storm criteria utilized in this study.
Warm Season Thunderstorm Patterns Over the New Jersey Area
Alan M. Cope NOAA/National Weather Service, Mount Holly, New Jersey
Areaul J. Croft
Department of Geology and Meteorology Kean University, Union, New Jersey
A COMET Partners Project between Kean University and the National Weather Service Office in Mount Holly, New Jersey (PHI) has the overall goal of understanding better the convective morphology (initiation regimes, evolution, coverage, and characteristics) in and around the PHI forecast area during the warm season (May through September, 2007). This project builds on the results of previous local studies of thunderstorm activity (2006), and will include additional past seasons’ data (2005, 2004 and others as possible), in order to generate a representative sample of warm season activity. Project results will aid in the improvement of operational short-term forecasts (0-24 h) and provide useful verification information.
Data collected during summer 2007 included real-time radar and satellite imagery, surface and upper air observations, and additional sources (e.g., lightning data, New Jersey WxNet and additional radar or profiler information as available). These data have been archived for observation times of 12, 15, 18, and 00 UTC, and parsed according to whether there was on-going activity in the area between 12 and 15 UTC ("contaminate" cases) or not. The latter cases, with the environment undisturbed at 15 UTC, were further divided into days on which convection developed in situ within the CWA no later than 00 UTC ("event" cases), and those on which none took place, or developed after 00 UTC ("null" cases).
First results indicate summer thunderstorm activity exhibits some specific patterns as a function of the upper-air flow. This was particularly true for new storm initiation and total activity for days when the environment was already "contaminated" by pre-existing convection. Contaminate activity (i.e. pre-existing storms through 15 UTC) did not preclude further activity. Initiates were most focused with a westerly flow in the upper atmosphere and were mainly associated with surface frontal features in or approaching the area.
Total resultant activity (contaminate and events) was highly variable in time and space. Events were characterized by their origin being out-of-state and in clusters and cells, while their overall coverage was less in comparison with contaminates. Observed patterns were also found to be modulated to some extent by interactions between the highly complex physiography and land use of the region as well as the prevailing synoptic weather regime and local circulations (e.g., sea breezes, valley flows). Specifics on the convective morphology for "event" and "contaminate" cases will be presented at the meeting.
As the project progresses, other aspects of summertime convection will be addressed, including severity, rainfall amounts, lightning production and forecast skill.
Recurving Typhoons as Precursors to an Early Season Arctic Outbreak over the Continental U.S.
Heather Archambault, Lance F. Bosart, Daniel Keyser
Department of Earth and Atmospheric Sciences, University at Albany, State University of New York, Albany, New York
An Arctic outbreak east of the U.S. Rockies on 20–22 September 1995 produced the earliest freeze on record in Chicago, IL, broke more than 120 U.S. daily record lows, and caused a premature end to the growing season across much of the U.S. Plains. Three recurving western North Pacific typhoons (TYs) are identified as precursors to the Arctic outbreak, making the outbreak an excellent example of a North American high-impact weather event directly attributable to high-impact weather systems that occurred well upstream. The following components of the episode spanning 16–22 September 1995 are examined using the 2.5° NCEP–NCAR and 1.125° ECMWF ERA-40 reanalyses: (1) western North Pacific upper-level anticyclogenesis/jet intensification associated with the recurvature and extratropical transition of Super Typhoon (STY) Oscar, TY Polly, and STY Ryan in the western North Pacific; (2) downstream development across the North Pacific and North America initiated by the western North Pacific upper-level anticyclogenesis/jet intensification; (3) onset of a western North American omega block associated with the downstream development; and (4) subsequent “folding over” of the omega block (anticyclonic wave breaking), which initiates the formation and equatorward movement of a strong surface anticyclone associated with the Arctic outbreak.
Flow Channeling in the Mohawk and Hudson Valleys: A Multiscale Case Study of Mohawk-Hudson Convergence
Michael E. Augustyniak and Lance F. Bosart
Department of Earth and Atmospheric Sciences, University at Albany State University of New York, Albany, New York
Hugh W. Johnson IV
NOAA/NWS, Weather Forecast Office, Albany, New York Forecasters have surmised that the unique terrain found in eastern New York and western New England plays a pivotal role in modulating different weather phenomena in the region. A review of available literature reveals the substantial impact terrain channeling by local topography can have during the warm season, including its influence on the distribution of severe weather across eastern New York and western New England (Wasula et al., 2002), and its role in enhancing tornadic potential in the 1995 Great Barrington, MA tornado (Bosart et al., 2006) and in Mechanicville, NY in 1998 (LaPenta et al., 2005). These studies focus mainly on the ability of the Hudson Valley to back surface winds to a more southerly direction, increasing shear values in the lowest 1 km of the atmosphere.
In recent years, and generally during the cold season, forecasters have also noted the formation of a low-level convergence zone where the Mohawk and Hudson valleys intersect. Precipitation produced by “Mohawk-Hudson Convergence Zone” events generally does not lead to high-impact weather, however convergence-related precipitation can wreak havoc if it occurs with little or no warning or at peak travel times, and poses a challenge to forecasters. Two such notable cases will be discussed including the 30-31 December 2000 Nor’easter (the “Wasula Storm”) and a 27 November 2002 Alberta Clipper. In both instances, an area of light to moderate snow persisted over a localized area for several hours following the conclusion of synoptic-scale snowfall. The physical processes necessary to generate a Mohawk-Hudson Convergence event will be discussed, including positive north-south (west-east) sea-level pressure differences along the Hudson (Mohawk) Valley which drive the confluent flow, an absence of strong cold air advection which precludes strong subsidence and drying of the boundary layer, and an atmospheric stratification that prevents downward momentum transfer of winds from above, which would damp out the convergent wind signature. A discussion of the synoptic-scale features which contribute to this mesoscale environment will also be presented, in an effort to provide clues of its formation to forecasters.
Environments of Non-Significant Cool Season Severe Weather Events in the Southeastern United States
William A. Komaromi
Department of Earth and Atmospheric Sciences, University at Albany, State University of New York, Albany, New York
Where previous studies have focused on the environments of significant (F2+) cool season tornado events in the Southeastern United States, this study examines the environments of weak (F0-F1) tornado events and severe hail/wind only events. This project will compare and contrast the two environments in an attempt to help increase forecaster confidence in determining the potential for severe convective weather. The geographic domain in the study encompassed Louisiana, Mississippi, Alabama, Georgia, Northern Florida, Southern Arkansas, and far Eastern Texas. The data set included 24-hour events (from 12Z to 12Z) that took place during the months of October through February between 1984 and 2004. Weak tornado days needed at least 2 tornadoes to be included in the data set. Severe hail and/or wind events were only included if there were at least 15 severe weather reports on a given day. Under these criteria, the data set included 150 significant tornado cases, 103 weak tornado cases, and 42 severe hail and/or wind cases. To maintain focus on the convective environment associated with mid-latitude cyclones, all severe weather events associated with the landfall of tropical cyclones were not included. Temperature, dew point, wind speed and direction, thickness, and theta-e from the surface through 250mb levels were parameters compared in spreadsheets. Means, medians, modes, and standard deviations were taken for each parameter and compared between the various environments. Box-and-whiskers charts were generated to allow for faster visual comparisons. Storm environments were determined by using station plots and upper-air soundings that corresponded nearest in time and location, to the start of the most widespread severe weather of the day. Gempak maps were generated that included, in addition to the previously mentioned parameters: vorticity, CAPE, precipitable water, and helicity. Gulf Coast cool season tornado events are know to be dynamically driven, as opposed to thermodynamically driven. The results of this continuing study suggest that the differences between significant and non-significant tornado environments are subtle. Surface temperatures of 65–75°F, surface dewpoints of 60–70°F, 1000-500mb thickness of 5600–5700m, 925mb Theta-e of 320-340K, and 700mb temperatures of 1-7°C were associated with both environments. Winds also veered from south to west with height in both environments. The only difference of any statistical significance has been found to be the stronger speed-shear associated with significant tornadoes. Wind speeds of 40+ kts at 850mb, 45+ kts at 700mb, and 60+ kts at 500mb were close to mean values for significant tornadoes but were near the upper-limits of the non-significant tornado environments.
Forecast Issues Associated with the Valentine’s Day, St. Patrick’s Day and Tax/Patriots Day 2007 Storms
Neil A. Stuart
NOAA/National Weather Service, Albany, New York Three major nor’easters affected the northeastern U.S. during the winter and early spring of 2007. The Valentine’s Day Storm occurred on 13-14 February and produced a widespread 18”-36” of snow across upstate NY, with as much as 42” of snow between Albany and Utica. The St. Patrick’s Day storm took place on 16-17 March and produced a broad area of 12”-18” of snow across interior New England, the Catskills and upstate NY, with some localized amounts of around 24” in the Catskills. The Tax/Patriot’s Day Storm affected the region on 15-17 April, producing storm-force winds over coastal and inland areas, 4”-8” of rain over much of the mid-Atlantic and northeastern U.S., and higher elevations of upstate NY and VT received 12”-24” of snow. The verification (POD, FAR, CSI) and lead times for winter storm watches and warnings for each of these storms was remarkably long, due to improved sources of forecast guidance, including ensemble guidance and derived forecast products from ensembles. Verification and lead times for flood watches and warnings in the Tax/Patriot’s Day storm were also remarkable. There were many characteristics to the storms that were well forecasted resulting from the use of ensemble based guidance, contributing to the long lead times and accuracy of the forecasts. Guidance from the Short Range Ensemble Forecasts (SREF), Medium Range Ensemble Forecasts (MREF), including wind, precipitable water (PWAT), mean sea level pressure (MSLP), 850 hPa temperatures and 500 hPa height anomalies will be presented. Derived fields from the ensemble guidance will be presented as well, including probabilities for 1” and 2” of liquid equivalent precipitation and plume diagrams. Finally, skew-T plots from real-time raobs will be described to illustrate evolving vertical thermal and wind profiles, and derived fields from deterministic operational models including frontogenesis will also be presented. Subtle differences in the characteristics of each storm were evident in the data and guidance, which highlighted important signals for forecasters to recognize while forecasting the sensible weather associated with nor’easters. Lessons from analysis of these different storms will help forecasters be cognizant of these issues in future winter seasons.
The Great New York City/New Jersey Flood of April 2007: A NCEP/Hydrometeorological Prediction Center Perspective
Stephen Flood, Michael Bodner, and Joshua W. Scheck
Hydrometeorological Prediction Center NOAA/National Weather Service, National Centers for Environmental Prediction
On 15-16 April 2007, a historic rainfall event with a greater than 100-year return period gave Central Park, New York, its heaviest 24-hour precipitation total since 1882, thereby surpassing heavy rainfall amounts produced by more than a century of tropical systems. Several key ingredients combined to enhance this extreme event, including rapid amplification of the mean middle/upper level flow across the contiguous U.S., strong low-level cyclogenesis that occurred along the eastern seaboard, and a deep tropical moisture plume extending from the Caribbean into the Northeast. Additionally, strong moisture flux into the New York City area was observed. A synoptic analysis and model overview will be presented featuring tools commonly used by precipitation forecasters at the Hydrometeorological Prediction Center. Specifically, standardized anomalies of moisture flux and precipitable water and output from the NCEP Short Range Ensemble Forecast (SREF) will be highlighted.
Synoptic and Mesoscale Overview of Three Severe Convective Events over Long Island in 2007
Kelly Lombardo, John Murray, and Brian A. Colle
School of Marine and Atmospheric Sciences, Stony Brook University, State
University of New York, Stony Brook, New York Although severe convection is not as frequent across the Northeastern U.S. as the central U.S., it still occurs and endangers tens of millions of people. In the coastal regions of southern New England and Long Island (LI), the marine layer, sea breeze circulations, and possibly the urban centers can modify convection. During the 2007 warm season, the NYC/LI region experienced two tornadic events on 18 July and 8 August 2007. In addition, on 11 October 2007, a strong mesocyclone was observed by radar to the south of LI. This presentation will highlight the synoptic and mesoscale evolution of these three severe weather events for the NYC-LI area. During the morning of 18 July 2007 (~1320 UTC), an EF1 tornado was reported in Islip Terrace, LI in association with a high precipitating supercell. The Northeast U.S. was under the influence of a broad synoptic-scale trough, with an upper-level potential vorticity (PV) maximum over western NY/PA and an associated low-level cyclonic circulation over south-central NY. This upper-level PV maximum in conjunction with a 300 hPa jet entrance region over the Northeast U.S. favored broad ascent over LI. During this event, there was ~500 J/kg of CAPE and 25 kts of shear in the lowest few kilometers. As a surface meso-low propagated along a low-level baroclinic zone towards NYC, the surface winds backed from southerly to southeasterly over LI, potentially increasing the local shear. On 8 August 2007, two tornadoes were reported, one of which was an EF2 in Flatbush Brooklyn at 1040 UTC. In contrast to the July event, the large-scale flow for 8 August featured a broad anticyclone aloft over much of the United States, while a digging trough moved over the Northeast U.S. A low-level cyclonic wave along a baroclinic zone propagated southeastward toward NYC, which rotated and strengthened the low-level northwesterly winds to southwesterly, thus increasing shear values to 30 kts in the lowest 1 km. The CAPE ranged from 500-1000 J/kg in association with an elevated mixed layer between 925 and 800 hPa. On 11 October 2007, there was a highly amplified trough over the eastern U.S. An occluded frontal zone stretched from the parent low over southern New Jersey to south of Long Island. Elevated convection developed above the low-level cool air (16 oC) to the north of the surface occlusion.
Verification of Extratropical Cyclones Within NCEP Forecast Models Using An Automated Tracking Algorithm
Brian A. Colle1 and Michael E. Charles1,2
1 School of Marine and Atmospheric Sciences
Stony Brook University / SUNY 2 National Centers for Environmental Prediction
This study provides the first comprehensive verification of extratropical cyclones around North America and the adjacent oceans within the NCEP models in several years. The sea-level pressure (SLP) errors are quantified for cyclones within the NCEP GFS and NAM for the 2002-2007 cool seasons (October to March), as well as the NCEP Short-Range Ensemble Forecast (SREF) system for the 2004-2007 cool seasons. The GFS analyses were used as “truth” for the central pressure, since verification of the GFS, NAM, and NARR analyses using surface observations show that the GFS-analyzed cyclone pressures are more accurate than the NAM and NARR on average. The model and observed data was interpolated to a common 80 km grid, and the cyclones were identified using an automated cyclone finding and tracking system originally developed by NCEP. The observed and simulated cyclones were matched using the closest pair within 800 km of each other. This approach was ~90% effective in identifying cyclone events and matches in our dataset. The results suggest that the NCEP GFS is more skillful than the NAM over many regions, especially over the eastern Pacific, where the NAM has a large positive bias in cyclone central pressure. The cyclone errors are larger over the Pacific than other regions for short-term (0-60 h) forecasts. However, the errors for relatively deep cyclones over the eastern U.S. and western Atlantic are larger than the eastern Pacific by hour 72, since the cyclones over the western Atlantic are underpredicted (too weak) on average in the extended range. This suggests that there is still a need to dramatically improve the > day 3 cyclone forecasts over the eastern U.S. We also show that many large cyclone errors over the eastern U.S. in the 72-96 h range can be traced back to the errors over the eastern Pacific 2-3 days earlier. Verification also reveals that there is little added skill from the 06/18 UTC model cycle as compared to the 00/12 UTC on average for the cyclone forecasts in many regions. There has also been little overall cyclone forecast improvements during the past 5 years over the eastern U.S. in the day 2 forecast.
The NCEP SREF was also verified for the 2004-2007 cool seasons. The SREF is more skillful than the operational NAM in many regions, but not the operational GFS. The SREF suffers from overdispersion and positive biases in many regions early in the forecast, which hurts its performance. Also, not all members are equally skillful. Future work will identify those synoptic patterns associated with the best and worst SREF forecasts.
An Investigation of Cold-Air Cyclogenesis along the East Coast of the United States
Christopher J. Warren and Eric G. Hoffman
Department of Chemical, Earth, Atmospheric, and Physical Sciences Plymouth State University, Plymouth, New Hampshire
A nine-year (1996-2006) climatology of East Coast cold-air cyclogenesis was developed to determine significant atmospheric conditions associated with these rather unique events. In the literature, a few case studies have examined these small-scale synoptic low-pressure systems in the midlatitudes that form within arctic airmasses as cold air moves offshore. Some of the characteristics of these storms have been shown to be similar to “polar lows”. The goals of this study are to: 1) determine how frequently these systems occur; 2) examine conditions that are favorable for their development; and 3) find similarities or differences between these storms and other East Coast cyclones and polar lows. In order to identify cases of cold air cyclogenesis, all cyclone events along the East Coast (within a boxed region bounded at 45°N by 70°W and 62.5°W, and 30°N by 85°W and 72.5°W), were identified using the North American Regional Reanalysis (NARR). Cyclone events were counted when at least one closed sea-level pressure isobar (plotted at 2 hPa intervals) was present in the region of interest. Cyclogenesis was determined to have occurred when the sea-level pressure in the center of circulation decreased by at least 2 hPa/6-hrs at least twice in a 24 hour period (not necessarily consecutively). Finally, cyclogenesis events were classified as cold-air events if the gridpoint values of the mean daily 1000-500 hPa thickness from the National Centers for Environmental Protection/National Center for Atmospheric Research (NCEP/NCAR) Reanalysis near and immediately surrounding the storm were below -0.5 standard deviations from a 32 year (1975-2006) mean. During the nine-year period, twenty extratropical cyclones met the above cold air cyclogenesis criteria. Five of these cold-air cyclones developed when at least four out of five grid points near and immediately surrounding the storm were below -1.0 standard deviations from the 32 year mean. The East Coast boxed region was divided into Northern, Western, and Eastern sub-regions based on location of initial time of cyclogenesis and eventual storm tracks. Composites were constructed for each sector for cold air cases and for other East Coast cyclones during the 2000-2001 cool season. Comparisons were made between the cold air cyclones and 2000-2001 cool season cyclones composite results. Each cold air case was analyzed using a satellite-derived classification scheme and revealed that 75% were either comma cloud or instant occlusion types. Finally, two case studies are presented and reveal that the dynamical processes involved in cold air cyclogenesis are similar to that of other extratropical East Coast midlatitude systems.
Computer Modeling of the Global Climate & its Role in the Assessment of Climate Change
Keith W. Dixon
NOAA/Geophysical Fluid Dynamics Laboratory (GFDL) Princeton, New Jersey
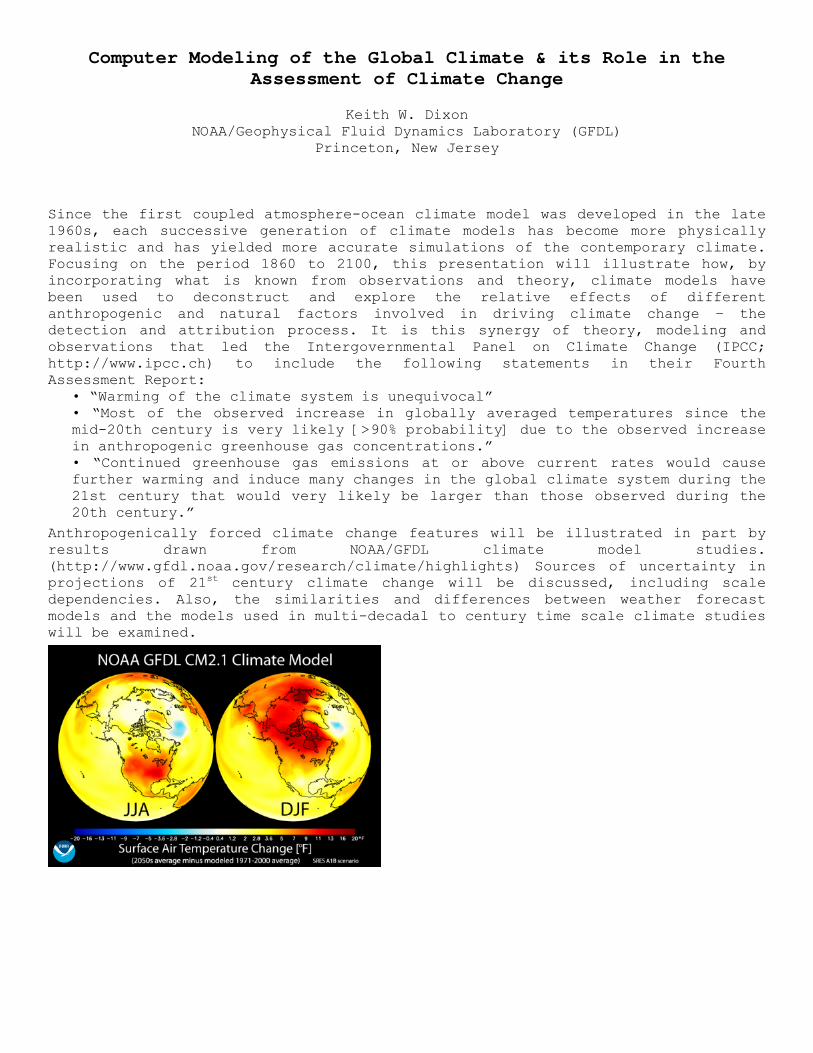
Since the first coupled atmosphere-ocean climate model was developed in the late 1960s, each successive generation of climate models has become more physically realistic and has yielded more accurate simulations of the contemporary climate. Focusing on the period 1860 to 2100, this presentation will illustrate how, by incorporating what is known from observations and theory, climate models have been used to deconstruct and explore the relative effects of different anthropogenic and natural factors involved in driving climate change – the detection and attribution process. It is this synergy of theory, modeling and observations that led the Intergovernmental Panel on Climate Change (IPCC; http://www.ipcc.ch) to include the following statements in their Fourth Assessment Report:
• “Warming of the climate system is unequivocal” • “Most of the observed increase in globally averaged temperatures since the mid-20th century is very likely [>90% probability] due to the observed increase in anthropogenic greenhouse gas concentrations.”
• “Continued greenhouse gas emissions at or above current rates would cause further warming and induce many changes in the global climate system during the 21st century that would very likely be larger than those observed during the 20th century.”
Anthropogenically forced climate change features will be illustrated in part by results drawn from NOAA/GFDL climate model studies. (http://www.gfdl.noaa.gov/research/climate/highlights) Sources of uncertainty in projections of 21st century climate change will be discussed, including scale dependencies. Also, the similarities and differences between weather forecast models and the models used in multi-decadal to century time scale climate studies will be examined.
Predecessor Rain Events in Tropical Cyclones
Matthew R. Cote, Lance F. Bosart, and Daniel Keyser Department of Earth and Atmospheric Sciences, University at Albany, State
University of New York, Albany, New York
Michael L. Jurewicz, Sr. NOAA/NWS Weather Forecast Office, Binghamton, New York
During recent active Atlantic hurricane seasons, observational evidence has suggested that heavy mesoscale rainstorms sometimes can form unexpectedly well in advance of landfalling and near-coastal tracking tropical cyclones (TCs). A total of 47 of these predecessor rain events (PREs) occurring downstream of 21 TCs were identified between 1998 and 2006, representing approximately one third of all landfalling TCs during this time period. The more extreme PREs pose an important forecast challenge because they can cause significant flooding with little prior warning, especially in those 25% of cases in which the TC itself later produces additional heavy rainfall across the same region. The purpose of this talk is to describe PRE characteristics, to document PRE structure and evolution by means of representative case studies and to illustrate the synoptic and mesoscale forcing mechanisms responsible for PRE formation. A comprehensive data catalog of TCs and their associated PREs occurring between 1998 and 2006 was constructed using radar imagery from the National Climatic Data Center, the National Hurricane Center best-track data, the National Precipitation Verification Unit online Quantitative Precipitation Estimate archive, and the National Weather Service precipitation data gleaned from online sources. The National Centers for Environmental Prediction/North American Regional Reanalysis datasets were used to help identify snynoptic and mesoscale forcing mechanisms responsible for PREs. Required criteria for inclusion of an event in the PRE dataset were evidence that the TC circulation advected moist tropical air toward the region of PRE formation, and that maximum rainfall directly attributed to the PRE exceeded a rate of 100 mm in 24 h. A “typical” PRE is located ~1000 km ahead of the parent tropical system, occurs 1-2 days prior to the arrival of the TC at the latitude of the PRE, and lasts for ~12 h. significant variability is noted. A middle- and upper-level jet-entrance-region confluence zone well downstream of an approaching TC is a favored synoptic location for PRE development. The orientation of midlatitude troughs and ridges lying poleward of TCs modulated whether, where and when a PRE formed while mesoscale surface boundaries acted as a focus for PRE heavy rainfall. Case study results will be used to show the details of PRE behavior.
A Comparison of Two Tropical Cyclones from the 2007 Season with Regards to Predecessor Rainfall Event (PRE) Development
Michael L. Jurewicz, Sr.
NOAA/National Weather Service, Binghamton, New York
Predecessor rainfall events (PRE) are coherent areas of heavy rainfall that are indirectly tied to a tropical cyclone (TC), yet develop well-removed from the TC. Anticipating heavy rainfall associated with a PRE poses a significant challenge to operational forecasters, since the associated rainfall is often associated with flooding, or primes the environment for flooding in cases when the TC or remains of the TC passes across the area effected by the PRE. In many cases, the potential for flooding with a PRE can be overlooked, as attention is focused on the TC. This presentation will compare and contrast two TCs that affected the United States during the 2007 season, with specific emphasis on PRE formation, or lack thereof. The first system to be investigated is TC Erin. Erin formed as a Tropical Storm over the western Gulf of Mexico late on Aug. 14. Erin made landfall along the lower Texas Coast early on 16 August, 2007, then slowly weakened as a Tropical Depression inland over Texas and Oklahoma during the next 2 to 3 days. Erin produced multiple PRE during this period. One of the PRE was particularly significant, with up to 15” (375 mm) of rainfall in roughly a 6 hour period over portions of Minnesota and Wisconsin. Severe flooding and several fatalities resulted. The second system shown is TC Gabrielle. Gabrielle formed as a Tropical Storm over the far western Atlantic late on 7 September, 2007. Gabrielle made landfall on the Outer Banks of North Carolina early on 9 September, then re-curved back towards the east over the open Atlantic and weakened to a Tropical Depression over the next several days. No PRE were associated with Gabrielle over the eastern United States. Synoptic scale ingredients that encouraged PRE development with Erin, and inhibited such with Gabrielle, will be discussed. Previous work associated with the Collaborative Science Training and Research (CSTAR) project categorized PRE according to the track of their parent TC, with the frequency of PRE production included for each category. Both Erin and Gabrielle will be compared to other systems in their respective categories.
Life-Cycle of Tropical Storm Erin (2007)
Thomas J. Galarneau, Jr. and Lance F. Bosart Department of Earth and Atmospheric Sciences
University at Albany, State University of New York, Albany, New York Tropical Storm (TS) Erin (2007) began as a region of disorganized convection over the Caribbean and southern Gulf of Mexico on 9 August. This region of convection moved northwestward and organized into a weak TS by 15 August, subsequently making landfall along the Texas coast on 16 August with surface winds near 35–40 knots. Although weak at the time of landfall, TS Erin made an impact on the daily weather from Texas to the northern Great Plains, and to the eastern United States (US) during the post-landfall period of 16–22 August. In particular, TS Erin was noteworthy for: (1) producing widespread rains > 150 mm over Texas, Oklahoma, and Missouri during 16–19 August, (2) briefly reintensifying to TS strength over Oklahoma on 19 August, (3) contributing to a predecessor rain event (PRE) over the northern Great Plains and Great Lakes region on 19–20 August, (4) producing widespread rains > 25 mm over Kentucky on 20 August, and (5) triggering a severe weather outbreak over North Carolina and Virginia on 21–22 August. The purpose of this presentation is to document the life-cycle of TS Erin from its initial development over the Gulf of Mexico, to the severe weather outbreak associated with the remnants of Erin over North Carolina and Virginia. Dynamic tropopause analyses will be used to document to evolution of the large-scale pattern, and diagnose the synoptic-scale contribution to the life-cycle of TS Erin. Given that the remnants of TS Erin retriggered episodes of convection over successive days after landfall, comparisons will be made between the structure of TS Erin and continental long-lived mesoscale convective vortices.
Warm-Season Lake-/Sea-Breeze Severe Weather in the Northeast
Patrick H. Wilson, Lance F. Bosart, and Daniel Keyser Department of Earth and Atmospheric Sciences, University at Albany,
State University of New York, Albany, New York
Thomas A. Wasula NOAA/National Weather Service, Albany, New York
Thunderstorms that form along lake- and sea-breeze convergence zones over the Northeast sometimes are observed to become severe when they migrate from their source regions. These thunderstorms can be challenging to forecast because they typically form in the absence of clearly defined synoptic-scale or mesoscale precursor disturbances. The dynamical and thermodynamical processes, modulated by physiographic effects, that are responsible for creating severe weather from lake and sea-breeze convergence zones are discussed through selected case studies. The results from these case studies will be shown during the presentation. Fifteen cases were selected for analysis. The NCEP/NARR and RUC gridded datasets, along with data from radar, soundings, and surface observations, were used to construct the analyses. These cases were divided into two classes: pure cases where lake- and sea-breeze convergence zones were primarily responsible for initiating severe weather in the apparent absence of synoptic-scale forcing, and mixed cases where synoptic-scale forcing acted in conjunction with mesoscale forcing from the lake and sea breezes to generate severe weather. The 15-case sample includes a null event where the arrival of marine air from a sea breeze suppressed convection.
Pure cases were characterized by the absence of significant synoptic-scale forcing. Typically, pure cases featured: 1) a ridge axis at the surface or aloft, 2) temperatures (dewpoints) of at least 30°C (20°C) in the planetary boundary layer with ample heat and moisture to provide instability, and 3) CAPE greater than 1500 J kg−1 at 1200 UTC before the event. In contrast, mixed cases typically featured: 1) a trough at the surface or aloft, 2) boundary-layer temperatures ranging from 20°C to 30°C with dewpoints approaching but not exceeding 20°C, and 3) CAPE less than 1500 J kg−1 at 1200 UTC before the event. Perhaps the most important general finding for all cases was the prevalence of multiple synoptic and mesoscale boundary intersections. These boundary intersections served as locations where convergence and lift were enhanced to the point where deep convection was initiated.
A Severe Weather Outbreak Associated with A Great Lakes Cutoff Cyclone
Nicholas D. Metz and Lance F. Bosart
Department of Earth and Atmospheric Sciences University at Albany, State University of New York, Albany,
New York In late May 2006, a cutoff cyclone progressed eastward across the northern United States towards the Great Lakes. At 1200 UTC 25 May, the cyclone was positioned over Wisconsin with a dry slot extending from its southern flank, wrapping cyclonically around the system to the northwestern periphery. Subsequent to this time, multiple shortwaves developed near the center of the cutoff and strengthened as they rotated eastward. Preliminary evidence points to the possibility that barotropic instability may have been a factor in shortwave development and strengthening. As the leading shortwave rotated to the south of the center of the cutoff cyclone, convection fired to the immediate southeast of Lake Michigan ahead of the leading shortwave. At the surface, two convective lines formed out ahead of the shortwave by 1900 UTC 25 May. The first line was aligned with the southeastern shore of Lake Michigan, where enhanced natural baroclinicity was present due to land/water temperature differences, and the line extended south in time from the lake. A second line formed approximately 100 km further southeast, along the western edge of the dry slot, where baroclinicity was enhanced due to differential diabatic heating. The two lines of convection initially contained individual cells prior to coalescing into solid lines and then growing upscale into a single large mesoscale convective system. Both lines of convection initiated in an environment of moderate CAPE and high shear with cyclonically curved hodographs. Weaker convection also developed upstream over southern Wisconsin in association with the second embedded mesoscale disturbance. In total, about 500 reports of severe weather occurred in association with this outbreak. This presentation will focus on a multiscale examination of the cutoff cyclone and will explore: (1) the development of the cutoff itself and (2) the mesoscale environment associated with the widespread convective outbreak of 26 May 2006 that ravaged the lower Great Lakes region. Special attention will be paid to the development and evolution of the embedded mesoscale disturbances around the center of the cutoff cyclone that appear to have played a significant role in the convective development.
Between the Observations – Examination of Two Tornadic Events in Southeastern New York
William Goodman, Jeffrey Tongue and Nelson Vaz NOAA/National Weather Service, Upton, New York
Two tornadic thunderstorms occurred during the summer of 2007 in southeastern New York, one on July 18th, 2007, and the other on August 8th, 2007. The August 8th tornado, classified by a NWS storm damage survey as an EF-2 on the Enhanced Fujita scale, traversed the boroughs of Staten Island and Brooklyn in New York City. This was the first documented tornado in Brooklyn in over 100 years. The July 18th tornado cut a damage path through Islip Terrace in western Suffolk County on Long Island, and was classified as an EF-1. These events were similar in that they both occurred in the early morning and were embedded mesoscale complexes that produced extensive flash flooding that significantly disrupted morning rush hour travel.
These events are rare and interesting scientifically, and the data-rich observing network in the New York City area showed unique details of their evolution. Two nearby Terminal Doppler Weather Radars (TDWR’s) provided superior observational capability compared to nearby WSR-88D radars, via their proximity and 1-minute low-level scan strategies. Real-time mesonet surface observations, and ACARS soundings also provided additional spatial and temporal detail that occurred between METAR and SPECI Automated Surface Observing System (ASOS) observations. In post analysis, one-minute resolution ASOS data provided additional insight. These observations can prove very useful in monitoring storm morphology and the storm-scale and near-storm environments.
This presentation will demonstrate the value of high temporal resolution remote and in-situ observations during a high impact weather event.
An Unusual Pathway to Oceanic Cyclogenesis: Linking “Perfect Storms” in the North Atlantic Ocean
Jason M. Cordeira and Lance F. Bosart
Department of Earth and Atmospheric Science, University at Albany, State
University of New York, Albany, New York The now-famous “Perfect Storm” (PS1) of late October and early November 1991 over the northwest Atlantic Ocean was a high-impact weather event that produced unexpectedly high winds and coastal flooding along the northeastern coast of the US. PS1 formed as a baroclinic system as the result of converging air streams representing arctic, midlatitude, and tropical source regions. The intensification of PS1 was assisted by the interaction of a significant upper-level transient potential vorticity (PV) anomaly with the lower-level vorticity and tropical moisture remnants of Hurricane Grace. The resulting strong oceanic cyclone became an unnamed hurricane as a core region of higher winds and deep moist convection developed. Much less well known is that prior to the formation of the unnamed hurricane phase of PS1, a second intense surface cyclone (PS2) formed downstream of PS1 in a region of deep moist convection along the surface warm front extending east from PS1. The purpose of this talk is to discuss the structure and evolution of PS1 and PS2 and to consider their common dynamical linkages. The development and track of PS1 was strongly influenced by the existence of an anomalous high-amplitude large-scale flow pattern over North America and the western Atlantic Ocean. Strong tropospheric deformation associated with this anomalous flow pattern resulted in a meridional contraction and zonal elongation of the surface baroclinic zones associated with PS1. In response, PS1 underwent the process of warm seclusion and retrograded westward towards the Northeastern US. Meanwhile, the newly developed warm-frontal wave (PS2) rapidly propagated eastward across the North Atlantic. Subsequently, PS2 interacted with a PV anomaly of arctic origin, merged with a remnant cyclone, and deepened 50 hPa in 24 hours to the west of Great Britain. The presented research will focus on (1) the continuity of the significant PV anomalies and low-level cyclonic vorticity centers associated with the development of PS1, (2) the dynamical development and evolution of PS2 using the PV framework and Q-vector diagnostics, and (3) subsequent dynamical linkages between PS1 and PS2.
What’s New at NCEP? An Update on the HPC Winter Weather Desk and Recent Changes to the NCEP Model Suite
Michael J. Brennan
NOAA/National Weather Service National Center For Evironmental Prediction/Hydrometeorological Prediction Center
Information on several NCEP related topics will be discussed. First, verification of HPC’s Winter Weather Desk (WWD) products from the winter of 2006–2007 will be presented, including snowfall, freezing rain, and low track forecasts. Changes to HPC’s WWD products will be discussed, including the use of a new snow-to-liquid ratio (SLR) formulation. Recent changes to the NCEP model production suite will be detailed, including the introduction of bias correction and downscaling in the Global Ensemble Forecast System (GEFS), bias correction in the Short Range Ensemble Forecast System (SREF) and the reconfiguration of the WRF Hi-Res Window (HRW) runs. Finally, the methodology for inserting confidence intervals in the form of 10th and 90th percentile probabilities into HPC’s new Alaska Medium Range products will be presented.
AWIPS Procedures, Visualizations, and Forecast Strategies to Identify Severe Weather Potential
Josh Korotky
NOAA/National Weather Service, Pittsburgh, Pennsylvania
Rich Grumm NOAA/National Weather Service, State College, Pennsylvania
The first part of this presentation will demonstrate AWIPS Procedures that highlight visualizations to facilitate the diagnosis of severe weather potential from NWP. Part two will demonstrate the operational value of combining Short Range Ensemble Forecast (SREF) probability forecasts and deterministic high resolution model solutions to identify severe weather threats. A promoted forecast strategy utilizes 1) SREF probability data to assess the likelihood, mode, and forecast confidence of a potential severe weather event; 2) SREF departures from climatology to evaluate the historical context of a forecast event; and 3) high resolution model output to determine physically relevant details, including the horizontal, vertical extent, and magnitude of moisture, instability, and vertical wind shear; important mesoscale structures; relevant forcing mechanisms. NWP visualizations and forecast strategies will be illustrated through examination of two case studies: 1) the 7 June 2007 central U.S. severe weather outbreak, which generated 214 severe weather reports, including 15 tornadoes and 135 severe wind events, and 2) the 8 June 2007 eastern U.S. severe weather outbreak, which generated 284 severe wind reports. This study will highlight novel uses of ensemble data, including SPC Interactive Point Plume and Probability graphics.
Using Short Range Ensemble Forecasts with Deterministic Model Guidance to Identify Severe Weather Threats
Josh Korotky
NOAA/National Weather Service, Pittsburgh, Pennsylvania This study will illustrate the operational utility of combining Short Range Ensemble Forecast (SREF) probability forecasts and deterministic high resolution model solutions to identify severe weather threats. A forecast strategy is introduced which utilizes 1) SREF probability data to assess the likelihood, mode, and forecast confidence of a severe weather event; 2) SREF departures from climatology to evaluate the historical context of an impending event; and 3) high resolution model output to determine physically relevant details, including the magnitude of moisture, the horizontal and vertical extent of moisture, important mesoscale structures, and relevant forcing mechanisms. This strategy will be illustrated through examination of the 7 June 2007 central U.S. severe weather outbreak, which generated 214 severe weather reports, including 15 tornadoes and 135 severe wind reports. This study will highlight novel uses of ensemble data, including plume and probability graphics from the Storm Prediction Center’s SREF web site.
Customization of a Mesoscale Numerical Weather Prediction System for
Energy Industry Applications
Anthony P. Praino and Lloyd A. Treinish IBM Thomas J. Watson Research Center
Yorktown Heights, New York A wide variety of operations in the energy and utilities industries are weather sensitive to local conditions in the short-term (3 to 36 hours). Typically, they are reactive due to unavailability of appropriate predicted data at this temporal and spatial scale. Hence, the optimization that is applied to these processes to enable proactive efforts utilize either historical weather data as a predictor of trends or the results of synoptic-scale weather models. While near-real-time assessment of observations of current weather conditions may have the appropriate geographic locality, by its very nature is only directly suitable for reactive response. Alternatively, mesoscale numerical weather models operating at higher resolution in space and time with more detailed physics may offer greater precision and accuracy within a limited geographic region for problems with short-term weather sensitivity. Such forecasts can be used for competitive advantage or to improve operational efficiency, outage response, energy generation and demand forecasting. In particular there is significant sensitivity to impacts from weather related phenomena (winds, icing, lightening, etc.) in the distribution infrastructure. To address these issues, we build upon our earlier work, in the implementation of an operational mesoscale modelling capability, dubbed "Deep Thunder". The system provides nested 24-hour forecasts for several geographies including the New York City metropolitan area at 1 -2 km resolution. In particular, the goal is to provide weather forecasts at a level of precision and fast enough to address specific business problems. Hence, the focus has been on high-performance computing, visualization, and automation while designing, evaluating and optimizing an integrated system that includes receiving and processing data, modelling, and post-processing analysis and dissemination. Part of the rationale for this focus is practicality. Given the time-critical nature of weather-sensitive business decisions, if the weather prediction can not be completed fast enough, then it has no value. Such predictive simulations need to be completed at least an order of magnitude faster than real-time. But rapid computation is insufficient if the results can not be easily and quickly utilized. Thus, a variety of fixed and highly interactive flexible visualizations have also been implemented. They range from techniques to enable more effective analysis to strategies focused on the applications of the forecasts. The concept behind Deep Thunder in this context is clearly to be complementary to what the National Weather Service (NWS) does and to leverage their investment in making data, both observations and models, available. The idea, however, is to have highly focused modelling by geography with a greater level of precision and detail than what is ordinarily available. Therefore, we will review our particular architectural approach and implementation as well as the justification and implications for various design choices. Then we will outline how this approach enabled customization for problems associated with energy utility applications as well as discuss the specific customizations.
High Resolution Numerical Prediction in Steep Terrain: The MAP D-PHASE Project
R. McTaggart-Cowan
Numerical Weather Prediction Research Division, Meteorological Service of Canada, Dorval, Quebec, Canada
The production of useful numerical guidance in regions of steep terrain is problematic, especially in terms of quantitative precipitation forecasting (QPF). Two strategies have potential utility in addressing this issue: probabilistic (ensemble-based) modelling and high resolution deterministic modelling. In considering the latter, high resolution is required in order to depict important terrain-induced flows, whose effects on resolved scale precipitation must be properly handled. While the definition of “high resolution” varies by application and region, grid spacings of less than 4 km are generally considered adequate for mountainous regions. The Mesoscale Alpine Project (MAP) Demonstration of Probabilistic Hydrological and Atmospheric Simulation of flood Events in the Alpine region (D-PHASE) is a World Meteorological Organization Forecast Demonstration Project designed to create an optimal end-to-end forecast system for the Alps region of southern Europe. The Meteorological Service of Canada (MSC) has been involved with the MAP project since the mid-1990's, when a high resolution Canadian model (the Mesoscale Compressible Community model) was run in support of the MAP intensive observing period. The involvement of the MSC in this project led directly to improvements of the handling of gravity wave features in the model through significant modifications to the vertical coordinate and discretization. The MSC has been heavily involved with this follow-up MAP D-PHASE project, whose operational period extends from June through November, 2007. Daily high resolution (2.5 km grid spacing) guidance is provided for MeteoSwiss D-PHASE forecasters and to a variety of centres and institutions throughout Europe. This study presents some of the scientific goals of the D-PHASE project in terms of coupled and offline hydrological forecasting in the alpine region, along with a discussion of preliminary results of sensitivity testing involving time-variable orography and various configurations of the advanced Milbrandt-Yau microphysics scheme in the Global Environmental Multiscale (GEM) model. A set of case studies and verification datasets are used to show the potential for utility of high resolution QPF guidance in regions of steep terrain.
Ensembling Mesoscale Model Data:CLENSEMBLE
Christopher Mello NOAA/National Weather Service, Cleveland, Ohio
CLENSEMBLE is a software application that produces a model ensemble from locally run WRF models. This presentation will describe the application. The CLEENSEMBLE application is composed of two software scripts: WRFdissect and MAKENSEMBLE.WRFdissect dissects a subset of 53 fields from the original model grib file. Subsetting is necessary because the WRF produces over 750 forecast fields that are too large to transport over NOAA computer networks. The file size output after running WRFdissect subset is about 5% of the original grib file size. This reduction in file size allows WRF model data from several forecast offices to be transmitted to one location for processing by the MAKENSEMBLE script. MAKENSEMBLE produces an ensemble mean from up to ten separate model inputs. The output data format is grib2. The user has the choice to either weigh each model equally for a simple model average, or to customize each model’s weight using a single configuration file. The domain of the MAKENSEMBLE output is comprised of the model domain that is common to all the members of the ensemble. In addition to creating the mean grib2 fields, MAKENSEMBLE will create probability fields of reaching certain QPF amounts, and wind speed thresholds for small craft advisory, gale and storm warnings. At this time the data output format is in the form of GIF images. Unlike the mean grib2 fields, the probability images cannot be customized. Each model member is weighted equally. For example, if four models out of five are predicting gale force winds, the image shows an 80 percent chance of getting gale force winds. Examples and future enhancements will be presented at the workshop.
Regional Ensemble Forecasts of the 7 February 2007 Lake Effect Snow Event
Justin Arnott and Michael Evans
NOAA/National Weather Service, Binghamton, New York
Richard Grumm NOAA/National Weather Service, State College, Pennsylvania
George Young
The Pennsylvania State University, University Park, Pennsylvania
Regional-scale models are capable of forecasting the conditions conducive to the formation of lake effect snow (LES) bands. However, the details related to the timing of heavy snow and the locations most likely to receive heavy snow are often elusive. In an attempt to improve LES band forecasts downwind of lakes Erie and Ontario, a regional ensemble forecast system has been developed using the workstation Weather Research and Forecast (WRF) model at National Weather Service forecast offices surrounding the Great Lakes. The WRF members, run at 12 km horizontal resolution, are set up over a common domain with varied model cores, physics and initial conditions to create a diverse set of ensemble forecasts.
Forecasts from the ensemble will be evaluated for an LES event on 7 February 2007, which was part of a prolific 10 day LES event east of Lake Ontario. The lack of significant cold weather during late 2006 and early 2007 left the Great Lakes unseasonably warm and susceptible to a significant LES event. In early February, an arctic air mass with 850 hPa temperatures below -20C and strong westerly winds moved over the region. This produced a prolonged period of intense LES in New York State. This event facilitated the testing of the regional ensemble forecast system, which was specifically designed to assist in forecasting such events. In this presentation, the ability of the ensemble to forecast LES band location and movement will be qualitatively assessed. The goal is to show that products derived from the ensemble help define the areas most likely to be impacted by significant LES and provide additional useful guidance to what is currently operationally available to forecasters. Finally, some quantitative calculations using a recently-developed pattern matching technique will be shown to describe the performance of particular ensemble members.
Using 925 mb Temperatures to Improve Operational River Forecasts During Mixed Precipitation Events
Ronald S.W. Horwood
NOAA/National Weather Service, Taunton, Massachusetts
The National Weather Service (NWS) Northeast River Forecast Center (NERFC) produces daily river forecasts for roughly 200 forecast points across New England and New York State. With the transition from the Antecedent Precipitation Index (API) model to the Sacramento Soil Moisture Accounting Model (SACSMA), river basins with high terrain (above 2000 feet) can now be broken down into lower and upper elevation zones to more realistically model the hydrologic response of these basins. Late in the winter of 2006-2007…the NERFC entered into a collaborative project with the National Centers for Environmental Prediction’s (NCEP) Hydrometeorological Prediction Center (HPC). HPC sends gridded 6-hourly forecasts of 925 mb temperature from the 40 km NAM-WRF model to the NERFC 4 times per day at 00z, 06z, 12z and 18z. These 925 mb temperature forecasts are refined at the NERFC and input into the National Weather Service River Forecast System (NWSRFS) for use in operational river forecasting for basins having significant elevations above 2000 feet. This presentation will show forecast hydrographs for two simulated events to show the utility of accurately modeling upper zone temperatures. The simulations will take place for the NERFC forecast point at Au Sable Forks on the East Branch Au Sable River (ASFN6) in northern New York State. The first simulation will compare a traditional cold rain event at 36F against a modeled lower zone rainfall/upper zone snowfall event using the newly implemented 925 mb forecast temperature program. The second simulation will compare a traditional freezing rain event against a modeled lower zone freezing rain/upper zone rainfall event again using the 925 mb forecast temperature program. The benefits of this program will then be presented along with the opportunity for questions/answers.

Assessing the Predictability of Band Formation and Evolution during Three Recent Northeast U.S. Snowstorms
David R. Novak1,2 and Brian A. Colle2
1NOAA/National Weather Service, Eastern Region Headquarters, Scientific Services
Division, Bohemia, New York
2School of Marine and Atmospheric Sciences, Stony Brook University, Stony Brook, New York
Mesoscale precipitation bands are frequently observed in the comma-head portion of extratropical cyclones in the northeast United States. High-resolution models, such as the MM5 and WRF models, have shown the capability to predict such mesoscale precipitation bands. Given this capability, an ensemble of high-resolution model forecasts may provide useful information concerning the predictability of band formation and evolution. This study utilizes a high-resolution multi-model, -initial condition (IC), and -physics ensemble to assess the predictability of observed band formation and evolution during the 25 December 2002, 12 February 2006, and 14 February 2007 snowstorms. A 16 member ensemble utilizing the MM5 and WRF models run at 12-km grid spacing was developed. Members were initialized using the operational National Centers for Environmental Prediction North American Mesoscale model, Global Forecast System model, and Short-Range Ensemble Forecast system. Microphysics and convective parameterizations were varied amongst the different WRF and MM5 ensemble members to further diversify the model solutions. The ensemble was initialized 12–24 h prior to band formation in each snowstorm. Results show band occurrence was favored in the ensemble forecast for each case, however, the timing and location of the forecast bands had considerable spread. The 12 February 2006 case exhibited an especially large spread in band timing (over 12 h) and location (over 300 km). Potential vorticity analysis will be used to show that model and physics variations were of secondary importance to IC variations in explaining the ensemble spread of band characteristics. Specifically, initial differences in the position and amplitude of the incipient potential vorticity anomaly amongst ensemble members were related to subsequent forecast differences in band timing and location. It will be shown that the magnitude of these IC differences varied among the three cases, and that the IC differences were correlated with the amount of forecast spread in band location and timing. The pathway through which such IC differences affect the subsequent forecast evolution of frontogenesis, stability, and moisture will be explored. Discussion of the possible utility of high-resolution ensemble forecasts to anticipate band formation and evolution in real-time forecast operations will also be presented.
An Update on the Stony Brook Storm Surge Modeling System: Improvements and Simulation of Past Hurricane Events
Tom DiLiberto, Brian A. Colle, Robert Hunter,
Frank Buonaiuto, and Malcolm Bowman
School of Marine and Atmospheric Sciences, Stony Brook University, Stony Brook, New York,
The Stony Brook storm surge group has developed a real-time storm surge model for the coastal Northeast U.S (http://stormy.msrc.sunysb.edu). This talk will first highlight some of the improvements made to the modeling system. Previously, the model used for the storm surge predictions, the Advanced Circulation Model for Coastal Ocean Hydrodynamics (ADCIRC) model, was forced by winds and sea-level pressure from a deterministic atmospheric forecast from the Penn State- National Center for Atmospheric Research (PSU-NCAR) Mesoscale model (MM5) at 12-km grid spacing. Currently, 8 ensemble ADCIRC forecasts are made at 0000 UTC using 5 members from the MM5 and 3 members from the Weather Research and Forecasting model (WRF-ARW) at 12-km grid spacing. Each of the atmospheric ensemble members includes varied initial conditions (different operational analyses) and physics. This talk will illustrate the impact of the ensembles on the predictions for two moderate flooding events during the 2006-2007 cool season. The grid resolution of ADCIRC was also improved from 13,000 total grid nodes to more than 100,000 in order to better resolve the complex bathymetry around Long Island and NYC. We will show the benefits of higher resolution for the December 1992 nor-easter, which was a major storm surge event for the NYC area. There have been no realistic atmospheric and storm surge model simulations of historic landfalling hurricanes along the southern New England coast. This talk will show preliminary modeling results of Hurricane Gloria (26-28 Sept 1985). This event resulted in the highest recorded storm surge of ~7 feet (2.1 m) in the last 60 years at the Battery in New York City. Luckily, Gloria hit during a low tide, but the overall damage was still estimated at around $100 million. The tropical storm bogus scheme within the Penn-State National Center of Atmosphere Research (PSU-NCAR) MM5 was used in concert with the North American Regional Reanalysis (NARR) to initialize Gloria at 0000 UTC 26 September 1985 down to 4-km grid spacing. The data was converted for input into the Weather Research and Forecasting (WRF) model in order to utilize its vortex-following moving nest algorithm. This talk will highlight preliminary results from the 36-, 12-, 4-km WRF run. The simulated storm at at 1700 UTC 27 September (hour 41) made landfall over central Long Island ~15 km to the east of the observed and the WRF was ~1 h slow. The WRF realistically simulated the pressure evolution of Gloria along the coast, with the WRF pressures of Gloria within ~5 mb of observed over Long Island. The peak simulated winds were ~80 kts over Long Island, which are within 5 kts of the observed. Future work will utilize this simulation with the ADCIRC.

Acknowledgements
Center for Environmental Science and Technology Management Conference Facilities
Peggy Kelly
Hotel & Travel Coordination
Ronald S.W. Horwood, John S. Quinlan, Neil A. Stuart, Jeff Tongue Northeast Regional Operational Workshop Preprint Cover Images
Warren R. Snyder
Northeast Regional Operational Workshop Coordinator Northeast Regional Operational Workshop Preprints
Northeast Regional Operational Workshop Preprint Cover Design
Capital Region of New York Chapter of American Meteorological Society Snacks & Refreshments
Vasil Koleci & Ingrid Amberger
Web Team