Embed Size (px)
Citation preview
Split-Plots Designs
• Used when one (or more ) factors require more experimental material for evaluation
• Different size experimental units• Whole plots• Split Plots
Split Plots Common in Process Experiments
• When different factors are from different process steps
• When randomizing the levels of one factor is difficult or time consuming
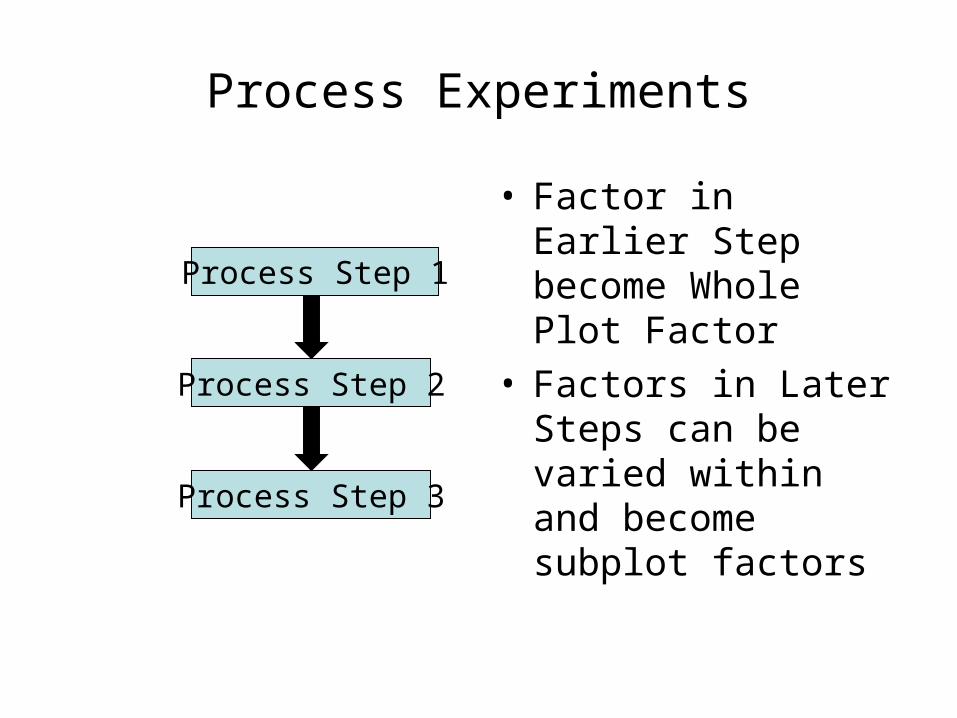
Process Experiments
• Factor in Earlier Step become Whole Plot Factor
• Factors in Later Steps can be varied within and become subplot factors
Process Step 1
Process Step 2
Process Step 3
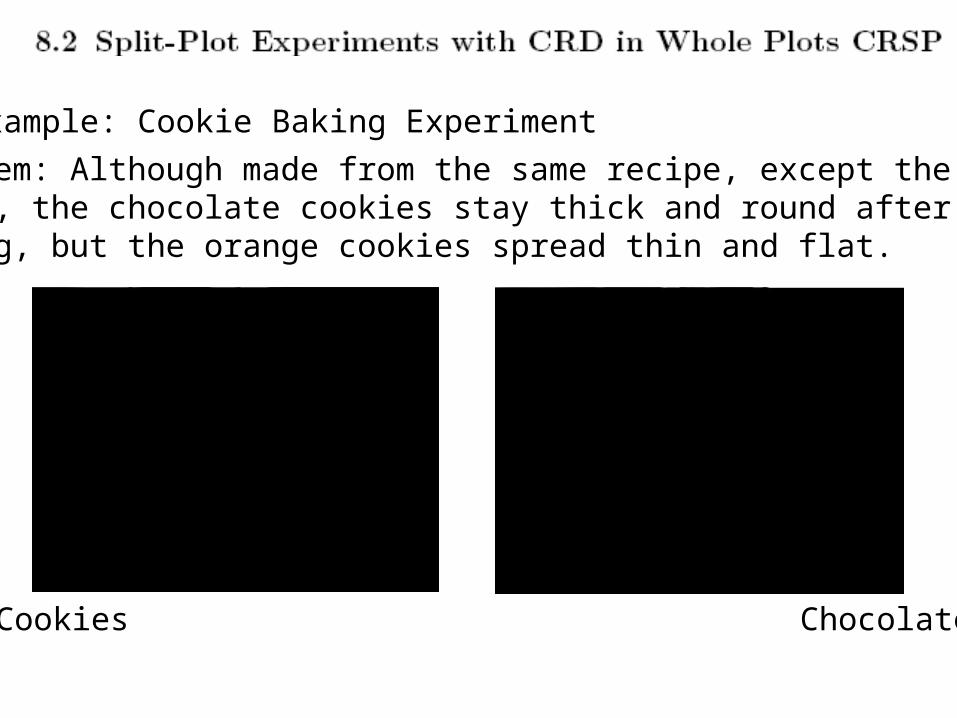
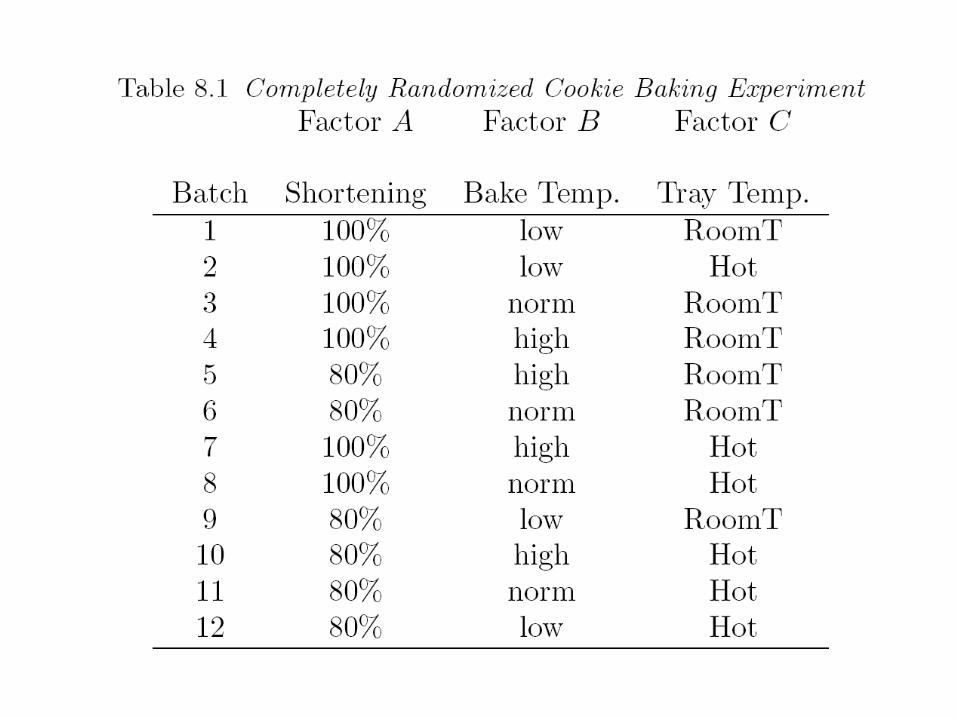
Example: Cookie Baking Experiment
Orange Cookies Chocolate Cookies
Problem: Although made from the same recipe, except the syrup, the chocolate cookies stay thick and round afterbaking, but the orange cookies spread thin and flat.
Research Question: want to study factors that may affect the final diameter of the orange cookies.
Factors to study: 1) Amount of shortening in cookie dough 2) Bake Temperature
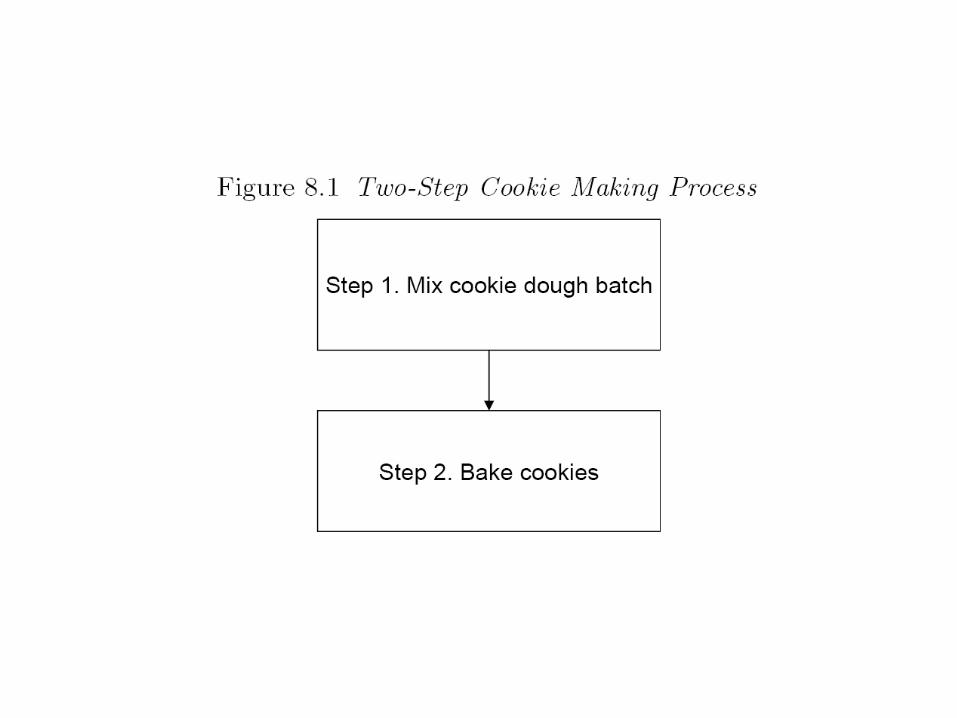
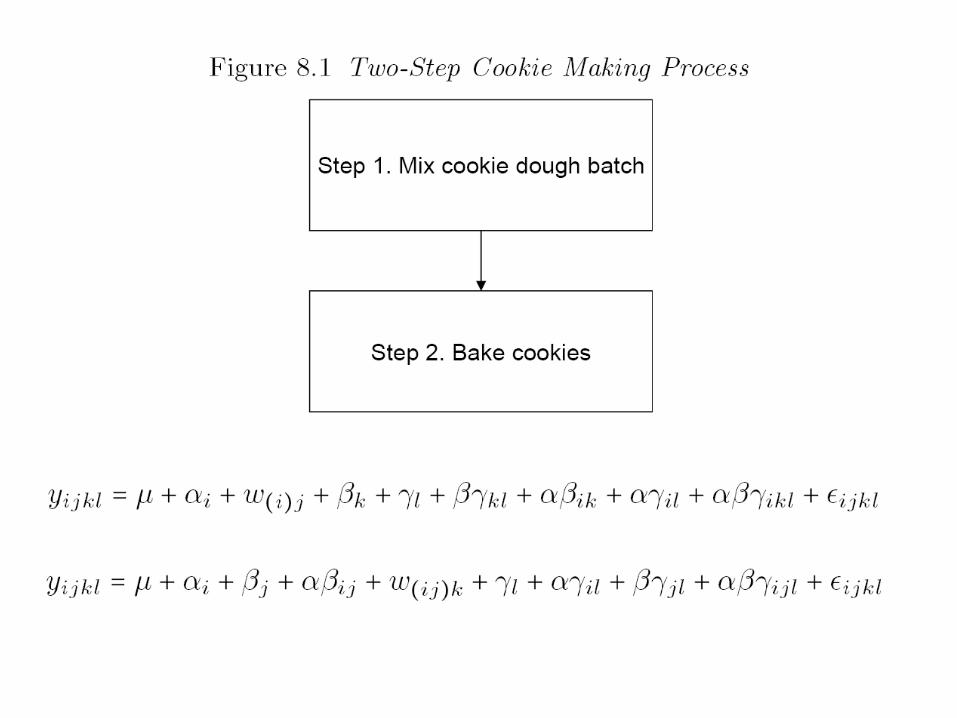
Experimental Procedure:
1. Mix the ingredients in the dough
2. Add the orange syrup
Note: one dough batch makes enough for several trays of cookies
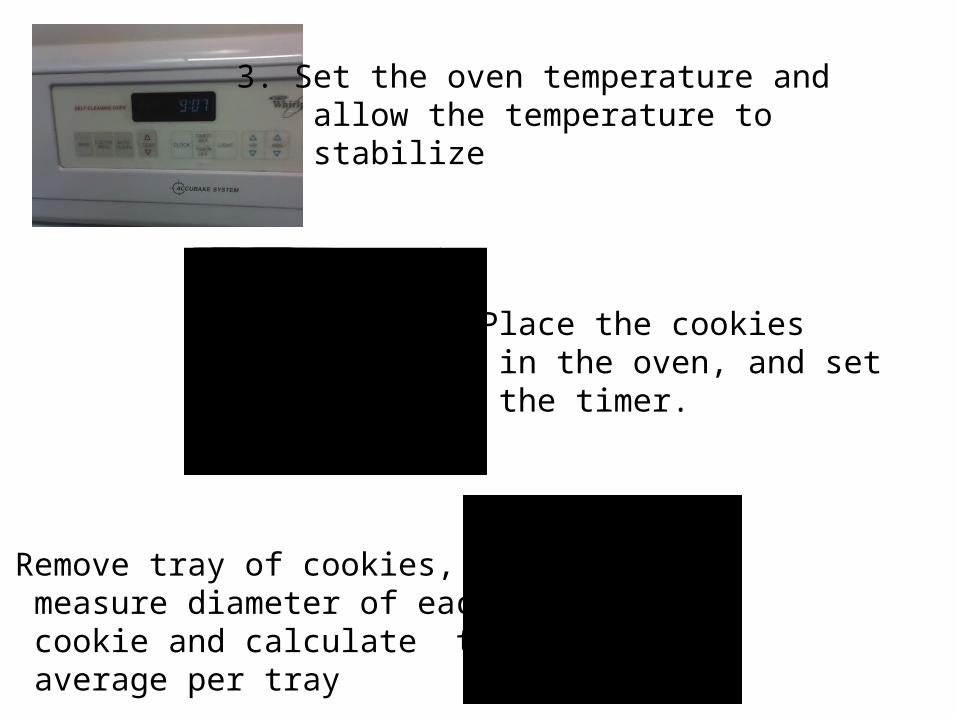
3. Set the oven temperature and allow the temperature to stabilize
4. Place the cookies in the oven, and set the timer.
5. Remove tray of cookies, measure diameter of each cookie and calculate the average per tray
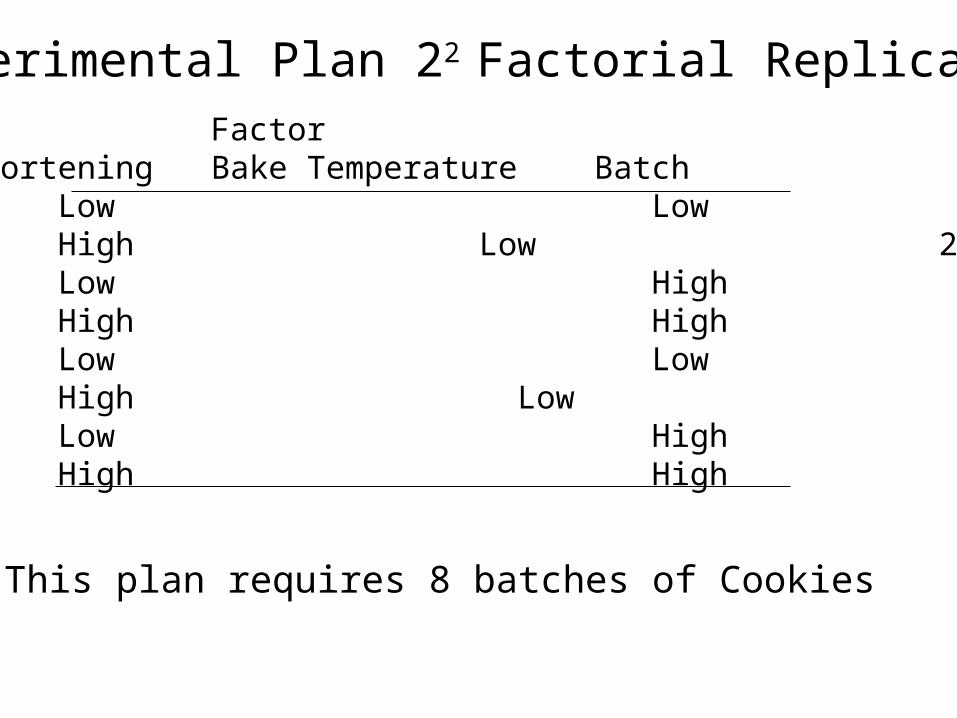
Experimental Plan 22 Factorial Replicated FactorRun Amount of Shortening Bake Temperature Batch 1 Low Low 1 2 High Low 2 3 Low High 3 4 High High 4 5 Low Low 5 6 High Low 6 7 Low High 7 8 High High 8
This plan requires 8 batches of Cookies
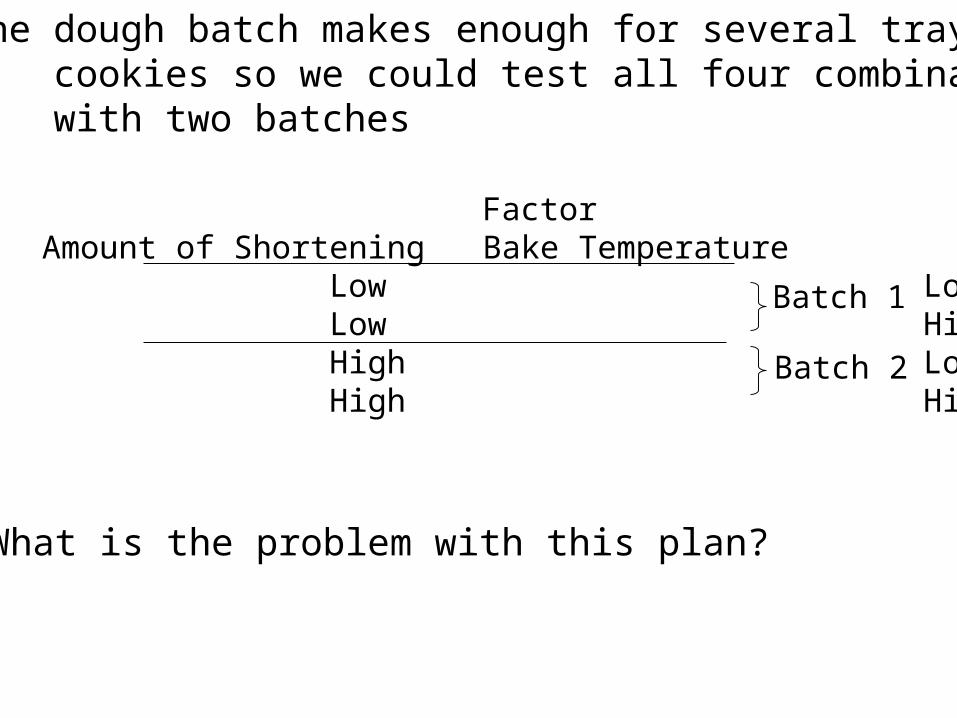
Note: one dough batch makes enough for several trays of cookies so we could test all four combinations with two batches
Batch 1
Batch 2
FactorRun Amount of Shortening Bake Temperature 1 Low Low 2 Low High 3 High Low 4 High High
What is the problem with this plan?
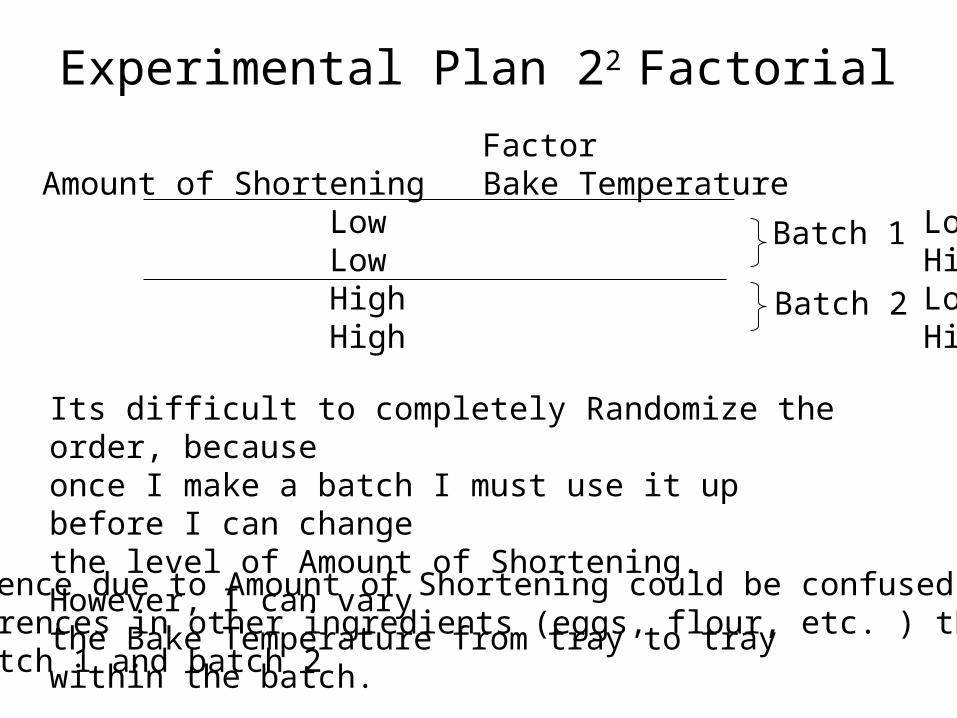
Experimental Plan 22 Factorial
Its difficult to completely Randomize the order, because once I make a batch I must use it up before I can change the level of Amount of Shortening. However, I can vary the Bake Temperature from tray to tray within the batch.
Any difference due to Amount of Shortening could be confused with differences in other ingredients (eggs, flour, etc. ) that changebetween batch 1 and batch 2
Batch 1
Batch 2
FactorRun Amount of Shortening Bake Temperature 1 Low Low 2 Low High 3 High Low 4 High High
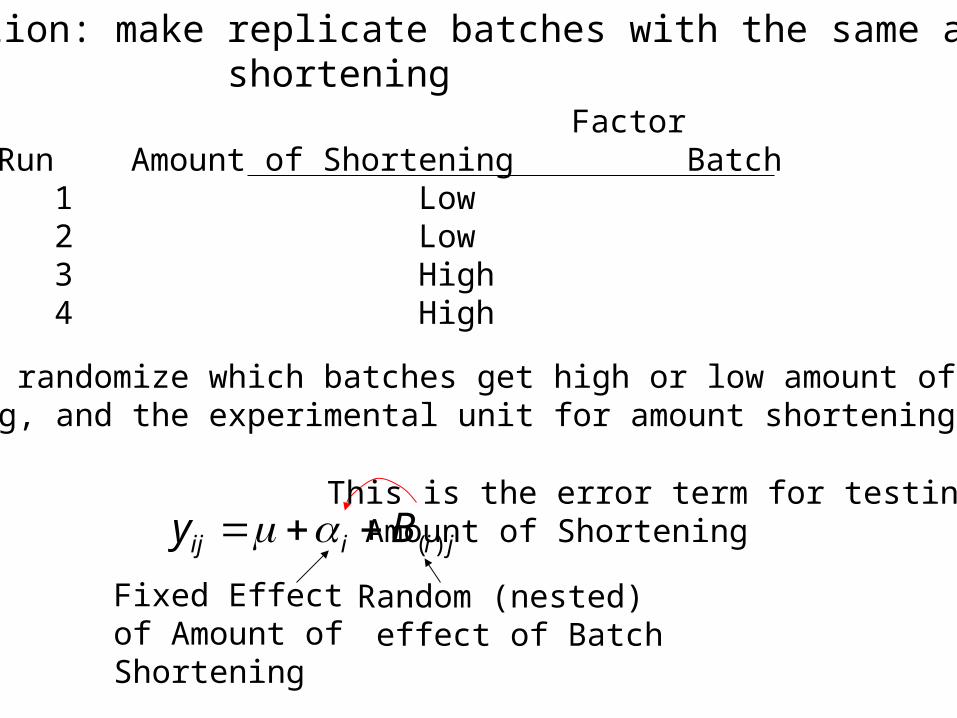
Solution: make replicate batches with the same amount of shortening
FactorRun Amount of Shortening Batch 1 Low 1 2 Low 2 3 High 3 4 High 4
Now I can randomize which batches get high or low amount of shortening, and the experimental unit for amount shortening is batch .
jiiij By )( Fixed Effectof Amount of Shortening
Random (nested) effect of Batch
This is the error term for testing Amount of Shortening
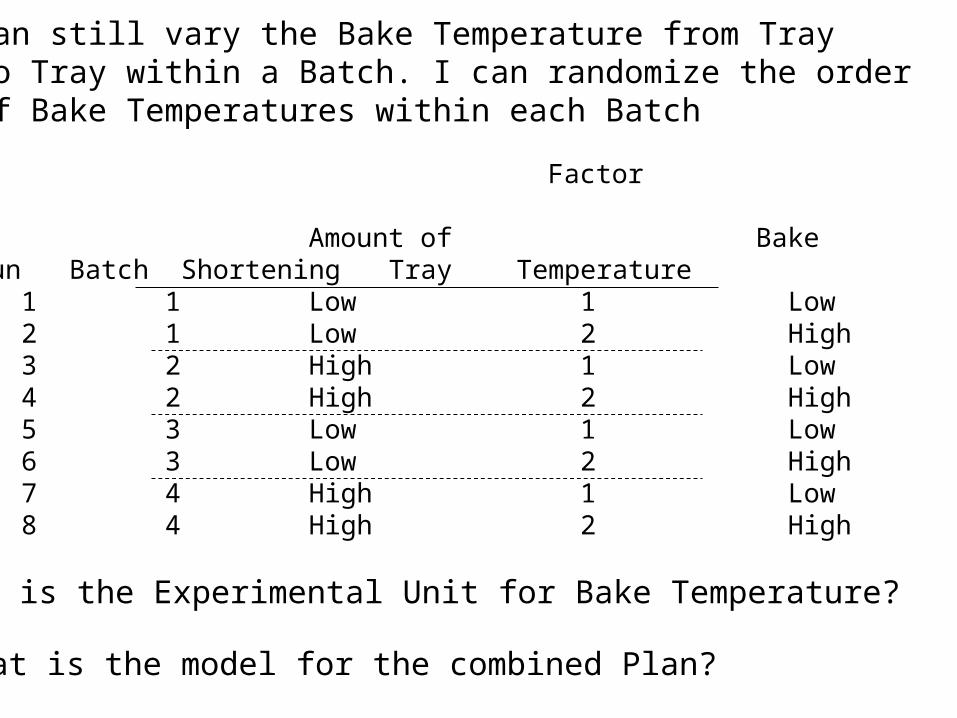
I can still vary the Bake Temperature from Tray to Tray within a Batch. I can randomize the order of Bake Temperatures within each Batch
What is the Experimental Unit for Bake Temperature?
What is the model for the combined Plan?
Factor
Amount of BakeRun Batch Shortening Tray Temperature 1 1 Low 1 Low 2 1 Low 2 High 3 2 High 1 Low 4 2 High 2 High 5 3 Low 1 Low 6 3 Low 2 High 7 4 High 1 Low 8 4 High 2 High
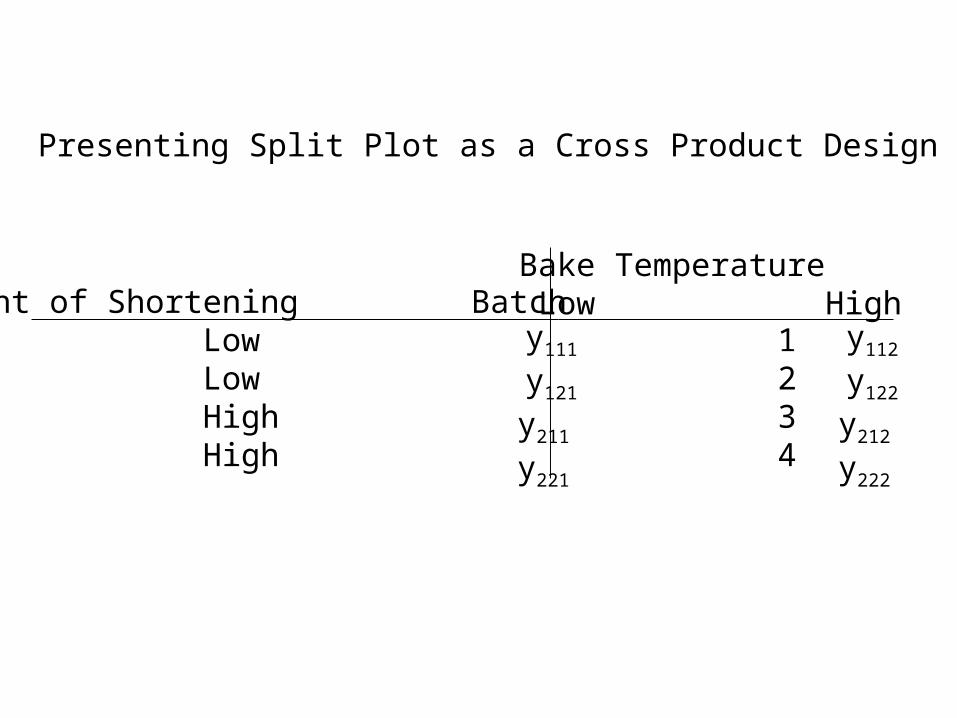
Run Amount of Shortening Batch 1 Low 1 2 Low 2 3 High 3 4 High 4
Bake Temperature Low High y111 y112 y121 y122
y211 y212
y221 y222
Presenting Split Plot as a Cross Product Design
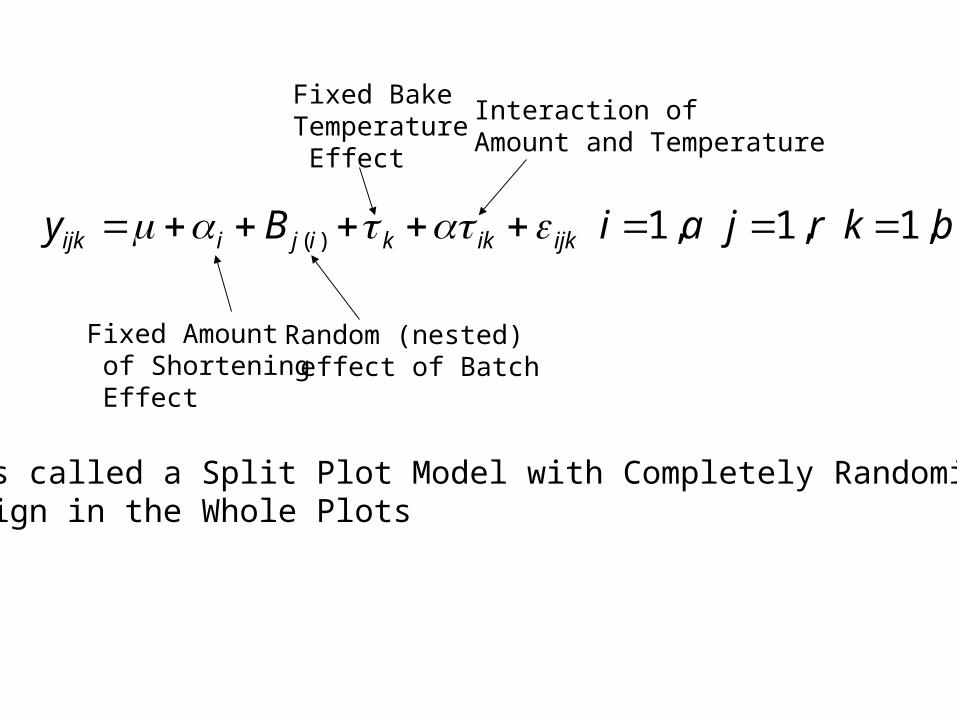
bkrjaiBy ijkikkijiijk 1, 1, 1, )(
Fixed Amount of Shortening Effect
Random (nested) effect of Batch
Fixed Bake Temperature Effect
Interaction ofAmount and Temperature
This is called a Split Plot Model with Completely Randomized Design in the Whole Plots
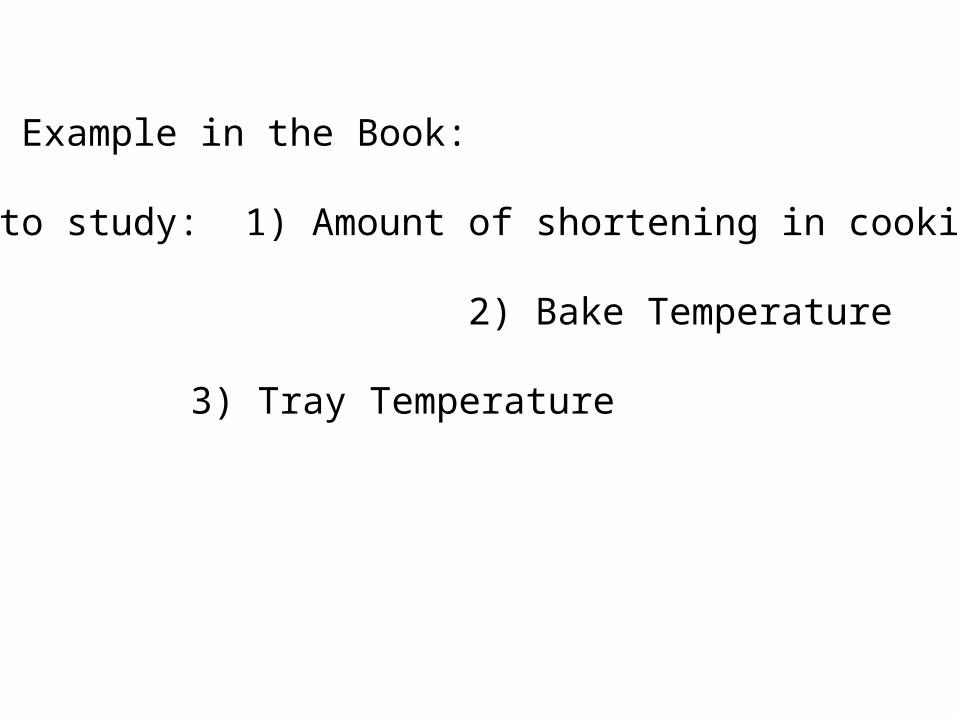
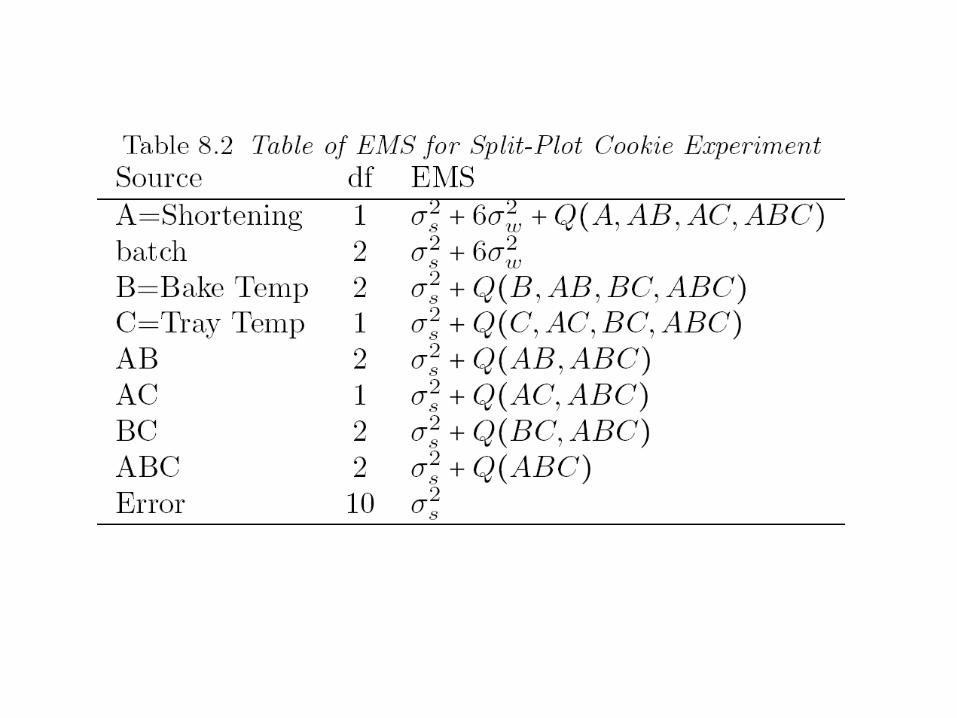
Expanded Example in the Book:
Factors to study: 1) Amount of shortening in cookie dough 2) Bake Temperature
3) Tray Temperature
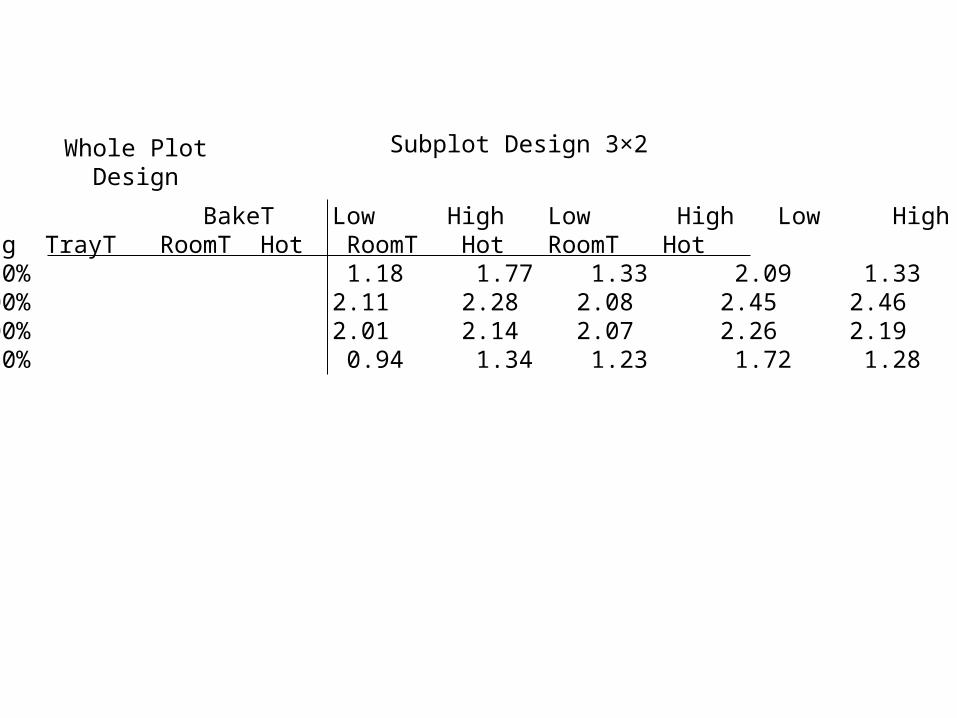
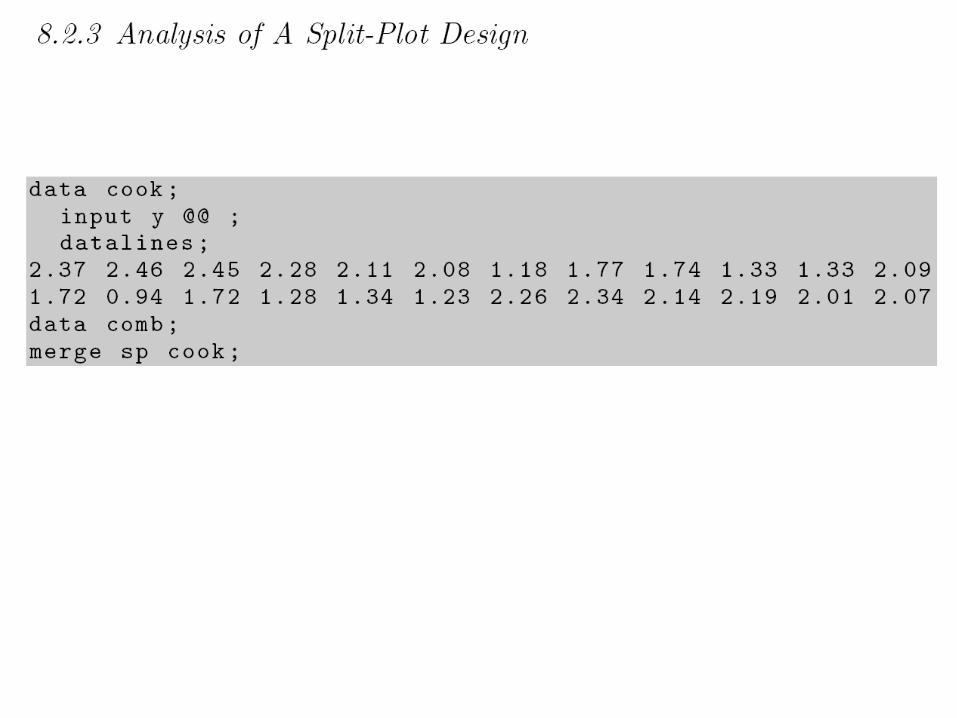
BakeT Low High Low High Low HighBatch Shortening TrayT RoomT Hot RoomT Hot RoomT Hot 1 80% 1.18 1.77 1.33 2.09 1.33 1.74 2 100% 2.11 2.28 2.08 2.45 2.46 2.37 3 100% 2.01 2.14 2.07 2.26 2.19 2.34 4 80% 0.94 1.34 1.23 1.72 1.28 1.72
Subplot Design 3×2Whole Plot Design
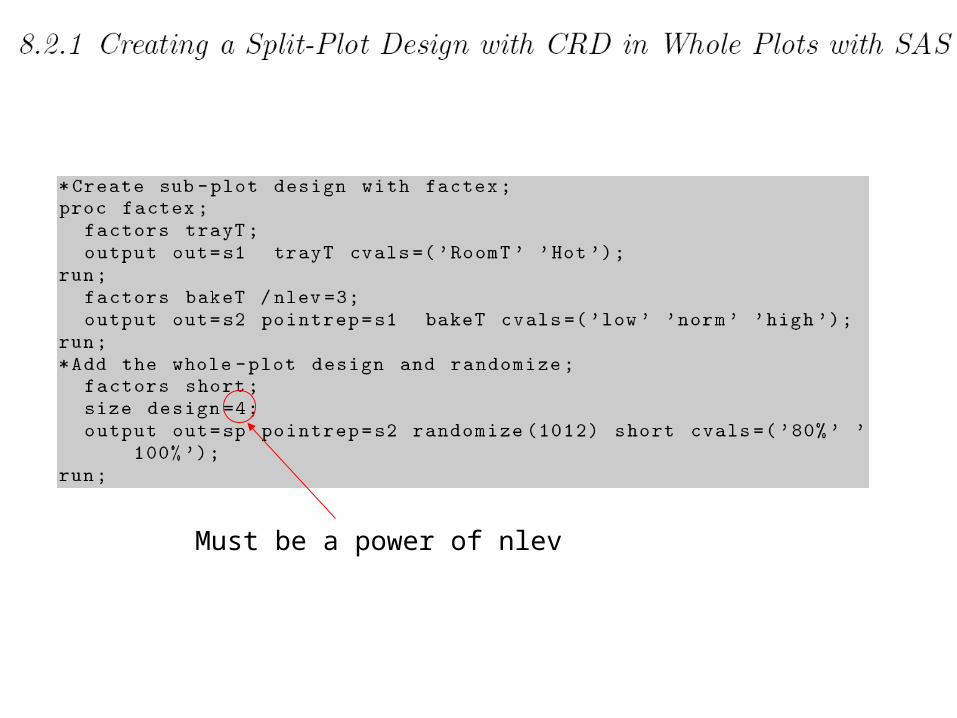
Must be a power of nlev
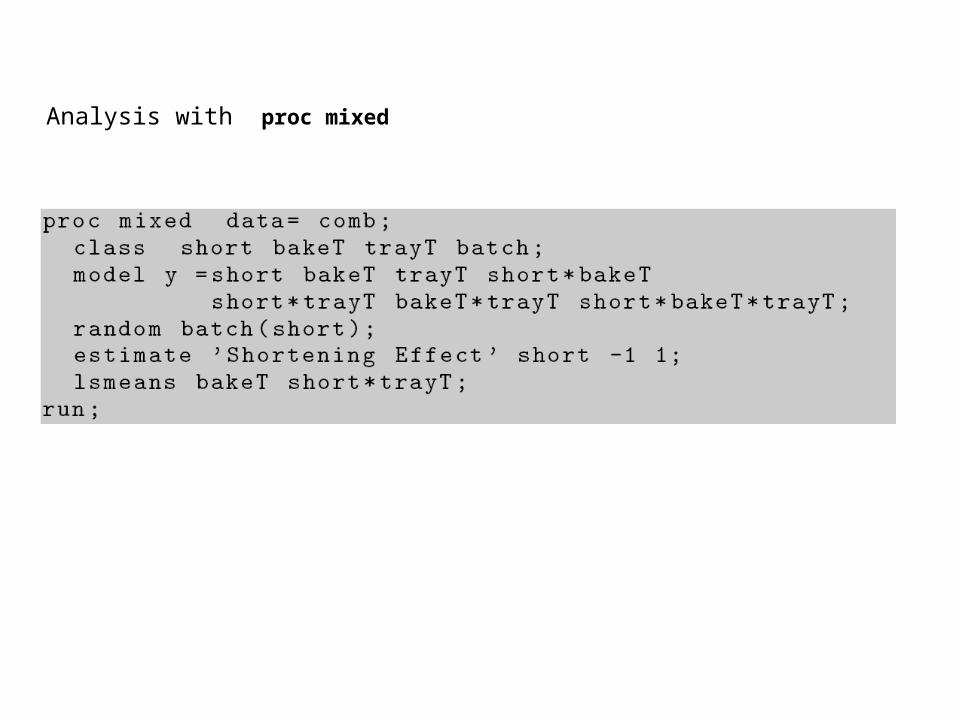
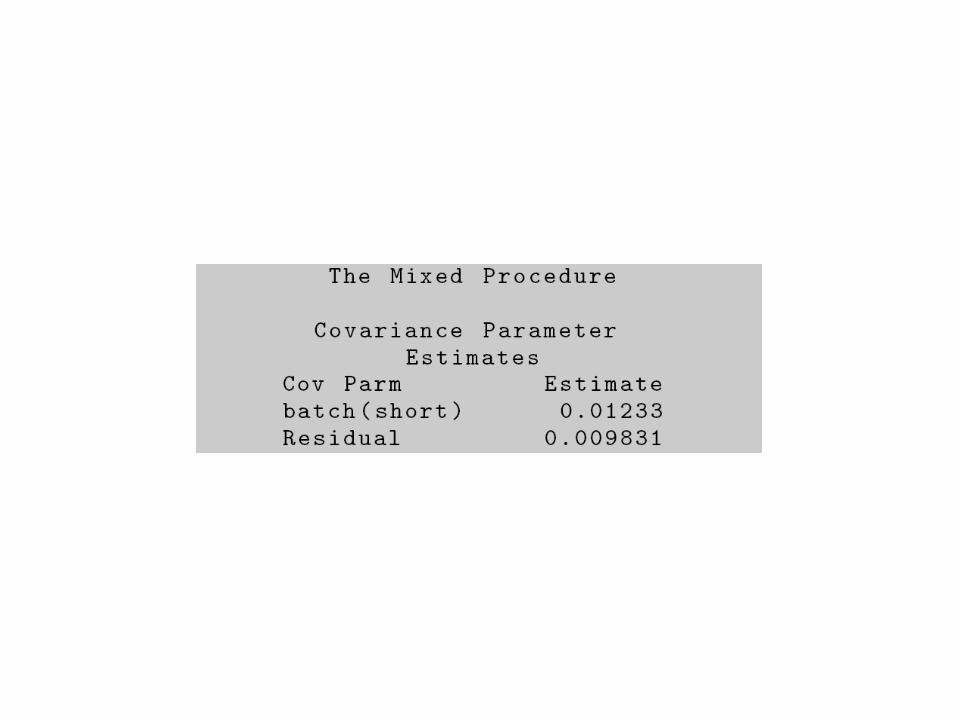
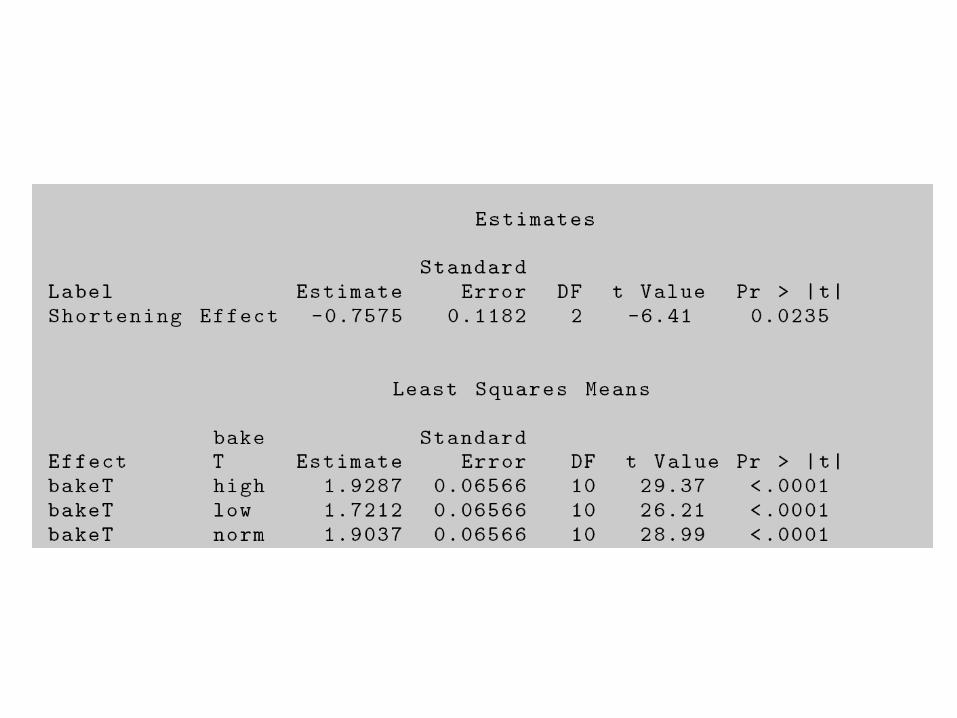
Analysis with proc mixed
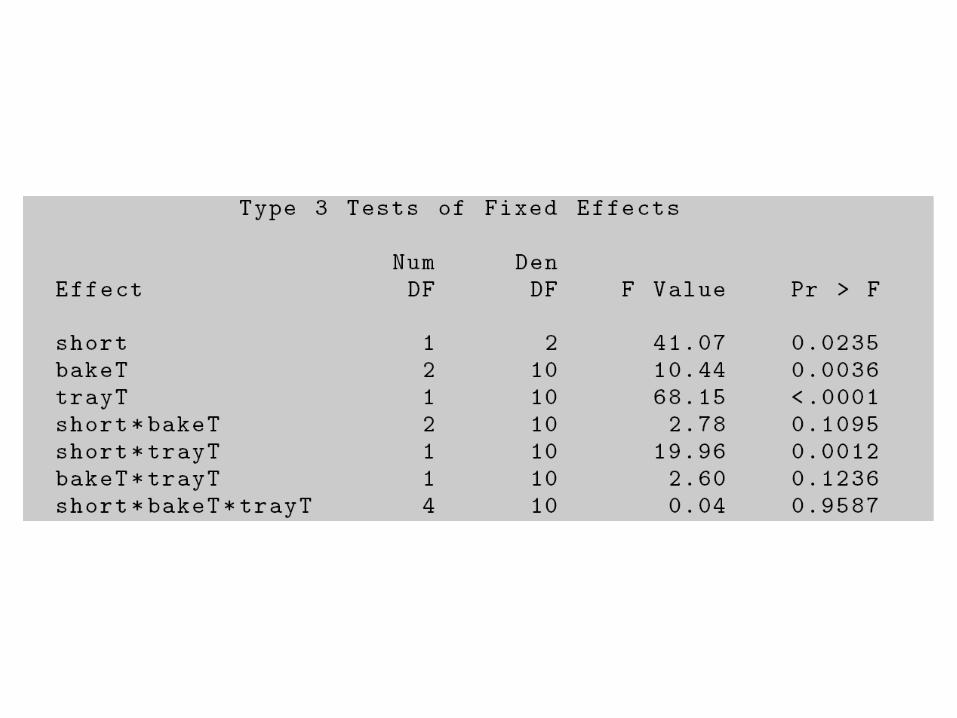

Hard to Vary Factors
• Some factors are hard or time consuming to vary
• Complete randomization is impractical
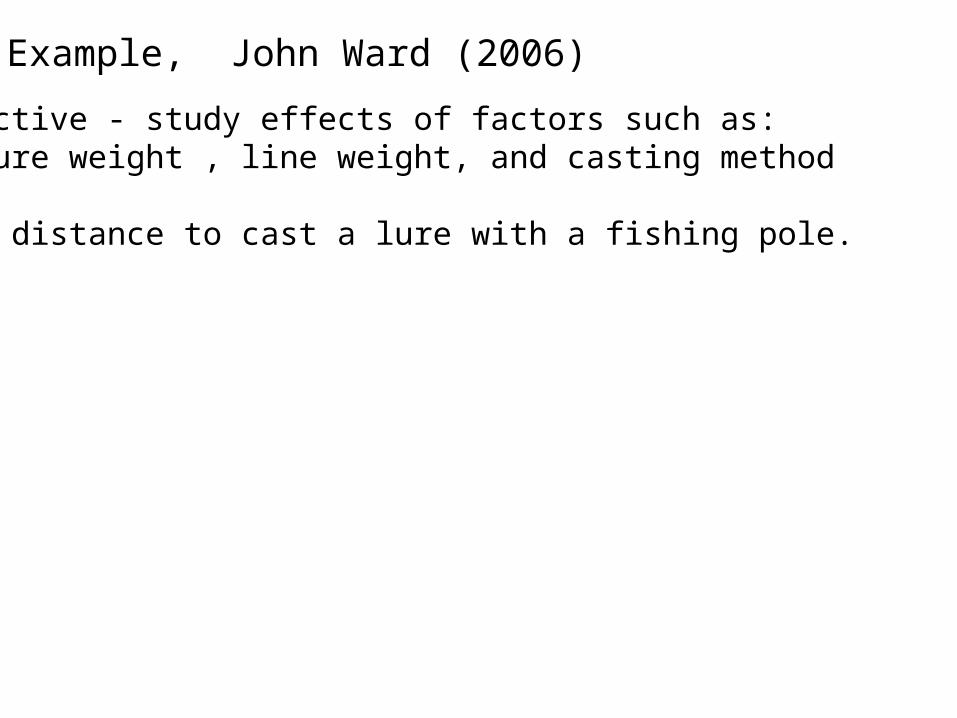
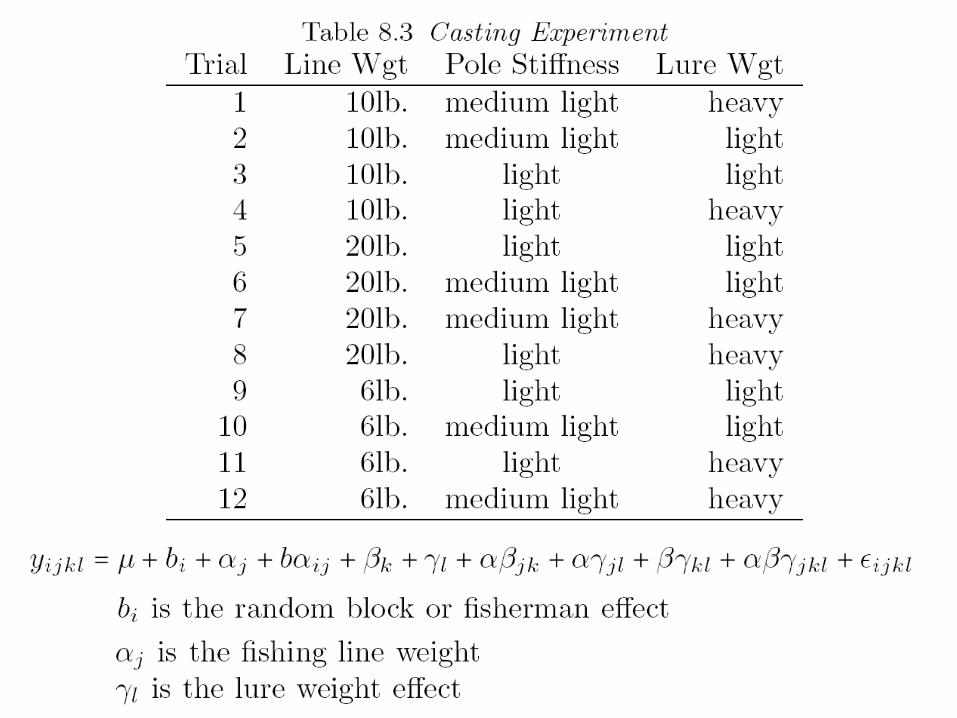
Example, John Ward (2006)
Objective - study effects of factors such as: lure weight , line weight, and casting method
upon distance to cast a lure with a fishing pole.
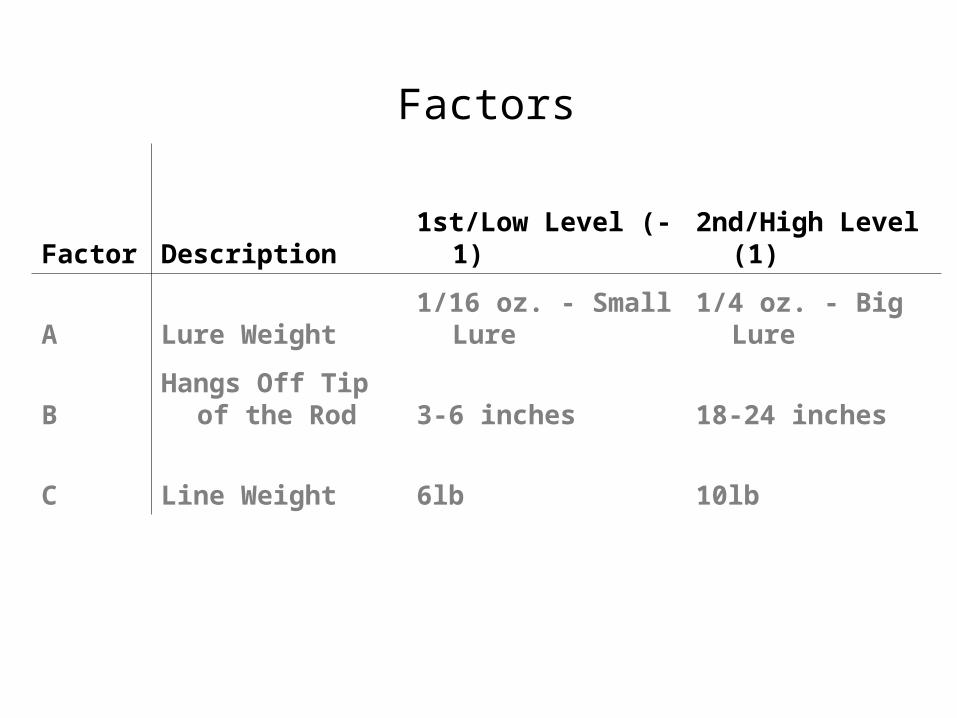
Factor Description 1st/Low Level (-1) 2nd/High Level (1)
A Lure Weight 1/16 oz. - Small Lure 1/4 oz. - Big Lure
BHangs Off Tip of the
Rod 3-6 inches 18-24 inches
C Line Weight 6lb 10lb
Factors
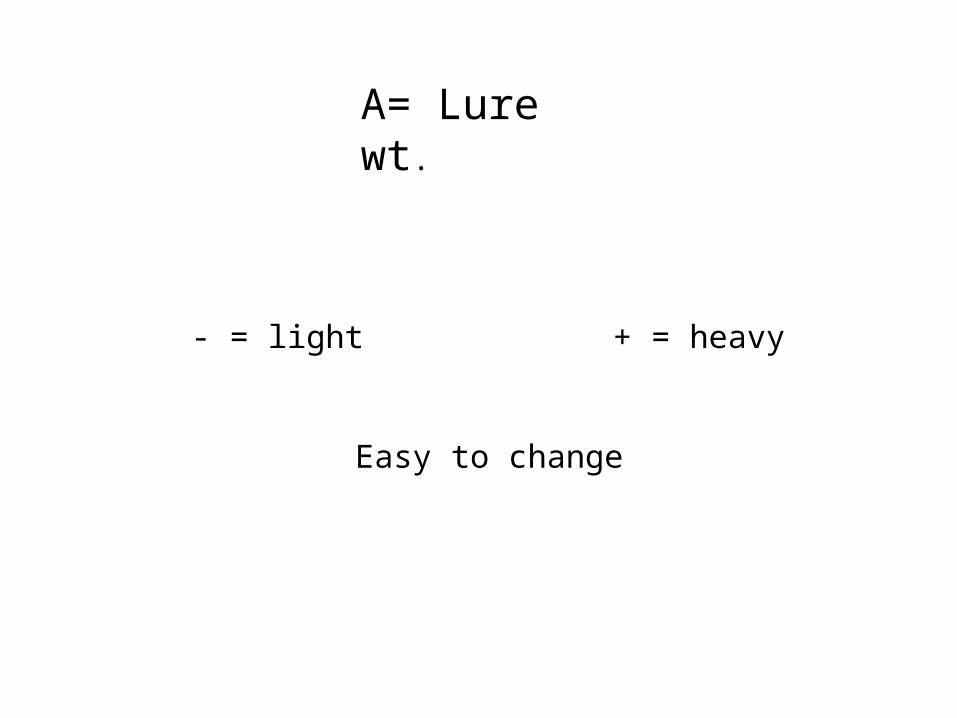
A= Lure wt.
- = light + = heavy
Easy to change
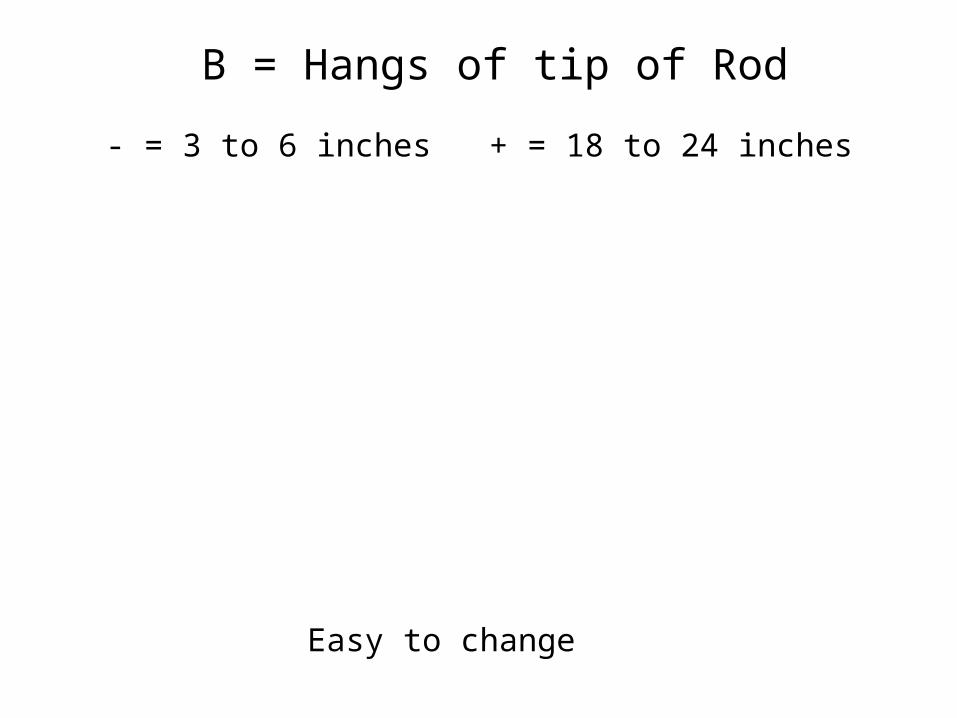
B = Hangs of tip of Rod
- = 3 to 6 inches + = 18 to 24 inches
Easy to change
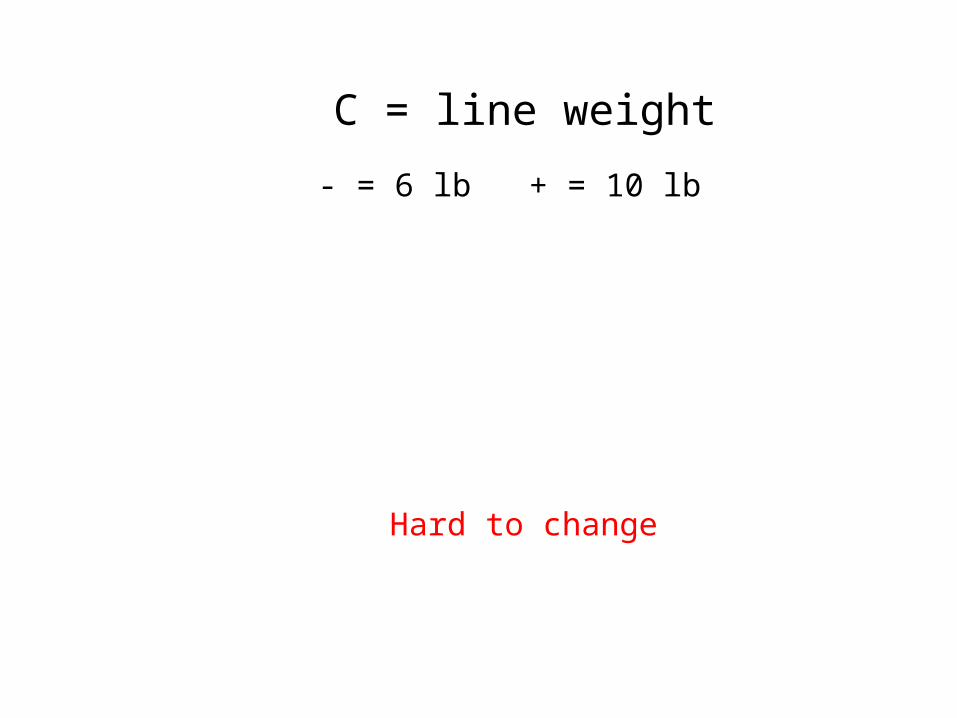
C = line weight
- = 6 lb + = 10 lb
Hard to change
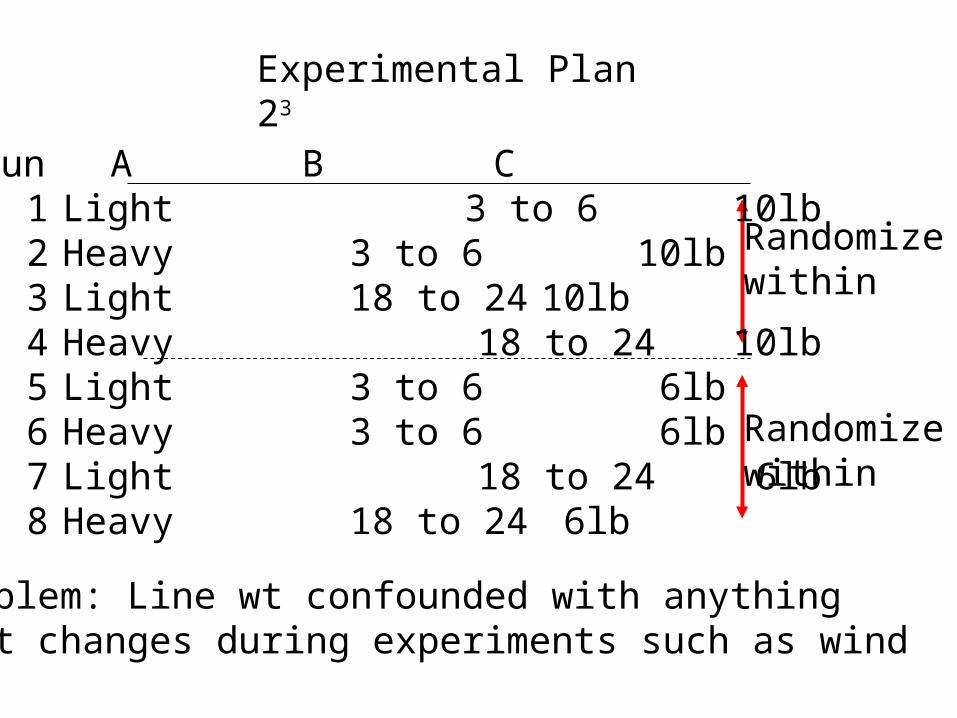
Experimental Plan 23
Randomizewithin
Randomizewithin
Run A B C1 Light 3 to 6 10lb2 Heavy 3 to 6 10lb3 Light 18 to 24 10lb4 Heavy 18 to 24 10lb5 Light 3 to 6 6lb6 Heavy 3 to 6 6lb7 Light 18 to 24 6lb8 Heavy 18 to 24 6lb
Problem: Line wt confounded with anything that changes during experiments such as wind
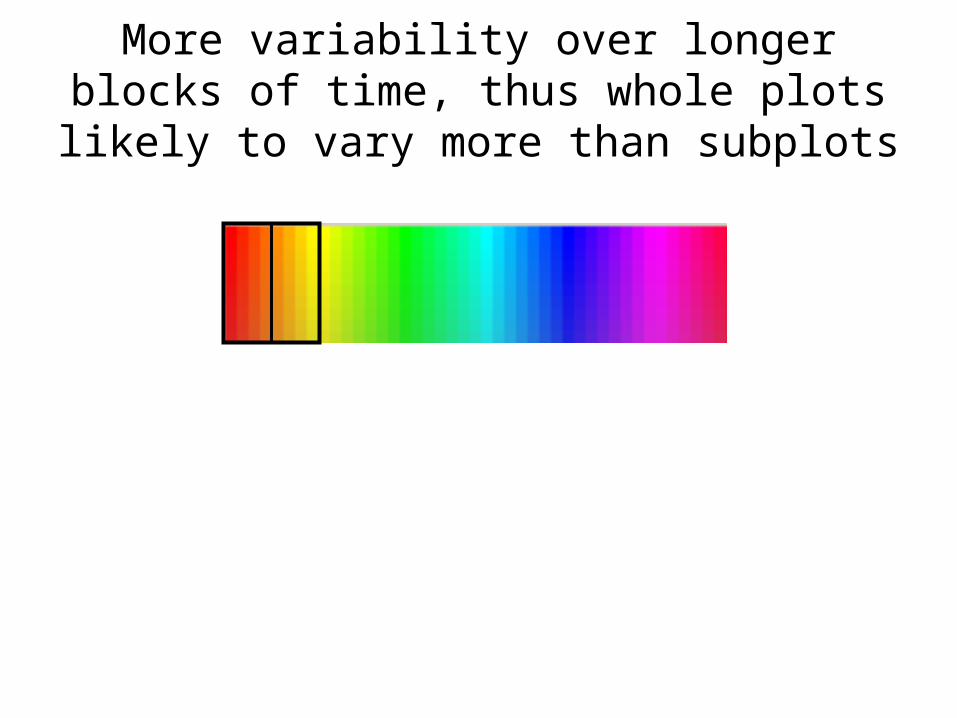
More variability over longer blocks of time, thus whole plots likely to vary more than subplots
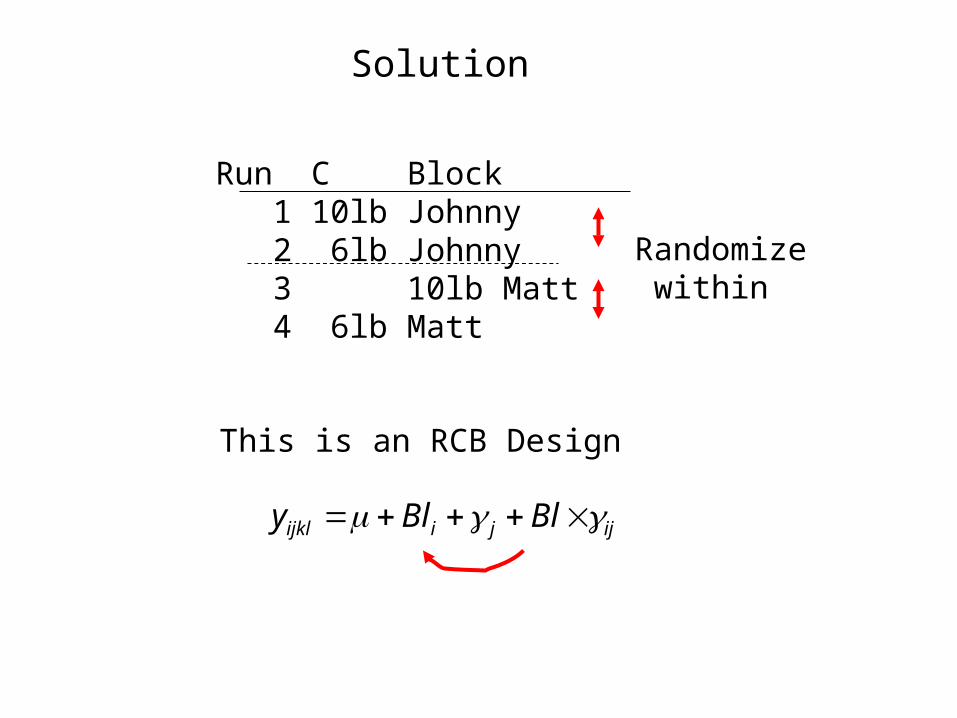
Solution
Run C Block 1 10lb Johnny 2 6lb Johnny 3 10lb Matt 4 6lb Matt
Randomize within
This is an RCB Design
ijjiijkl BlBly
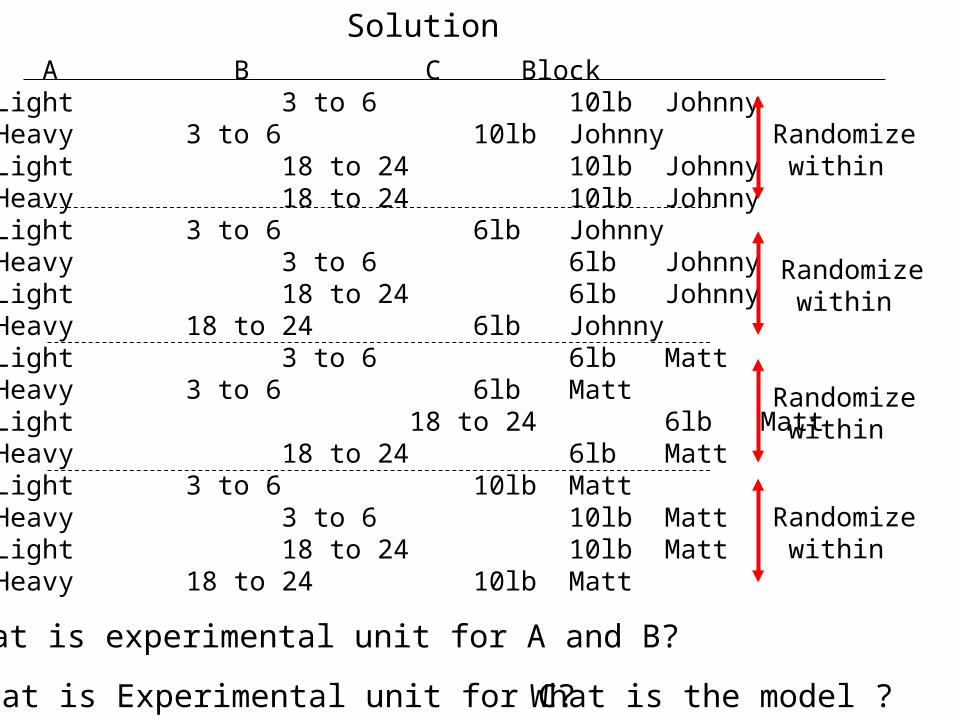
Run A B C Block1 Light 3 to 6 10lb Johnny2 Heavy 3 to 6 10lb Johnny3 Light 18 to 24 10lb Johnny4 Heavy 18 to 24 10lb Johnny5 Light 3 to 6 6lb Johnny6 Heavy 3 to 6 6lb Johnny7 Light 18 to 24 6lb Johnny8 Heavy 18 to 24 6lb Johnny9 Light 3 to 6 6lb Matt10 Heavy 3 to 6 6lb Matt11 Light 18 to 24 6lb Matt12 Heavy 18 to 24 6lb Matt13 Light 3 to 6 10lb Matt14 Heavy 3 to 6 10lb Matt15 Light 18 to 24 10lb Matt16 Heavy 18 to 24 10lb Matt
Randomize within
Randomize within
Randomize within
Randomize within
Solution
What is experimental unit for A and B?
What is Experimental unit for C? What is the model ?
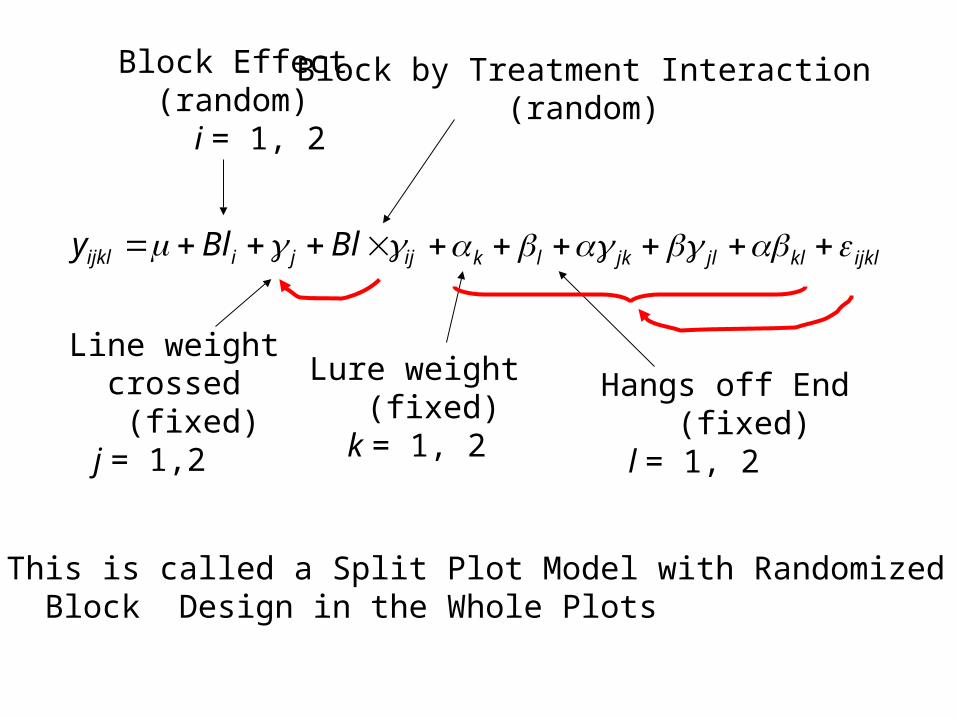
ijjiijkl BlBly ijklkljljklk
Line weight crossed (fixed) j = 1,2
Block by Treatment Interaction (random)
Hangs off End (fixed) l = 1, 2
Lure weight (fixed) k = 1, 2
Block Effect (random) i = 1, 2
This is called a Split Plot Model with Randomized Block Design in the Whole Plots
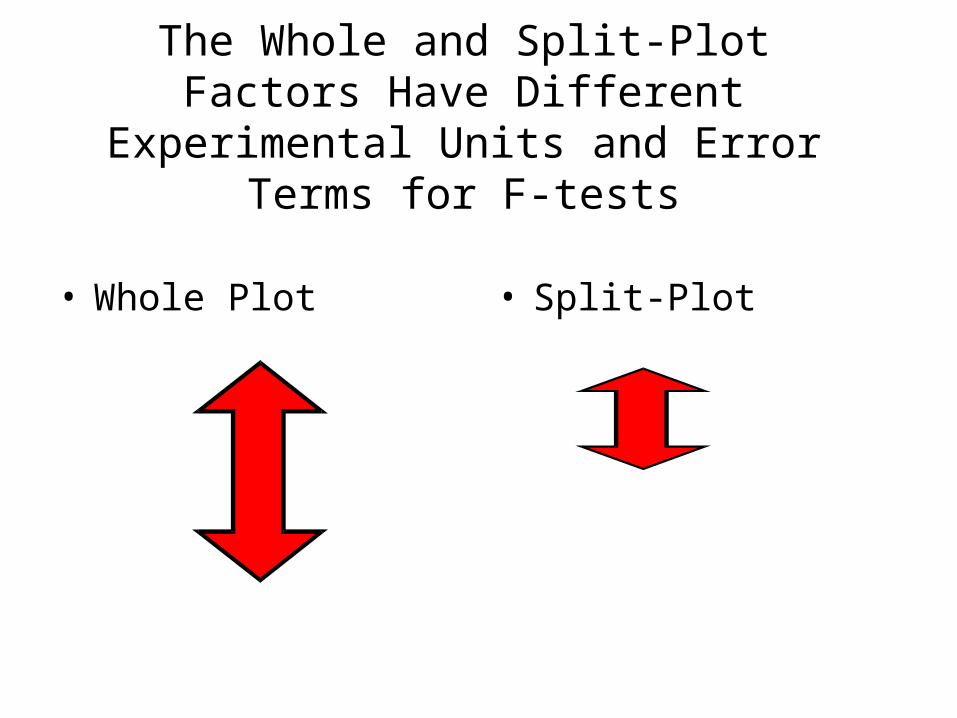
The Whole and Split-Plot Factors Have Different Experimental Units and Error Terms
for F-tests
• Whole Plot • Split-Plot
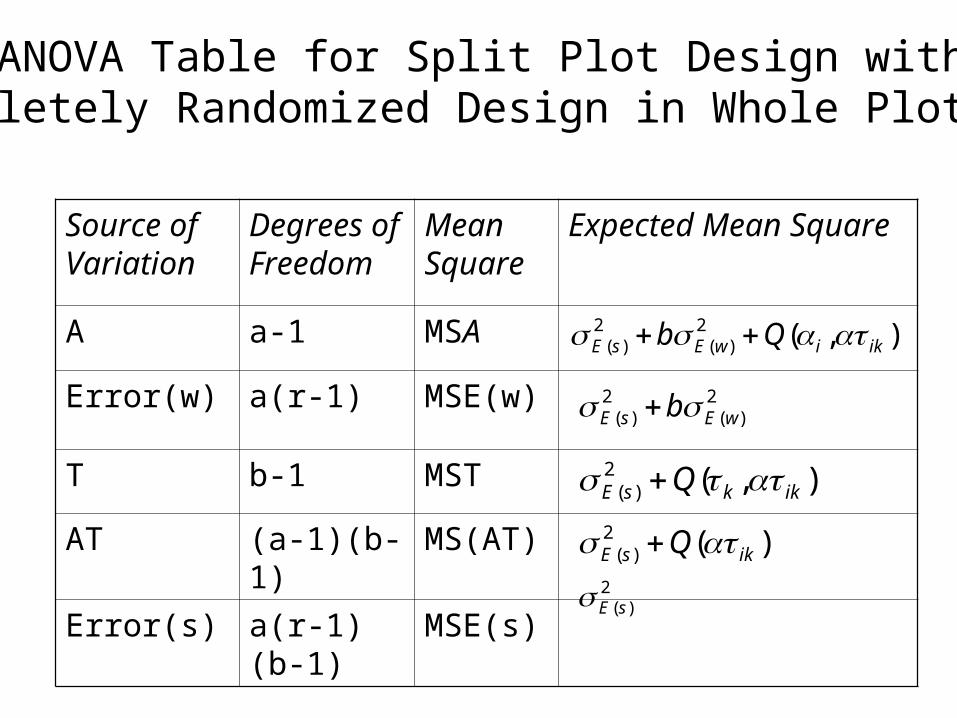
Source of Variation
Degrees of Freedom
Mean Square
Expected Mean Square
A a-1 MSA
Error(w) a(r-1) MSE(w)
T b-1 MST
AT (a-1)(b-1) MS(AT)
Error(s) a(r-1)(b-1) MSE(s)
),(2)(
2)( ikiwEsE Qb
2)(
2)( wEsE b
)(2)( iksE Q
),(2)( ikksE Q
2)(sE
ANOVA Table for Split Plot Design with Completely Randomized Design in Whole Plots
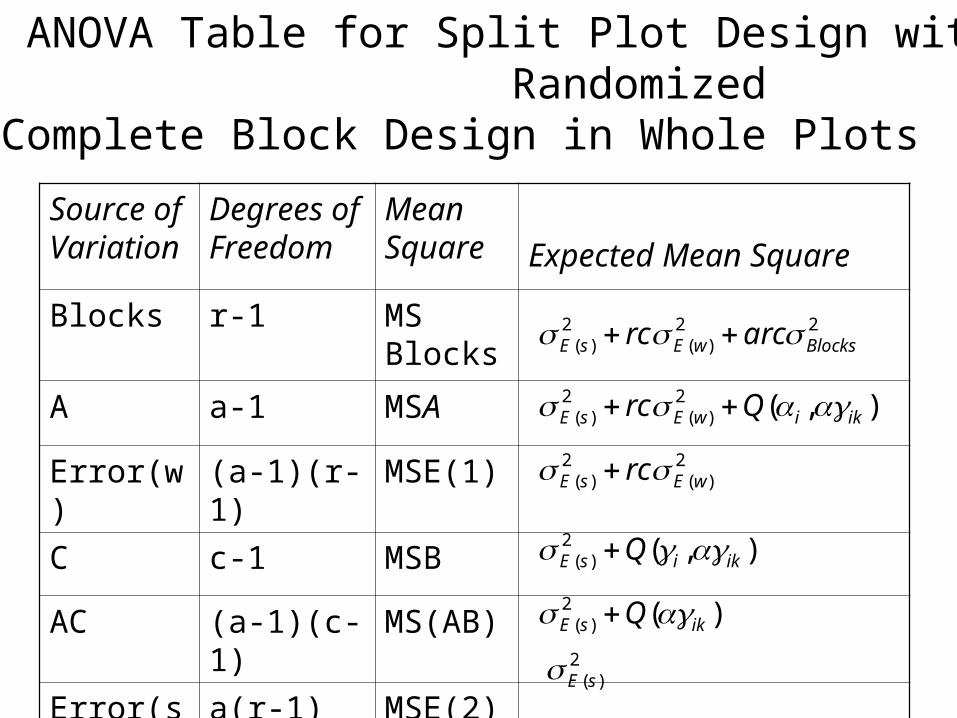
Source of Variation
Degrees of Freedom
Mean Square Expected Mean Square
Blocks r-1 MS Blocks
A a-1 MSA
Error(w) (a-1)(r-1) MSE(1)
C c-1 MSB
AC (a-1)(c-1) MS(AB)
Error(s) a(r-1)(c-1) MSE(2)
),(2)(
2)( ikiwEsE Qrc
22)(
2)( BlockswEsE arcrc
2)(
2)( wEsE rc
),(2)( ikisE Q
)(2)( iksE Q
2)(sE
ANOVA Table for Split Plot Design with Randomized Complete Block Design in Whole Plots
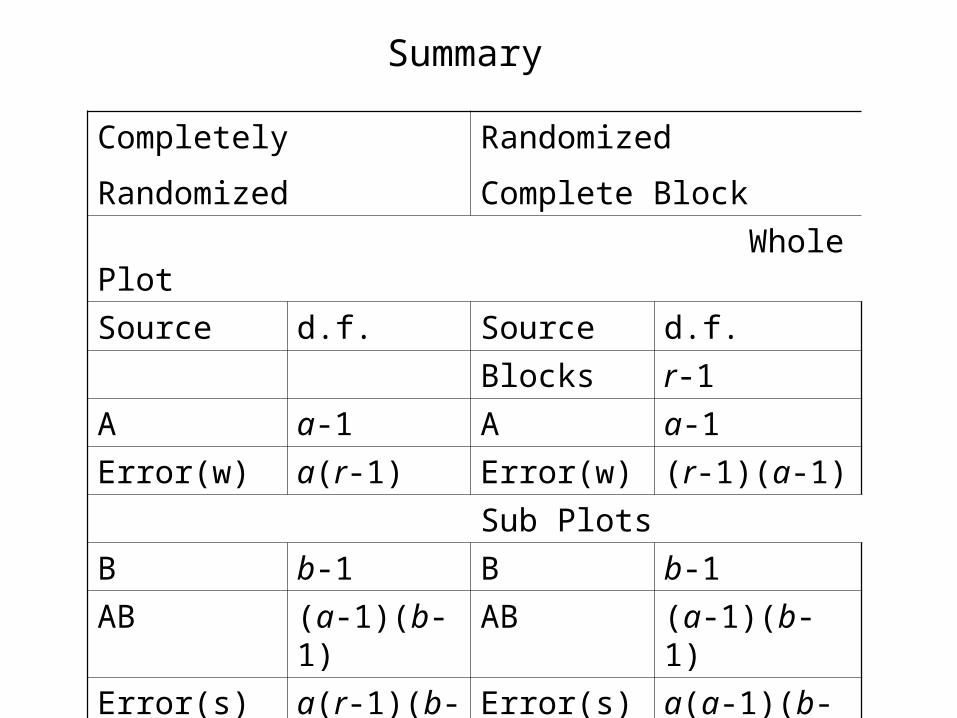
Completely Randomized
Randomized Complete Block
Whole Plot
Source d.f. Source d.f.
Blocks r-1
A a-1 A a-1
Error(w) a(r-1) Error(w) (r-1)(a-1)
Sub Plots
B b-1 B b-1
AB (a-1)(b-1) AB (a-1)(b-1)
Error(s) a(r-1)(b-1) Error(s) a(a-1)(b-1)
Summary
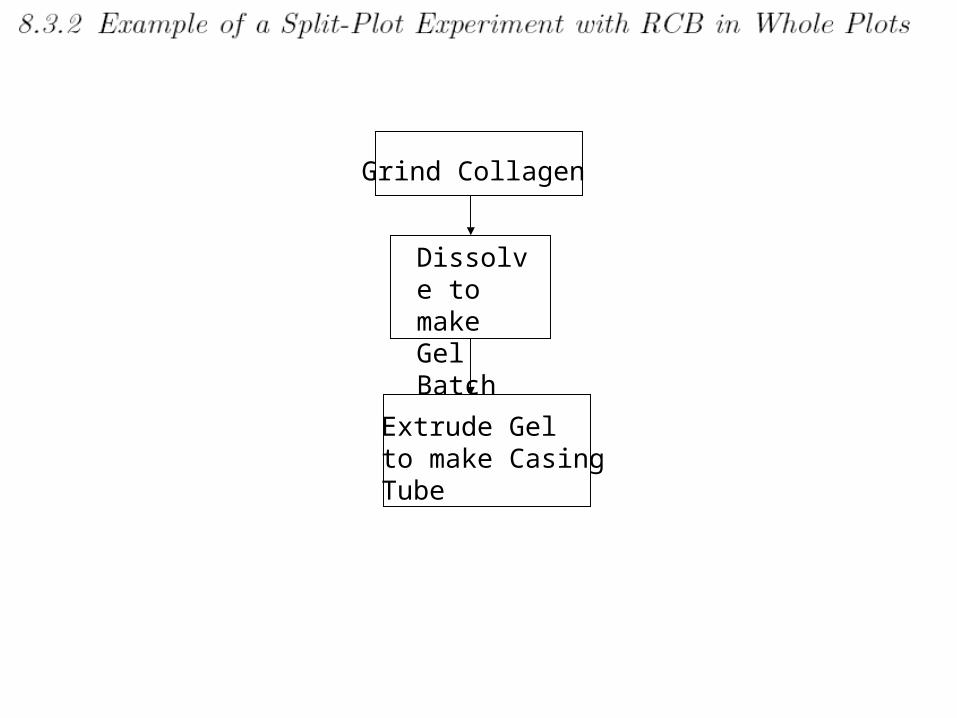
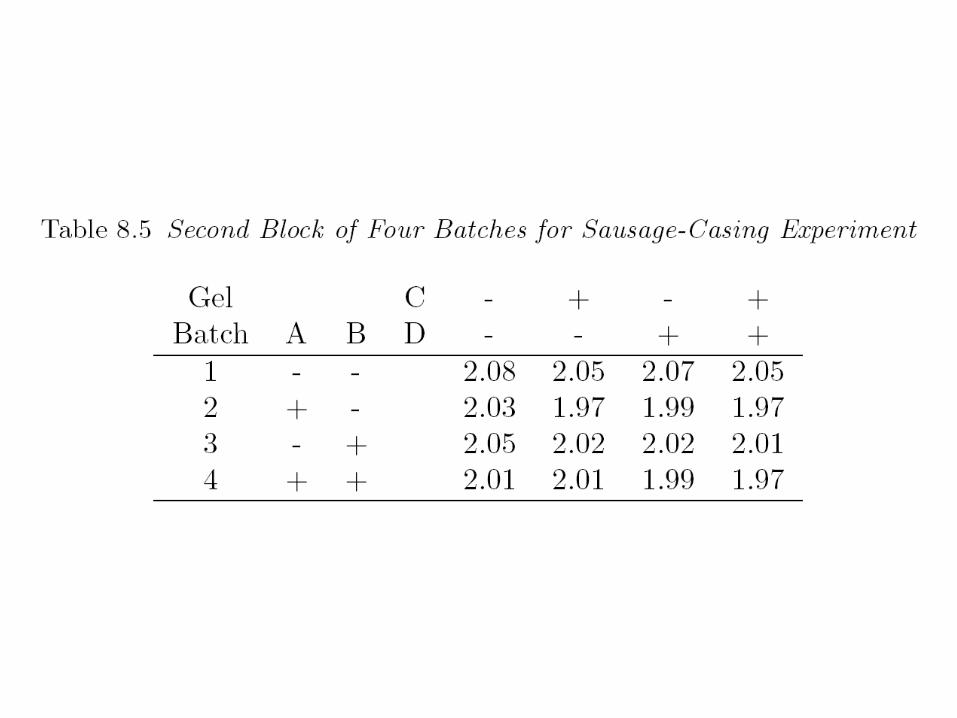
Grind Collagen
Dissolve to make GelBatch
Extrude Gelto make Casing Tube
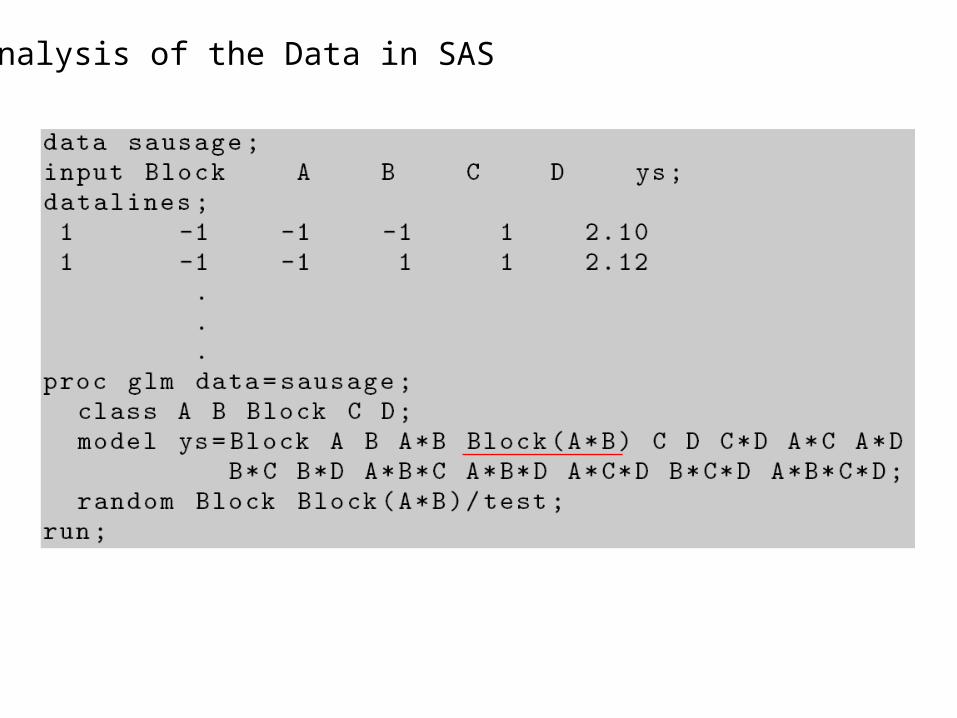
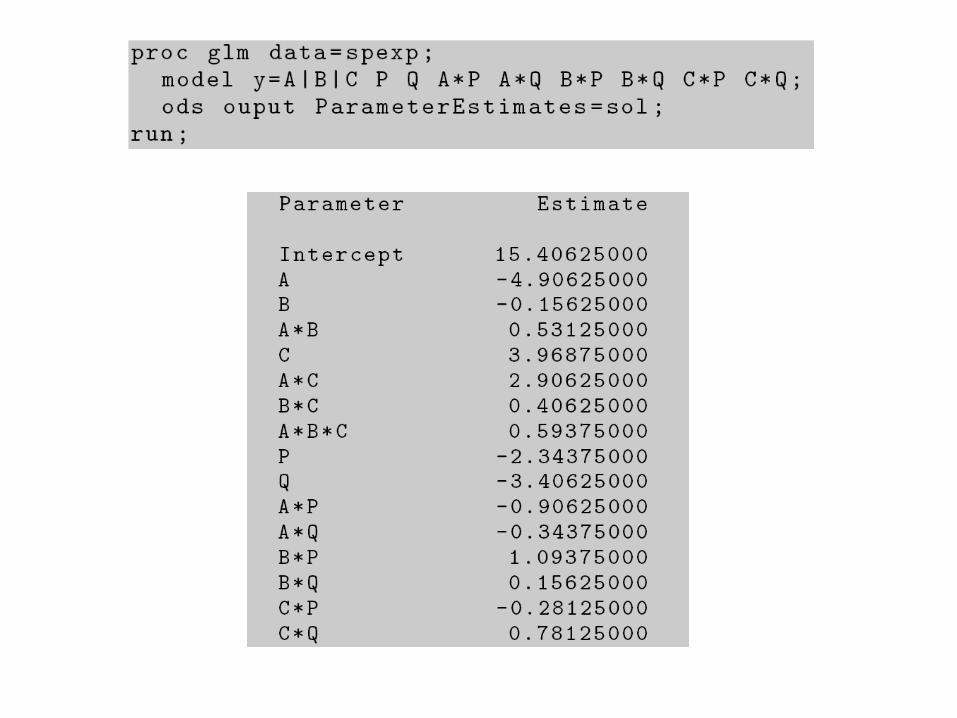
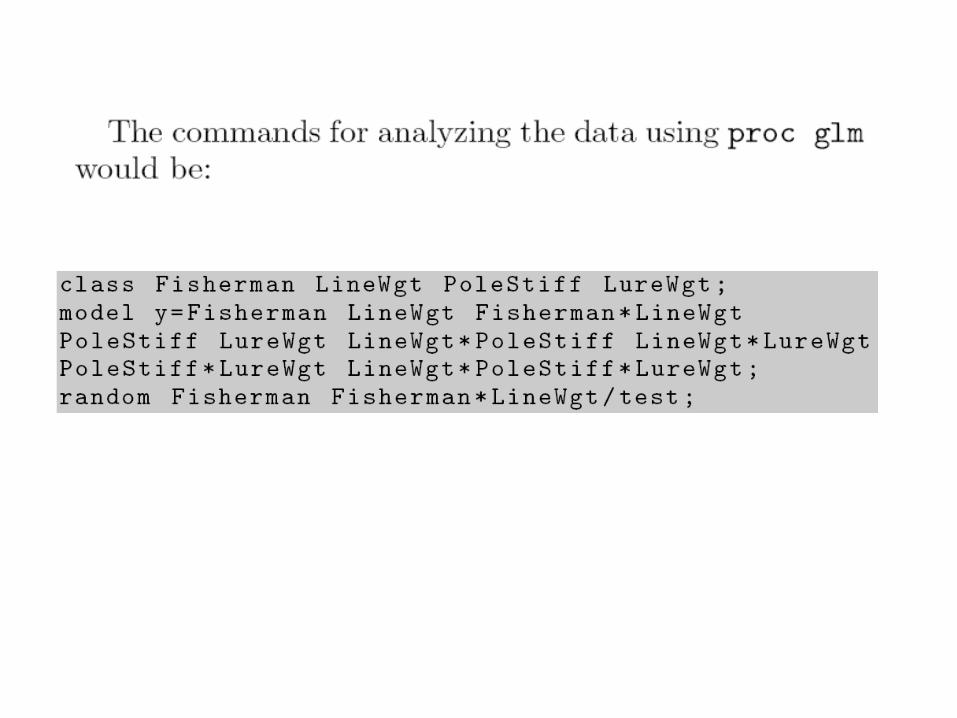
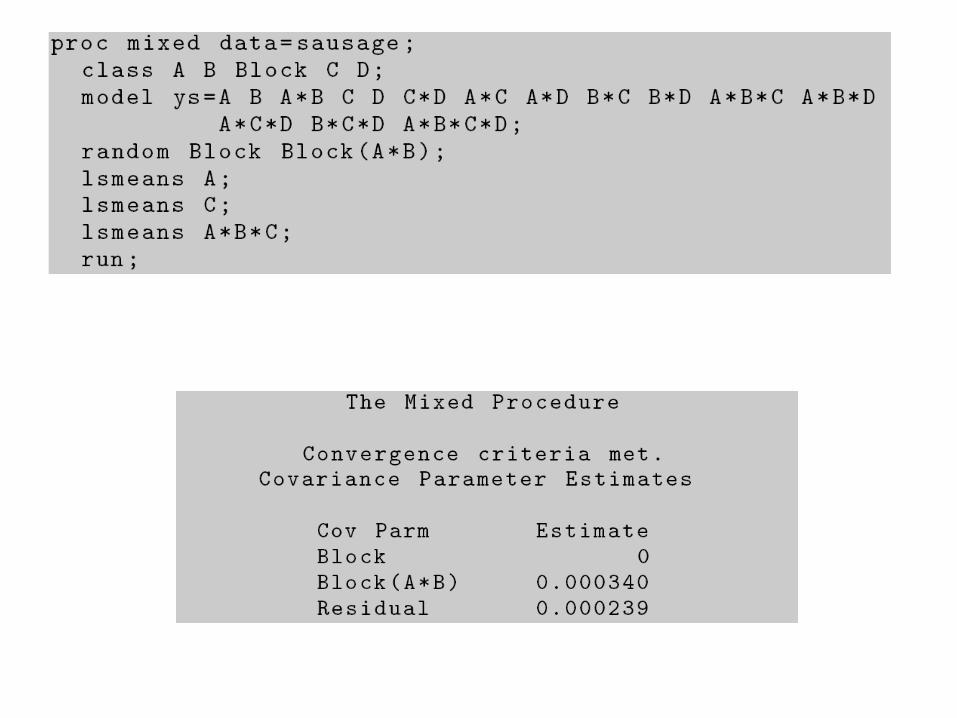
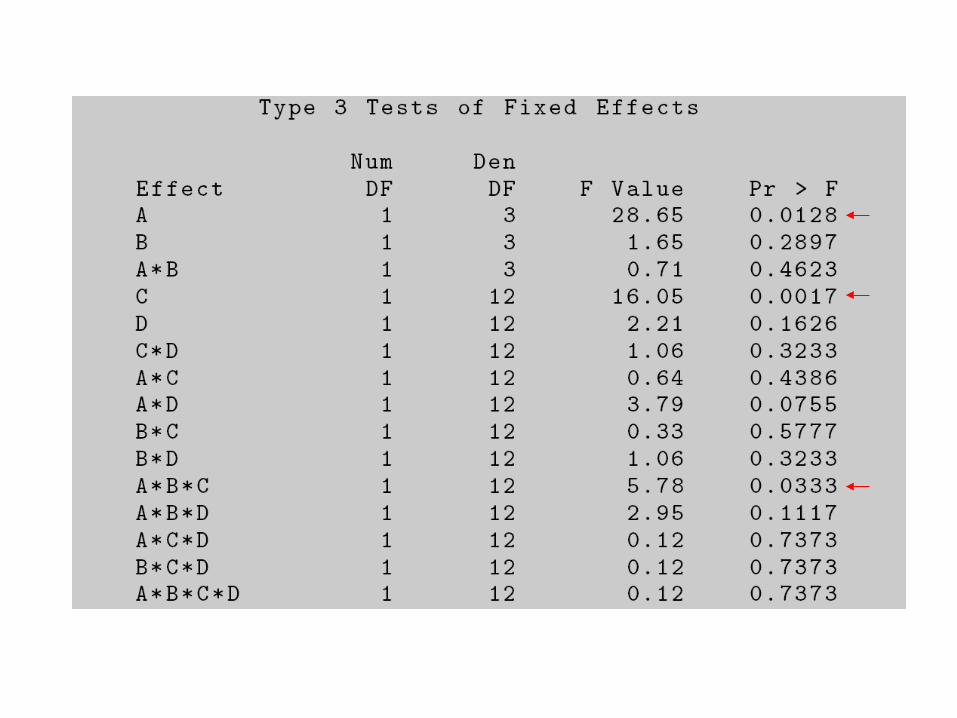
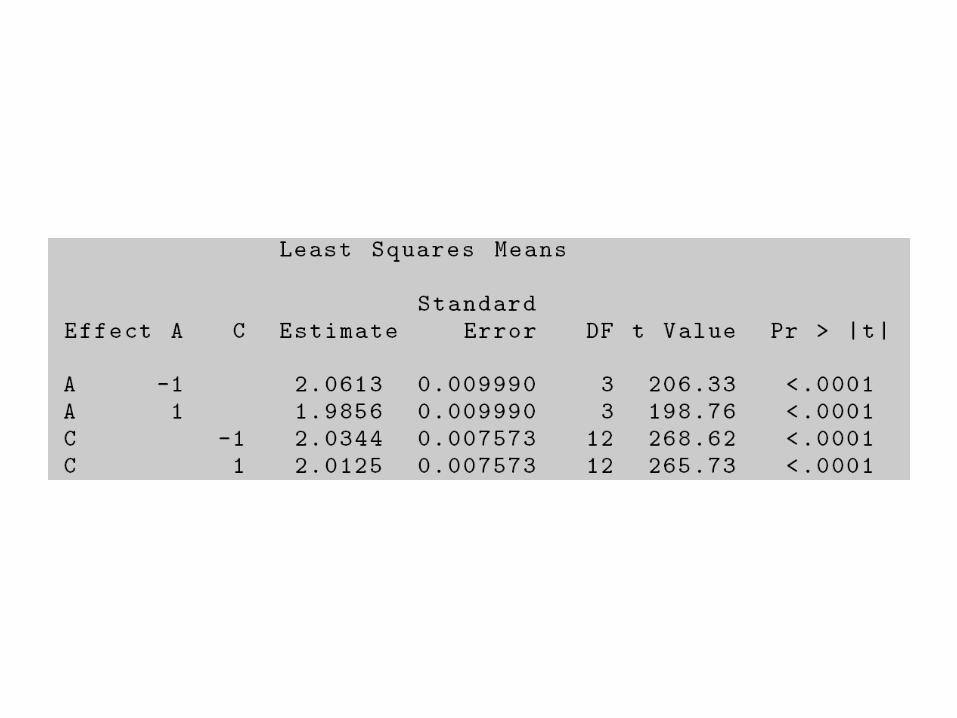
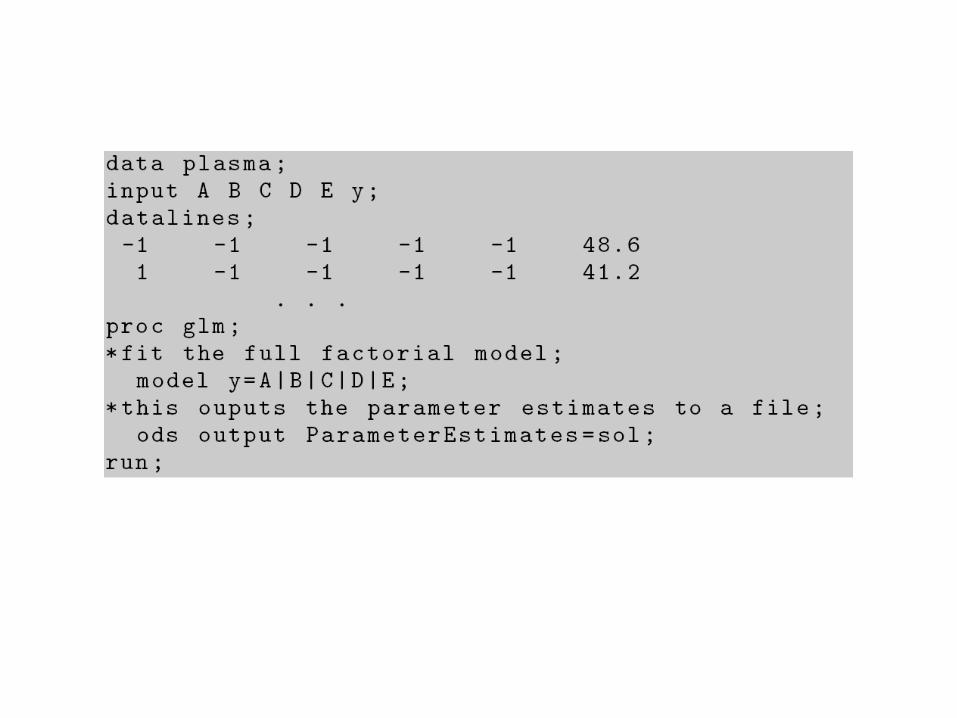
Analysis of the Data in SAS
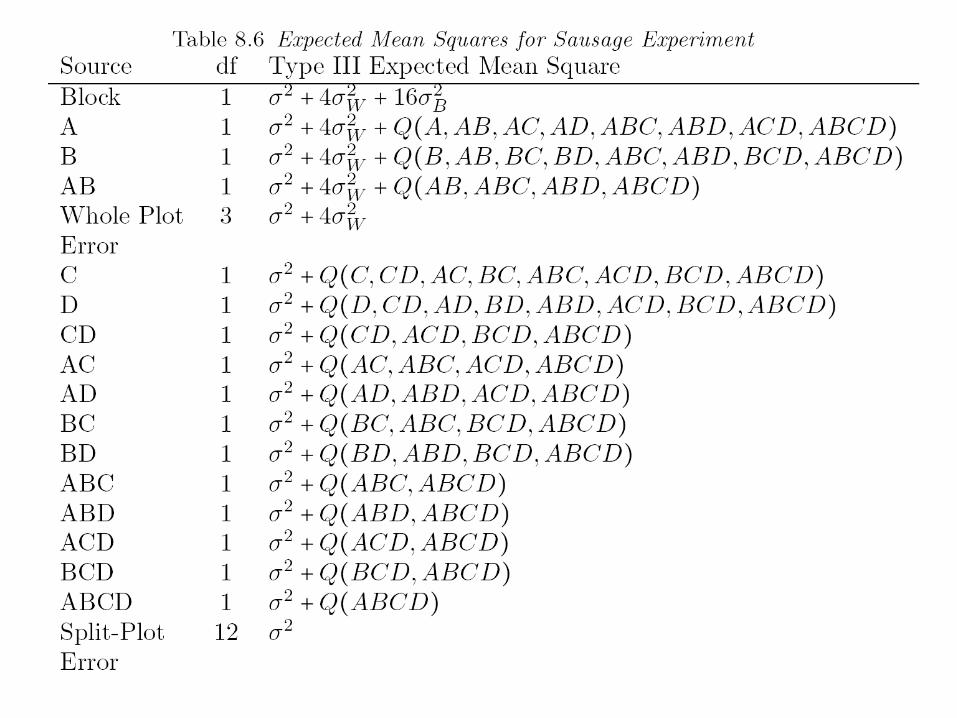
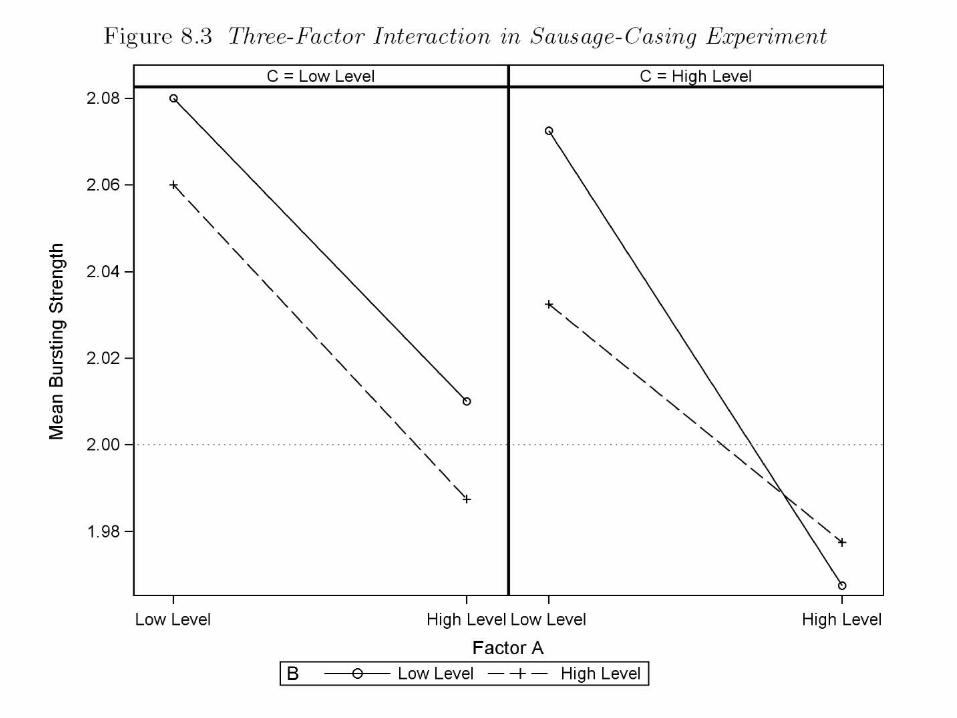
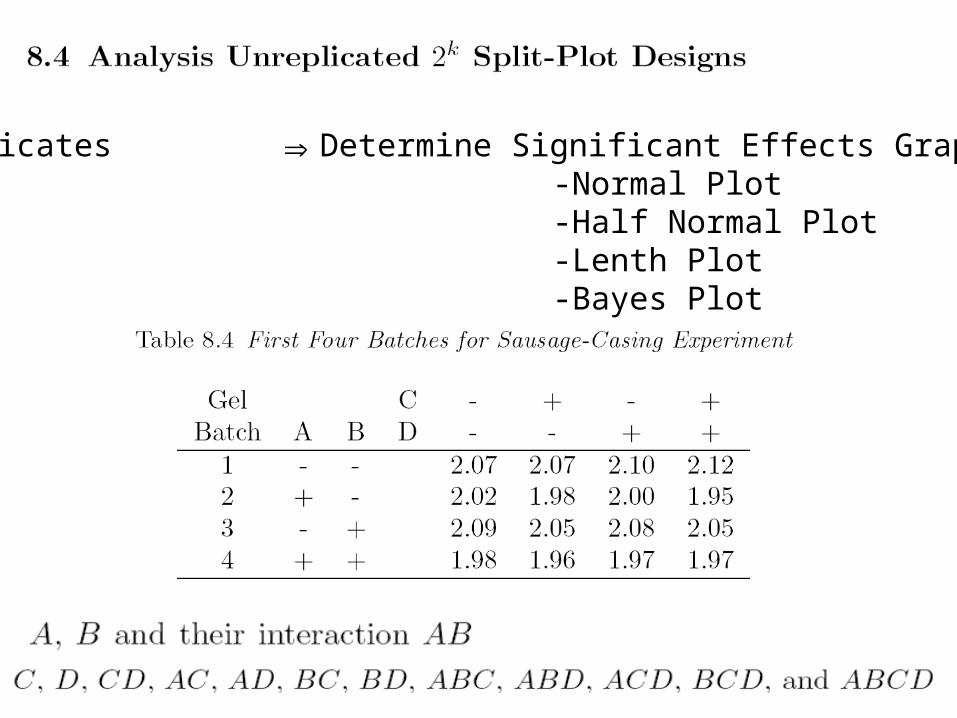
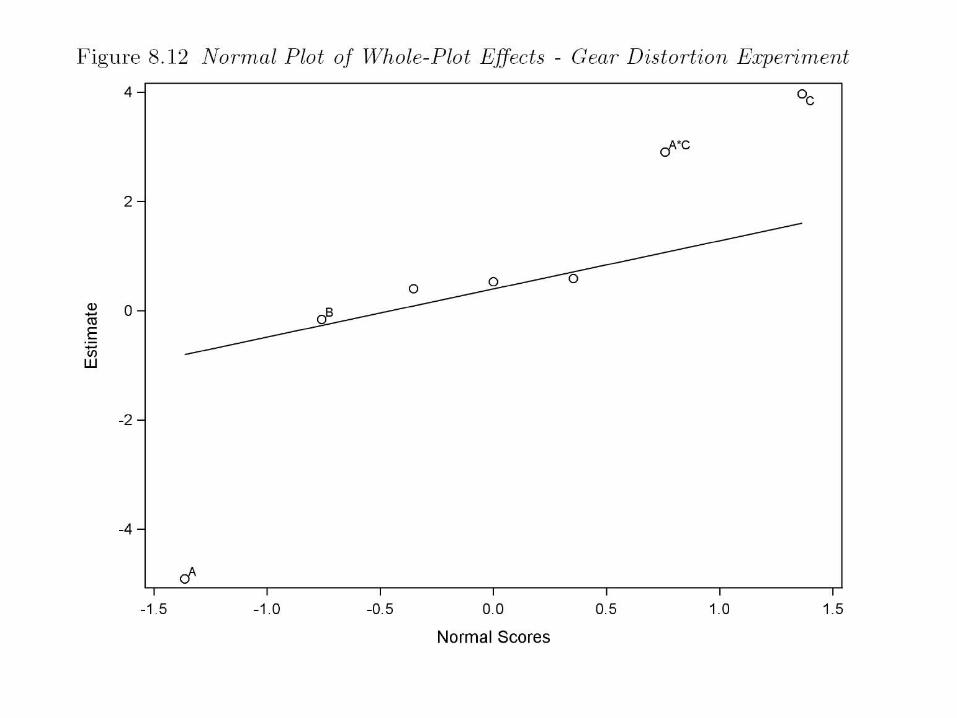
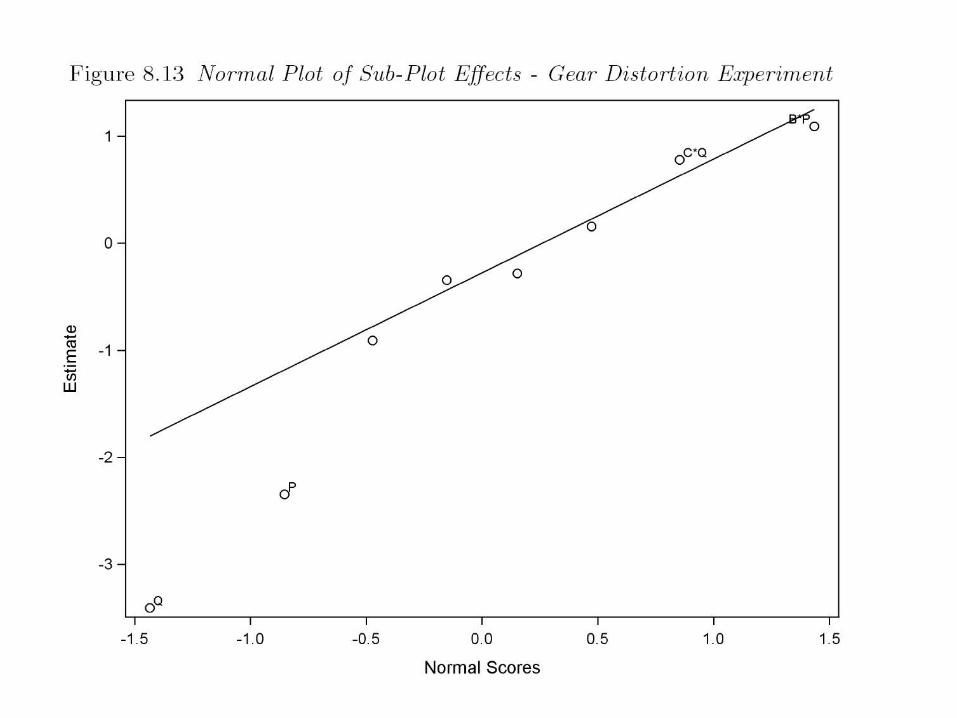
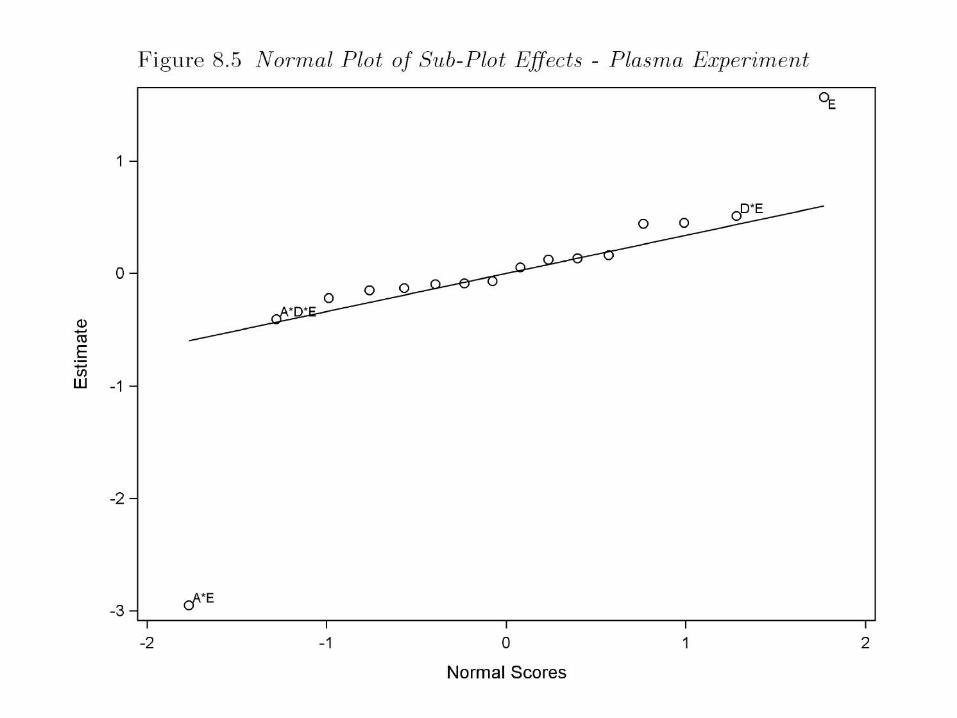
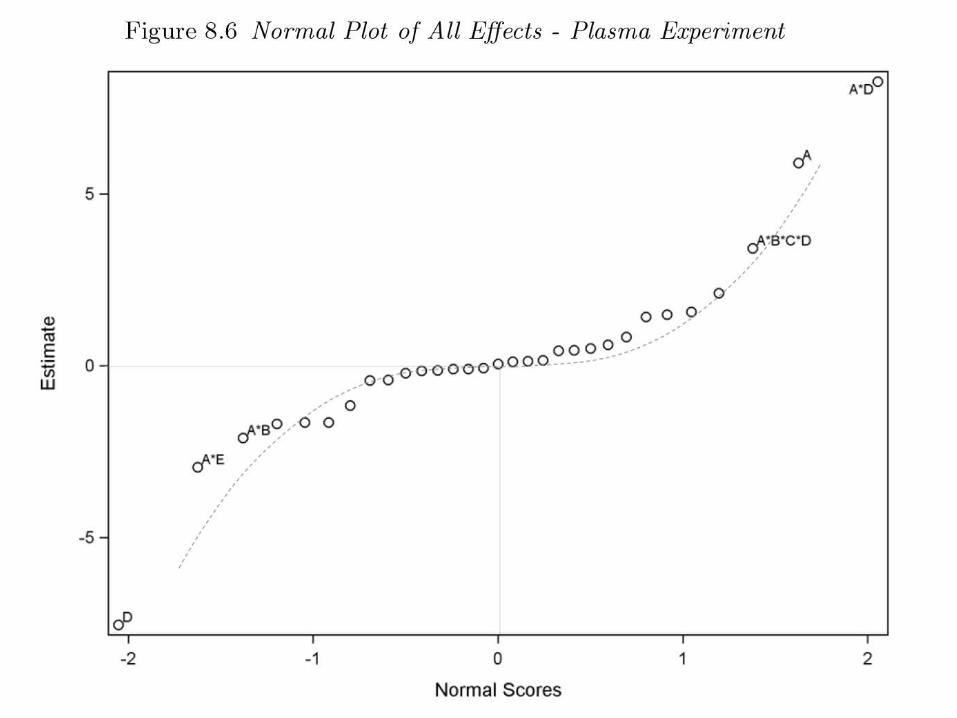
No Replicates Determine Significant Effects Graphically -Normal Plot -Half Normal Plot -Lenth Plot -Bayes Plot
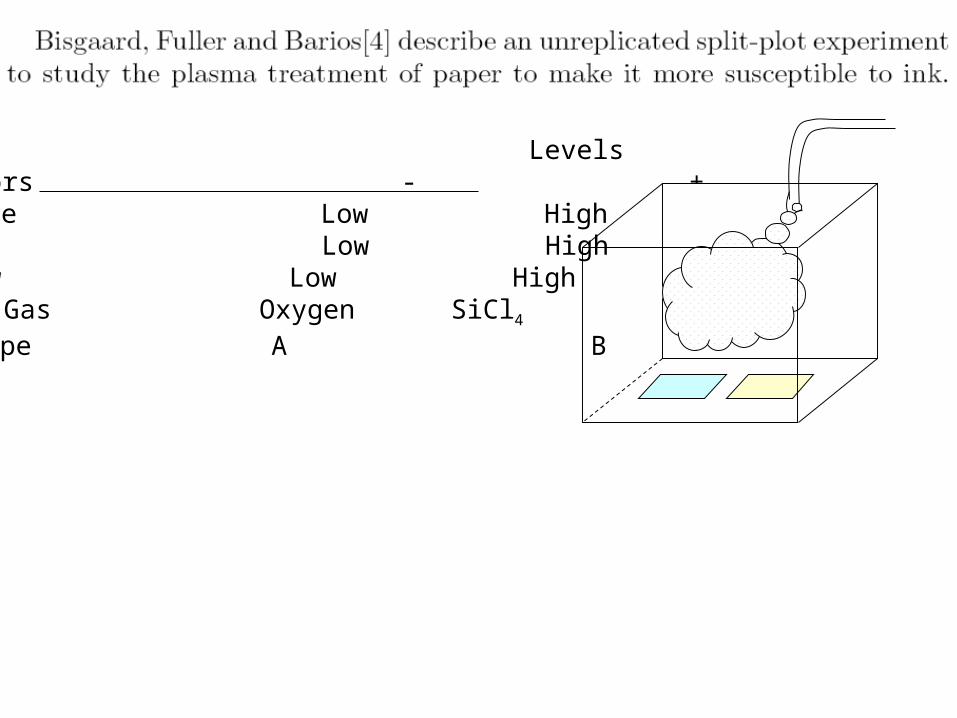
Levels Factors - +A: Pressure Low HighB: Power Low HighC: Gas Flow Low HighD: Type of Gas Oxygen SiCl4
E: Paper Type A B
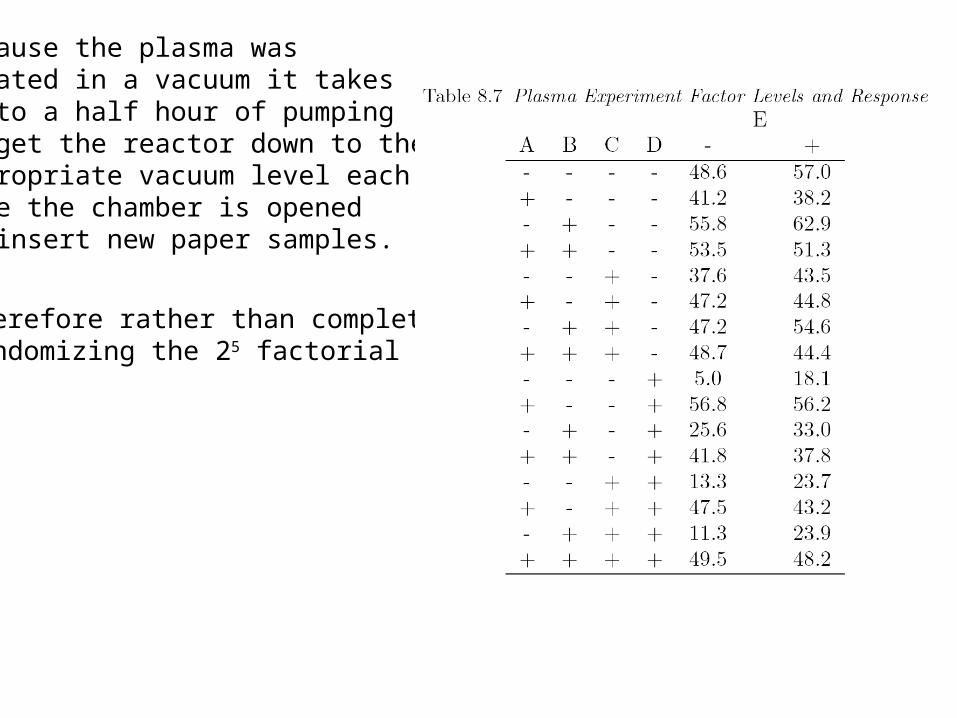
Because the plasma wascreated in a vacuum it takesup to a half hour of pumpingto get the reactor down to the appropriate vacuum level eachtime the chamber is openedto insert new paper samples.
Therefore rather than completelyrandomizing the 25 factorial …
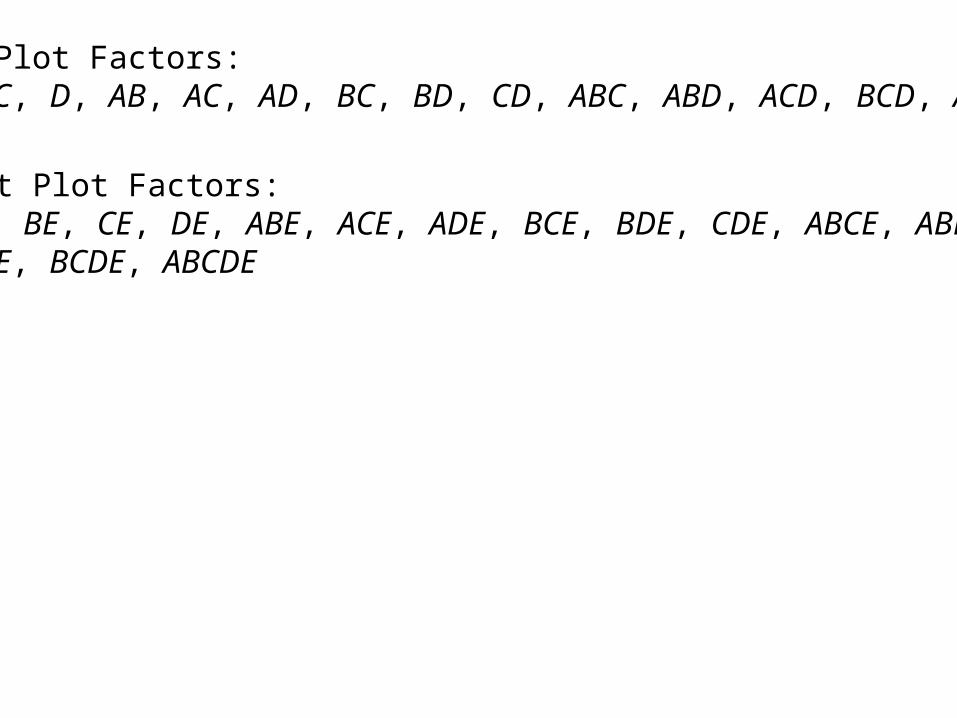
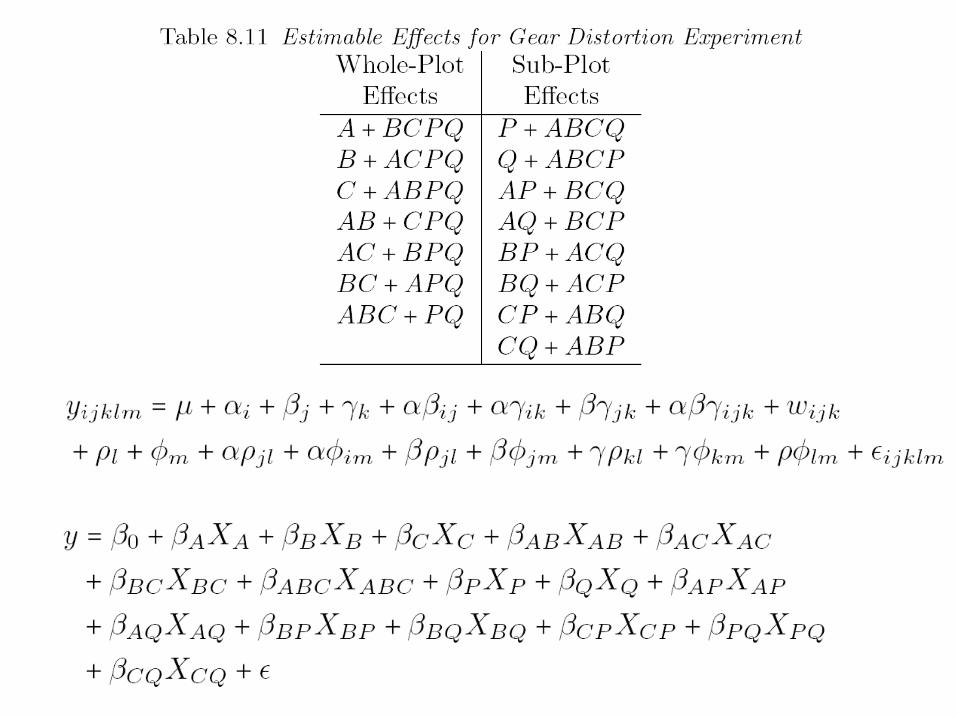
Whole Plot Factors:A, B, C, D, AB, AC, AD, BC, BD, CD, ABC, ABD, ACD, BCD, ABCD
Split Plot Factors:E, AE, BE, CE, DE, ABE, ACE, ADE, BCE, BDE, CDE, ABCE, ABDE, ACDE, BCDE, ABCDE
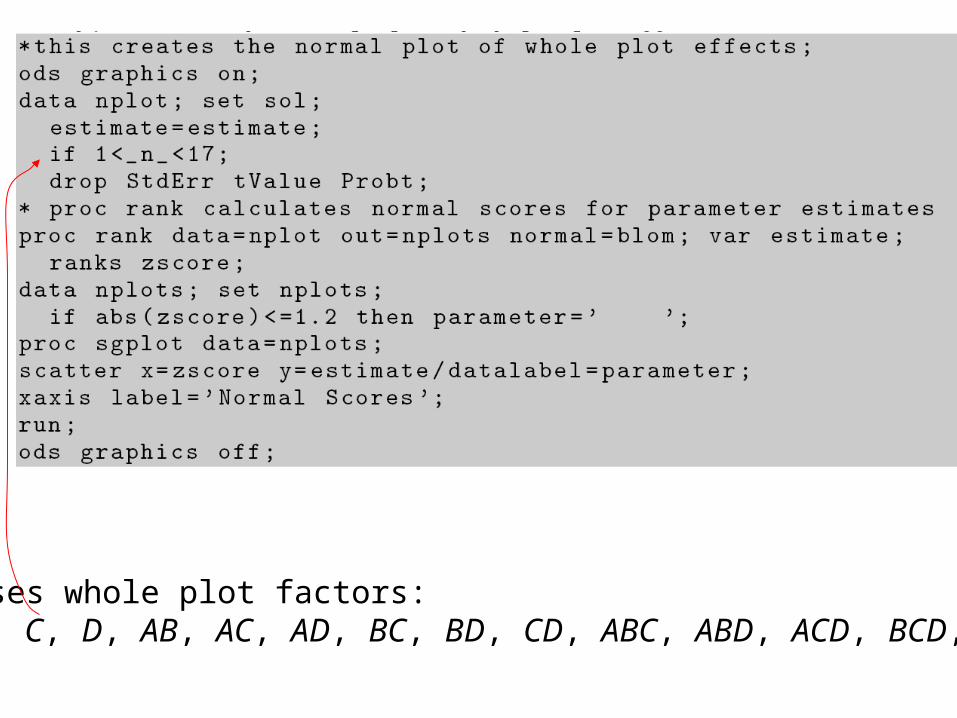
Chooses whole plot factors:A, B, C, D, AB, AC, AD, BC, BD, CD, ABC, ABD, ACD, BCD, ABCD
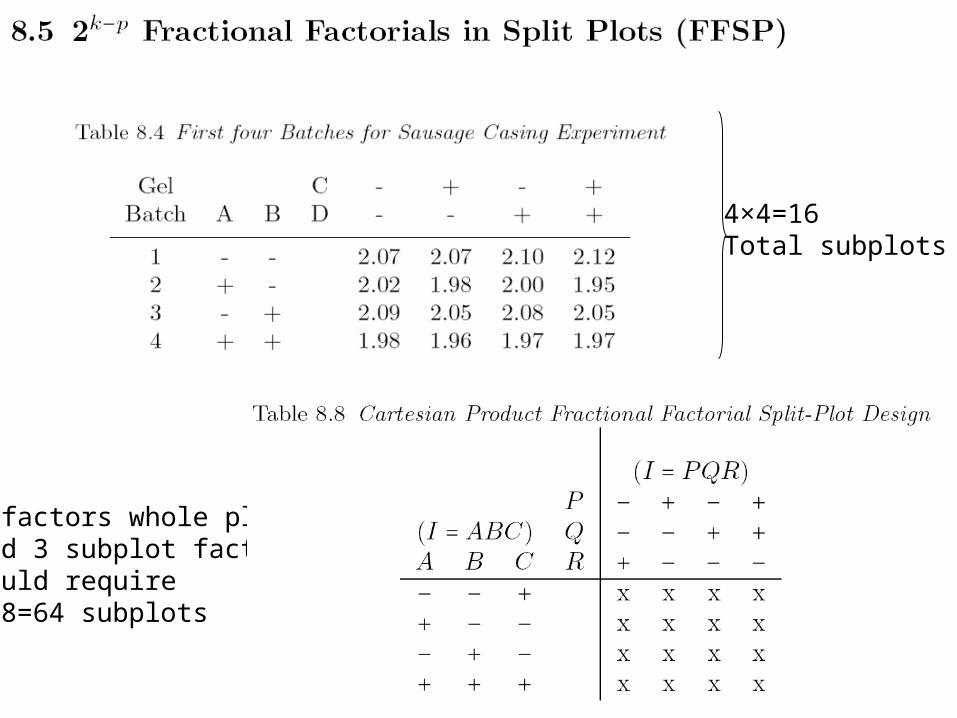
4×4=16 Total subplots
3 factors whole plotand 3 subplot factorswould require8×8=64 subplots
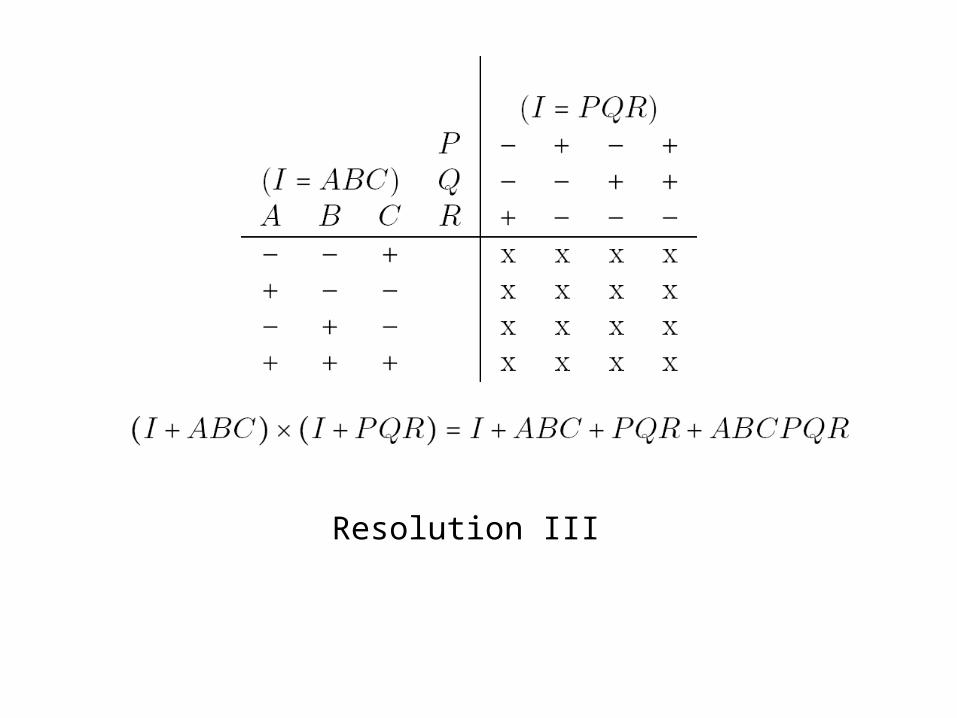
Resolution III
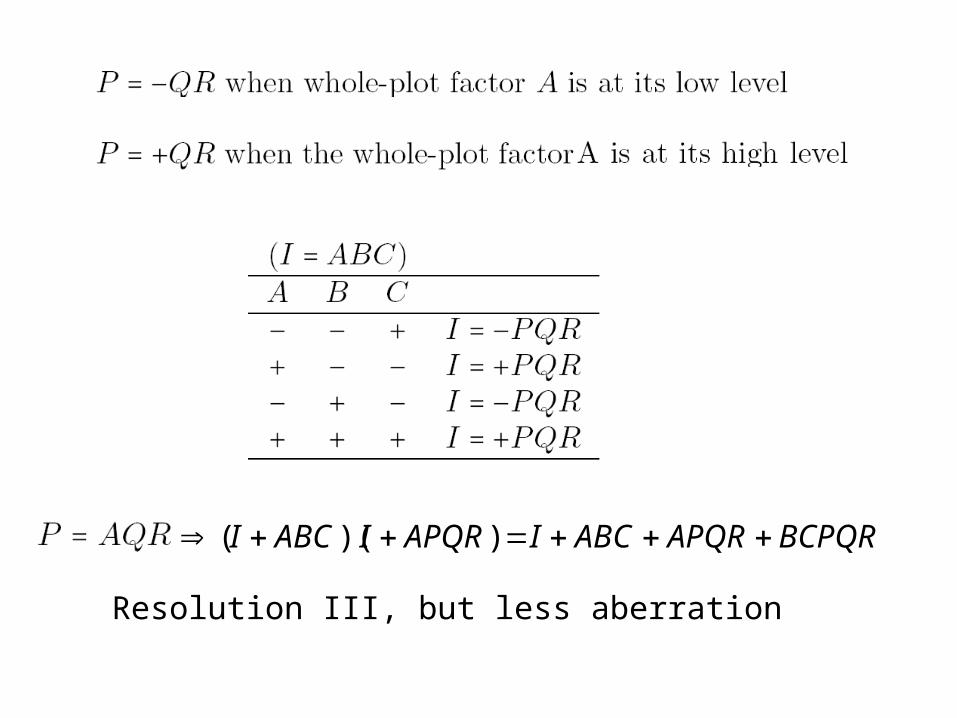
BCPQRAPQRABCIAPQRIABCI ))((
Resolution III, but less aberration
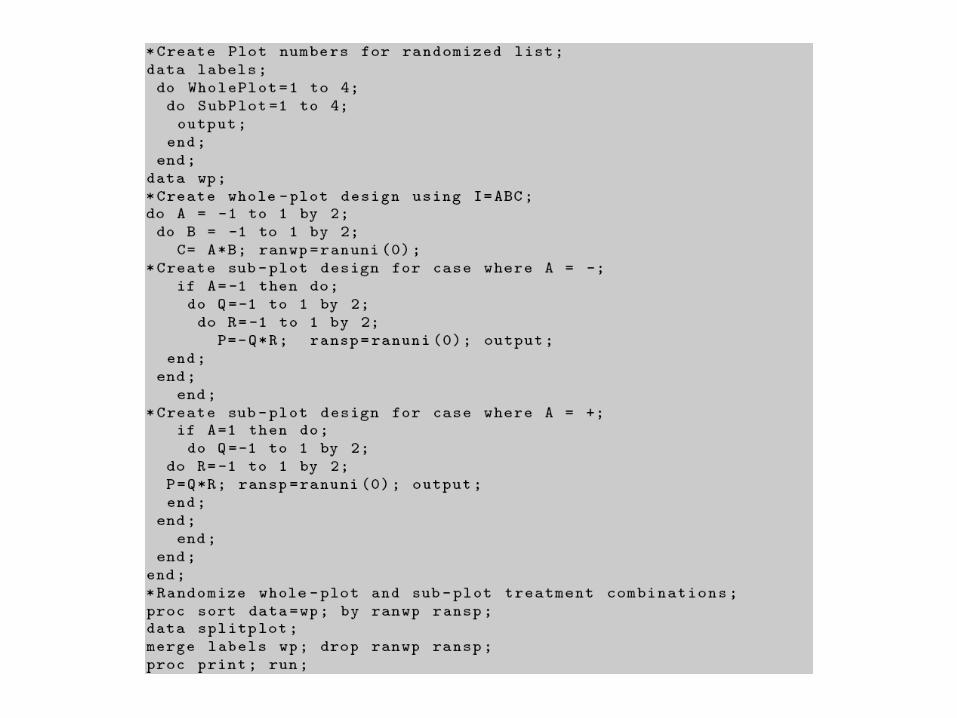
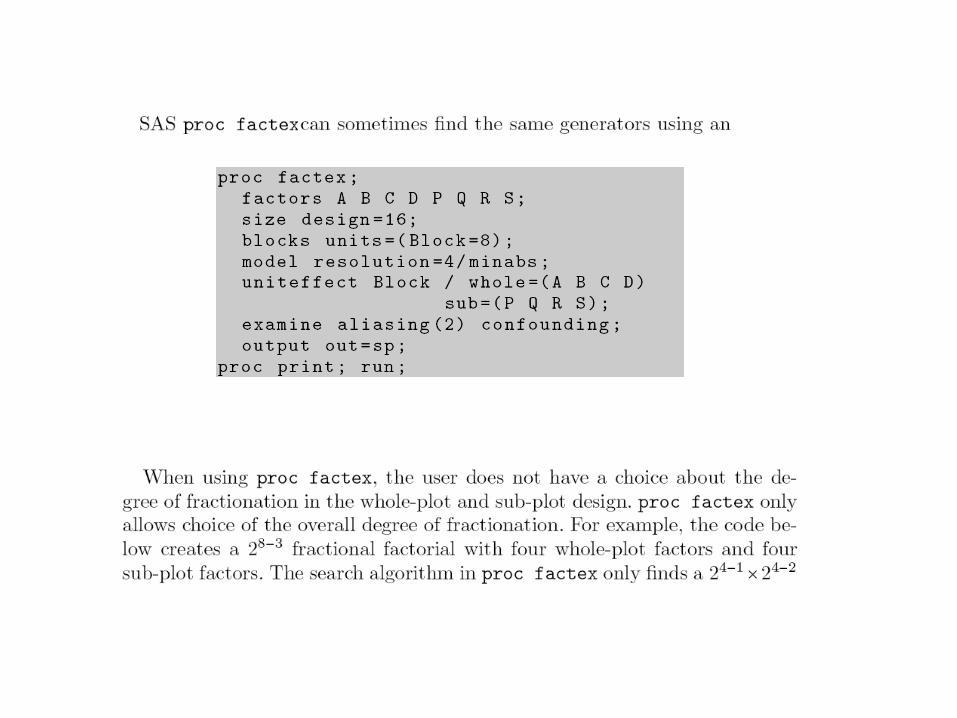
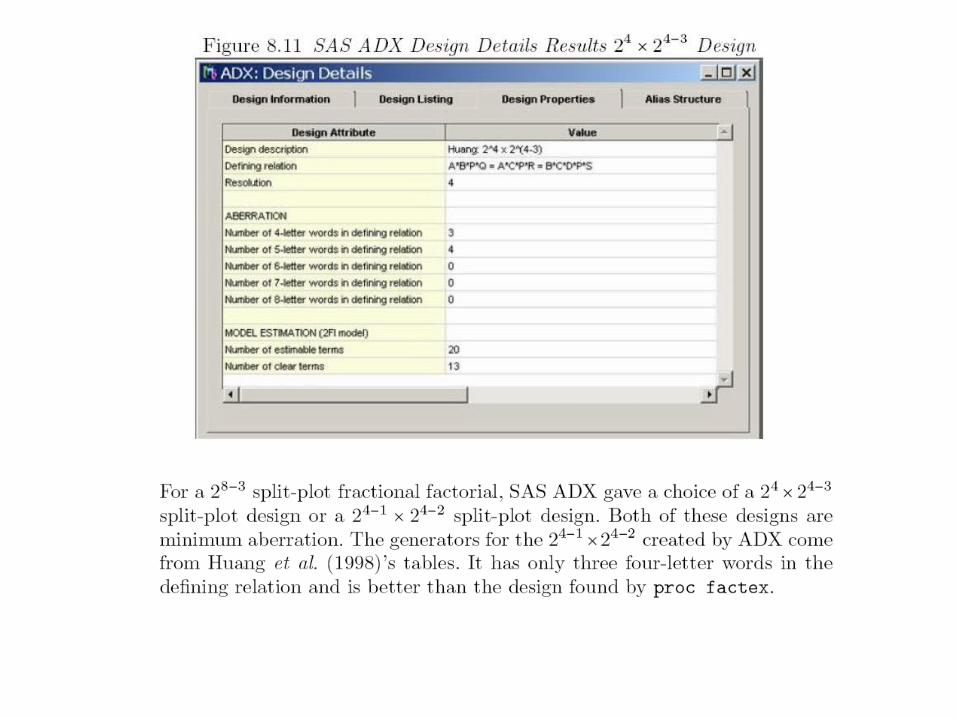
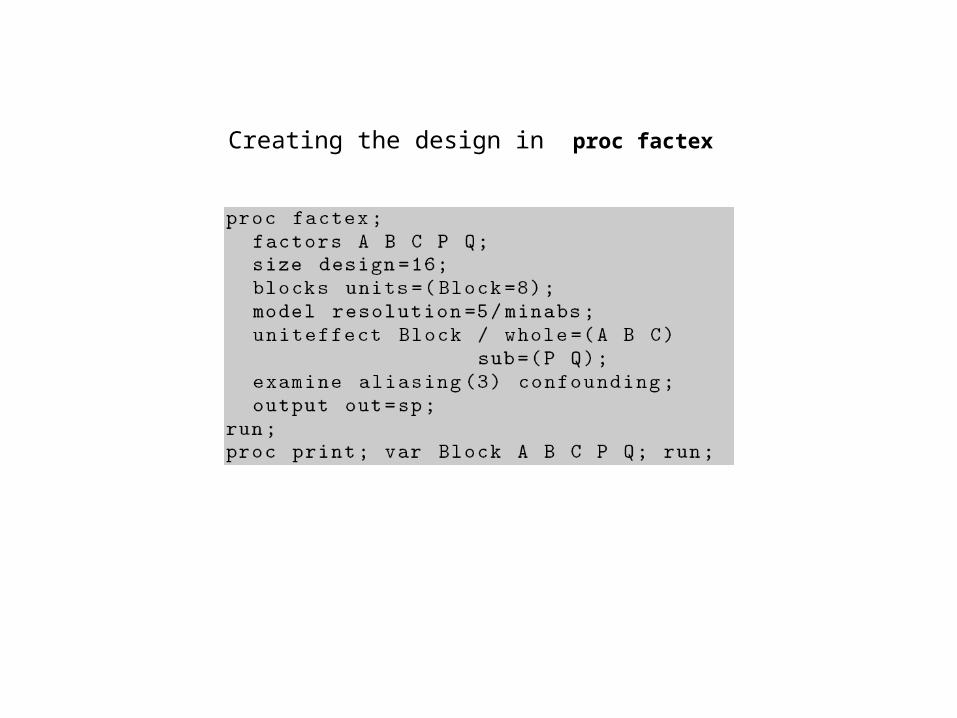
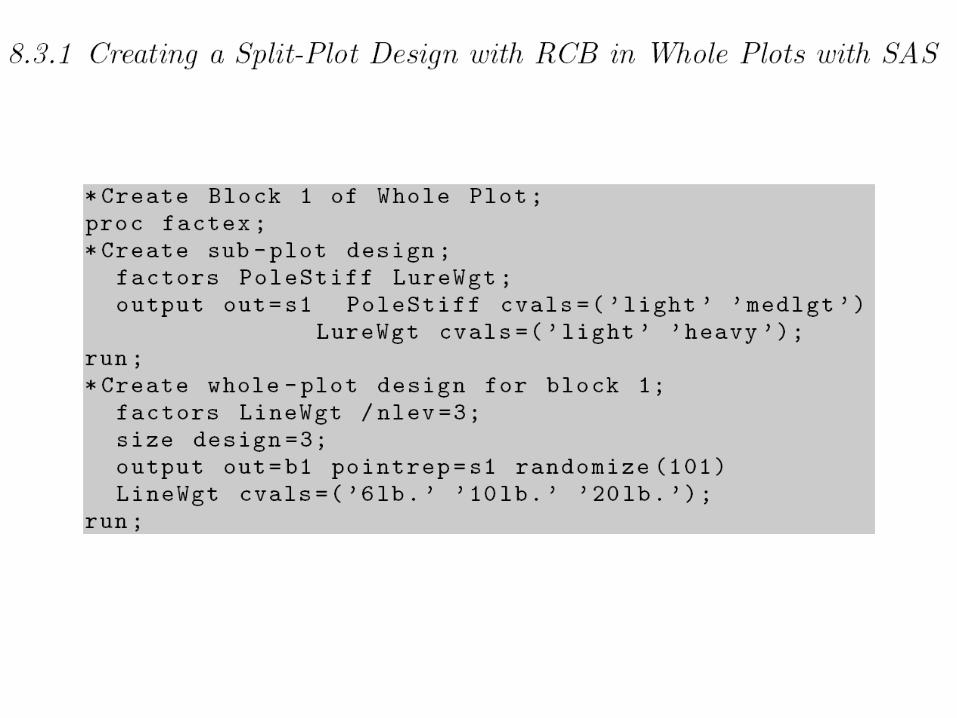
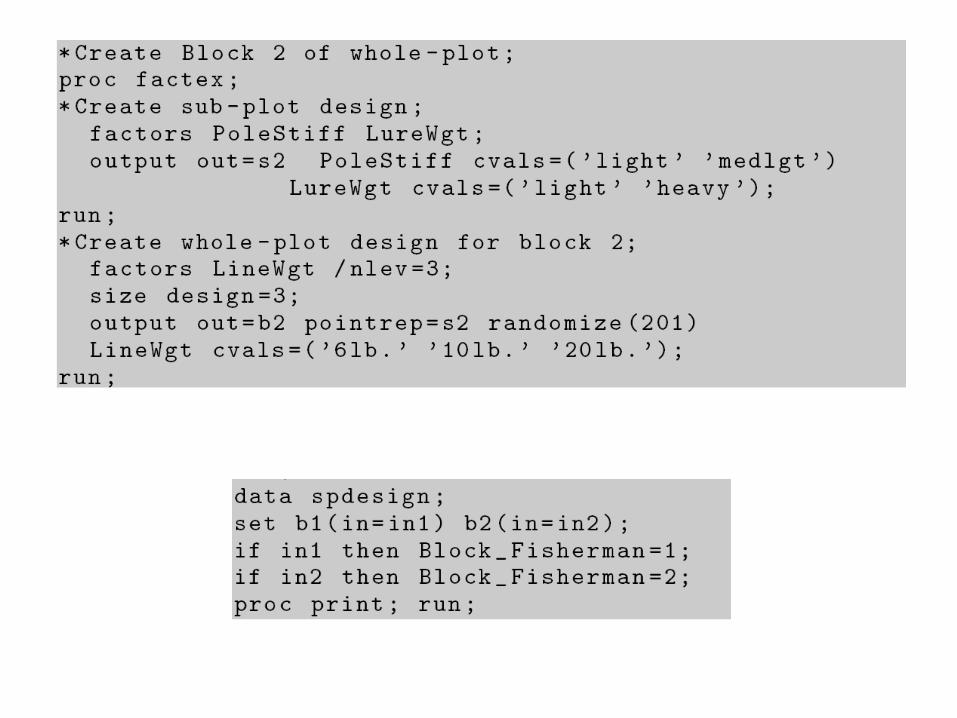
Creating the design in proc factex