Embed Size (px)
Citation preview

ARTICLE
Received 12 Dec 2016 | Accepted 5 Apr 2017 | Published 25 May 2017
Splicing modulators act at the branch pointadenosine binding pocket defined by thePHF5A–SF3b complexTeng Teng1,*, Jennifer HC Tsai1,*, Xiaoling Puyang1, Michael Seiler1, Shouyong Peng1, Sudeep Prajapati1,
Daniel Aird1, Silvia Buonamici1, Benjamin Caleb1, Betty Chan1, Laura Corson1, Jacob Feala1, Peter Fekkes1,
Baudouin Gerard1, Craig Karr1, Manav Korpal1, Xiang Liu1, Jason T. Lowe1, Yoshiharu Mizui1, James Palacino1,
Eunice Park1, Peter G. Smith1, Vanitha Subramanian1, Zhenhua Jeremy Wu1, Jian Zou1, Lihua Yu1, Agustin Chicas1,
Markus Warmuth1, Nicholas Larsen1 & Ping Zhu1
Pladienolide, herboxidiene and spliceostatin have been identified as splicing modulators that
target SF3B1 in the SF3b subcomplex. Here we report that PHF5A, another component of this
subcomplex, is also targeted by these compounds. Mutations in PHF5A-Y36, SF3B1-K1071,
SF3B1-R1074 and SF3B1-V1078 confer resistance to these modulators, suggesting a common
interaction site. RNA-seq analysis reveals that PHF5A-Y36C has minimal effect on basal
splicing but inhibits the global action of splicing modulators. Moreover, PHF5A-Y36C alters
splicing modulator-induced intron-retention/exon-skipping profile, which correlates with the
differential GC content between adjacent introns and exons. We determine the crystal
structure of human PHF5A demonstrating that Y36 is located on a highly conserved surface.
Analysis of the cryo-EM spliceosome Bact complex shows that the resistance mutations
cluster in a pocket surrounding the branch point adenosine, suggesting a competitive mode of
action. Collectively, we propose that PHF5A–SF3B1 forms a central node for binding to these
splicing modulators.
DOI: 10.1038/ncomms15522 OPEN
1 H3 Biomedicine Inc., 300 Technology Sq, 5th Floor, Cambridge, Massachusetts 02139, USA. * These authors contributed equally to this work. Correspondenceand requests for materials should be addressed to N.L. (email: [email protected]) or to P.Z. (email: [email protected]).
NATURE COMMUNICATIONS | 8:15522 | DOI: 10.1038/ncomms15522 | www.nature.com/naturecommunications 1

RNA splicing is catalysed by the spliceosome, a dynamicmultiprotein–RNA complex composed of five smallnuclear RNAs (snRNAs U1, U2, U4, U5 and U6) and
associated proteins. The spliceosome assembles on pre-mRNAs toestablish a dynamic cascade of multiple RNA and proteininteractions that catalyse excision of the introns and ligationof exons1. Accumulating evidence has linked human diseasesto dysregulation in RNA splicing, e.g., mutations in splicingregulatory sequences that disrupt the splicing of specificgenes or functional alterations of spliceosomal components thatimpact the splicing of many genes2. Recent studies have revealedthat splicing factors such as SF3B1, U2AF1 and SRSF2 arefrequently mutated in multiple haematological malignanciesincluding chronic lymphocytic leukaemia and myelodysplasticsyndromes3. Therefore, much effort has been devoted to develo-ping splicing-modulating small-molecules or oligonucleotides astherapeutic approaches to treating these diseases. Some ofthese have been or are being tested in clinical trials for cancerand severe neuromuscular diseases4–7.
A number of small-molecule compounds have been identifiedto possess selective activities in modulating or inhibiting splicing;however, the direct targets and/or exact mechanism of actionare still ambiguous. Using biotinylated chemical probes andphoto-crosslinking, the SF3b complex was identified as a bindingtarget for spliceostatin A8, pladienolide B9 and herboxidiene10
(Supplementary Fig. 1). The SF3b complex is part of the U2snRNA–protein complex (snRNP) assembled by U2 snRNA,splicing factors SF3a and SF3b, and other associated proteins.Together, these form the 17S U2 snRNP that assembles in anATP-dependent fashion at the 30 side of the intron to form the Acomplex3. The SF3b core complex contains several spliceosome-associated proteins (SAPs), including SF3B1/SAP155, SF3B2/SAP145, SF3B3/SAP130, SF3B4/SAP49, SF3B5/SAP10, SF3B6/SAP14a and PHF5A/SAP14b. These proteins are thought to bindto the branch point region. The most characterized target ofsmall-molecule splicing modulators is SF3B1, which has beenco-immunoprecipitated by biotinylated spliceostatin A8 andcrosslinked to herboxidiene analogue10.
In addition to probing the physical interaction, phenotypic-resistant clone profiling has been utilized as a powerful method touncover the cellular targets for small-molecule inhibitors, basedon the hypothesis that under selection pressure, resistantmutation(s) in the target(s) or relevant pathway(s) are likely tooffer the most survival advantage. This approach can also be usedprospectively to predict resistance mutations that may emerge ina clinical setting11 and typically involves either stepwise inductionof compound dosage or multiple rounds of enrichment to selectfor the most resistant clones12–14. Indeed, such an approach ledto the discovery of a single amino acid substitution (R1074H)in SF3B1, which almost completely abolished the splicing-modulating and antiproliferative effects of pladienolide B andE7107 (ref. 12). This established that SF3B1 is likely a directbinding partner for pladienolides. However, the precisecompound binding site and the role of other components ofthe SF3b complex remain unclear.
Here, by integrating structural and biochemical approacheswith a modified chemogenomic strategy utilizing structurallydifferent splicing modulators at permissive dosage for resistantmutation(s) mapping, we report that PHF5A, a core componentof the SF3b complex, is a common cellular target ofsplicing-modulating chemical probes, including herboxidiene,pladienolide, spliceostatin and sudemycin. We also showthat PHF5A-Y36, SF3B1-V1078 and SF3B1-K1071, in additionto previously reported SF3B1-R1074 (ref. 12), are key residues forsmall-molecule splicing modulators to bind to the SF3b complex.These mutations confer resistance to splicing modulation and cell
growth inhibition induced by these compounds. Mechanisticinvestigation on PHF5A-Y36C reveals a dynamic splicingmodulation (exon skipping (ES)–intron retention (IR) switch)by small-molecule splicing modulators, which reflects thedifferential sensitivity of individual introns to splicingmodulator activities. Analysis of our crystal structure of humanPHF5A and the yeast cryo-EM structure of the spliceosome Bact
complex15 place these mutations at the interface of PHF5A andSF3B1 in the branchpoint adenosine (BPA) binding site.Biochemical analysis with reconstituted splicing modulator-binding protein complex and mutagenesis data of the Y36residue further confirm the mechanism of the resistancemutation. Taken together, we propose PHF5A–SF3B1 forma binding site for these small-molecule splicing modulators,offering approaches to modulate specific splicing events.
ResultsSplicing modulator-resistant mutations in PHF5A and SF3B1.A group of splicing modulators were first discovered as naturalproducts that are cytotoxic to cancer cells and later shown totarget the SF3b complex8–10. To further investigate theirmechanism of action, we explored the possibility of resistantclone generation with lower stress levels of compoundvia continuous administration of either lower dosage of E7107(4 nM, B3� GI50), a pladienolide derivative, or a less potent,structurally different splicing modulator, herboxidiene at 20 nM(B3� GI50) in HCT116 cells (Fig. 1a), whereas previousapproaches used stepwise induction of pladienolide B or E7107doses up to 100 nM (B130� GI50 in WiDR cells) to isolateresistant clones12. This less stringent approach could potentiallymitigate off-target activity at high concentrations, as well asenhance the possibility to identify subtle but commonmechanisms of splicing modulators. After 2 weeks of selection,six resistant clones from each treatment were expanded andsubjected to whole-exome sequencing (WXS) to identifycandidate causal genes for resistance to splicing modulators.Compared to the parental line, totally about 11,000 single-nucleotide variants and indels were identified with greater than20% allele frequency (Supplementary Data 1). However, aftercross-referencing with our curated splicing related gene list(Supplementary Data 2) and focusing on genes affected in at leastthree individual clones, mutations in only two genes wereconsistently scored. Five out of six E7107-resistant clones and twoof the six herboxidiene-resistant clones carried mutations inSF3B1 (Fig. 1b), including the previously identified R1074Hmutation and two previously unidentified mutations, V1078Aand V1078I, strengthening the evidence that this region of SF3B1is critical for splicing modulator action. Interestingly, theremaining E7107-resistant clone and four herboxidiene-resistantclones carried a Y36C mutation in PHF5A, an essentialcomponent of the SF3b complex (Fig. 1b). All identifiedmutations in PHF5A and SF3B1 were further confirmed bytargeted Sanger sequencing (Supplementary Fig. 2). In addition,Sanger sequencing revealed that one independent clone from20 nM herboxidiene treatment appeared to be a pool of twoindividual populations, which harboured both PHF5A-Y36C anda K1071E mutation in SF3B1 (Supplementary Fig. 2). While theapparent bias in mutation occurrences in either SF3B1 or PHF5Ain the resistant clones (Fig. 1b) may implicate differences in howthe pladienolide and herboxidiene scaffolds interact with the SF3bcomplex, these data strongly suggest that both proteins arecommon cellular targets for splicing modulators.
Growth inhibition profiling of the different resistant clonesrevealed that the SF3B1-R1074H mutation conferred themost robust resistance to E7107 whereas the PHF5A-Y36C and
ARTICLE NATURE COMMUNICATIONS | DOI: 10.1038/ncomms15522
2 NATURE COMMUNICATIONS | 8:15522 | DOI: 10.1038/ncomms15522 | www.nature.com/naturecommunications

SF3B1-V1078 mutations were weaker (Fig. 1c). Interestingly, theSF3B1-R1074H mutation also conferred better resistance tospliceostatin A and sudemycin D6, both chemically related toFR901464, which is structurally different from pladienolides(Fig. 1d,e). In contrast, the PHF5A-Y36C mutation renderedmore resistance in response to herboxidiene treatment (Fig. 1f), inline with the higher percentage of clones harbouring thismutation after herboxidiene selection (Fig. 1b). Mutations inSF3B1 or PHF5A did not affect the cell lines’ sensitivity tobortezomib, a pan-cytotoxic proteasome inhibitor, highlightingthe specificity of the mutations toward splicing modulators(Fig. 1g). To validate the apparent preference for differentscaffolds, we expanded growth inhibition profiling to additionalcompounds and directly compared the GI50 shift in the SF3B1R1074H clone over the parental line versus the GI50 shift in the
PHF5A Y36C clone. It is evident that both resistant mutationsconferred resistance to all examined splicing modulators. Moreimportantly, compounds appeared to cluster based on theirscaffold, with PHF5A Y36C showing better resistance to theherboxidiene analogues and SF3B1 R1074H showing betterresistance to the pladienolide and spliceostatin analogues(Supplementary Fig. 3).
PHF5A-Y36C confers resistance to splicing modulators. Tofurther validate PHF5A-Y36C as a mechanism underlyingresistance to splicing modulation, we expressed either wild-type(WT) PHF5A or Y36C PHF5A at similar levels in the parentalHCT116 cell line (Fig. 2a). Despite the sequence conservation ofthis tyrosine residue through evolution16, expression of either
Filter for splicing related gene(s
b
a
Mutations in splicing related genesoccurring in at least 3 clones
c
1
3
4
6
7
8
1
2
3
5
6
8
Bortezomib (nM)
1 100
0
50
100
1 100
0
50
100
1 100
0
50
100
O OH
OO
OMe
OH
Continuous treatment ofHCT116 cells with 4 nM
E7107 for 2 weeks
Continuous treatment ofHCT116 cells with 20 nMHerboxidiene for 2 weeks
Established 6 individual clonesfrom each treament
(1) Validate resistance to splicingmodulators
(2) Whole-exome sequencing to identifycausal resistance mutation(s)
WXS pipeline to identify novel missensemutation(s) not preseneting in parental
line with >20% allele frequency1 100
0
50
100
1 100
0
50
100
Sudemycin D6 (nM)
d
f
g
O
O
OH
O
O
N
OOH
OH
NOH
ParentalPHF5A Y36C carrying cloneSF3B1 R1074H carrying cloneSF3B1 V1078I carrying cloneSF3B1 V1078A carrying clone
% G
row
th (
CT
G)
E7107 (nM)10,000
% G
row
th (
CT
G)
Spliceostatin A (nM)10,000
% G
row
th (
CT
G)
10,000
% G
row
th (
CT
G)
Herboxidiene (nM)
10,000
% G
row
th (
CT
G)
10,000
e
Recurrent mutationsin 4 nM E7107 resistant clones
Clone# Gene
SF3B1
PHF5A
SF3B1
SF3B1
SF3B1
SF3B1 g3232a
t3233c
g3232a
g3221a
a107g
t3233c
Codingchange
Allelefrequency
AAchange
42.9%
47.0%
33.3%
48.1%
40.0%
46.9% V1078I
V1078A
V1078I
R1074H
Y36C
V1078A
Recurrent mutationsin 20 nM herboxidiene resistant clones
Clone# Gene
PHF5A
PHF5A
PHF5A
PHF5A
SF3B1
SF3B1
Codingchange
a107g
a107g
a107g
a107g
g3221a
t3233c
Allelefrequency
55.6%
56.6%
52.2%
36.8%
41.4%
60.0%
AAchange
Y36C
Y36C
Y36C
Y36C
R1074H
V1078A
Figure 1 | Recurrent splicing modulator-resistant mutations in PHF5A and SF3B1 identified by a chemogenomic approach. (a) Experimental scheme of
E7107 and herboxidiene-resistant clone generation and whole-exome sequencing (WXS) analysis. (b) Recurrent mutations in E7107 and herboxidiene-
resistant clones. (c–g) Seventy-two hours growth inhibition profiling (CellTiter-Glo cellular viability assay) of representative resistant clones’ response to
indicated compounds. Error bar indicates s.d. For E7107, herboxidiene and bortezomib, n¼4; for spliceostatin A and sudemycin D6, n¼ 2.
NATURE COMMUNICATIONS | DOI: 10.1038/ncomms15522 ARTICLE
NATURE COMMUNICATIONS | 8:15522 | DOI: 10.1038/ncomms15522 | www.nature.com/naturecommunications 3

PHF5A-WT or Y36C has no apparent effect on cell growth(Fig. 2b), localization of SF3B1 protein or formation of nuclearspeckles (Supplementary Fig. 4). Given that PHF5A is one ofseven proteins in the SF3b complex, we then examined if themutation could disrupt interactions with any of the corecomponents and alter the overall composition of the complex.Immunoprecipitated (IP’ed) samples by anti-SF3B1 antibodiesfrom WT and mutant cell lines were subjected to westernblot and mass-spectrometry analysis to qualitatively assess theircomposition (Fig. 2c and Supplementary Fig. 5). We did notobserve any significant differences in the overall composition ofthe complexes containing WT or Y36C PHF5A, suggesting thataside from this mutation they are otherwise intact and functional.Whole-transcriptome RNA-seq analysis confirmed that expre-ssion of PHF5A-Y36C accounted for B92% of the total PHF5AmRNA (Supplementary Fig. 6a) in the engineered cell line but
had minimal effects on global splicing or gene expression whencompared to WT (Supplementary Figs 6b and 8). Importantly,whereas parental cells and cells expressing WT PHF5A weresensitive to splicing modulator treatment, expression of PHF5A-Y36C conferred resistance to a panel of splicing modulators(Fig. 2d), phenocopying the spontaneous PHF5A Y36C resistantclones (Fig. 1c–f). This resistance phenotype appears to be generalas it was also observed when PHF5A-Y36C was introduced toanother cell line (Panc0504, Supplementary Fig. 7).
We next examined the behaviour of the PHF5A-Y36Cmutation at the biochemical level. Consistent with the cellulardata (Fig. 2d), in vitro splicing assays with an exogenouspre-mRNA substrate showed that the Y36C mutant protectedagainst the inhibition by splicing modulators of different scaffolds(Fig. 3a). To validate whether similar levels of protection are alsopresent in vivo, we used quantitative real-time PCR analysis to
% G
row
th (
CT
G)
% G
row
th (
CT
G)
% G
row
th (
CT
G)
ParentalPHF5A WTPHF5A Y36C
SF3B1
WT Y36C
SF3B3
SF3B4
SF3B6/p14
PHF5A
1 100 10,000
0
50
100
1 100 10,000
0
50
100
1 100 10,000
0
50
100
1 100 10,000
0
50
100
% G
row
th (
CT
G)
PHF5A
GAPDH
PHF5A cDNA:
Anti-SF3B1 IP
PHF5A cDNA:
WB
0 50 100 1500
50
100
Hours
ParentalPHF5A WTPHF5A Y36C
Empt
y vec
tor
Y36C
WT
Spliceostatin A (nM)
E7107 (nM)
Herboxidiene (nM)
Sudemycin D6 (nM)
% c
onflu
ency
a
b
c
d
Figure 2 | PHF5A-Y36C does not affect basal cellular functions but confers resistance to splicing modulators. (a) Western blot analysis of PHF5A levels
in parental, PHF5A WT-expressing and PHF5A Y36C-expressing HCT116 cells. GAPDH is shown as a loading control. (b) Proliferation of parental,
WT PHF5A-expressing or Y36C PHF5A-expressing HCT116 cells as measured by the Incucyte imaging system. X axis indicates hours post seeding,
and y axis indicates percent of confluency. Error bar indicates s.d., n¼ 5. (c) Western blot analysis of indicated SF3b complex protein levels following
anti-SF3B1 pull-down from nuclear extracts containing WTor Y36C PHF5A. (d) Seventy-two hours growth inhibition profiling (CellTiter-Glo cellular viability
assay) of parental, PHF5A WT-expressing and PHF5A Y36C-expressing HCT116 cells in response to indicated splicing modulators. Error bar indicates
s.d., n¼ 2.
ARTICLE NATURE COMMUNICATIONS | DOI: 10.1038/ncomms15522
4 NATURE COMMUNICATIONS | 8:15522 | DOI: 10.1038/ncomms15522 | www.nature.com/naturecommunications

assay the splicing of two endogenous pharmacodynamic markergenes that were used previously in the phase I clinical trial ofE7107 (ref. 5) (Fig. 3b). In agreement with the effect observed inin vitro splicing assays, Y36C mutation also reduced theinhibition on the production of spliced, mature SLC25A19mRNAs and the accumulation of unspliced, immature EIF4A1pre-mRNA elicited by splicing modulators (Fig. 3b).
PHF5A-Y36C alters E7107 induced aberrant splicing. Toexamine how global splicing is affected by splicing modulators,we applied whole-transcriptome RNA-seq analysis in bothWT- and Y36C PHF5A-expressing cells treated with 100 nME7107. Unsupervised clustering based on gene expressionand principal component analysis of splicing junction usageconfirmed that the Y36C cells treated with E7107 clustered awayfrom their WT counterpart but near the DMSO-treated controls,suggesting that the Y36C mutation weakened E7107 activity asexpected (Supplementary Fig. 8). Detailed differential splicinganalysis further unveiled the quantitative and qualitative effectsimposed by the Y36C mutation (Fig. 4a,b and SupplementaryData 3). Specifically, compared to the respective DMSO-treatedcontrols, IR events were predominant in WT cells treated withE7107 as measured by both the number of events and averagefold change (Fig. 4a,b, left bar). Consistent with the protectiveeffect of Y36C, the overall amount of IR events and their averagefold change were greatly reduced in the mutant cells treatedwith E7107 (Fig. 4a,b, right bar). Surprisingly, the number ofcompound-induced ES events was increased in the mutant cellscompared to WT upon E7107 treatment (Fig. 4a,b), suggestingthat PHF5A-Y36C-mediated resistance to splicing modulationinvolves a differential response at the global level.
The regulation of IR and ES events is known to be associatedwith exon/intron length and nucleotide content, as well aswith specific chromatin marks17. Particularly, a differential in
GC content between neighbouring introns and exons may haveevolved as recognition signals for the splicing machinery18.Therefore, we sought to examine whether intronic GC contentmight also affect splice site recognition in PHF5A-WT or Y36Ccells under splicing modulation (Fig. 4c,d). In WT cells,E7107-induced IR introns harbour higher GC content and lessdifferential with the downstream exons as compared to therandomly selected background introns (Fig. 4c). Interestingly,IR introns/exons in PHF5A Y36C cells treated with E7107displayed much higher GC composition and minimal differentialbetween affected introns and exons as compared to its WTcounterpart (Fig. 4c). In contrast, whereas ES junctions incompound treated WT cells showed lower GC composition thanthe background, ES junctions in Y36C cells treated with E7107presented with higher GC content (Fig. 4d). In aggregate, thesedata suggest that intron/exon GC content may contribute toY36C-mediated interference of splicing modulation.
Intriguingly, the intron/exon GC contents of IR events in WTcells (Fig. 4c, blue curve) are comparable to those of ES events inY36C cells (Fig. 4d, red curve). In addition, E7107 treatmentinduced more ES events but fewer IR events in PHF5A-Y36C cells(Fig. 4a,b). Thus, we hypothesized that some of these ES-relatedintrons from the Y36C cells might be switched to IR in the WTcells under the same E7107 treatment. To this end, we calculatedthe percentage (percent spliced in, PSI) of the individual 30 intron–exon junction usage for these ES events in both PHF5A WT andY36C cells. Theoretically, the outcome of these 30 junctions wouldbe either ES, IR or exon inclusion (for scheme of the calculation, seeFig. 4e and Methods). Consistent with our ES/IR switch hypothesis,2,470 out of these 3,883 Y36C-related ES junctions (B64%)showed reduced ES PSI and increase IR PSI in the WT cells treatedwith E7107 (Fig. 4e and Supplementary Data 4). This providedfurther evidence at the global level that PHF5A Y36C could weakenthe activity of splicing inhibitors by modulating the usages of
% s
plic
ing
rela
tive
to D
MS
O%
spl
icin
gre
lativ
e to
DM
SO
% s
plic
ing
rela
tive
to D
MS
O0.01 1 100 10,000
0
50
100
150 PHF5A WTPHF5A Y36C
0
50
100
150
0
50
100
150
E7107
0.01 1 100 10,000
Herboxidiene
0.01 1 100 10,000
Sudemycin D6
Concentration (nM)
E7107 (nM) Herboxidiene (nM)
EIF4A1 pre-mRNA
SLC25A19 mature mRNASLC25A19 mature mRNA
EIF4A1 pre-mRNA
PHF5A WT
PHF5A Y36C
0.01 1 100 10,000
1
10
0.01 1 100 10,000
1
10
0.01 1 100 10,0000.01
0.1
1
0.01 1 100 10,0000.01
0.1
1
E7107 (nM) Herboxidiene (nM)
Fol
d ch
ange
Rel
ativ
e to
DM
SO
Fol
d ch
ange
rela
tive
to D
MS
O
a b
Figure 3 | PHF5A-Y36C protects against splicing modulator induced mis-splicing. (a) In vitro splicing assay in the presence of indicated splicing
modulators in nuclear extracts containing WT or Y36C PHF5A. Error bar indicates s.d., n¼4. (b) Taqman gene expression analysis of mature
SLC25A19 mRNA levels and EIF4A1 pre-mRNA levels in either WT- or Y36C PHF5A-expressing cells treated with indicated splicing modulators.
All data points were normalized to the corresponding DMSO-treated control samples and displayed in logarithmic scale on the y axis. Error bar
indicates s.d., n¼ 2.
NATURE COMMUNICATIONS | DOI: 10.1038/ncomms15522 ARTICLE
NATURE COMMUNICATIONS | 8:15522 | DOI: 10.1038/ncomms15522 | www.nature.com/naturecommunications 5
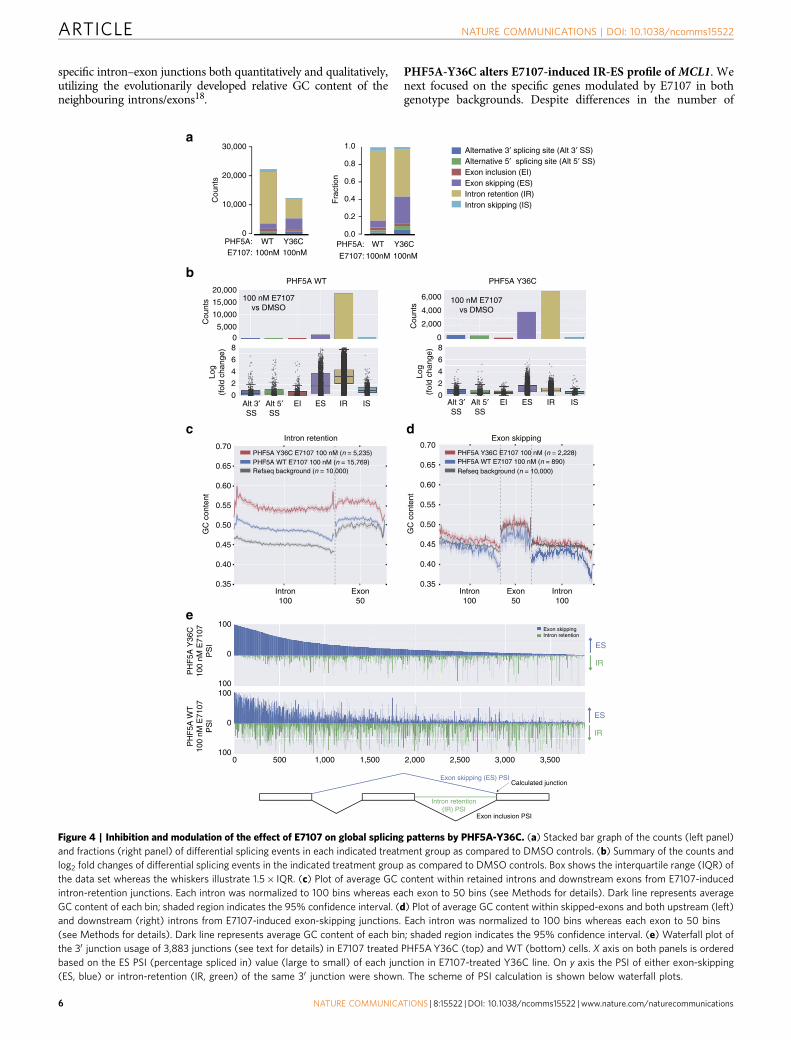
specific intron–exon junctions both quantitatively and qualitatively,utilizing the evolutionarily developed relative GC content of theneighbouring introns/exons18.
PHF5A-Y36C alters E7107-induced IR-ES profile of MCL1. Wenext focused on the specific genes modulated by E7107 in bothgenotype backgrounds. Despite differences in the number of
Intron100
Exon50
0.35
0.40
0.45
0.50
0.55
0.60
0.65
0.70
GC
con
tent
PHF5A Y36C E7107 100 nM (n = 5,235)PHF5A WT E7107 100 nM (n = 15,769)Refseq background (n = 10,000)
Intron100
Exon50
Intron100
Exon skippingIntron retention
0.35
0.40
0.45
0.50
0.55
0.60
0.65
0.70
GC
con
tent
PHF5A Y36C E7107 100 nM (n = 2,228)PHF5A WT E7107 100 nM (n = 890)Refseq background (n = 10,000)
Intron retention(IR) PSI
Exon skipping (ES) PSI
Exon inclusion PSI
ES
IR
ES
IR
PHF5A WT PHF5A Y36C
100 nM E7107vs DMSO
100 nM E7107vs DMSO
Alternative 3′ splicing site (Alt 3′ SS)
Exon inclusion (EI)Alternative 5′ splicing site (Alt 5′ SS)
Exon skipping (ES)Intron retention (IR)Intron skipping (IS)
Cou
nts
0
10,000
20,000
30,000
Fra
ctio
n
0.0
0.2
0.4
0.6
0.8
1.0
PHF5A: PHF5A:E7107: 100nM E7107:
0
0
100
1001,000 1,500 2,000 2,500 3,000 3,500
PH
F5A
Y36
C10
0 nM
E71
07P
SI
Calculated junction
PH
F5A
WT
100
nM E
7107
PS
I
0
100
100
500
Intron retention Exon skipping
8
6
4
2
0
Log
(fol
d ch
ange
)
Cou
nts
20,000
15,000
10,000
5,0000
8
6
4
2
0
Log
(fol
d ch
ange
)
Cou
nts
6,000
4,000
2,000
0
Alt 3′SS
Alt 5′SS
EI ES IR IS Alt 3′SS
Alt 5′SS
EI ES IR IS
Y36CWT100nM 100nM
Y36CWT
100nM
a
b
c d
e
Figure 4 | Inhibition and modulation of the effect of E7107 on global splicing patterns by PHF5A-Y36C. (a) Stacked bar graph of the counts (left panel)
and fractions (right panel) of differential splicing events in each indicated treatment group as compared to DMSO controls. (b) Summary of the counts and
log2 fold changes of differential splicing events in the indicated treatment group as compared to DMSO controls. Box shows the interquartile range (IQR) of
the data set whereas the whiskers illustrate 1.5� IQR. (c) Plot of average GC content within retained introns and downstream exons from E7107-induced
intron-retention junctions. Each intron was normalized to 100 bins whereas each exon to 50 bins (see Methods for details). Dark line represents average
GC content of each bin; shaded region indicates the 95% confidence interval. (d) Plot of average GC content within skipped-exons and both upstream (left)
and downstream (right) introns from E7107-induced exon-skipping junctions. Each intron was normalized to 100 bins whereas each exon to 50 bins
(see Methods for details). Dark line represents average GC content of each bin; shaded region indicates the 95% confidence interval. (e) Waterfall plot of
the 30 junction usage of 3,883 junctions (see text for details) in E7107 treated PHF5A Y36C (top) and WT (bottom) cells. X axis on both panels is ordered
based on the ES PSI (percentage spliced in) value (large to small) of each junction in E7107-treated Y36C line. On y axis the PSI of either exon-skipping
(ES, blue) or intron-retention (IR, green) of the same 30 junction were shown. The scheme of PSI calculation is shown below waterfall plots.
ARTICLE NATURE COMMUNICATIONS | DOI: 10.1038/ncomms15522
6 NATURE COMMUNICATIONS | 8:15522 | DOI: 10.1038/ncomms15522 | www.nature.com/naturecommunications

splicing events elicited by E7107, the overall numbers of affectedgenes from WT or Y36 cells were comparable and shared a largeoverlap (Supplementary Fig. 9a and Supplementary Data 5).Gene Set Enrichment Analysis also identified candidate geneslinked to essential pathways in either WT- or Y36C-specific genes(Supplementary Fig. 9b,c and Supplementary Data 5). To validateour global differential splicing analyses that revealed an IR/ESswitch by splicing modulators in PHF5A-Y36C cells, we focusedon genes that were associated with significant IR events in WTcells treated with E7107 as compared to DMSO controls, but werelinked to significant ES events in Y36C under compound treat-ment (Supplementary Data 6). A large number of pivotal genessuch as MCL1, CDC25B, RBM5 and CDK10 were among thegroup, and individual Sashimi plots validated the differential insplicing behaviour between WT and Y36C cells treated with
E7107 (Fig. 5a and Supplementary Fig. 10). MCL1 exists as twoisoforms, MCL1-L and MCL1-S, and was previously reported asa major target for splicing modulators such as meayamycin B19,20
and sudemycin D1 (ref. 21). Interestingly, the second intron ofMCL1 harbours a low (38%) GC content compared to theGC-rich (51%) upstream intron. Sashimi plots of the MCL1RNA-seq data confirmed that in DMSO-treated control samples,both ES and IR events occurred at very low levels in WT andY36C cells, resulting in dominant production of the canonicalMCL1-L form (Fig. 5a). Upon E7107 treatment, IR was the domi-nant event observed in WT cells. In contrast, upon PHF5A Y36Cexpression, the effect of E7107 was largely altered, and mainly ESevents were observed yielding the MCL1-S form (Fig. 5a).
Next, we utilized MCL1 as a biomarker to expand our analysisof the ES/IR switch to additional splicing modulators of different
150,548,630 150,550,521
267
373
166
781
13
678
101
16
2
757
11
731
1
1
0.001
0.01
0.1
1
10
100
0.001
0.01
0.1
1
10
100
PHF5A WT PHF5A Y36C
Concentration (nM) Concentration (nM)
E7107
Herboxidiene Herboxidiene
Sudemycin D6 Sudemycin D6
fold
cha
nge
rela
tive
to D
MS
OF
old
chan
ge r
elat
ive
to D
MS
OF
old
chan
ge r
elat
ive
to D
MS
O
MCL1-L
MCL1-S (ES)
Fol
d ch
ange
rela
tive
to D
MS
O
Spliceostatin A Spliceostatin A
PHF5A WT 10 μM E7107
PHF5A Y36C DMSO
PHF5A Y36C 10 μM E7107
PHF5A WT DMSO
MCL1-L
MCL1-SIntron 238% GC
Intron 151% GC
0.01
0.1
1
10
100
0.01
0.1
1
10
100
E7107
[0 – 960]
[0 – 1,052]
[0 – 1,137]
[0 – 1,065]
0.001
0.001
0.001
0.01
0.1
1
10
100
0.001
0.01
0.1
1
10
100
0.01
0.1
1
10
100
0.01
0.1
1
10
100
0.001
0.001
0.01 1 100 10,000 0.01 1 100 10,000
0.01 1 100 10,000 0.01 1 100 10,000
0.01 1 100 10,000 0.01 1 100 10,000
0.01 1 100 10,000 0.01 1 100 10,000
MCL1-intron 1 (IR)
MCL1-intron 2 (IR)
MCL1-pan
a
b
Figure 5 | PHF5A-Y36C alters the effects of splicing modulators on MCL1 splicing. (a) Representative Sashimi plot of the production of different MCL1
isoforms under indicated treatment from either WT or Y36C PHF5A overexpressing cells. Total reads for each track are shown in the left. (b) Taqman gene
expression analysis of indicated MCL1 isoforms in either WT (left panel) or Y36C (right panel) PHF5A expressing cells treated with splicing modulators.
Error bar indicates s.d., n¼ 2.
NATURE COMMUNICATIONS | DOI: 10.1038/ncomms15522 ARTICLE
NATURE COMMUNICATIONS | 8:15522 | DOI: 10.1038/ncomms15522 | www.nature.com/naturecommunications 7

scaffolds and multiple dosages. Taqman gene expression notonly confirmed the RNA-seq analysis but also revealeda correlation between the potency of splicing modulators andthe relative rates of induction for ES and IR events. Specifically, inPHF5A WT cells, the more potent spliceostatin A (GI50¼ 0.76nM in HCT116) led to similar kinetics for dose-dependentinduction of MCL1 ES and IR events, whereas the slightly lesspotent E7107 (GI50¼ 1.5 nM in HCT116) presented with ‘earlier’induction of MCL1 ES events than IR events at lower doses. Theweaker herboxidiene (GI50¼ 7.6 nM in HCT116) showed an evenmore pronounced effect, and finally the IR events were notobserved with the weakest compound tested, sudemycin D6(GI50¼ 149 nM in HCT116) (Fig. 5b, left panels). These datastrengthened the observation that the low GC containing intron2 of MCL1 was more resistant to splicing modulation than thehigher GC containing intron 1 in the same gene. Importantly,expression of the PHF5A Y36C mutation delayed or blocked theonset of the MCL1 IR events in the presence of these splicingmodulators (Fig. 5b, right panels). Interestingly, MCL1-Sproduction, representing ES events, was enhanced to a higherlevel in PHF5A-Y36C cells compared to WT upon increasingdosage of E7107 (Fig. 5b, second row). Taken together, these dataconfirmed the observation that PHF5A Y36C controlled theswitch between compound induced IR events and ES events.
Crystal structure of human PHF5A. Given that Y36C PHF5Ahas no effect on basal splicing but plays a critical role in hinderingand altering splicing modulators’ effect on RNA splicing,we sought to explain the role of PHF5A in the context of thethree-dimensional structure. We purified the WT protein anddetermined the crystal structure at 1.8 Å resolution (Table 1). Ourfinal model contains residues 2–93 out of 110 total. PHF5A formsa mushroom-like structure with a triangular-shaped cap and astem composed of antiparallel strands from the N and C termini(Fig. 6a and Supplementary Fig. 11d). The cap is formed bya left-handed, triangular, deep trefoil knot containing three zincions and five CXXC motifs, which are permuted between thezinc fingers (Supplementary Fig. 11b). PHF5A contains 13 Cysresidues and 12 of these coordinate 3 zinc ions in tetrahedral
geometry. The remaining cysteine was mutated to serine (C40S)to enhance soluble protein expression. Interestingly, PHF5Aincorporates three different types of zinc finger. Zinc-finger 1(ZnF1) folds into a gag knuckle and has C4 coordination from thefirst and fourth CXXC motifs. The first of these has a short helicalturn (Z1) while the fourth has a zinc knuckle22. Zinc-finger 2(ZnF2) is formed by the second and fifth CXXC motifs. The firstof these motifs is a zinc knuckle and the second comes fromhelix-a4 and therefore resembles the treble clef GATA-like zincfinger23. Zinc-finger 3 (ZnF3) is formed by the third CXXC motiffrom helix-Z2 and two individual cysteines from the loopsconnecting the first and the last beta strands of the mushroomstem. This third zinc finger resembles an interrupted classical bbafinger with a short helix16,23. Given the location of PHF5A-Y36on the surface near the second zinc finger, and the evidence that itdoes not alter any tested cellular activities, we would predictthat mutation to Cys would have minimal effect on the overallfold but rather act locally altering the surface topology (Fig. 7c).
While classified as a PHD finger, PHF5A has low sequencehomology with other PHD fingers and differs from the canonicalfold. A high level of sequence identity across diverse eukaryoticorganisms shows its unique trefoil knot topology is likely to beconserved (Fig. 6d and Supplementary Fig. 11a). At the sametime, PHF5A has very low sequence identity when compared toother sequences within the same organism, suggesting a uniquebiological role in the cell. However, proteins with low sequenceidentity can still share similar three-dimensional structures andhave similar function. To explore this possibility, we comparedour structure to all other available structures in the PDB andfound only one other protein with similar fold, Rds3, a PHF5Ahomolog from yeast24. The Rds3 structure was solved by NMR,containing 80 residues and unstructured coils at the N- andC- termini16. It also has three zinc fingers and the same trefoilknot fold (Z-scores 12.6 and RMSD 2.2 Å)24.
The full-length Rds3 protein was recently observed in thecryo-EM structure of the spliceosome Bact complex at a resolutionrange of 3.0–3.5 Å15. This structure shows that Rds3/PHF5Ais a central scaffolding protein, interacting with Hsh155/SF3B1,Rse1/SF3B3, Ysf3/SF3B5, U2 snRNA and the intron RNA(Fig. 6b). Here, the SF3B1 HEAT repeats (HR) form a right-handed superhelical spiral of one complete turn forming a centralellipsoid cavity of approximately 34� 39 Å (Fig. 6b). PHF5Anestles into this cavity forming extensive contacts along its sideswith HR 2–3, 6, 15 and 17–20 (Fig. 6b). Of 110 total residues inPHF5A, 28 are forming contacts with SF3B1 burying 19%(1,337 Å2) of surface area and a high degree of sequenceconservation between the two interfaces. The C-terminal HR-20helix and N-terminal helix of SF3B5 form a parallel helix–helixinteraction that completes the superhelical turn while formingadditional interactions with PHF5A (residues F6-L12) (Fig. 6b).SF3B3 sits along the top face of the SF3B1–PHF5A complexforming contacts with both, while the intronic RNA sits along thebottom face of the complex. Most of these interactions are to thephosphodiester backbone, as evidenced by complementaryelectropositive surface (Supplementary Fig. 11c).
Superimposing the yeast and human PHF5A structures revealsstructural differences at only two regions, which both forminteractions with the intron RNA (Supplementary Fig. 11d).The last helix (G93-R110) of the C-terminus, which is missingin the PHF5A crystal structure, contains conserved basic residueslocated between HR-2 from SF3B1 and the intron-U2RNA duplex. These basic residues form multiple contacts to theintron nucleotides (þ 1-CACAUU) (Supplementary Fig. 11d)downstream of BPA (position 0). A minor difference is at thehelix (Z2)–loop–helix (Z3) (from N50-R57) near ZnF3 whereit has lower sequence conservation and also adopts multiple
Table 1 | X-ray data collection and refinement statistics.
Peak (Zn edge) Native (PDB: 5SYB)
Data collectionSpace group P213 P213Cell dimension
a, b, c (Å) 82.1 82.1a, b, g (�) 90.0 90.0
Wavelength (Å) 1.2781 1.0000Resolution (Å) 33.53–2.04 (2.09–2.04) 58.06–1.80 (1.86–1.80)Rmeans (%) 10.4 (78.8) 14.8 (4100%)I/s(I) 34.8 (6.3) 15.2 (2.7)Completeness (%) 100 (98.3) 100 (100)Redundancy 38.9 (38.1) 10.0 (8.1)
RefinementResolution (Å) 33.53–2.04 (2.09–2.04) 58.06–1.80 (1.86–1.80)No. reflections 469,101 (33,425) 318,806 (23,506)Rwork/Rfree (%) 17/20No. of atoms
Protein 1,483Water 97Ion 6
B factorsProtein 33.9Water 38.3
RMS deviationsBond lengths (Å) 0.02Bond angles (�) 1.98
ARTICLE NATURE COMMUNICATIONS | DOI: 10.1038/ncomms15522
8 NATURE COMMUNICATIONS | 8:15522 | DOI: 10.1038/ncomms15522 | www.nature.com/naturecommunications

conformations in the Rds3 solution structure, suggesting this partof the molecule might be flexible. This region is making contact totwo nucleotides (þ 9-AU) from the intron and the flexibilitycould accommodate conformations of different intronic RNAs.
Structural analysis of resistant mutations in PHF5A–SF3B1.Recently, several cryo-EM structures have provided snapshotsof the pre-catalytic and catalytic steps in the splicing reaction.The SF3b complex was only observed in the pre-catalytic Bact
complex15. In the next step, rearrangements occur triggeringdissociation of the SF3b complex and formation of the Ccomplex, in which the phosphodiester bond has been madebetween the 20-OH of the BPA and the 30 phosphate of guanosineat the 50-splice site25–27. Strikingly, the yeast Bact complexcryo-EM structure shows that the interface between PHF5A andSF3B1 is where the BPA binds15 (Fig. 6e). These proteins from
the SF3b complex apparently shield the reactive group frompremature nucleophilic attack. Indeed, in this model, PHF5A-Y36forms direct contacts with the BPA, clearly implicating PHF5A inbranchpoint recognition. This specialized biological role mayexplain its high sequence conservation and lack of any otherapparent counterparts in the cell, which is consistent withprevious finding of its key roles in splicing regulation andsplicing modulator sensitivity in glioblastoma stem cells28.The HEAT repeats of SF3B1 that define this binding pocket(HR15-17) are also highly conserved (Fig. 6c and Suppleme-ntary Fig. 12). Interestingly, the resistance mutations identified inthis study, PHF5A-Y36C, SF3B1-K1071E, SF3B1-V1078A/I, andpreviously reported SF3B1-R1074H, all cluster around thispocket (Fig. 6e,f). Moreover, crosslinking data show that thesesplicing modulators interact directly with SF3B1 and SF3B3(refs 9,10), which sits immediately above this pocket (Fig. 6f).These striking coincidences provide strong evidence that this
NC
Zn 3
Zn 1
Zn 2
η1
α4 η5
η3
η2
Y36
9
14
15
16
17
18
19
20
10
1112
13
8
5
7
6
4
1
2
3
PHF5A
SF3B5 SF3B1
Intron
–3′
5′–
R1075R10741078
Y36
SF3B1
SF3B3PHF5ASF3B1 PHF5A
Y36
R1075
K10711078
Q1107
3.3
3.3
3.3
2.7
BPABPA
R1074
K1071
15 16
7 5
1,0701,050 1,060 1,080 1,090 1,100 1,110 1,120
Hsh155720
1 10 20 30 40 50 60
110100908070
730 740 0 760 770 780 790
SF3B1Hsh155
Rds3PHF5A
PHF5ARds3
a b
c
d
e f
Figure 6 | Crystal structure of human PHF5A. (a) Ribbon diagram of PHF5A (PDB:5SYB). Zinc atoms are shown as grey balls and form the vertices of a
near equilateral triangle. The secondary structural elements (a: helix, Z:310 helix, b: strand) forming the sides of the trefoil knot are coloured blue, yellow
and red arranged by their primary sequence. The N and C termini are labelled. Cysteine residues are shown as sticks as well as the critical Y36 residue.
(b) Model of PHF5A in the yeast Bact complex. Yeast PHF5A (magenta), SF3B5 (neon green) and SF3B1 (rainbow colours according to HEAT repeat HR-1 to
20) formed a complex that made contacts to the RNA duplex base-paired by U2 snRNA (orange ribbon) and the branch point sequence (BPS), and as
well as a single-stranded intron RNA at the downstream of BPS (grey ribbon and the atoms are coloured in cyan). (c) Sequence alignment of the HEAT
repeat 15 and 16 where this part of Hsh155 formed adenine-binding site with Rds3. (d) Sequence alignment of PHF5A with Rds3. The sequence identity
is 56%. (e) Potential configuration of human adenine-binding site showing interactions between PHF5A (light blue), SF3B1 (yellow) and intron RNA (cyan).
(f) Surface view of the potential modulator-binding site composed by SF3B1 (yellow), PHF5A (light blue) and SF3B3 (orange). Drug-resistant residues were
highlighted in magenta.
NATURE COMMUNICATIONS | DOI: 10.1038/ncomms15522 ARTICLE
NATURE COMMUNICATIONS | 8:15522 | DOI: 10.1038/ncomms15522 | www.nature.com/naturecommunications 9

Y36
C36
–100
–50
0
50
[Compound] (nM)
Sudemycin D6HerboxidieneE7107
10,0
001,
000
100101
0.1
100,
000
10 nM [3H-Plad] 1 nM [3H-Plad]0
2,000
4,000
6,000WTY36CNo protein (background)
E7107
Herbo
xidien
e
Sudem
ycin
D6
Borte
zom
ib
ParentalV37CWTY36FY36WY36RY36CY36SY36AY36E
Aromatic
Small side chain
Basic
Acidic
Fold change
5,000500101
IC50 fold change (PHF5A variant vs WT)
0.01 1 100 10,0000
50
100
E7107
Concentration (nM)
ParentalWT
Y36C
Y36AY36E
Y36R
Y36S
Y36WV37C
Y36F
PHF5A
GAPDH
Paren
tal
WT
Y36FY36
WY36
CY36
SY36
AY36
EY36
RV37
C
150 kDa
100 kDa
15 kDa
SF3B3 (1–1217aa)
SF3B1 (454–1304aa)
PHF5A (1–110aa)SF3B5 (1–86aa)
Mar
ker
Herboxidiene
0.01 1 100 10,0000
50
100
Sudemycin D6
Concentration (nM)
0.01 1 100 10,000Concentration (nM)
0.01 1 100 10,000Concentration (nM)
Bortezomib0
50
100
0
50
100
WT P
HF5A
Y36C P
HF5A
250 kDa
75 kDa
50 kDa
37 kDa
25 kDa20 kDa
10 kDa
% G
row
th (
CT
G)
% G
row
th (
CT
G)
CP
M (
raw
cou
nts)
Res
pons
e %
a b
c d
e g
f
Figure 7 | Characterization of the binding pocket of splicing modulator. (a) Coomassie staining of the recombinant four-protein mini-complexes
containing PHF5A-WT or PHF5A-Y36C used for Scintillation Proximity Assays. (b) The competitive titration curves of non-radioactive splicing modulators
to 3H-labelled pladienolide analogue (10 nM) binding to the WT four protein complex. (c) Overall surface view of modelled C36 overlaid onto WT
(Y36 show in cyan stick) and zoom-in PHF5A surface view at Y36 and C36. Surface potential coloured in red: � 8 kBT/e, blue: þ8 kBT/e and white:
0 kBT/e was calculated by APBS. (d) Scintillation Proximity Assay of the 3H-labelled pladienolide analogue (10 and 1 nM) binding to protein complexes
containing WT or Y36C PHF5A. Error bar indicates s.d., n¼ 2. (e) Western blot analysis of PHF5A levels in parental and indicated PHF5A variants
expressing HCT116 cells. GAPDH is shown as a loading control. (f) Unsupervised clustering heatmap of the IC50 shift between indicated PHF5A variant
expressing cell lines as compared to WT cell lines. The shift is shown as fold changes and calculated from IC50 values extracted from dose–response curves
in (g). Each row represents indicated PHF5A variant and each column corresponds to indicated compound. Colour key is shown on the top right corner.
(g) Seventy-two hours growth inhibition profiling (CellTiter-Glo cellular viability assay) of parental and indicated PHF5A variant expressing HCT116 cells’
response to indicated compounds. Error bar indicates s.d., n¼ 3.
ARTICLE NATURE COMMUNICATIONS | DOI: 10.1038/ncomms15522
10 NATURE COMMUNICATIONS | 8:15522 | DOI: 10.1038/ncomms15522 | www.nature.com/naturecommunications

BPA-binding pocket is also the region where splicing modulatorsbind. While conferring resistance, remarkably these mutations arenot detrimental to basal splicing despite their proximity to theBPA. Detailed analysis shows that SF3B1-K1071 is a conservedresidue (Fig. 6c) and forms H-bonds with the 20-hydroxyl of theBPA ribose sugar and also with the hydroxyl of PHF5A-Y36,which helps to position and orient these residues at the interface(Fig. 6e). Since mutation of either of these residues results inresistance, this interaction is likely important for modulatorbinding. PHF5A-Y36 also forms extensive van der Waalsinteraction with another conserved residue, SF3B1-R1075,which also helps orient this side chain and alter the bindingpocket. Based on our Y36C model, the mutation does not causea significant change to the electrostatic surface but does alterthe surface topology (Fig. 7c). The loss in affinity suggeststhe aromatic side chain at this position is critical for splicingmodulator binding. SF3B1-R1074H is located at the base ofthis binding pocket (Fig. 6e). It does not make any directinteractions with RNA or PHF5A, but mutation would alter theshape of the binding pocket and could affect compound bindingbut not BPA interaction (Fig. 6e,f). SF3B1-V1078A/I is nearthe top of this pocket and not conserved between yeast andhuman (Fig. 6c). In yeast, this residue forms an H-bond tothe BPA adenosine, but in humans this residue is likely to resultin a relatively subtle change and indeed confers the least amountof overall resistance.
Reduced binding affinity of splicing modulator to PHF5A-Y36C.To demonstrate the splicing modulator binding site is at theinterface composed by SF3B1, PHF5A and SF3B3, we engineereda recombinant protein complex based on the yeast Bact cryo-EMstructure15. By co-expressing these three proteins with SF3B5, wewere able to reconstitute a stable 250 kDa complex that could bepurified in two steps (Fig. 7a). To validate this recombinantcomplex can recapitulate a functional modulator binding site, wecaptured it on scintillation proximity assay (SPA) beads andprobed its interaction with a 3H-labelled pladienolide analogue9.SPA assays revealed 3H-labelled pladienolide probe bound to thecomplex and other non-radioactive splicing modulators were ableto compete off the bound probe, demonstrating the specificity ofthe interaction (Fig. 7b). In this competition assay, reduced signalfrom titrating non-radioactive modulators reveals the relativeaffinity of these three compounds to the complex compared to thepladienolide-like analogue and is consistent to the potency andrank ordering seen in the in vitro splicing (IVS) assay (Fig. 3a)and the cellular assay (Fig. 2d). This validates that these fourproteins reconstitute a functional binding site for splicingmodulators.
Next, the corresponding complex containing PHF5A-Y36Cwas generated to inspect whether the observed resistancemutation is a result of reduced binding between splicingmodulator(s) and the SF3b complex. The purified PHF5A-Y36Crecombinant complex was captured on the SPA beads and thesame 3H-labelled tracer compound9 was used to probe theinteraction at two different concentrations, 10 and 1 nM. SPAassay reveals that an approximate five-fold induction of the10 nM 3H-labelled probe binding to the WT PHF5A containingcomplex over background, whereas the binding to the PHF5A-Y36C complex was equal to background. This demonstrates thatthe single Y36C mutation is sufficient to reduce modulatorbinding significantly (Fig. 7d) and suggests Y36 makes criticalinteractions to modulators. The reduced affinity was alsoobserved in the IP’ed SF3b complex from PHF5A-Y36C cellnuclear lysates, confirming that this mutation is able to decreasemodulator binding in a physiological relevant protein complex aswell (Supplementary Fig. 13).
Mutagenesis shows Y36 is critical for modulator activity. Ourstructural and functional analysis implicates the importance of anaromatic side chain for splicing modulator binding (Fig. 7c). Tofurther dissect the importance of this interaction, we generated celllines expressing additional amino acid substitutions at the Y36 andneighbouring V37 position (Fig. 7e–g). Western blot analysisconfirmed comparable expression levels of most exogenous PHF5Avariants (Fig. 7e). We then examined the levels of cell growthinhibition elicited by splicing modulators in these lines (Fig. 7f–g).Consistent with our hypothesis, substitution of Y36 with eitherphenylalanine (F) or tryptophan (W) only conferred a very minorprotective effect against splicing modulators (Fig. 7g, dark and lightgreen lines). Indeed, unsupervised clustering of the IC50 shift(PHF5A variant over WT cells) grouped WT cell lines and Y36F/Wcell lines together (Fig. 7f). In contrast, when Y36 was mutated toeither serine (S) or alanine (A), mimicking the smaller size ofcysteine (C), strong resistance to splicing modulators was observed(Fig. 7g, dark and light red lines), and Y36S/A clustered closely withthe Y36C-expressing cell line (Fig. 7f). Interestingly, introducing acharged amino acid at this position also reduces compound action.Specifically, when Y36 was mutated to glutamic acid (E), a bulkyresidue with negative charge, almost complete resistance to splicingmodulators was observed (Fig. 7g, orange lines and Fig. 7f).Whereas when the residue was mutated to the positive chargedarginine (R), albeit at a much higher expression level than othervariants (Fig. 7e), the level of resistance was milder (Fig. 7g, purplelines and Fig. 7f). Taken together, this suggests that the aromaticgroup is required for binding and smaller residues or chargedresidues reduce modulator binding. In contrast, substitution of theV37 residue with cysteine (C) did not provide any protectionagainst splicing modulators even at high expression levels (Fig. 7g,light blue lines and Fig. 7e–g). Consistent with previous data, theresistance only occurred to the treatment with splicing modulatorsbut not bortezomib (Fig. 7f,g). Importantly, for all Y36 variantstested, the bias between resistances to different splicing modulatorscaffolds persists, suggesting that the Y36 residue is more critical forinteraction with herboxidiene than for pladienolide and sudemycin,which highlights that these splicing modulators could adoptdifferent poses within this common binding pocket (Fig. 7f,g).
DiscussionSpliceosomes undergo multiple ATP-dependent conformationalchanges involving a number of snRNPs, and this dynamiccomplexity makes it challenging to determine where and whensplicing modulators bind. Previous photocrosslinking studies withpladienolide and herboxidiene analogues narrowed down theinteraction point to the SF3b complex, one of the subunits of theU2 snRNP, specifically to the individual proteins SF3B3 andSF3B1 (refs 9,10). The resistant mutation SF3B1-R1074Hgenerated under high doses of pladienolide B and E7107provided further evidence that SF3B1 is critical for compoundbinding12. By applying a genomic resistance mapping approachwith low doses of E7107 and herboxidiene, we were able to elicit anumber of different resistance mutations. This allows us tofurther refine the splicing modulator binding pocket andpotentially to account for mechanism of action among certainintrons. We uncovered a series of key mutations, Y36C inPHF5A, V1078A/I, K1071E and the previously identifiedR1074H12 in SF3B1, which, together with the reportedphotocrosslinking data9,10, allow us to pinpoint the modulatorbinding pocket to the interface between PHF5A and SF3B1(Fig. 8). It remains possible that E7107 can act on additionalregulators in the spliceosome subcomplex. The other twomodulators, spliceostatin A and sudemycin D, also showresistance to the Y36C clone, indicating these compounds
NATURE COMMUNICATIONS | DOI: 10.1038/ncomms15522 ARTICLE
NATURE COMMUNICATIONS | 8:15522 | DOI: 10.1038/ncomms15522 | www.nature.com/naturecommunications 11

interact with this site as well8,21. Indeed, we confirmed thebinding of splicing modulators to this common binding pocket byreconstituting a functional 4-protein complex consisting ofPHF5A, SF3B1, SF3B3 and SF3B5 (Fig. 7a). The single aminoacid substitution of Y36C reduced the binding of the pladienolideprobe to background levels, suggesting that the mechanism ofresistance is due to the decreased affinity of splicing modulatorsto the binding pocket (Fig. 7c). Detailed site-directed mutagenesisof Y36 shows that both the aromatic ring and electrical charge atthe Y36 residue is critical for the activity of splicing modulators(Fig. 7e–g). Furthermore, mutations at Y36 revealed differentlevels of protection against these modulators with differentscaffolds, indicating that these modulators may adopt slightlydifferent poses within mode of interaction at this commonbinding pocket. Webb et al.29 have previously hypothesizedseveral pharmacophore features for herboxidiene activityincluding a hydrophobic motif (a diene group) between C8 andC11. Pladienolide and herboxidiene share this diene moiety,implying this may bind at the proximity of Y36. Thus, it would beinteresting to examine the relations between the aromatic ring ofY36 and this motif in the future.
Given the location of the resistance mutations around the BPAbinding site, one possible model for the mechanism of action isthat the splicing modulators are BPA competitive inhibitors(Fig. 8). This close proximity of splicing modulators bindingpocket to the BPA is consistent with previous reports from theValcarcel group and Reed group that both spliceostatinsand pladienolides impair the canonical base pairing betweenU2 snRNA and pre-mRNA branch point region in the presenceof heparin25,30. Collectively, these observations led to a modelwhere splicing modulators directly impact on the fidelity ofSF3B1 branch site recognition with consequences on the 30 splicesite recognition30. This competitive binding model immediately
suggests several possible functional consequences that can beexamined at the global splicing level. Specifically, weaker GC-richintron substrates would be easier to inhibit than stronger intronsequences and this differential could manifest itself throughalterations in splicing preferences in the presence of differentcompounds.
Consistent with this model for inhibition, we observeda nonlinear dose response in global splicing due to variations inindividual intron ‘strength’. Splicing modulation is a globalphenomenon which impacts more than 200,000 introns in thehuman genome31. Despite several conserved features withinintrons and adjacent exons, regulation of individual intronsduring splicing is both diverse and complex. This variation andcomplexity means that small-molecule inhibition will havedifferential effects on splice junction usage. Here, a protectivemutation in PHF5A allowed us to examine the individual cellularresponses of introns upon splicing modulation, which revealedtransitions between IR and ES events.
It has been proposed that during evolution, the generallyshorter, low GC containing introns in lower eukaryotes evolvedunder two different routes18: one group of introns remainedshort, but had markedly increased GC percentage and had lessdifferential in term of GC composition compared to theirneighbouring exons. Due to the shorter length of these introns,they are more likely to be recognized by an intron-definedsplicing mechanism. Interestingly, these introns appear to bemore susceptible to IR upon E7107 treatment. More importantly,we observed that when the effect of E7107 was weakened in thepresence of PHF5A Y36C mutation, the average GC compositionsof IR event-related introns were markedly higher with little to nodifferential from downstream exons (Fig. 4c). Given that thedifferential in GC composition between introns and surroundingexons might contribute to splicing machinery recognition, it isplausible to hypothesize that these kinds of introns are inherentlymore difficult for the splicing machinery to recognize, which inturn might make them easier to inhibit with splicing modulators.It has also been proposed that higher GC content around BPAmay lead to a more stable secondary structure of the pre-mRNA;therefore, it is also plausible that GC content may affect theeffectiveness of competition between pre-mRNAs and splicingmodulators via structural and spatial mechanisms32.
In contrast, another group of introns maintained their lowGC composition and large differential with adjacent exonsduring evolution, but underwent significant increases in length,which likely brought them out of the range of intron-definedsplicing and converted them to an exon-defined splicingmechanism18. Intriguingly, under E7107 treatment, intronsassociated with increased ES events are associated with lowerGC composition and higher GC differential with the skippedexons (Fig. 4d). Similar to the observation in IR events, theGC content of compound induced ES introns in the presenceof Y36C was also higher than that of the WT cells (Fig. 4d).A higher differential in GC composition between introns andexons has been linked to increased nucleosome occupancy andenrichment of SF3B1 association with the chromatin, whichpresumably primes these junctions for co-transcriptionalsplicing18,33. Further characterization of the genomic structureof the junctions associated with ES events may yield additionalinsight in our understanding of the complex link betweentranscription and splicing.
Our observation that 2,470 junctions can be switched betweenIR and ES upon E7107 treatment depending on the genotypeof PHF5A strengthens the hypothesis that introns possessdifferential sensitivity to small-molecule inhibitors (Fig. 4e).The fact that IR and ES events affect the same 30 junction arenot mutually exclusive further unveils the plasticity of splicing
–3′Intron RNA
SF3B1
PHF5A
SF3B3
PPT
Splicing modulator binding site
BPA
5′–Intron RNA
Y36
K1071
V1078R1074
GC content in intronic region
Resistance to splicing modulators
Figure 8 | Model of splicing modulator interaction with the SF3b complex
at the BPA-binding pocket constituted by PHF5A and SF3B1. The
molecular surface representation of the protein complex SF3B1 (yellow),
PHF5A (blue) and SF3B3 (orange). The intron RNA is shown as red ribbon,
with branch point adenosine (BPA) in dark blue. The common splicing
modulators binding site is indicated by a star with the approximate positions
of the surrounding residues for which resistance mutations were identified.
The figure was generated using the yeast Bact complex coordinates. The
schematic model indicates the inverse correlation between the GC content of
the intron sequence and their resistance to splicing modulation. Specifically,
high GC content intron substrates are weaker substrates that show more
sensitivity or less resistance to splicing modulators.
ARTICLE NATURE COMMUNICATIONS | DOI: 10.1038/ncomms15522
12 NATURE COMMUNICATIONS | 8:15522 | DOI: 10.1038/ncomms15522 | www.nature.com/naturecommunications

regulation and a fine-tuning mechanism of the usage of individualjunctions (Fig. 4e). It is conceivable that in PHF5A WT cells,E7107 was efficient in competing with the canonical BPAs inthese 2,470 junctions and led to IR events. However, uponPHF5A Y36C expression, E7107 would become less efficient inthe competition with these junctions while maintaining itscompetence with the immediate upstream introns, which inducedmore ES events (Supplementary Fig. 14). Collectively, thesedifferential sensitivities from cellular introns are consistentwith the model that splicing modulators act as competitiveBPA inhibitors, and are likely to result in the nonlinear responseto differential dosages of splicing modulators.
Phenotypic screening of small-molecule libraries is a powerfulway to identify potential drugs. However, cellular targetidentification for the screening hits has been an unremittingchallenge. Several unbiased approaches have been developed toidentify the cellular targets and mechanisms of action, includingbiochemical approaches such as affinity purification coupledwith quantitative proteomics, genetic interaction approachessuch as RNAi screening and domain-focused CRISPR screens,and computational inference approaches34,35. More recently,we and others used next-generation sequencing-based genomicor transcriptomic profiling of phenotypically resistant cellpopulations13,14,36 to identify unique recurrent single-nucleotidevariations or expression alterations to illuminate potential cellulartargets of compounds. Here, we further developed the method byscreening structurally unrelated compounds at different lowconcentrations, in order to (1) mitigate the potential off-targetactivity at high concentrations and (2) enhance the possibility toidentify subtle but common mechanisms of chemical probes. Thisallowed us to uncover multiple mutations/genes encodingproteins co-existing in the same complex. Interestingly, inour case, the finding of resistant mutations to PHF5A-Y36,SF3B1-V1078 and K1071, in addition to confirming thepreviously reported SF3B1-R1074, suggests the proximity ofthese residues to the action site of splicing modulators. The factthat corresponding amino acids of these residues in yeast wererecently shown to form a pocket that accommodates the invariantadenosine in the BPS demonstrates that this genomic profilingstrategy can provide faithful and informative insights intothe action of candidate compounds. Hence, we propose thatfurther expansion of the genomic profiling approach will offera unique way to explore the MoA (mechanisms of action) forcompounds using the ‘2-dimensional’ genomic fingerprintdissection. This is particularly valuable when the proteinstructure and/or biochemical assays with purified proteins arenot readily available as exemplified in this study by the complexand dynamic spliceosome.
In summary, we identify PHF5A as a key node of interactionfor small-molecule splicing modulators. Our structural analysispinpointed a common binding site around the branch pointadenosine-binding pocket. Also, our results demonstrate how asingle amino acid change on PHF5A Y36 weakened the inhibitoryeffect of splicing modulators and altered the global splicingpattern between ES events and IR events. We expect thesefindings will assist future development of more specific small-molecule splicing modulators for treating diseases associated withaberrant splicing.
MethodsMaterials. Parental HCT116 cells were obtained from ATCC and cultured inRPMI 1,640 medium (Thermo Fisher, GIBCO#11875) supplemented with 10%fetal bovine serum (FBS). Parental Panc0504 cells were obtained from ATCC andcultured in GIBCO RPMI 1,640 medium (Thermo Fisher, GIBCO#11875)supplemented with glucose (to 4.5 g l� 1 final), HEPES (10 mM final), sodiumpyruvate (1 mM final), human insulin (10 mg ml� 1 final) and 15% FBS. Cell lineauthentication was achieved by genetic profiling using polymorphic short tandem
repeat (STR) loci (ATCC). All cell lines were free of mycoplasma contamination.Lenti-X-293T cells (Clontech Laboratories, Inc., Cat # 632180), a cell line forlentiviral packaging, was maintained in Dulbecco’s modified Eagle’s medium(Thermo Fisher, GIBCO#11965) containing 10% FBS and 4 mM L-glutamine. WTPHF5A cDNA in pShuttle vector was obtained from Genecopoeia (cat#GC-V1039)and cloned into pLenti6.3/V5 vector (Thermo Fisher) through LR recombinationusing Gateway LR Clonase II Enzyme Mix (Invitrogen). Mutagenesis of Y36 andV37 were carried using the Agilent Quickchange II kit following the manufacturer’srecommendation using the PHF5A WT plasmid. All primers used for mutagenesiswere designed using the QuickChange Primer Design tool by Agilent and listed inSupplementary Table 1. Verified positive clones of PHF5A Y36 or V37 variantswere used for lentivirus production using X293T cells. Parental HCT116 cells andPanc0504 cells were then infected with virus containing medium and selected withBlasticidin S (Thermo Fisher) at 10 mg ml� 1 for 1 week. Engineered cell lines weremaintained in the same medium without antibiotics. The following primaryantibodies were used at 1:1,000 dilution for western blot analysis in LI-COR buffer(LI-COR): a-SF3B1 mouse monoclonal antibody (MBL, D221-3), a-SF3B3 rabbitpolyclonal antibody (Protein Tech, 14577-1-AP), a-SF3B4 goat polyclonalantibody (Santa Cruz, 14276), a-SF3B6/p14 rabbit polyclonal antibody(Protein Tech, 12379-1-AP), a-PHF5A rabbit polyclonal antibody (Protein Tech,15554-1-AP). a-GAPDH rabbit polyclonal antibody (Sigma, G9545) was used at1:10,000. Anti-rabbit and anti-goat IRDye-800CW secondary antibody (LI-COR)was used at 1:5,000 dilution and anti-mouse IRDye-680LT secondary antibody(LI-COR) was used at 1:20,000 dilution. Western blot was imaged using anOdyssey V3.0 imager (LI-COR). Uncropped images of western blots and gels areshown in Supplementary Fig. 15.
Compounds. Bortezomib (PS-341) was purchased from LC Laboratories (Cat. No.B-1408, Lot: BBZ-112). E7107 and 3H-labelled Pladienolide probe were providedby Eisai Co. Ltd and their synthesis was previously reported9. Herboxidiene wasalso provided by Eisai Co. Ltd. Spliceostatin A and Sudemycin D6 were synthesizedin house following established procedures37,38. For splicing modulators, thecompound identity and purity was assessed by LC/MS and proton NMR(Supplementary Fig. 16). Purity was determined using a Waters H class Acquityultra performance liquid chromatography system with an XSelect CSH C18, 1.7 mm2.1� 50 mm column, a flow rate of 0.8 ml min� 1 at 20 �C. Injections consisted of1 ml of 1 mM sample in DMSO over a gradient from 5% acetonitrile and 0.1%formic acid to 90% acetonitrile and 0.1% formic acid over a timespan of 2.5 min.Purity for each compound was determined from the integrated UV absorbancepeak (Supplementary Fig. 16). Masses were detected in the positive ion scan andcorrespond to those predicted by their formula weight (Supplementary Fig. 16).The detector conditions were capillary voltage 3.25 kV, cone voltage 30 V, sourcetemperature 150 �C, desolvation temperature 500 �C, desolvation gas 1,000 l h� 1,cone gas 100 l h� 1. Single ion recording was used to determine quantification ofsamples. The data were acquired over scan range from m/z¼ 100–1,000 in 0.2 sand processed using QuanLynx software. Proton NMR spectra were acquired foreach compound on a Bruker Ascend 400 MHz spectrometer to further assess theidentity and purity of the samples. The indicated solvents correspond to those usedin previous publications (pyridine for E7107 (ref. 9), chloroform for spliceostatinA37 and sudemycin D6 (ref. 38), and methanol for herboxidiene39) (SupplementaryFig. 16). The acquired spectra match previous data reported for these compounds.
Resistant mutation identification by WXS. In total, 2.5 million HCT116 cellswere seeded in each 10 cm dish and treated with indicated dosages of splicingmodulators for 2 weeks. Compounds were refreshed every 4 days. When needed,confluent dishes were split 1:3 and cells were allowed to recover overnight withoutsplicing modulator treatment after re-seeding. At the end of the compoundselection period, surviving individual clones were picked and transferred to 12-wellplates. Individual resistant clones were further expanded without splicingmodulator treatment and one million cells from each clone were pelleted forgenomic DNA extraction using the DNeasy Blood & Tissue Kit from Qiagen. WXSlibraries were generated by Novogene Corporation using Agilent SureSelectHuman All Exon V6 kit and sequenced on Illumina HiSeq platform. 12G raw datawere gathered for each sample. WXS reads were then aligned to hg19 byBWA-MEM40 and somatic mutations were identified with MuTect2 (ref. 41)through Sentieon pipeline42 by pairing resistant clone with parental cell lines. Aswe selected the resistant clones for WXS, the allele frequencies for the mutationswhich are responsible for the resistance should be high. We focused on non-silentmutations (among the H3 curated spliceosome genes) with allele frequencyhigher than 0.2.
Cell viability assay. For CellTiter-Glo analysis, 500 cells were seeded in each wellof a 384-well plate the day before compound addition. An 11 pt serial dilution wasused starting with a top final dosage of 10 mM for 10 additional doses. DMSOpercentage was maintained throughout and a DMSO-only control was included.Seventy-two hours post compound addition, CellTiter-Glo reagent was added tothe medium, incubated and assayed on EnVision Multilabel Reader (PerkinElmer).The luminescence value from each treatment sample was normalized to the averagevalue of the respective DMSO control. The dosage response curve plots were
NATURE COMMUNICATIONS | DOI: 10.1038/ncomms15522 ARTICLE
NATURE COMMUNICATIONS | 8:15522 | DOI: 10.1038/ncomms15522 | www.nature.com/naturecommunications 13

generated using Graphpad Prism 6 and fit using nonlinear regression analysis andthe log(inhibitor) versus response—Variable slope (four parameters). For heatmapsummarization of IC50 shifts, IC50 value was extracted from dosage response curvesand the fold changes of IC50 values in PHF5A variants expressing lines over that ofthe WT lines were calculated and plotted using TIBCO Spotfire software. For IC50sgreater than the top dosage, the values were arbitrarily set at 10 mM. Unsupervisedclustering analysis was performed in TIBCO Spotfire using the following defaultparameters: Clustering method: UPGMA; Distance measure: Euclidean;Ordering weight: Average value; Normalization: (None); Empty value replacement:Constant value: 0.
Cell proliferation assay. One thousand cells of indicated genotypes were seededin 96-well clear bottom plates (Corning, #3904) and HD phase-contrast image wascaptured every 4 h with � 4 objective lens using IncuCyte ZOOM System(Essen BioScience). Collected images were analysed with IncuCyte ZOOM Software(2016A) (Essen BioScience) to calculate the confluency percentage. Analysed datawere graphed with Graphpad Prism 6, n¼ 5.
Immunofluorescence. One million cells of indicated genotypes were seeded ontoCorning BioCoat Fibronectin 22 mm cover-slips (Fisher Scientific 08-774-386) insix-well plates. After 2 days, cells were fixed with 4% paraformaldehyde/phosphate-buffered saline (PBS) for 20 min at room temperature (RT). After 3� PBS wash,cells were permeabilized with 0.1% Triton X-100/PBS for 20 min at RT. After3� PBS wash, cells were blocked with 5% FBS/PBS for 1 h at RT and incubatedwith a-SF3B1 mouse monoclonal antibody (MBL, D221-3) or a-SC35 mousemonoclonal antibody (Abcam, ab11826) at 1:50 dilution in 5% FBS/PBS incold room overnight. On the second day, coverslips were washed with PBSthree times and incubated with Alexa Fluor 488 anti-mouse secondary antibody(Thermo Fisher Cat #: A-11029) at 1:500 dilution in 5% FBS/PBS at RT indark for 1 h. Coverslips were then washed with PBS three times and mountedusing ProLong Gold Antifade Mountant with DAPI (Thermo Fisher, P36935).Slides were imaged with a � 40 objective on an Olympus IX-81 invertedfluorescence microscope and imaged, captured and processed with Metamorphfor Olympus.
Cell lysis and nuclear extract preparation. For western blot analysis, cell pelletswere extracted using RIPA buffer supplemented with complete protease inhibitorcocktail and PhosStop phosphatase inhibitor cocktail (Roche Life Science). Lysateswere then centrifuged for 10 min at top speed, and the supernatants were subjectedto SDS–PAGE. For nuclear extract preparation, cells were first washed and thenscraped into PBS. After centrifugation, cell pellets were resuspended in five packedcell volume of hypotonic buffer (10 mM HEPES, pH 7.9, 1.5 mM MgCl2, 10 mMKCl, 0.2 mM PMSF, 0.5 mM DTT) and centrifuged at 1,700g for 5 min. Cell pelletswere resuspended in three packed cell volume of hypotonic buffer and swelled onice for 10 min. Swollen cells were then lysed using a dounce homogenizer and spunat 1,500 g for 15 min at 4 �C. The pellets contained the nuclei and were suspendedwith ½ packed nuclei volume of low-salt buffer (20 mM HEPES, pH 7.9, 1.5 mMMgCl2, 20 mM KCl, 0.2 mM EDTA, 25% glycerol, 0.2 mM PMSF, 0.5 mM DTT)gently. ½ packed nuclei volume of high salt buffer (20 mM HEPES, pH 7.9, 1.5 mMMgCl2, 1.4 M KCl, 0.2 mM EDTA, 25% glycerol, 0.2 mM PMSF, 0.5 mM DTT) wasthen added and mixed gently. The lysates were rocked for 30 min in cold roombefore centrifuged at 9,000g for 30 min at 4 �C. The supernatants contained thenuclear extracts and were dialysed for 4 h using Slide-A-Lyzer dialysis cassetteswith 30,000 MWCO cutoff in dialysis buffer (20 mM HEPES, pH 7.9, 0.2 mMEDTA, 20% glycerol, 0.2 mM PMSF, 0.5 mM DTT) with a change of buffer after2 h. The nuclear extract was then aliquoted and flash frozen.
In vitro splicing assay. The following Ad2-derived43 and subsequently modified30
sequence (actctcttccgcatcgctgtctgcgagggccagctgttggggtgagtactccctctcaaaagcgggcat-gacttctgcgctaagattgtcagtttccaaaaacgaggaggatttgatattcacctggcccgcggtgatgccttt-gagggtggccgcgtccatctggtcagaaaagacaatctttttgttgtcaagctttgcacgtctagggcgcagtagtc-cagggtttccttgatgatgtcatactaatcctgtcccttttttttccacagctcgcggttgaggacaaactcttcgcggtctttc-cagtactcttggatcggaaacccgtcggcctccgaacg) (intron in italics and underlined) wascloned into the pGEM-3Z vector (Promega) using 50 EcoRI and 30 XbaI restrictionsites. The Ftzi plasmid was obtained from Robin Reed. The pGEM-3Z-Ad2.1 andFtzi plasmids were linearized using XbaI and EcoRI, respectively, purified,resuspended in TE buffer and used as a DNA template in the in vitro transcriptionreaction. The Ad2.1 pre-mRNA and Ftz mRNA were generated and purified usingMEGAScript T7 and MegaClear kits, respectively (Invitrogen). Twenty-microlitresplicing reactions were prepared using 80 mg nuclear extracts, 20 U RNAsinRibonuclease inhibitor (Promega), 20 ng Ad2.1 pre-mRNA and 2 ng Ftz mRNA(internal control). After a 15-min pre-incubation with indicated compound,activation buffer (0.5 mM ATP, 20 mM creatine phosphate, 1.6 mM MgCl2) wasadded to initiate splicing, and the reactions were incubated for 90 min at 30 �C.RNA was extracted using a modified protocol from a RNeasy 96 Kit (Qiagen). Thesplicing reactions were quenched in 350ml Buffer RLT Plus (Qiagen), and 1.5volume ethanol was added. The mixture was transferred to an RNeasy 96 plate, andthe samples were processed as described in the kit protocol. RNA was diluted 1 to100 with dH2O. Ten microlitres RT–qPCR reactions were prepared using TaqMan
RNA-to-CT 1-step kit (Life Technologies), 2 ml diluted splicing reactions, 0.5 ml Ad2mRNA primer/probe set and 0.5 ml Ftz mRNA primer/probe set. The Ad2 Ftzprobes are from IDT and labelled with FAM acceptor with ZEN quencher and theFtz probe is labelled with Hex and ZEN quencher, primer and probe set sequencesare listed in Supplementary Table 1.
Mass spectrometry analysis. The enriched samples were reduced with 5 mMDTT at 56 �C for 45 min and alkylated with 20 mM iodoacetamide at RT for30 min. The samples were run on a 4–15% Tris glycine gel and the gel was excised,de-stained and trypsin digested overnight at 30 �C. Peptides were extracted with50 ml of buffers A, B and C sequentially (Buffer A—1% formic acid and 50%acetonitrile, B—100 mM ammonium bicarbonate, C—100% acetonitrile). Sampleswere dried down using a lyophilizer and resuspended in 30 ml of running buffer A(0.1% formic acid in water). Samples were analysed by nanocapillary liquidchromatography tandem mass spectrometry on an easy-nLC 1,000 HPLC systemcoupled to a QExactive mass spectrometer (Thermo Scientific) using a C18 easyspray column particle size: 3 mm; 150� 0.075 mm I.D. and the data were analysedusing Proteome discoverer 1.4.
Expression and crystallization of PHF5A. Full-length human PHF5A, containinga C40S mutation for enhanced protein stability, was synthesized and subclonedbetween the NdeI and EcoRI sites of pET-28a with an N-terminal His-MBP-TEVcleavable tag. The codon optimized sequence was: atggcaaaacaccatccggacttaatcttttgccgcaagcaggccggtgttgcaatcggccgtctgtgcgagaaatgcgacggcaagtgcgtgatctgtga-cagctatgtgcgccctagtaccctggttcgcatctgcgacgagtgcaattatggcagctatcagggccgttgcgt-tatttgcggtggtccgggtgttagcgatgcctattactgcaaagaatgcaccattcaggaaaaggatcgcgatggctgtc-cgaagatcgttaacctgggcagcagcaaaaccgacctgttttacgaacgtaagaagtatggcttcaagaaacgctga.Protein was expressed in BL21 Star (DE3) cells (Thermofisher) grown in LBmedia. Cells were induced at OD600¼ 1.0 overnight at 16 �C with 0.5 M IPTGsupplemented with 100 mM ZnCl2. Lysate was prepared in HEPES pH 7.5, 500 mMNaCl, 1 mM TCEP, loaded onto a NTA-column and eluted over a gradient up to500 mM imidazole. The peak fraction was pooled and the MBP tag was cleaved byTEV protease overnight at 4 �C. Cleaved MBP and excess TEV were removedby reverse NTA column. The flow through fractions containing PHF5A wereconcentrated and loaded onto a 16/60 Sephacryl-100 column equilibrated in100 mM NaCl, 25 mM HEPES pH 7.5, 1 mM TCEP. The peak fraction was furtherpurified by ion exchange on a HiTrap SP HP column equilibrated in gel filtrationbuffer and eluted in a gradient up to 1 M NaCl. PHF5A eluted in approximately300 mM NaCl and was concentrated to 10 mg ml� 1 and flash frozen in liquidN2 for storage at � 80 �C. The resulting protein failed to crystallize but aproteolytically stable domain was obtained by limited digestion with chymotrypsin(1:1,000 molar ratio) for 2 h at RT. Cubic-shaped crystals grew to final dimensionsof 50� 50� 50mm after a week from 2 mlþ 2 ml hanging drops equilibrated overa reservoir containing 100 mM CHES pH 9.5, 800 mM sodium citrate and0.5% octyl-b-glucoside. Crystals were frozen in reservoir solution supplementedwith 20% ethylene glycol.
Structure determination. Single wavelength anomalous diffraction (SAD) data atthe zinc edge were collected by Shamrock Structures LLC at the APS beamline 21D(Table 1). Crystals diffracted to 2.0 Å and the data were processed with iMosflmand xia2 in a cubic space group P213 (a¼ b¼ c¼ 82.2 Å and a¼ b¼ g¼ 90�)44,45
indicating a solvent content of 47%, assuming two molecules in the asymmetricunit. Anomalous signal extended to approximately 2.0 Å (Supplementary Fig. 17)and was used to locate six high-occupancy zinc anomalous sites using SHELX C/D/E46,47, confirming two molecules in the asymmetric unit. The FOM from this initialsubstructure solution was 0.404 and after density modification and handdetermination, the FOM improved to 0.76. Buccaneer and REFMAC5 (ref. 48)auto-traced 76 residues for each monomer and we were able to model an additional13 residues using Coot. This model was used to refine against the native data set to1.8 Å and after several iterative rounds of rebuilding and refinement, the finalmodel was obtained consisting of residues 2–91 in molecule A and 3–92 inmolecule B and final statistics R¼ 0.17, Rfree¼ 0.20 and FOM¼ 0.86 (Table 1)48,49.Representative electron density from the final 2Fo–Fc map, contoured at 1s, isshown (Supplementary Fig. 18).
Cloning and purification of the recombinant protein complex. To reassemblethe modulator-binding site, four proteins from the SF3b complex were selectedbased on the yeast cryo-EM structure15. Truncated SF3B1, full-length SF3B3,PHF5A and SF3B5 were synthesized and subcloned between the EcoRI and NcoIsite of pFastBac1 vector. Only the HEAT repeat domain from residue 454–1,304 ofSF3B1 was cloned with an addition of N-terminal FLAG tag. SF3B3 and SF3B5were with an N-terminal His-tag. Four viruses were generated and used to co-infectSF21 cells at a ratio of B10:1. The cells were harvested after 72 h and lysed in40 mM HEPES pH 8.0, 500 mM NaCl, 10% glycerol and 1 mM TCEP. The complexwas purified by batch method, using nickel beads and FLAG beads. The eluent wasconcentrated and ran on a gel filtration column (superdex 200) in buffer 20 mMHEPES pH 8.0, 300 mM NaCl, 10% glycerol and 1 mM TCEP. The fraction wascollected, concentrated to 4 mg ml� 1 and flash frozen in liquid N2 for storage at
ARTICLE NATURE COMMUNICATIONS | DOI: 10.1038/ncomms15522
14 NATURE COMMUNICATIONS | 8:15522 | DOI: 10.1038/ncomms15522 | www.nature.com/naturecommunications

� 80. The production of recombinant complex containing PHF5A-Y36C mutationis the same as the WT recombinant complex.
Scintillation proximity assay. Batch immobilization of anti-FLAG antibody(Sigma) to anti-mouse PVT SPA scintillation beads (PerkinElmer) was prepared asfollows. For every 1.5 mg of beads, 10 mg antibody was prepared in 150 ml PBS. Theantibody–bead mixture was incubated for 30 min at RT and centrifuged at 18,000 gfor 5 min. One hundred and fifty microlitres PBS was used to resuspend every1.5 mg antibody–bead mixture. The aforementioned mini-SF3b complexes weretested for 3H-labelled pladienolide probe9 binding. One hundred microlitresbinding reactions were prepared with 50 ml bead slurry and 0 or 50 nM protein inbuffer (20 mM HEPES pH 8, 200 mM KCl, 5% glycerol). The mixture wasincubated for 30 min, and varying concentrations of 3H-labelled pladienolide probewere added. The mixture was incubated for 30 min, and luminescence signals wereread using a MicroBeta2 Plate Counter (PerkinElmer). Compound competitionstudies were performed with the WT mini-SF3b complex. One hundred microlitresbinding reactions were prepared with 50 ml bead slurry, 25 nM protein in bufferand compounds at varying concentrations. After a 30-min pre-incubation, 1 nM3H-labelled pladienolide probe was added. The reactions were incubated for30 min, and luminescence signals were read.
Previously prepared nuclear extracts were stored as 2.5 mg aliquots. Eachaliquot was sufficient for three SPA samples and was diluted into a total volume of1 ml PBS with phosphatase and protease inhibitors. Sufficient amounts of aliquotswere centrifuged at 18,000g for 10 min at 4 �C. The supernatant was removed into aclean tube and kept on ice. Batch immobilization of anti-SF3B1 antibody (MBL) toanti-mouse PVT SPA scintillation beads (PerkinElmer) was prepared as follows.For every 2.5 mg of nuclear extracts, 5 mg anti-SF3B1 antibody and 1.5 mg of beadswere mixed in 150 ml PBS. The antibody–bead mixture was incubated for 30 min atRT and centrifuged at 18,000g for 5 min. The beads were suspended and added tothe prepared nuclear extracts. The slurry was incubated for 2 h at 4 �C with gentlemixing. The beads were collected by centrifuging at 18,000g for 5 min, and washedtwice with PBSþ 0.1% Triton X-100. After a final centrifugation step, every 1.5 mgof beads was suspended with 150ml of PBS. One hundred microlitres bindingreactions were prepared as follows: 50 ml bead slurry, 25ml cold competitivecompound at 10mM, and after 30 min pre-incubation, 10 nM 3H-labelledpladienolide probe was added. The mixture was incubated for 30 min, andluminescence signals were read using a MicroBeta2 Plate Counter (PerkinElmer).
RNA-Seq and data analysis. Either PHF5A WT or Y36C mutant-overexpressingcells were treated with either DMSO or E7107 (100 nM and 10 mM) for 6 h inhexaplicate before lysed in TRIzol reagent (Thermo Fisher). After phase separation,the top aqueous phase was further processed using MagMAX-96 Total RNA Iso-lation Kit (Thermo Fisher, AM1830) for RNA extraction. RNA quality was assessedusing Agilent tapestation with RNA screen tape. RNA-seq libraries were preparedby Beijing Genomic Institute (BGI) and sequenced on Illumina Hiseq 4,000 for 6Gclean reads per sample. RNA-seq reads were aligned to hg19 by STAR50 and rawjunction counts generated by STAR were used for calculating PSI to quantify splicejunction usage relative to all other splice junctions that share the same splice site asdescribed before51. Differential PSI were assessed between a pair of sample groupsusing moderated t-test defined in limma package52 in Bioconductor. The statisticalP-values were corrected using the Benjamini–Hochberg procedure and q-valuesp0.05 were considered statistically significant. Gene IDs associated with significantsplicing changes upon E7107 treatment as compared to DMSO in either PHF5AWT or Y36C cells were used for generation of the Venn Diagram using online tool(http://bioinformatics.psb.ugent.be/webtools/Venn/). PHF5A WT- or Y36C-specific genes identified from the Venn Diagram analysis were then subject to GeneSet Enrichment Analysis (http://software.broadinstitute.org/gsea/msigdb/annotate.jsp) using the Kyoto Encyclopedia of Genes and Genomes (KEGG)pathway database.
ES versus IR PSI comparison. The number of reads which cover the splicejunction which excludes a given cassette exon (ES reads) are compared with boththe number of spliced reads which share its 30 splice site yet have an alternative50 splice site bordering the cassette exon (exon inclusion reads) and the number ofreads which cross the exon–intron boundary at that same 30 splice site (IR reads).These counts are summed and their fractions from the PSI for the ES event, theexon inclusion event and the IR event, respectively, at that locus. The PSI forall significant ES events derived from the comparison between 100 nM E7107treatment in PHF5A Y36C cells and the respective DMSO controls (3,883 events)and the PSI for the IR junction at the same locus are plotted in blue and green,respectively. For all other treatments, the PSI of the ES junction and the IR junctionfor each locus is plotted in the same order. PSI is averaged over samples inhexaplicate.
GC content calculation of retained intron junctions. The set of all significantlyretained intron junctions was reduced to those which had an intron of lengthat least 100 and which bordered at least one exon of length 50 from RefSeq atits 30 end. If multiple exons of length 50 were found, one was randomly selected.The sequences of each intron and exon were divided into 100 and 50 bins of equal
length strings, respectively, then the GC content (fraction of bases either ‘G’ or ‘C’)was assessed for each string. Once all intron/exon pairs have their sequence contentbinned in this way, the resulting mean and 95% confidence interval for each binwere assessed using 100 bootstraps of the data (up to the number of intron/exonpairs, with replacement) and drawn using a solid line and a transparent interval,respectively. The background, in grey, was drawn from 10,000 random intron/exonpairs from RefSeq which satisfied the same length and boundary requirements.
GC content calculation of ES junctions. The set of all significant, treatment-induced ES junctions was reduced to those for which both introns (those borderingthe cassette exon on their 30 and 50 ends, respectively) had a sequence length of atleast 100, were significantly enriched in the untreated samples as ‘exon inclusion’events with qo0.05, and for which the intervening sequence space formedby the borders of their 30 and 50 ends was known to be an exon in the RefSeqtranscriptome annotation of length at least 50, to avoid ambiguity caused by eventswhich skip multiple exons. The sequences of each intron and exon were dividedinto 100 and 50 bins of equal length strings, respectively, then the GC content(fraction of bases either ‘G’ or ‘C’) were assessed for each string. Once allintron/exon pairs have their sequence content binned in this way, the resultingmean and 95% confidence interval for each bin were assessed using 100 bootstrapsof the data (up to the number of intron/exon pairs, with replacement) and drawnusing a solid line and a transparent interval, respectively. The background, in grey,was drawn from 10,000 random intron/exon pairs from RefSeq, which satisfied thesame length and boundary requirements.
Taqman gene expression assay. Eight thousand cells of indicated genotypes wereseeded in each well of 96-well plate and allowed to settle overnight. On the secondday, 11 pt serial dilution (1:4 fold dilution across) of indicated compound witha top dosage of 10 mM final was added to the culturing medium. Four hours postcompound addition, culturing medium was decanted and washed once with PBS.PBS was then decanted completely from the plate and Lysis buffer (plus DNase I)from TaqMan Gene Expression Cells-to-CT Kit (Thermo Fisher, cat # AM1729)was added according to the manual. After 5 min incubation at RT on the shaker,stop solution was added to each well and incubated for 2 min. Reverse transcriptionwas set up immediately using the Cells-to-CT Kit and cDNAs were used forquantitative real-time PCR analysis using Viia7 (Thermo Fisher). Each reaction ismultiplexed with an FAM-labelled probe targeting specific target gene splicingisoforms and a VIC-labelled probe targeted 18S rRNA as loading control.Therefore, the FAM Ct value in each well was first normalized to the VIC Ctvalue in the same well before further normalization to the FAM/VIC ratio ofDMSO-treated control samples to calculate fold change over DMSO. Graphswere generated using Graphpad Prism 6, n¼ 2. Taqman gene expression probesused in these assays are listed in Supplementary Table 1.
Statistics. Appropriate statistical methods and determination of statisticalsignificance were performed as described in specific Method sections.
Data availability. Coordinates and structure factors were deposited in the ProteinData Bank (PDB accession code: 5SYB). UniProt entries Q7RTV0 and PDBaccession codes 5SYB, 5GM6 and 2K0A were used in this study. RNA-seqdata have been deposited in NCBI’s Gene Expression Omnibus (GEO)repository and are accessible through GEO Series accession number GSE96917(https://www.ncbi.nlm.nih.gov/geo/query/acc.cgi?acc=GSE96917). All other dataare available from the corresponding authors upon reasonable request.
References1. Matera, A. G. & Wang, Z. A day in the life of the spliceosome. Nat. Rev. Mol.
Cell Biol. 15, 108–121 (2014).2. Scotti, M. M. & Swanson, M. S. RNA mis-splicing in disease. Nat. Rev. Genet.
17, 19–32 (2016).3. Bonnal, S., Vigevani, L. & Valcarcel, J. The spliceosome as a target of novel
antitumour drugs. Nat. Rev. Drug Discov. 11, 847–859 (2012).4. Naryshkin, N. A. et al. Motor neuron disease. SMN2 splicing modifiers
improve motor function and longevity in mice with spinal muscular atrophy.Science 345, 688–693 (2014).
5. Eskens, F. A. et al. Phase I pharmacokinetic and pharmacodynamic study of thefirst-in-class spliceosome inhibitor E7107 in patients with advanced solidtumors. Clin. Cancer Res. 19, 6296–6304 (2013).
6. Hong, D. S. et al. A phase I, open-label, single-arm, dose-escalation study ofE7107, a precursor messenger ribonucleic acid (pre-mRNA) splicesomeinhibitor administered intravenously on days 1 and 8 every 21 days to patientswith solid tumors. Invest. New Drugs 32, 436–444 (2014).
7. Palacino, J. et al. SMN2 splice modulators enhance U1-pre-mRNA associationand rescue SMA mice. Nat. Chem. Biol. 11, 511–517 (2015).
8. Kaida, D. et al. Spliceostatin A targets SF3b and inhibits both splicing andnuclear retention of pre-mRNA. Nat. Chem. Biol. 3, 576–583 (2007).
NATURE COMMUNICATIONS | DOI: 10.1038/ncomms15522 ARTICLE
NATURE COMMUNICATIONS | 8:15522 | DOI: 10.1038/ncomms15522 | www.nature.com/naturecommunications 15

9. Kotake, Y. et al. Splicing factor SF3b as a target of the antitumor naturalproduct pladienolide. Nat. Chem. Biol. 3, 570–575 (2007).
10. Hasegawa, M. et al. Identification of SAP155 as the target of GEX1A(Herboxidiene), an antitumor natural product. ACS Chem. Biol. 6, 229–233 (2011).
11. Sellers, W. R. A blueprint for advancing genetics-based cancer therapy. Cell147, 26–31 (2011).
12. Yokoi, A. et al. Biological validation that SF3b is a target of the antitumormacrolide pladienolide. FEBS J. 278, 4870–4880 (2011).
13. Korpal, M. et al. An F876L mutation in androgen receptor confers geneticand phenotypic resistance to MDV3100 (enzalutamide). Cancer Discov. 3,1030–1043 (2013).
14. Adams, D. J. et al. NAMPT is the cellular target of STF-31-like small-moleculeprobes. ACS Chem. Biol. 9, 2247–2254 (2014).
15. Yan, C., Wan, R., Bai, R., Huang, G. & Shi, Y. Structure of a yeast activatedspliceosome at 3.5 A resolution. Science 353, 904–911 (2016).
16. van Roon, A. M. et al. Solution structure of the U2 snRNP protein Rds3p revealsa knotted zinc-finger motif. Proc. Natl Acad. Sci. USA 105, 9621–9626 (2008).
17. Naftelberg, S., Schor, I. E., Ast, G. & Kornblihtt, A. R. Regulation of alternativesplicing through coupling with transcription and chromatin structure. Annu.Rev. Biochem. 84, 165–198 (2015).
18. Amit, M. et al. Differential GC content between exons and introns establishesdistinct strategies of splice-site recognition. Cell Rep. 1, 543–556 (2012).
19. Gao, Y. & Koide, K. Chemical perturbation of Mcl-1 pre-mRNA splicing toinduce apoptosis in cancer cells. ACS Chem. Biol. 8, 895–900 (2013).
20. Gao, Y., Trivedi, S., Ferris, R. L. & Koide, K. Regulation of HPV16 E6 and MCL1by SF3B1 inhibitor in head and neck cancer cells. Sci. Rep. 4, 6098 (2014).
21. Xargay-Torrent, S. et al. The splicing modulator sudemycin induces a specificantitumor response and cooperates with ibrutinib in chronic lymphocyticleukemia. Oncotarget 6, 22734–22749 (2015).
22. Krishna, S. S., Majumdar, I. & Grishin, N. V. Structural classification of zincfingers: survey and summary. Nucleic Acids Res. 31, 532–550 (2003).
23. Gamsjaeger, R., Liew, C. K., Loughlin, F. E., Crossley, M. & Mackay, J. P. Stickyfingers: zinc-fingers as protein-recognition motifs. Trends Biochem. Sci. 32,63–70 (2007).
24. Holm, L. & Rosenstrom, P. Dali server: conservation mapping in 3D. NucleicAcids Res. 38, W545–W549 (2010).
25. Folco, E. G., Coil, K. E. & Reed, R. The anti-tumor drug E7107 reveals anessential role for SF3b in remodeling U2 snRNP to expose the branch point-binding region. Genes Dev. 25, 440–444 (2011).
26. Galej, W. P. et al. Cryo-EM structure of the spliceosome immediately afterbranching. Nature 537, 197–201 (2016).
27. Wan, R., Yan, C., Bai, R., Huang, G. & Shi, Y. Structure of a yeast catalytic step Ispliceosome at 3.4 A resolution. Science 353, 895–904 (2016).
28. Hubert, C. G. et al. Genome-wide RNAi screens in human brain tumor isolatesreveal a novel viability requirement for PHF5A. Genes Dev. 27, 1032–1045 (2013).
29. Lagisetti, C. et al. Pre-mRNA splicing-modulatory pharmacophores: the totalsynthesis of herboxidiene, a pladienolide-herboxidiene hybrid analog andrelated derivatives. ACS Chem. Biol. 9, 643–648 (2014).
30. Corrionero, A., Minana, B. & Valcarcel, J. Reduced fidelity of branch pointrecognition and alternative splicing induced by the anti-tumor drugspliceostatin A. Genes Dev. 25, 445–459 (2011).
31. Sakharkar, M. K., Chow, V. T. & Kangueane, P. Distributions of exons andintrons in the human genome. In Silico Biol. 4, 387–393 (2004).
32. Zhang, J., Kuo, C. C. & Chen, L. GC content around splice sites affects splicingthrough pre-mRNA secondary structures. BMC Genomics 12, 90 (2011).
33. Kfir, N. et al. SF3B1 association with chromatin determines splicing outcomes.Cell Rep. 11, 618–629 (2015).
34. Shi, J. et al. Discovery of cancer drug targets by CRISPR-Cas9 screening ofprotein domains. Nat. Biotechnol. 33, 661–667 (2015).
35. Schenone, M., Dancik, V., Wagner, B. K. & Clemons, P. A. Target identificationand mechanism of action in chemical biology and drug discovery. Nat. Chem.Biol. 9, 232–240 (2013).
36. Wacker, S. A., Houghtaling, B. R., Elemento, O. & Kapoor, T. M. Usingtranscriptome sequencing to identify mechanisms of drug action and resistance.Nat. Chem. Biol. 8, 235–237 (2012).
37. Ghosh, A. K. & Chen, Z. H. Enantioselective syntheses of FR901464 andspliceostatin A: potent inhibitors of spliceosome. Org. Lett. 15, 5088–5091 (2013).
38. Lagisetti, C. et al. Optimization of antitumor modulators of pre-mRNAsplicing. J. Med. Chem. 56, 10033–10044 (2013).
39. Ghosh, A. K. & Li, J. A stereoselective synthesis of (þ )-herboxidiene/GEX1A.Org. Lett. 13, 66–69 (2011).
40. Li, H. Aligning sequence reads, clone sequences and assembly contigs withBWA-MEM Preprint at https://arxiv.org/abs/1303.3997 (2013).
41. Cibulskis, K. et al. Sensitive detection of somatic point mutations in impure andheterogeneous cancer samples. Nat. Biotechnol. 31, 213–219 (2013).
42. Weber, J. A., Aldana, R., Gallagher, B. D. & Edwards, J. S. Sentieon DNApipeline for variant detection—software-only solution, over 20� faster thanGATK 3.3 with identical results. PeerJ PrePrints 4, e1672v2 (2016).
43. Pellizzoni, L., Kataoka, N., Charroux, B. & Dreyfuss, G. A novel function forSMN, the spinal muscular atrophy disease gene product, in pre-mRNA splicing.Cell 95, 615–624 (1998).
44. Winter, G., Lobley, C. M. & Prince, S. M. Decision making in xia2. ActaCrystallogr. D 69, 1260–1273 (2013).
45. Battye, T. G., Kontogiannis, L., Johnson, O., Powell, H. R. & Leslie, A. G.iMOSFLM: a new graphical interface for diffraction-image processing withMOSFLM. Acta Crystallogr. D 67, 271–281 (2011).
46. Skubak, P. & Pannu, N. S. Automatic protein structure solution from weakX-ray data. Nat. Commun. 4, 2777 (2013).
47. Sheldrick, G. M. Experimental phasing with SHELXC/D/E: combining chaintracing with density modification. Acta Crystallogr. D 66, 479–485 (2010).
48. Murshudov, G. N., Vagin, A. A. & Dodson, E. J. Refinement of macromolecularstructures by the maximum-likelihood method. Acta Crystallogr. D 53, 240–255(1997).
49. Emsley, P., Lohkamp, B., Scott, W. G. & Cowtan, K. Features and developmentof Coot. Acta Crystallogr. D 66, 486–501 (2010).
50. Dobin, A. et al. STAR: ultrafast universal RNA-seq aligner. Bioinformatics 29,15–21 (2013).
51. Darman, R. B. et al. Cancer-associated SF3B1 hotspot mutations induce Cryptic30 splice site selection through use of a different branch point. Cell Rep. 13,1033–1045 (2015).
52. Smyth, G. K. Linear models and empirical bayes methods for assessingdifferential expression in microarray experiments. Stat. Appl. Genet. Mol. Biol.3, Article3 (2004).
AcknowledgementsWe would like to thank Yigong Shi’s lab for kindly sharing the coordinates for the yeastB-act complex prior to release. We also thank Milena Virrankoski, Laura Ankstitus,Megan Sheehan, Andrew Cook, Dominic Reynolds, John Wang, Anant Agrawal, CraigFurman and Rachel Darman from H3 Biomedicine for technical assistance and scientificdiscussion. We are grateful to Eisai Co., Ltd for providing E7107 and herboxidiene. Thiswork was supported by H3 Biomedicine.
Author contributionsT.T., J.H.T., N.L., P.Z. and M.W. conceived of and designed the project. T.T., J.H.T., X.P.,N.L., P.Z. and M.W. designed and performed experiments. M.S., S.Peng and Z.J.W.performed bioinformatics analyses. J.T.L., B.G., S.Prajapati and X.L. contributed tosynthesis and QC of chemical probes. D.A., S.B., B.Caleb, B.Chan, L.C., P.F., C.K., M.K.,Y.M., E.P., J.P., P.G.S., V.S. and J.Z. developed assays, assisted with experiments and datainterpretation or analysis. L.Y., A.C., M.W., N.L. and P.Z. supervised the research. T.T.,J.H.T., N.L. and P.Z. wrote the manuscript and all authors contributed to writing orprovided feedback.
Additional informationSupplementary Information accompanies this paper at http://www.nature.com/naturecommunications
Competing interests: The authors are employees of H3 Biomedicine that has an interestin developing splicing modulators for therapeutics.
Reprints and permission information is available online at http://npg.nature.com/reprintsandpermissions/
How to cite this article: Teng, T. et al. Splicing modulators act at the branch pointadenosine binding pocket defined by the PHF5A–SF3b complex. Nat. Commun. 8,15522 doi: 10.1038/ncomms15522 (2017).
Publisher’s note: Springer Nature remains neutral with regard to jurisdictional claims inpublished maps and institutional affiliations.
This work is licensed under a Creative Commons Attribution 4.0International License. The images or other third party material in this
article are included in the article’s Creative Commons license, unless indicated otherwisein the credit line; if the material is not included under the Creative Commons license,users will need to obtain permission from the license holder to reproduce the material.To view a copy of this license, visit http://creativecommons.org/licenses/by/4.0/
r The Author(s) 2017
ARTICLE NATURE COMMUNICATIONS | DOI: 10.1038/ncomms15522
16 NATURE COMMUNICATIONS | 8:15522 | DOI: 10.1038/ncomms15522 | www.nature.com/naturecommunications