Embed Size (px)
Citation preview

1
(Physical Chemistry Chemical Physics, in press)
Spin-glass behavior and pyroelectric anomalies in a new lithium-
based oxide, Li3FeRuO5
Sanjay Kumar Upadhyay, P.L. Paulose, Kartik K Iyer, and E.V. Sampathkumaran
Tata Institute of Fundamental Research, Homi Bhabha Road, Colaba, Mumbai 400005, India
ABSTRACT
The results of dc and ac magnetization, heat-capacity, 57Fe Mӧssbauer spectroscopy, dielectric,
pyroelectric current and isothermal magneto-capacitance measurements on a recently reported lithium-
rich layered oxide, Li3FeRuO5, related to LiCoO2-type (rhombohedral, space group R3̅m), are presented.
The results reveal that the compound undergoes spin-glass freezing at 15 K. There is a peak around 34
K in pyroelectric data, which can not be attributed to ferroelectricity, but to the phenomenon of
thermally stimulated depolarization current. As revealed by magnetocapacitance data above and below
magnetic ordering temperature, magnetic and electric dipoles appeared to be coupled, thereby offering
evidence for magnetodielectric coupling.

2
Introduction In an attempt to find new cathode materials for Li-ion batteries derived from layered oxides,
LiCoO2 and Li2MnO3, the synthesis of a rock salt related oxide, Li3FeRuO5, was reported by Laha et al
[1] recently. This oxide was reported to order antiferromagnetically below 15 K. However, there is an
intrinsic crystallographic disorder in this material (see below) and so one would expect that the exchange
interaction must be sufficiently random that a long range magnetic order with a periodicity of magnetic
structure would not be favoured. This is the primary motivation with which we have taken up this oxide
for detailed magnetic investigations. The results establish that this oxide indeed exhibits spin-glass
characteristics. In addition, we have carried out dielectric and pyro-electric studies, the results of which
are also reported in this article.
The rhombohedral crystal structure (space group R3̅m) in which the compound forms is related to
that of cation-ordered rock-salt superstructure oxides, forming in LiCoO2-type structure [2]. LiCoO2 is
made up of cubic close-packed oxygen array, with Li and Co ions occupying independent octahedral
sites; the planes containing LiO2 and CoO2 alternate along [111] direction. In the compound under
investigation, it was found that 3a site is mostly occupied by Li atom, while 3b site is occupied by Fe
and Ru atom (almost equally). A fraction (<2%) of Fe and Ru goes to 3a site and around 20% of Li
occupies 3b site. If we ignore a mixing of 2% of Fe and Ru at 3a site, the structure essentially consists
of LiO6 octahedra alternating with (Li1/5Fe2/5Ru2/5O6) layer, running along the c-direction as shown in
figure 1.
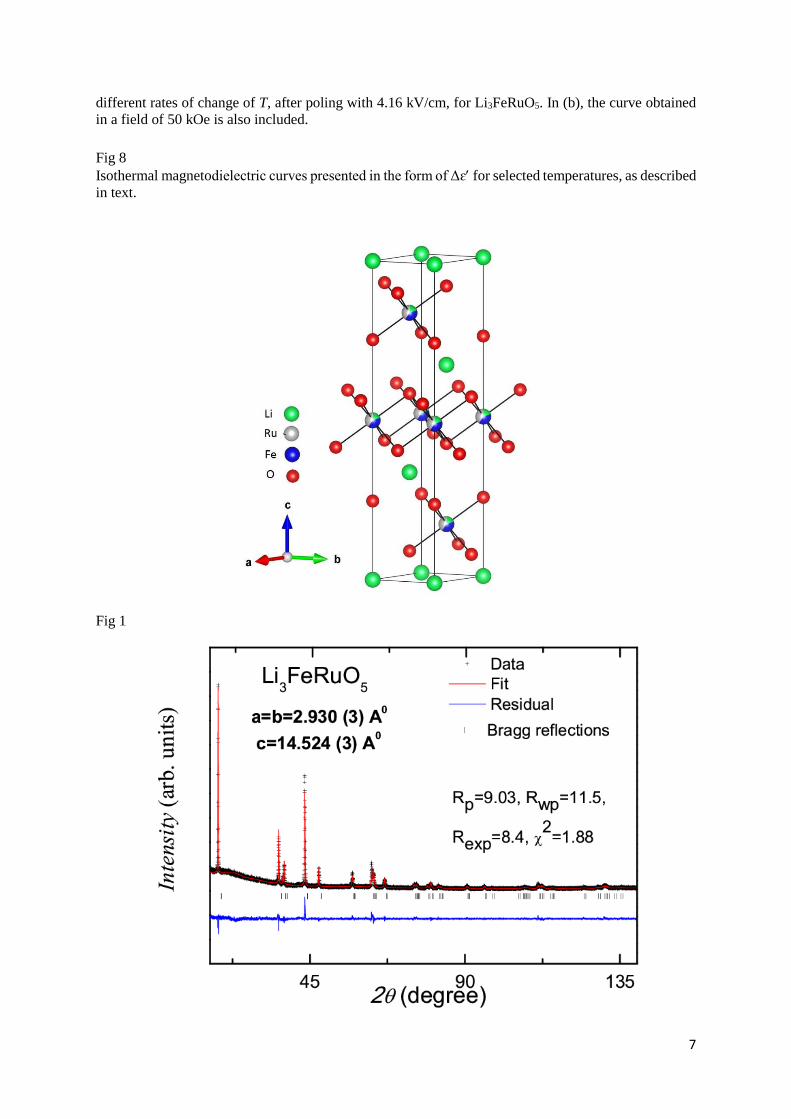
Experimental details The polycrystalline Li3FeRuO5 was prepared by the conventional solid state route. The
stoichiometric amounts of high purity (>99.9%) Li2CO3, Fe2O3 and RuO2 were mixed together in an
agate mortar, following by calcination at 925 0C for 12 hours. The heat-treated powder after grinding
was then pre-sintered at 1025 0C for 12 hours. Final sintering was done at 1100 0C for 12 hours. X-ray
diffraction (XRD) measurement was carried out with Cu Kα (λ =1.54 A0) and the pattern obtained is
shown in figure 2. Within the detection limit (<2%) of the XRD technique, the prepared sample was
found to be the single phase (rhombohedra, R3̅m space group). The experimental data was subjected to
Rietveld refinement by using Fullprof programme [3]. The disorder among Li, Fe and Ru, as reported
in Ref. 1, was taken into account, while refining. The lattice parameters are in good agreement with the
literature [1].
Temperature (T) dependent dc magnetization (M) studies were carried out with the help of a
commercial SQUID magnetometer (Quantum Design, USA) and ac magnetic susceptibility (χ) studies
with different frequencies (ν= 1.3, 13, 133, and 1333 Hz) with a ac field of 1 Oe were also carried out
with the same magnetometer. 57Fe Mӧssbauer effect studies were carried out on the powder using a
conventional constant acceleration spectrometer with a 57Co source. The velocity calibration was carried
out using a α-Fe absorber, and the typical linewidth obtained in our spectrometer was 0.28 mm/s. The
isomer shift (IS) reported is relative to α-Fe. Heat-capacity (C) studies were carried with a commercial
Physical Properties Measurements System (Quantum Design, USA). The same system was used to
measure complex dielectric permittivity using an Agilent E4980A LCR meter with a home-made
sample holder with several frequencies (1 kHz to 100 kHz) and with a bias voltage of 1 V; this sample
holder was also used for pyroelectric studies with Keithley 6517B electrometer by poling at 100 K with
different electric fields. Unlike otherwise stated, all the measurements were performed for zero-field-
cooled condition (ZFC, from 330 K) of the specimen.
Results Dc magnetization
Figure 3a shows inverse dc χ(T) of Li3FeRuO5 measured in the presence of (H=) 5 kOe for the ZFC
protocol. Inverse χ curve was fitted by using the modified Curie-Weiss law in the temperature interval
of 55- 175 K, accounting for 0.067 emu/mol due to magnetic impurity. The value of the effective
moment obtained from this fitting is about 6.54 μB per formula unit which is very close to that expected

3
(6.55 μB) for trivalent Fe (S=5/2; high-spin) and tetra-valent Ru (S=1, low-spin) ions. If one has to
derive the value of the magnetic moment from the higher temperature region, there is a need to suppress
the impurity contribution by measuring at much higher fields. Therefore, we measured χ(T) in the
presence of a high field of 30 kOe; the value of the effective moment from the Curie-Weiss fitting in
the range 250-350 K turns out to be the same. The value of the paramagnetic Curie-temperature is
found to be -18 K, indicating dominance of antiferromagnetic correlations. These findings are in good
agreement with those reported by Laha et. al. [1] from the measurements with 50 Oe in the temperature
range of 30 - 100 K. We have obtained the curves with a low-field of 100 Oe as well (figure 3a, inset).
While ZFC curve qualitatively resembles that obtained with 5 kOe, the field-cooled (FC) curve deviates
from this curve below 300 K, as observed in Ref. 1, attributable to traces of unreacted iron oxide. There
is no downfall below 15 K in FC curve, but there is a tendency to flatten unlike in ZFC curve, which is
a characteristic feature of spin-glasses.
We have measured isothermal magnetic hysteresis loops at selected temperatures (1.8 and 10 K) in
the magnetically ordered state (see figure 3b). The curves show weak hysteretic behavior at low fields,
but there is no evidence for saturation at high fields (even till 140 kOe, not shown here). Therefore,
ferromagnetism is ruled out in this material. Viewed together with ZFC-FC χ(T) behavior, this M(H)
behaviour can be attributed to spin-glass freezing. In order to ascertain spin-glass freezing, we
performed other magnetic and heat-capacity measurements, the results of which are described below.
Finally, we have also shown the M(H) curve for 300 K in the inset of figure 3b. The plot is linear,
characteristic of paramagnetism, except for the fact that there is a weak upturn close to zero-field,
attributable to magnetic impurity. The value of the moment extrapolated to zero field from the high-
field linear region for this 300K-plot is less than 0.05μB, and this value is consistent with only less than
2% of, say, Fe3O4.
Heat capacity Figure 3c shows the plot of C(T) below 125 K obtained in the absence of external magnetic field
as well as in 10 kOe. There is no evidence for any λ-anomaly (characterizing ferromagnetism or
antiferromagnetism) down to 1.8 K in C(T). This result is in favour of spin-glass freezing. A shoulder
in the plot of C/T appears as a manifestation of spin-glass freezing (see figure 3c). The in-field curve
overlaps with that obtained in zero field without any feature attributable to field-induced magnetic
ordering. We could not obtain the values for electronic term to heat-capacity and the Debye
temperature, as we find it difficult to see a wide linear range in the plot of C/T versus T2 below 20 K
due to the presence of the broad weak-shoulder in C/T. It is worth mentioning that the heat-capacity
value at 300 K is about 238 J/mol K, which is in good agreement with the value of Dulong-Petit law
for a molecule containing 10 atoms (249 J/mol K).
Ac susceptibility
Figure 4a shows the real (χ) and imaginary parts (χ) of ac χ behavior. It is obvious that, following
the increase with a lowering of temperature, there is a peak in both these parts around 15 K agreeing
with the dc magnetization behavior. χ and χ data reveal frequency dispersion which is a characteristic
feature of spin glass freezing. We also measured the ac χ in different magnetic fields (10 and 20 kOe)
and the frequency dependence of the peak is completely suppressed, that is, the curves overlap for
different ν with a dramatic reduction in the values at the peaks. In fact, χ is featureless in the high-field
curves (and hence not shown in the figure). These findings are supportive of spin-glass ordering in zero
field.
We have analysed the ac χ results with the power law, τ/τ0 = (Tf/Tg − 1)−zν [4]. Here, τ represents
the observation time (1/2πν), τ0 is the microscopic relaxation time, Tg is the spin-glass transition
temperature, Tf corresponds to freezing temperature for a given observation time and zv is the critical
exponent. For the feature around 15 K, we obtained Tg ≈14 K, zν ≈ 6.59 and τ0 ≈ 8.8x10⁻¹² sec. For a
conventional spin glasses, the zν value falls in the range ~4-13, and τ0 value ranges between 10−10 and
10−13 s. It is clear that the values of τ0 obtained are in agreement with that for the conventional spin
glasses [5].

4
Isothermal remnant magnetization (MIRM) We measured MIRM at four selected temperatures, 1.8, 10, 40 and 150 K. The specimen was zero-
field-cooled to desired temperature, and then a field of 5 kOe was applied. After waiting for some time,
the field was switched off, and then MIRM was measured as a function of time (t). We find that MIRM
attained insignificantly small values within seconds of reducing the field to zero at 40 and 150 K;
however, it decays slowly with t at other temperatures, as shown in figure 4b. This behavior of MIRM
offers support to spin-glass dynamics. The curves were fitted to a stretched exponential form of the type
MIRM(t) = MIRM(0)[1+Aexp(-t/τ)1-n), where A and n are constants and τ here is the relaxation time. It is
found that the value of n at 1.8 K and 10 K are 0.5 and 0.65 respectively. The values of relaxation times
τ are ~2100 sec at 1.8 K and ~870 sec for 10 K. These values are in fact in agreement with that reported
for spin-glasses [6].
Memory effect in dc magnetization In order to look for ‘memory’ effect, characterizing spin-glasses [7, 8], we obtained χ(T) curves in
different ways. In addition to ZFC curve in the presence of 100 Oe without a long wait at any
temperature (which is a reference curve), we have obtained a ZFC curve after waiting at two
temperatures 10 and 40 K for 3 hours each. We obtained the difference between these two curves and
plotted the same as ΔM versus T in figure 4c. It is distinctly clear that there is a clear ‘dip’ at 10 K, and
there is no dip at 40 K. This conclusively establishes spin-glass freezing in this compound.
Waiting time dependence of dc magnetization We looked for aging effects [9, 10] in dc magnetization at 10 K, which is below Tg, the temperature
characterizing the onset of spin-glass phase. For this purpose we have followed two different protocols:
In ZFC protocol, we cooled the sample to the desired temperature, waited for a certain period of time,
switched on a dc field of 100 Oe and measured the increase of M as a function of time. In the FC
protocol, the specimen was cooled in 100 Oe and, after waiting for a certain period, the decay of M was
measured as a function of time, after the field was switched off. The curves thus obtained for four
waiting times (tw=300, 1800, 3600 and 7200 s) are shown in figure 5. It is obvious from this figure that
there is a systematic behaviour in FC as well as in ZFC aging, as a function of waiting time. In the ZFC
plots, there is a gradual decrease in the magnetization value with waiting time. In FC aging, there is a
gradual increase in the magnetization value as we increase the waiting from 300 sec to 7200 sec. Such
a behaviour is an inherent property of frustrated spin systems. The aging behaviour is thus consistent
with spin-glass dynamics.
57Fe Mӧssbauer effect measurements
Mössbauer spectroscopy showed a paramagnetic quadrupolar split doublet at 298 K (Fig. 6a ).
However, the line width observed is 0.4 mm/s which is considerably larger than that of natural Fe in
our set-up (0.28 mm/s). This could be attributed to the crystalline site disorder as was shown from the
structural analysis. From a least square fit of the spectrum, we obtained isomer shift of 0.36 mm/s and
quadrupolar splitting of 0.5 mm/s at 298 K. Both these values are consistent with Fe in 3+ state with
S=5/2. The spectra show paramagnetic quadrupolar split doublet line down to 32 K and the quadrupolar
splitting was unchanged. Well below 32 K, characteristic signature of magnetic hyperfine splitting is
observed, but a resolved sextet could be obtained only at 16 K as can be readily seen from the figure.
The absence of magnetic hyperfine splitting at higher temperatures also establishes that the fraction of
other impurity oxides of Fe, say, Fe2O3 and Fe3O4, which are known to be in a long range magnetic
ordered state, say, at 32 K, must be negligible. A good fit to the spectra were possible only with
multiple hyperfine fields and the distribution of this field is shown in Fig. 6b. The 4.2 K spectrum could
be fit using 6 terms in narrow region around 490 kOe. The average magnetic hyperfine field at 4.2 K is
490 kOe representative for Fe3+ ions in high-spin configuration. The distribution is very broad above
4.2 K pointing to a strong inhomogeneous magnetic state. All these results establish that there is a
significant crystallographic disorder.

5
Complex permittivity and pyroelectric behaviour
Complex permittivity and pyroelectric current (Ipyro) studies also reveal interesting behaviour well
below and above Tg (~15 K). Dielectric constants (ɛ) and the loss factor (tan) are shown in figure 7a
below 100 K measured with a frequency of 100 kHz. Beyond 100 K, tan increases dramatically and
therefore extrinsic contributions tend to dominate. The observation we would like to stress is that both
ɛ and tan undergo a gradual increase with T from 1.8 K, without any apparent peak or any other
feature. Therefore, we rule out the presence of ferroelectricity below 150 K in this compound.
However, Ipyro as a function of T exhibits a distinct feature (measured with a poling voltage of 200
V corresponding to 4.16 kV/cm of the electric field). That is, the plot (figure 7b) shows a peak at about
34 K for a rate of warming of temperature (dT/dt) of 2 K/min. The peak gets inverted when poled by a
reverse field as mentioned above, though the magnitude at the peak gets lowered. We have performed
pyroelectric current measurements for different dT/dt. The results (see figure 7c) reveal that the peak in
fact shifts to higher temperatures with increasing dT/dt, for instance, to ~36 K and ~37 K for 4 K/min
and 6 K/min respectively. Such a rate dependence is not expected for ferroelectric transitions. This rate
dependence can be explained in terms of ‘thermally stimulated depolarization current (TSDC)’ [11-13],
that is, random trapping of mobile careers, which screen the applied electric field with a lowering of
temperature, and persisting for a very long time after removal of the electric field. These carriers get
released thermally, which appears as a peak in Ipyro We have also obtained the behaviour of Ipyro in the
presence of a dc magnetic field of 50 kOe and we find (see Fig. 7b) that the intensity of the peak in the
plot is slightly suppressed and shifted to a higher temperature by few degree Kelvin. Clearly magnetic
field couples to these trapped electric dipoles.
In order to explore magneto-dielectric coupling (MDE), we have performed isothermal ɛ vs H
measurements at different temperature (2, 5, 10, 15, 20 and 40 K) up to 140 kOe. Figure 8 shows the
MDE in the form Δɛ, where Δɛ = [((ɛ(H) - ɛ(0))/ɛ(0)], obtained with a measuring frequency of 100
kHz. From this figure, it is clear that there is a distinct difference in the magnitudes of Δɛ, say at 120
kOe, when the temperature is varied across Tg. That is, the value of Δɛ gets relatively larger in the
spin glass state, with respect to the values in the paramagnetic state, thereby establishing enhanced
magnetodielectric coupling in the magnetically ordered state. One would also like mention here that,
in the temperature regime of interest, the values of tanδ are in the range of 0.002-0.008, establishing
highly insulating behaviour of the material and hence the observed MDE is an intrinsic effect.
Conclusions
The material, Li3FeRuO5, which was very recently synthesized for the first time [1] is investigated
by thermal and magnetic studies as well as by 57Fe Mössbauer spectroscopy. We find that, in this
material, magnetic susceptibility obtained by ZFC protocol exhibits a peak near 15 K, while FC-χ curve
tends to flatten at low temperatures. At the same temperature, there is a peak in ac χ, which exhibits a
frequency dependence in zero field, which is suppressed by applying a dc magnetic field, typical of
canonical spin-glasses. Isothermal remnant magnetization exhibits slow decay with time, and ‘aging’
(waiting-time dependence) as well as ‘memory’ properties in dc magnetization as a function of
temperature are also observed. λ-anomaly near 15 K in heat capacity expected for antiferromagnetic or
ferromagnetic structure is also smeared. These findings conclusively establish that this compound
undergoes spin-glass freezing below 15 K in this compound. The finding that Mössbauer spectra in the
magnetically ordered state show multiple sextet patterns supports the conclusion from of the analysis
of the XRD data that there is a significant crystallographic disorder, with different Fe ions experiencing
different internal hyperfine fields, apparently due to local chemical environmental effects. We therefore
conclude that intrinsic crystallographic disorder resulting in random exchange interaction is
responsible for spin-glass freezing. Other findings we report here are: Magnetodielectric coupling gets
relatively stronger as one enters spin-glass phase; complex dielectric permittivity and pyro-electric data
rule out ferroelectricity; and there is a distinct evidence for thermally stimulated depolarization current
phenomenon in this material around 34 K, which is presumably due to trapping of charges induced by
crystallographic disorder.

6
References
1. S. Laha et. al., Phys.Chem.Chem.Phys., 2015, 17, 3749.
2. H. J. Orman and P. J. Wiseman, Acta Cryst, 1984, C40, 12.
3. J. Rodríguez-Carvajal, Physica B, 1993, 192, 55.
4. D. N. H. Nam, R. Mathieu, P. Nordblad, N. V. Khiem and N. X. Phuc, Phys. Rev. B, 2000, 62,
8989.
5. A. Malinowski, V. L. Bezusyy, R. Minikayev, P. Dziawa, Y. Syryanyy, and M. Sawicki, Phys.
Rev. B, 2011, 84, 024409.
6. Q. Xu et al., Sci. Rep., 2014, 5, 9093 and references therein.
7. M. Vasilakaki, K.N. Trohidou, D. Peddis, D. Fiorani, R. Mathieu, M. Hudl, P. Nordblad, C.
Binns, and S. Baker, Phys. Rev. B, 2013, 88, 140402(R).
8. See, for instance, V.V. Shvartsman, S. Bedanta, P. Borisov, W. Kleemann, A. Tkach and P. M.
Vilarinho, Phys. Rev. Lett., 2008, 101, 165704.
9. C. A. Cardoso, F. M. Araujo-Moreira, V. P. S. Awana, E. T.-Muromachi, O. F. de Lima, H.
Yamauchi, and M. Karppinen, Phys. Rev., 2003, 67, 020407(R).
10. M. Sasaki, P.E. Jonsson, H. Takayama, and H. Mamiya, Phys. Rev. B 2005, 71, 104405.
11. C. Bucci, R. Fieschi, and G. Guide, Phys. Rev., 1966, 148, 816.
12. Tao Zou, Zhiling Dun, Huibo Cao, Mengze Zhu, Daniel Coulter, Haidong Zhou, and Xianglin
Ke, App. Phys. Lett., 2014, 105, 052906.
13. Y. Kohara, Y. Yamasaki, Y. Onose, and Y. Tokura, Phys. Rev. B, 2010, 82, 104419.
Figure captions
Fig 1
Crystal structure of Li3FeRuO5 viewed along the [100] direction ignoring crystallographic disorder at
3a site as mentioned in the text.
Fig 2
X-ray diffraction pattern of Li3FeRuO5 along with the Reitveld refinement and derived parameters.
Fig 3
For Li3FeRuO5, (a) inverse magnetic susceptibility measured with 5 kOe, is plotted with a line fitted
with the Curie-Weiss equation in the range 75-175 K, with the curves obtained with 100 Oe for both
ZFC and FC conditions of measurements, in the inset, (b) isothermal magnetization hysteresis loops at
1.8 and 10 K with the M(H) curve for 300 K in the inset. And (c) Heat-capacity of Li3FeRuO5 in zero
field as well as in 10 kOe. Fig 4
For Li3FeRuO5, (a) real and imaginary parts of ac susceptibility measured with various frequencies (1.3,
13, 133 and 1333 Hz), with the arrows showing the direction in which the peaks shift with increasing
frequency. The data points have been omitted for the sake of clarity and only the lines through data
points are shown. (b) Isothermal remnant magnetization at 1.8, 10 and 40 K, and (c) the difference in
magnetization curves, ΔM, obtained with and without waiting at 10 and 40 K. In figure (a), ac data in
the presence of dc magnetic fields of 10 and 20 kOe are also shown.
Fig 5
Dc magnetization as a function of time (waiting time dependence or aging experiments) for (a) zero-
field-cooled (ZFC) and (b) field-cooled (FC) protocols as described in the text for Li3FeRuO5 for 10 K.
Arrows are drawn to identify to show how the curves shift with increasing waiting time.
Fig 6
For Li3FeRuO5, (a) 57Fe Mӧssbauer spectra and (b) Probability distribution as a function of hyperfine
field, at various selected temperatures.
Fig 7
For Li3FeRuO5, temperature dependence of (a) dielectric constant (ɛ) and (in the inset) loss factor
(tan ) measured with 100 kHz, (b) pyroelectric current, Ipyro, obtained by increasing the temperature at
the rate of 2K/min after poling by 4.16 kV/cm and -4.16 kV/cm; and (c) Ipyro as a function of T for
7
different rates of change of T, after poling with 4.16 kV/cm, for Li3FeRuO5. In (b), the curve obtained
in a field of 50 kOe is also included.
Fig 8
Isothermal magnetodielectric curves presented in the form of Δɛ for selected temperatures, as described
in text.
Fig 1

8
Fig 2
Fig 3

9
Fig 4

10
Fig 5

11
Fig 6

12
Fig 7

13
Fig 8