Embed Size (px)
Citation preview
SPICES SECTORINVESTMENT PROFILE
ETHIOPIA
© s
hutte
rsto
ck.c
om
SPICES SECTORINVESTMENT PROFILE
ETHIOPIA
2016

4
SP
ICE
S S
EC
TOR
INVE
STM
EN
T P
RO
FILE
: ETH
IOP
IA
ACKNOWLEDGEMENTS
This profile has been produced under the framework of Supporting Indian Trade and Investment for Africa (SITA) project, funded by the Department for International Development, Government of the United Kingdom and implemented by the International Trade Centre. SITA is a South-South Trade and Investment project aimed at improving competitiveness of select value chains; and increasing investment in five Eastern African countries through partnerships with institutions and businesses from India.
Special contributions to writing this report have been provided by:
Ministry of Industry
Ministry of Foreign Affairs
Ministry of Finance and Economic development
National Bank of Ethiopia
Ethiopian Pulses, Oilseeds and Spices Processors - Exporters Association
Addis Ababa Science and Technology University
Teppi Spices Research Institution
Quality Assurance:
International Trade Centre (ITC), Trade Facilitation and Policy for Business Section (TFPB)TCA Ranganathan, External consultant, Rajesh Aggarwal, Chief (TFPB), Andrew Huelin, Associate Programme Advisor (TFPB)
Author: Atsede Assefa Mekuria
Design: Iva Stastny Brosig, Design plus
Editor: Vanessa Finaughty
The views expressed in this report are those of the authors and do not represent the official position of the International Trade Centre, Ethiopian Investment Commission and the Government of the United Kingdom. The images used in this profile may not always reflect accurately the country context.
© International Trade Centre 2016
5
SP
ICE
S S
EC
TOR
INVE
STM
EN
T P
RO
FILE
: ETH
IOP
IA
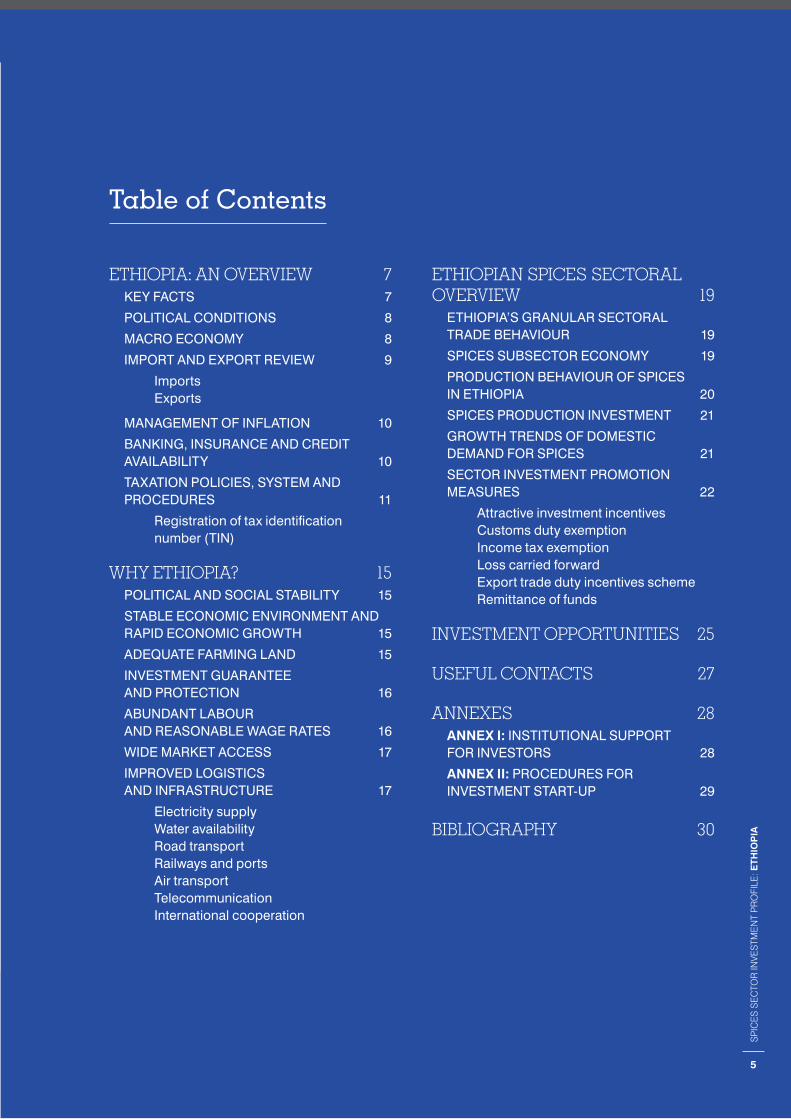
Table of Contents
ETHIOPIA: AN OVERVIEW 7KEY FACTS 7
POLITICAL CONDITIONS 8
MACRO ECONOMY 8
IMPORT AND EXPORT REVIEW 9
Imports Exports
MANAGEMENT OF INFLATION 10
BANKING, INSURANCE AND CREDIT AVAILABILITY 10
TAXATION POLICIES, SYSTEM AND PROCEDURES 11
Registration of tax identification number (TIN)
WHY ETHIOPIA? 15POLITICAL AND SOCIAL STABILITY 15
STABLE ECONOMIC ENVIRONMENT AND RAPID ECONOMIC GROWTH 15
ADEQUATE FARMING LAND 15
INVESTMENT GUARANTEE AND PROTECTION 16
ABUNDANT LABOUR AND REASONABLE WAGE RATES 16
WIDE MARKET ACCESS 17
IMPROVED LOGISTICS AND INFRASTRUCTURE 17
Electricity supply Water availability Road transportRailways and ports Air transport Telecommunication International cooperation
ETHIOPIAN SPICES SECTORAL OVERVIEW 19
ETHIOPIA’S GRANULAR SECTORAL TRADE BEHAVIOUR 19
SPICES SUBSECTOR ECONOMY 19
PRODUCTION BEHAVIOUR OF SPICES IN ETHIOPIA 20
SPICES PRODUCTION INVESTMENT 21
GROWTH TRENDS OF DOMESTIC DEMAND FOR SPICES 21
SECTOR INVESTMENT PROMOTION MEASURES 22
Attractive investment incentivesCustoms duty exemptionIncome tax exemptionLoss carried forward Export trade duty incentives schemeRemittance of funds
INVESTMENT OPPORTUNITIES 25
USEFUL CONTACTS 27
ANNEXES 28ANNEX I: INSTITUTIONAL SUPPORT FOR INVESTORS 28
ANNEX II: PROCEDURES FOR INVESTMENT START-UP 29
BIBLIOGRAPHY 30
5
SP
ICE
S S
EC
TOR
INVE
STM
EN
T P
RO
FILE
: ETH
IOP
IA
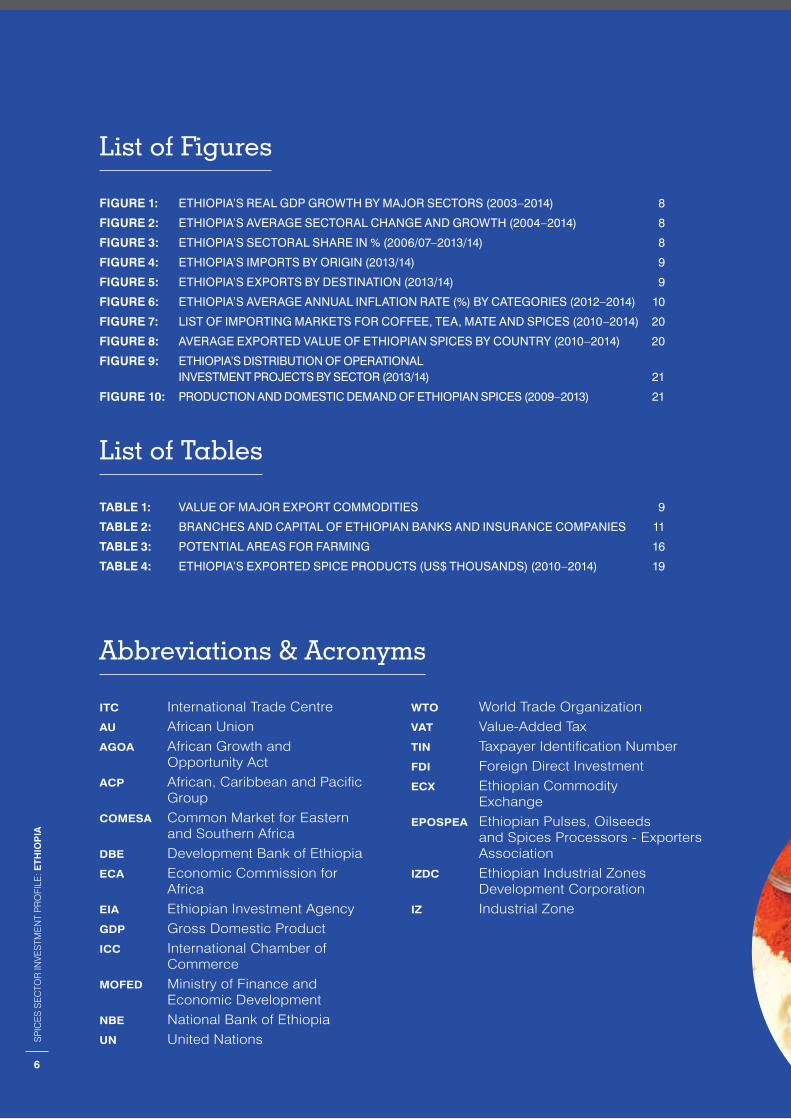
Abbreviations & Acronyms
ITC International Trade CentreAU African Union AGOA African Growth and Opportunity ActACP African, Caribbean and Pacific GroupCOMESA Common Market for Eastern and Southern AfricaDBE Development Bank of EthiopiaECA Economic Commission for AfricaEIA Ethiopian Investment Agency GDP Gross Domestic ProductICC International Chamber of CommerceMOFED Ministry of Finance and Economic DevelopmentNBE National Bank of Ethiopia UN United Nations
WTO World Trade OrganizationVAT Value-Added TaxTIN Taxpayer Identification NumberFDI Foreign Direct InvestmentECX Ethiopian Commodity ExchangeEPOSPEA Ethiopian Pulses, Oilseeds and Spices Processors - Exporters AssociationIZDC Ethiopian Industrial Zones Development CorporationIZ Industrial Zone
List of Figures
FIGURE 1: ETHIOPIA’S REAL GDP GROWTH BY MAJOR SECTORS (2003–2014) 8
FIGURE 2: ETHIOPIA’S AVERAGE SECTORAL CHANGE AND GROWTH (2004–2014) 8
FIGURE 3: ETHIOPIA’S SECTORAL SHARE IN % (2006/07–2013/14) 8
FIGURE 4: ETHIOPIA’S IMPORTS BY ORIGIN (2013/14) 9
FIGURE 5: ETHIOPIA’S EXPORTS BY DESTINATION (2013/14) 9
FIGURE 6: ETHIOPIA’S AVERAGE ANNUAL INFLATION RATE (%) BY CATEGORIES (2012–2014) 10
FIGURE 7: LIST OF IMPORTING MARKETS FOR COFFEE, TEA, MATE AND SPICES (2010–2014) 20
FIGURE 8: AVERAGE EXPORTED VALUE OF ETHIOPIAN SPICES BY COUNTRY (2010–2014) 20
FIGURE 9: ETHIOPIA’S DISTRIBUTION OF OPERATIONAL INVESTMENT PROJECTS BY SECTOR (2013/14) 21
FIGURE 10: PRODUCTION AND DOMESTIC DEMAND OF ETHIOPIAN SPICES (2009–2013) 21
List of Tables
TABLE 1: VALUE OF MAJOR EXPORT COMMODITIES 9
TABLE 2: BRANCHES AND CAPITAL OF ETHIOPIAN BANKS AND INSURANCE COMPANIES 11
TABLE 3: POTENTIAL AREAS FOR FARMING 16
TABLE 4: ETHIOPIA’S EXPORTED SPICE PRODUCTS (US$ THOUSANDS) (2010–2014) 19
6
SP
ICE
S S
EC
TOR
INVE
STM
EN
T P
RO
FILE
: ETH
IOP
IA
7
SP
ICE
S S
EC
TOR
INVE
STM
EN
T P
RO
FILE
: ETH
IOP
IA
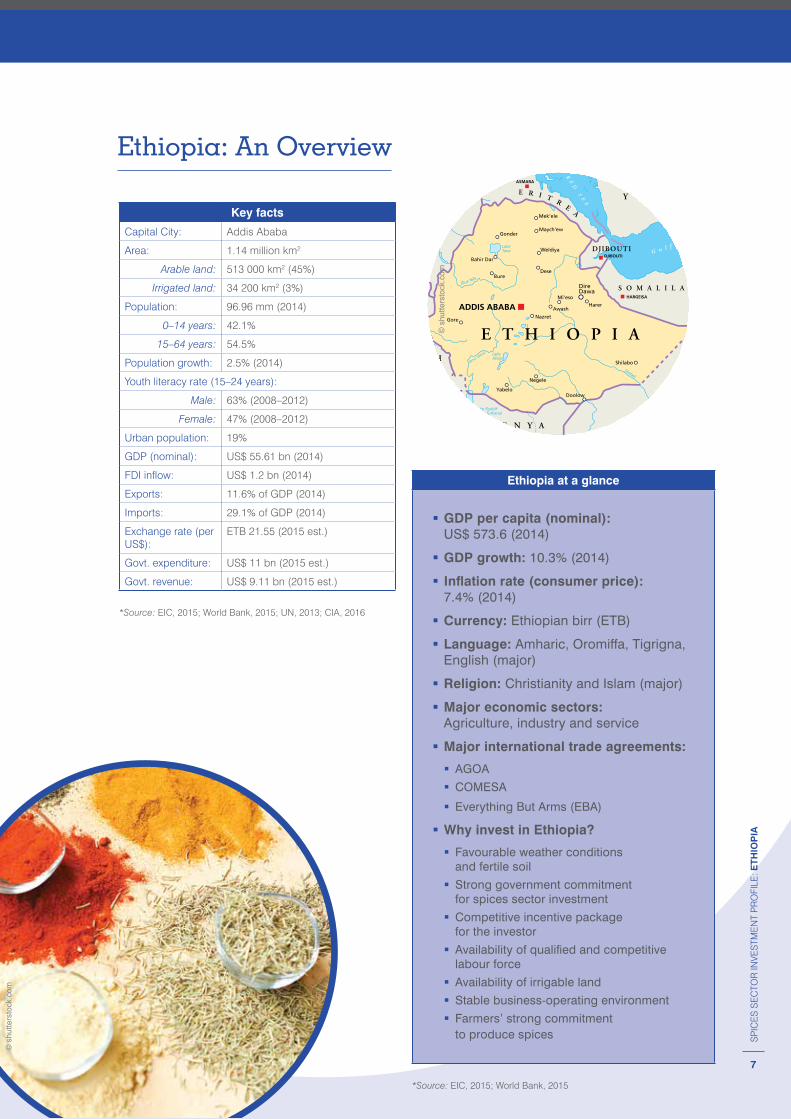
Ethiopia: An Overview
Ethiopia at a glance
� GDP per capita (nominal): US$ 573.6 (2014)
� GDP growth: 10.3% (2014)
� Inflation rate (consumer price): 7.4% (2014)
� Currency: Ethiopian birr (ETB)
� Language: Amharic, Oromiffa, Tigrigna, English (major)
� Religion: Christianity and Islam (major)
� Major economic sectors: Agriculture, industry and service
� Major international trade agreements:
� AGOA
� COMESA
� Everything But Arms (EBA)
� Why invest in Ethiopia?
� Favourable weather conditions and fertile soil
� Strong government commitment for spices sector investment
� Competitive incentive package for the investor
� Availability of qualified and competitive labour force
� Availability of irrigable land
� Stable business-operating environment
� Farmers’ strong commitment to produce spices
*Source: EIC, 2015; World Bank, 2015
© s
hutte
rsto
ck.c
om
© s
hutte
rsto
ck.c
om
Key facts
Capital City: Addis Ababa
Area: 1.14 million km2
Arable land: 513 000 km2 (45%)
Irrigated land: 34 200 km2 (3%)
Population: 96.96 mm (2014)
0–14 years: 42.1%
15–64 years: 54.5%
Population growth: 2.5% (2014)
Youth literacy rate (15–24 years):
Male: 63% (2008–2012)
Female: 47% (2008–2012)
Urban population: 19%
GDP (nominal): US$ 55.61 bn (2014)
FDI inflow: US$ 1.2 bn (2014)
Exports: 11.6% of GDP (2014)
Imports: 29.1% of GDP (2014)
Exchange rate (per US$):
ETB 21.55 (2015 est.)
Govt. expenditure: US$ 11 bn (2015 est.)
Govt. revenue: US$ 9.11 bn (2015 est.)
*Source: EIC, 2015; World Bank, 2015; UN, 2013; CIA, 2016
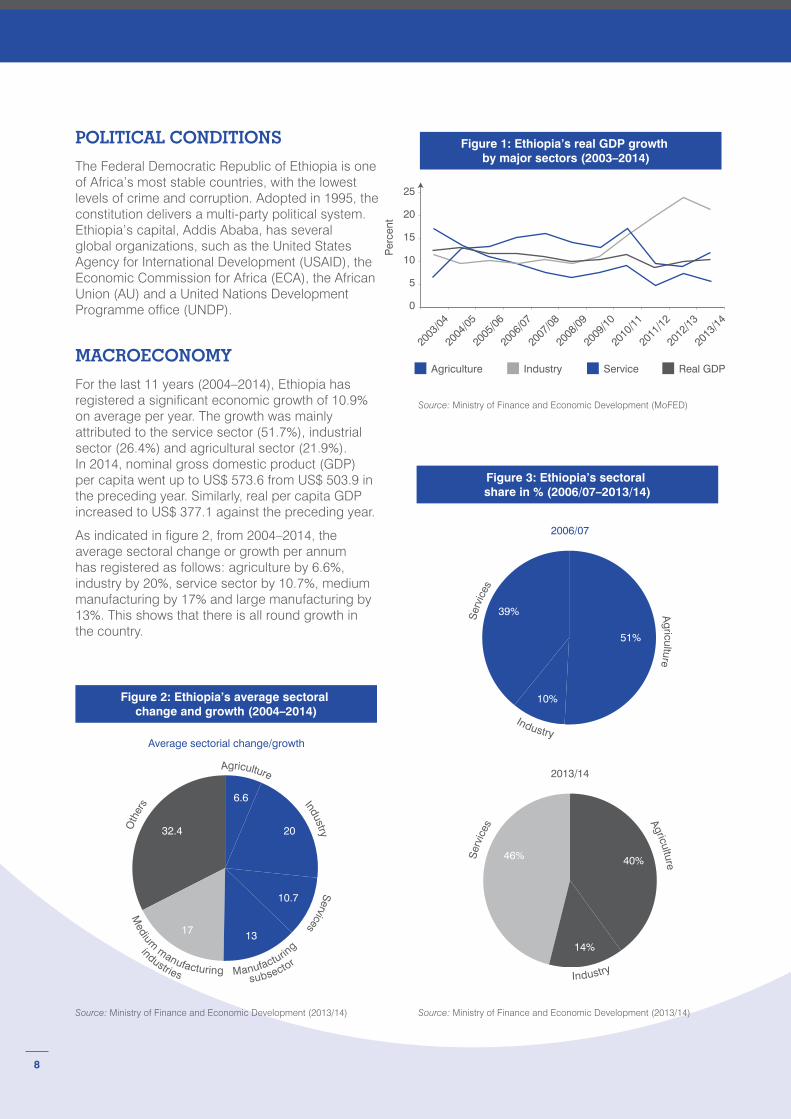
Figure 2: Ethiopia’s average sectoral change and growth (2004–2014)
Oth
ers Industry
Agriculture
Services
Manufacturin
g
subsector
Medium
manufacturing
industries
6.6
20
10.7
1317
32.4
Average sectorial change/growth
8
POLITICAL CONDITIONS
The Federal Democratic Republic of Ethiopia is one of Africa’s most stable countries, with the lowest levels of crime and corruption. Adopted in 1995, the constitution delivers a multi-party political system. Ethiopia’s capital, Addis Ababa, has several global organizations, such as the United States Agency for International Development (USAID), the Economic Commission for Africa (ECA), the African Union (AU) and a United Nations Development Programme office (UNDP).
MACROECONOMY
For the last 11 years (2004–2014), Ethiopia has registered a significant economic growth of 10.9% on average per year. The growth was mainly attributed to the service sector (51.7%), industrial sector (26.4%) and agricultural sector (21.9%). In 2014, nominal gross domestic product (GDP) per capita went up to US$ 573.6 from US$ 503.9 in the preceding year. Similarly, real per capita GDP increased to US$ 377.1 against the preceding year.
As indicated in figure 2, from 2004–2014, the average sectoral change or growth per annum has registered as follows: agriculture by 6.6%, industry by 20%, service sector by 10.7%, medium manufacturing by 17% and large manufacturing by 13%. This shows that there is all round growth in the country.
Source: Ministry of Finance and Economic Development (MoFED)
Source: Ministry of Finance and Economic Development (2013/14) Source: Ministry of Finance and Economic Development (2013/14)
Figure 1: Ethiopia’s real GDP growth by major sectors (2003–2014)
20
25
Agriculture Service Real GDPIndustry
2003
/04
2004
/05
2005
/06
2006
/07
2007
/08
2008
/09
2009
/10
15
Per
cent
10
5
0
2010
/11
2011
/12
2012
/13
2013
/14
Figure 3: Ethiopia’s sectoral share in % (2006/07–2013/14)
2006/07
2013/14
Agriculture
Agriculture
Ser
vice
sS
ervi
ces
Industry
Industry
51%
40%46%
14%
10%
39%
9
SP
ICE
S S
EC
TOR
INVE
STM
EN
T P
RO
FILE
: ETH
IOP
IA
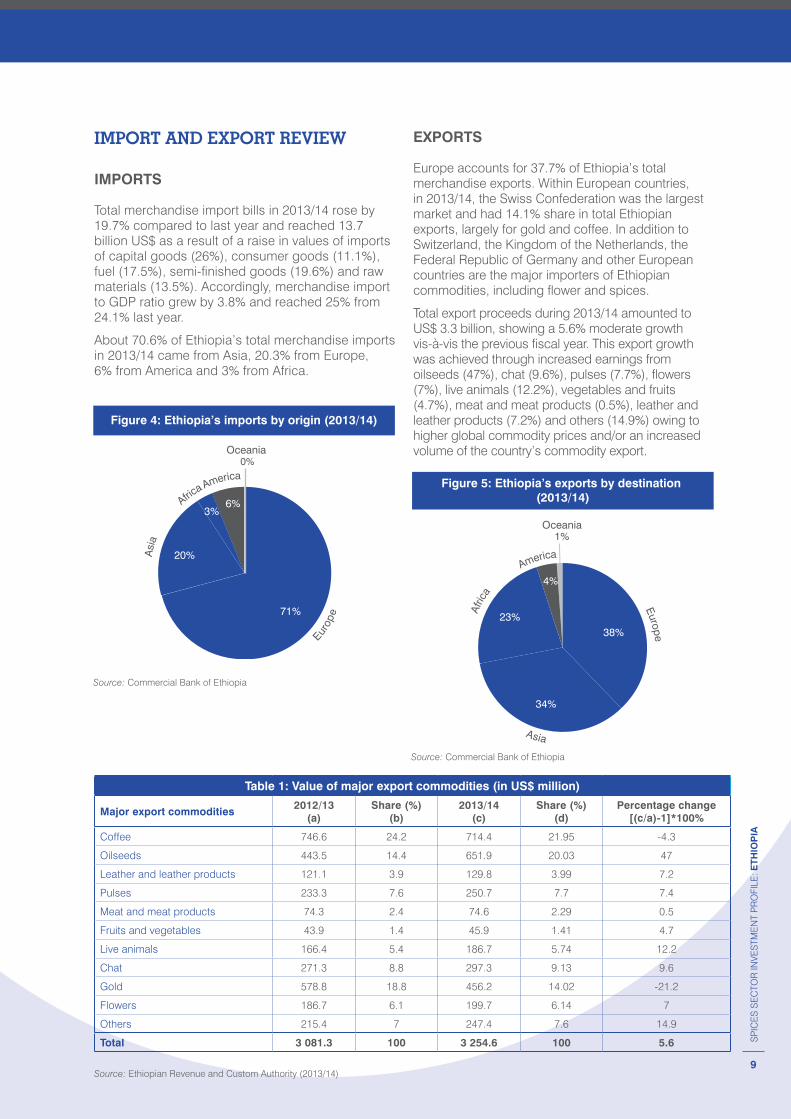
Figure 5: Ethiopia’s exports by destination (2013/14)
America
Europe
Afric
a
Asia
Oceania
38%
34%
23%
4%
1%
IMPORT AND EXPORT REVIEW
IMPORTS
Total merchandise import bills in 2013/14 rose by 19.7% compared to last year and reached 13.7 billion US$ as a result of a raise in values of imports of capital goods (26%), consumer goods (11.1%), fuel (17.5%), semi-finished goods (19.6%) and raw materials (13.5%). Accordingly, merchandise import to GDP ratio grew by 3.8% and reached 25% from 24.1% last year.
About 70.6% of Ethiopia’s total merchandise imports in 2013/14 came from Asia, 20.3% from Europe, 6% from America and 3% from Africa.
EXPORTS
Europe accounts for 37.7% of Ethiopia’s total merchandise exports. Within European countries, in 2013/14, the Swiss Confederation was the largest market and had 14.1% share in total Ethiopian exports, largely for gold and coffee. In addition to Switzerland, the Kingdom of the Netherlands, the Federal Republic of Germany and other European countries are the major importers of Ethiopian commodities, including flower and spices.
Total export proceeds during 2013/14 amounted to US$ 3.3 billion, showing a 5.6% moderate growth vis-à-vis the previous fiscal year. This export growth was achieved through increased earnings from oilseeds (47%), chat (9.6%), pulses (7.7%), flowers (7%), live animals (12.2%), vegetables and fruits (4.7%), meat and meat products (0.5%), leather and leather products (7.2%) and others (14.9%) owing to higher global commodity prices and/or an increased volume of the country’s commodity export.
Source: Ministry of Finance and Economic Development (2013/14)
Source: Commercial Bank of Ethiopia
Table 1: Value of major export commodities (in US$ million)
Major export commodities2012/13
(a)Share (%)
(b)2013/14
(c)Share (%)
(d)Percentage change
[(c/a)-1]*100%
Coffee 746.6 24.2 714.4 21.95 -4.3
Oilseeds 443.5 14.4 651.9 20.03 47
Leather and leather products 121.1 3.9 129.8 3.99 7.2
Pulses 233.3 7.6 250.7 7.7 7.4
Meat and meat products 74.3 2.4 74.6 2.29 0.5
Fruits and vegetables 43.9 1.4 45.9 1.41 4.7
Live animals 166.4 5.4 186.7 5.74 12.2
Chat 271.3 8.8 297.3 9.13 9.6
Gold 578.8 18.8 456.2 14.02 -21.2
Flowers 186.7 6.1 199.7 6.14 7
Others 215.4 7 247.4 7.6 14.9
Total 3 081.3 100 3 254.6 100 5.6
Source: Ethiopian Revenue and Custom Authority (2013/14)
Source: Commercial Bank of Ethiopia
America
Figure 4: Ethiopia’s imports by origin (2013/14)
Asi
a
Africa
Europ
e71%
20%
3%6%
0%Oceania
10
SP
ICE
S S
EC
TOR
INVE
STM
EN
T P
RO
FILE
: ETH
IOP
IA
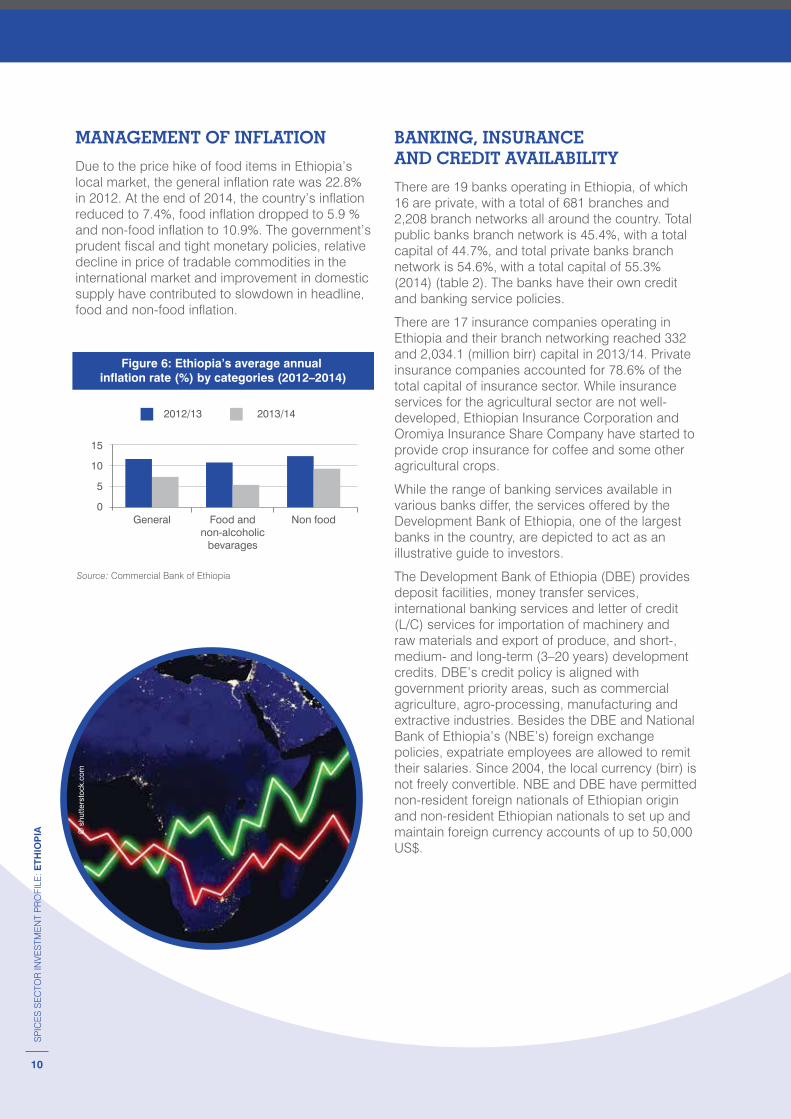
MANAGEMENT OF INFLATION
Due to the price hike of food items in Ethiopia’s local market, the general inflation rate was 22.8% in 2012. At the end of 2014, the country’s inflation reduced to 7.4%, food inflation dropped to 5.9 % and non-food inflation to 10.9%. The government’s prudent fiscal and tight monetary policies, relative decline in price of tradable commodities in the international market and improvement in domestic supply have contributed to slowdown in headline, food and non-food inflation.
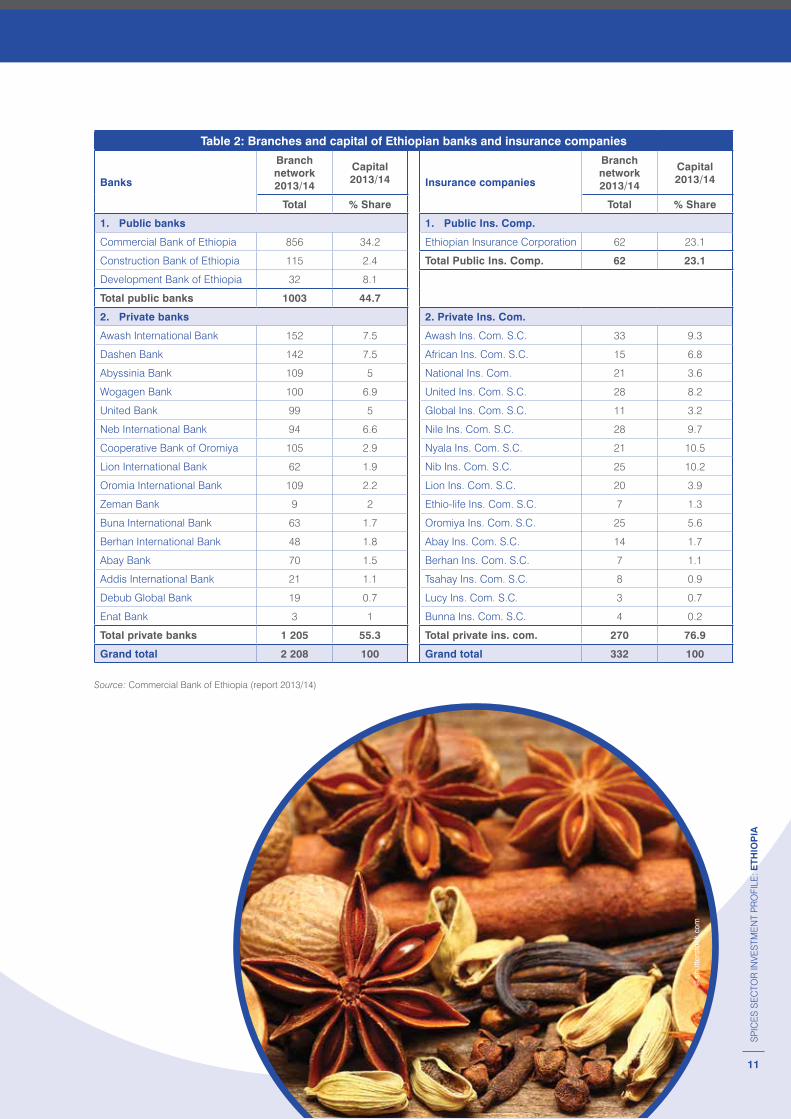
BANKING, INSURANCE AND CREDIT AVAILABILITY
There are 19 banks operating in Ethiopia, of which 16 are private, with a total of 681 branches and 2,208 branch networks all around the country. Total public banks branch network is 45.4%, with a total capital of 44.7%, and total private banks branch network is 54.6%, with a total capital of 55.3% (2014) (table 2). The banks have their own credit and banking service policies.
There are 17 insurance companies operating in Ethiopia and their branch networking reached 332 and 2,034.1 (million birr) capital in 2013/14. Private insurance companies accounted for 78.6% of the total capital of insurance sector. While insurance services for the agricultural sector are not well-developed, Ethiopian Insurance Corporation and Oromiya Insurance Share Company have started to provide crop insurance for coffee and some other agricultural crops.
While the range of banking services available in various banks differ, the services offered by the Development Bank of Ethiopia, one of the largest banks in the country, are depicted to act as an illustrative guide to investors.
The Development Bank of Ethiopia (DBE) provides deposit facilities, money transfer services, international banking services and letter of credit (L/C) services for importation of machinery and raw materials and export of produce, and short-, medium- and long-term (3–20 years) development credits. DBE’s credit policy is aligned with government priority areas, such as commercial agriculture, agro-processing, manufacturing and extractive industries. Besides the DBE and National Bank of Ethiopia’s (NBE’s) foreign exchange policies, expatriate employees are allowed to remit their salaries. Since 2004, the local currency (birr) is not freely convertible. NBE and DBE have permitted non-resident foreign nationals of Ethiopian origin and non-resident Ethiopian nationals to set up and maintain foreign currency accounts of up to 50,000 US$.
Source: Commercial Bank of Ethiopia
Figure 6: Ethiopia’s average annual inflation rate (%) by categories (2012–2014)
General Non foodFood and non-alcoholic
bevarages
0
5
10
15
2012/13 2013/14
© s
hutte
rsto
ck.c
om
11
SP
ICE
S S
EC
TOR
INVE
STM
EN
T P
RO
FILE
: ETH
IOP
IA
Table 2: Branches and capital of Ethiopian banks and insurance companies
Banks
Branch network 2013/14
Capital 2013/14 Insurance companies
Branch network 2013/14
Capital 2013/14
Total % ShareTotal % Share
1. Public banks 1. Public Ins. Comp.
Commercial Bank of Ethiopia 856 34.2 Ethiopian Insurance Corporation 62 23.1
Construction Bank of Ethiopia 115 2.4 Total Public Ins. Comp. 62 23.1
Development Bank of Ethiopia 32 8.1
Total public banks 1003 44.7
2. Private banks 2. Private Ins. Com.
Awash International Bank 152 7.5 Awash Ins. Com. S.C. 33 9.3
Dashen Bank 142 7.5 African Ins. Com. S.C. 15 6.8
Abyssinia Bank 109 5 National Ins. Com. 21 3.6
Wogagen Bank 100 6.9 United Ins. Com. S.C. 28 8.2
United Bank 99 5 Global Ins. Com. S.C. 11 3.2
Neb International Bank 94 6.6 Nile Ins. Com. S.C. 28 9.7
Cooperative Bank of Oromiya 105 2.9 Nyala Ins. Com. S.C. 21 10.5
Lion International Bank 62 1.9 Nib Ins. Com. S.C. 25 10.2
Oromia International Bank 109 2.2 Lion Ins. Com. S.C. 20 3.9
Zeman Bank 9 2 Ethio-life Ins. Com. S.C. 7 1.3
Buna International Bank 63 1.7 Oromiya Ins. Com. S.C. 25 5.6
Berhan International Bank 48 1.8 Abay Ins. Com. S.C. 14 1.7
Abay Bank 70 1.5 Berhan Ins. Com. S.C. 7 1.1
Addis International Bank 21 1.1 Tsahay Ins. Com. S.C. 8 0.9
Debub Global Bank 19 0.7 Lucy Ins. Com. S.C. 3 0.7
Enat Bank 3 1 Bunna Ins. Com. S.C. 4 0.2
Total private banks 1 205 55.3 Total private ins. com. 270 76.9
Grand total 2 208 100 Grand total 332 100
Source: Commercial Bank of Ethiopia (report 2013/14)©
shu
tters
tock
.com
12
SP
ICE
S S
EC
TOR
INVE
STM
EN
T P
RO
FILE
: ETH
IOP
IA
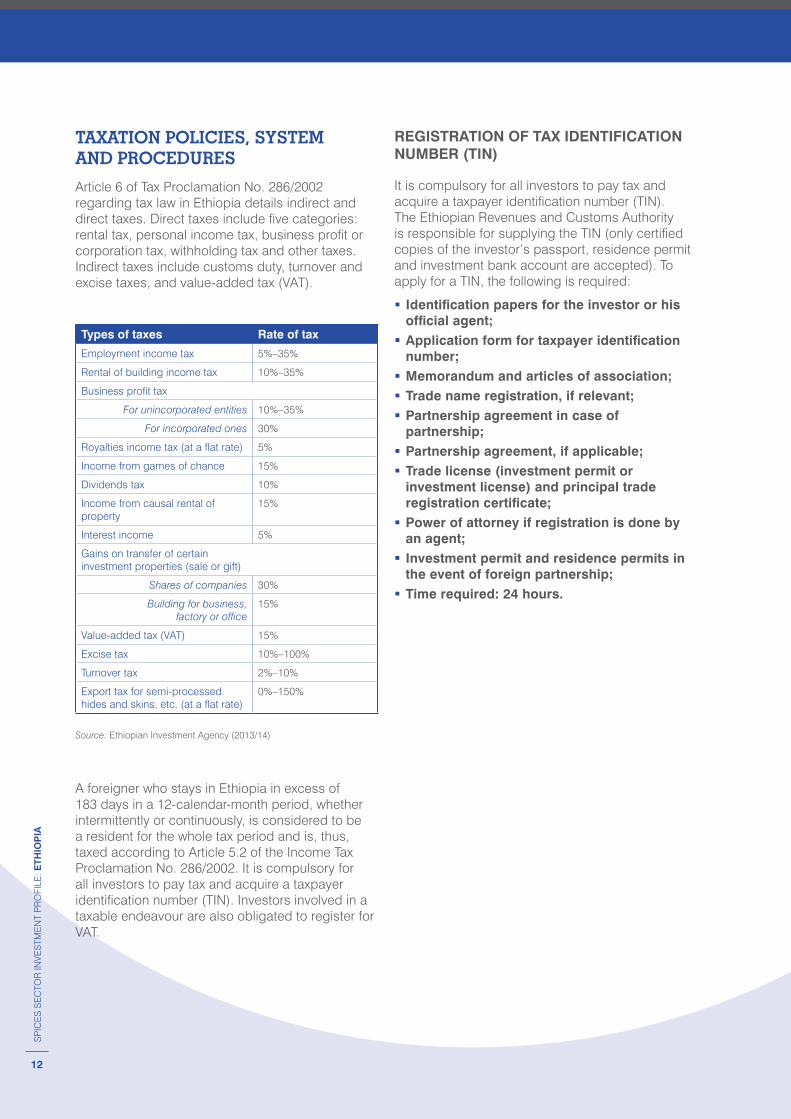
TAXATION POLICIES, SYSTEM AND PROCEDURES
Article 6 of Tax Proclamation No. 286/2002 regarding tax law in Ethiopia details indirect and direct taxes. Direct taxes include five categories: rental tax, personal income tax, business profit or corporation tax, withholding tax and other taxes. Indirect taxes include customs duty, turnover and excise taxes, and value-added tax (VAT).
Types of taxes Rate of tax
Employment income tax 5%–35%
Rental of building income tax 10%–35%
Business profit tax
For unincorporated entities 10%–35%
For incorporated ones 30%
Royalties income tax (at a flat rate) 5%
Income from games of chance 15%
Dividends tax 10%
Income from causal rental of property
15%
Interest income 5%
Gains on transfer of certain investment properties (sale or gift)
Shares of companies 30%
Building for business, factory or office
15%
Value-added tax (VAT) 15%
Excise tax 10%–100%
Turnover tax 2%–10%
Export tax for semi-processed hides and skins, etc. (at a flat rate)
0%–150%
Source: Ethiopian Investment Agency (2013/14)
A foreigner who stays in Ethiopia in excess of 183 days in a 12-calendar-month period, whether intermittently or continuously, is considered to be a resident for the whole tax period and is, thus, taxed according to Article 5.2 of the Income Tax Proclamation No. 286/2002. It is compulsory for all investors to pay tax and acquire a taxpayer identification number (TIN). Investors involved in a taxable endeavour are also obligated to register for VAT.
REGISTRATION OF TAX IDENTIFICATION NUMBER (TIN)
It is compulsory for all investors to pay tax and acquire a taxpayer identification number (TIN). The Ethiopian Revenues and Customs Authority is responsible for supplying the TIN (only certified copies of the investor’s passport, residence permit and investment bank account are accepted). To apply for a TIN, the following is required:
� Identification papers for the investor or his official agent;
� Application form for taxpayer identification number;
� Memorandum and articles of association; � Trade name registration, if relevant; � Partnership agreement in case of partnership;
� Partnership agreement, if applicable; � Trade license (investment permit or investment license) and principal trade registration certificate;
� Power of attorney if registration is done by an agent;
� Investment permit and residence permits in the event of foreign partnership;
� Time required: 24 hours.
13
SP
ICE
S S
EC
TOR
INVE
STM
EN
T P
RO
FILE
: ETH
IOP
IA
13
SP
ICE
S S
EC
TOR
INVE
STM
EN
T P
RO
FILE
: ETH
IOP
IA
14
SP
ICE
S S
EC
TOR
INVE
STM
EN
T P
RO
FILE
: ETH
IOP
IA
© s
hutte
rsto
ck.c
om
14
SP
ICE
S S
EC
TOR
INVE
STM
EN
T P
RO
FILE
: ETH
IOP
IA
15
SP
ICE
S S
EC
TOR
INVE
STM
EN
T P
RO
FILE
: ETH
IOP
IA
Why Ethiopia?
The Ethiopian Government’s political will, policy coherence, geographic access and low cost of doing business are attractive factors for investors. There are a number of reasons to invest in Ethiopia, a few of which are listed below.
POLITICAL AND SOCIAL STABILITY
� The Ethiopian Government has a strong political commitment to create economic integration with neighbouring countries that fosters mutual economic ties and benefits.
� The World Economic Forum’s Global Competitiveness Report 2013–2014 rated Ethiopia’s security 55th out of 148 countries in the world. Ethiopia was also rated 36th and 38th worldwide in organized crime, crime and violence, and business costs.
STABLE ECONOMIC ENVIRONMENT AND RAPID ECONOMIC GROWTH
� The Ethiopian Government’s comprehensive development strategy resulted in strong and stable economic growth since 2003, averaging 11% per annum. As a result, the country has been able to achieve a stable macroeconomic condition. Ethiopia was counted as the 12th fastest-growing economy in the world in 2012.
� Inflation is a single-digit figure and there is a stable exchange rate of foreign currency.
� Secure living and working environment, recognized by the International Chamber of Commerce (ICC) and the United Nations (UN) as a vital advantage for investors.
� Government commitment to private sector.
� Low corruption level – the ICC and the UN described Ethiopia as “exceptional in its almost complete absence of routine corruption” (UN, ICC, 2004).
ADEQUATE FARMING LAND
� Land in Ethiopia is public property. Companies, other organizations and individuals are only entitled to utilize the land.
� Investors can apply for land procurement during a field visit and upon acquiring an investment license. Rural and urban land is obtainable on a leasehold basis.
� Land lease rights can be mortgaged, subleased or transferred, together with on-build amenities. Leaseholders are permitted to utilize urban land for as much as 60 years in Addis Ababa and as much as 80 years in smaller towns. Leasehold renewal is allowed – in Ethiopia, this usually ranges from 50 to 99 years, contingent on location and purpose.
� The Ethiopian Investment Commission is responsible for facilitating the land allocation for foreign direct investment (FDI) ventures countrywide, especially for manufacturing, and the Ministry of Agriculture (MoA) has a mandate to allocate farmland to foreign investors for agriculture.
� Construction works were completed recently at national level for 199,304 hectares of land in medium- and large-scale irrigation, and medium- and large-scale irrigation design works have been conducted for 679,352 hectares of land.
16
SP
ICE
S S
EC
TOR
INVE
STM
EN
T P
RO
FILE
: ETH
IOP
IA
INVESTMENT GUARANTEE AND PROTECTION
The investment code and constitution protect private property in Ethiopia (Ethiopian Investment Commission, 2015).
� Ethiopia has membership with the Multilateral Investment Guarantee Agency (MIGA), which guarantees against non-commercial risks to businesses investing in member countries.
� Ethiopia has signed bilateral investment protection and promotion treaties with a number of countries.
� Ethiopia is a signatory of the World Intellectual Property Organization (WIPO) and the International Convention on the Settlement of Investment Disputes (ICSID) between states and nationals of other states.
ABUNDANT LABOUR AND REASONABLE WAGE RATES
� Ethiopia generates in excess of 50,000 university graduates annually, including law, accounting, economics, management, business and engineering graduates.
� Ethiopia boasts 33 universities and 151 vocational and technical training and education schools.
� The Human Development Index has changed in a better way and its rank in 2013 became 173rd out of 187 countries.
� Private sector wages average US$ 55 per month and graduate salaries can be anything from approximately US$ 85 to US$ 135.
� With the prior consent of the Ethiopian Investment Commission, and where the employer is the only or a main shareholder or owner of the organization, expatriate employees are allowed to hold senior positions. Expatriate specialists are also allowed, provided that the replacement is trained by the investor within a specified period of time.
� The labour law states nominal working hours as eight hours per day and 38 hours per week.
� In Ethiopia, standard labour disputes are settled by means of the application of the law.
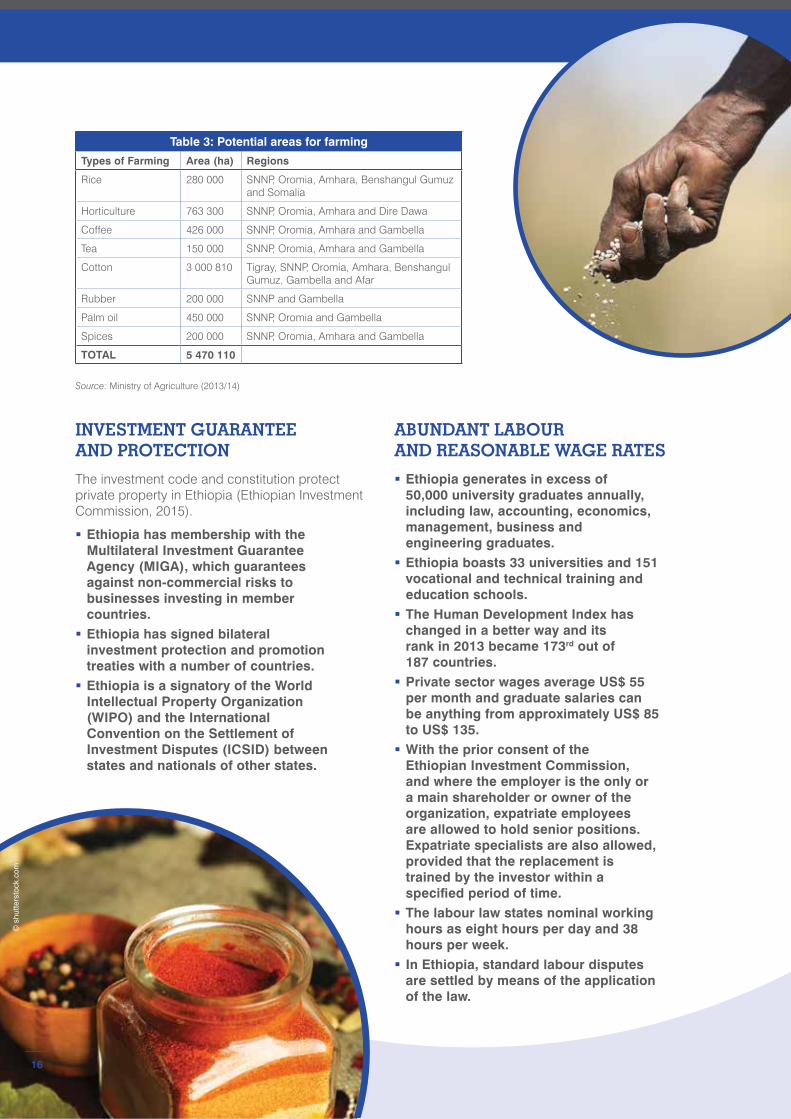
Table 3: Potential areas for farming
Types of Farming Area (ha) Regions
Rice 280 000 SNNP, Oromia, Amhara, Benshangul Gumuz and Somalia
Horticulture 763 300 SNNP, Oromia, Amhara and Dire Dawa
Coffee 426 000 SNNP, Oromia, Amhara and Gambella
Tea 150 000 SNNP, Oromia, Amhara and Gambella
Cotton 3 000 810 Tigray, SNNP, Oromia, Amhara, Benshangul Gumuz, Gambella and Afar
Rubber 200 000 SNNP and Gambella
Palm oil 450 000 SNNP, Oromia and Gambella
Spices 200 000 SNNP, Oromia, Amhara and Gambella
TOTAL 5 470 110
Source: Ministry of Agriculture (2013/14)
© s
hutte
rsto
ck.c
om
16
17
SP
ICE
S S
EC
TOR
INVE
STM
EN
T P
RO
FILE
: ETH
IOP
IA
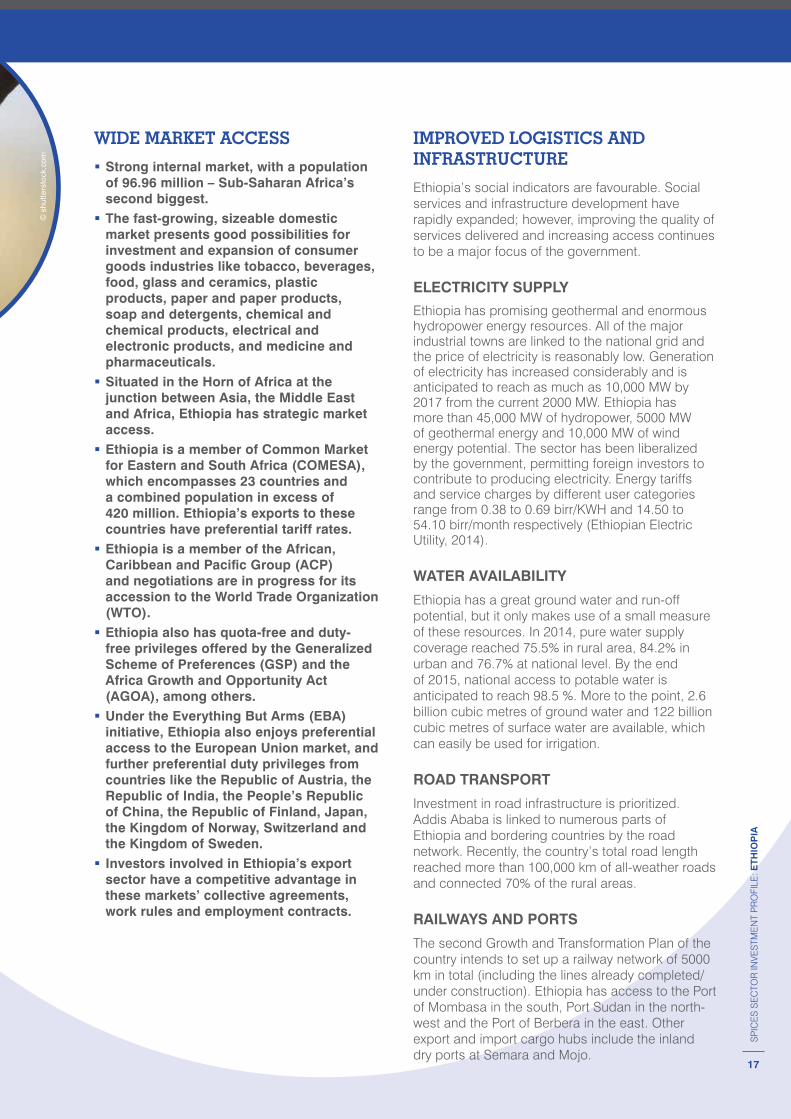
WIDE MARKET ACCESS
� Strong internal market, with a population of 96.96 million – Sub-Saharan Africa’s second biggest.
� The fast-growing, sizeable domestic market presents good possibilities for investment and expansion of consumer goods industries like tobacco, beverages, food, glass and ceramics, plastic products, paper and paper products, soap and detergents, chemical and chemical products, electrical and electronic products, and medicine and pharmaceuticals.
� Situated in the Horn of Africa at the junction between Asia, the Middle East and Africa, Ethiopia has strategic market access.
� Ethiopia is a member of Common Market for Eastern and South Africa (COMESA), which encompasses 23 countries and a combined population in excess of 420 million. Ethiopia’s exports to these countries have preferential tariff rates.
� Ethiopia is a member of the African, Caribbean and Pacific Group (ACP) and negotiations are in progress for its accession to the World Trade Organization (WTO).
� Ethiopia also has quota-free and duty-free privileges offered by the Generalized Scheme of Preferences (GSP) and the Africa Growth and Opportunity Act (AGOA), among others.
� Under the Everything But Arms (EBA) initiative, Ethiopia also enjoys preferential access to the European Union market, and further preferential duty privileges from countries like the Republic of Austria, the Republic of India, the People’s Republic of China, the Republic of Finland, Japan, the Kingdom of Norway, Switzerland and the Kingdom of Sweden.
� Investors involved in Ethiopia’s export sector have a competitive advantage in these markets’ collective agreements, work rules and employment contracts.
IMPROVED LOGISTICS AND INFRASTRUCTURE
Ethiopia’s social indicators are favourable. Social services and infrastructure development have rapidly expanded; however, improving the quality of services delivered and increasing access continues to be a major focus of the government.
ELECTRICITY SUPPLY
Ethiopia has promising geothermal and enormous hydropower energy resources. All of the major industrial towns are linked to the national grid and the price of electricity is reasonably low. Generation of electricity has increased considerably and is anticipated to reach as much as 10,000 MW by 2017 from the current 2000 MW. Ethiopia has more than 45,000 MW of hydropower, 5000 MW of geothermal energy and 10,000 MW of wind energy potential. The sector has been liberalized by the government, permitting foreign investors to contribute to producing electricity. Energy tariffs and service charges by different user categories range from 0.38 to 0.69 birr/KWH and 14.50 to 54.10 birr/month respectively (Ethiopian Electric Utility, 2014).
WATER AVAILABILITY
Ethiopia has a great ground water and run-off potential, but it only makes use of a small measure of these resources. In 2014, pure water supply coverage reached 75.5% in rural area, 84.2% in urban and 76.7% at national level. By the end of 2015, national access to potable water is anticipated to reach 98.5 %. More to the point, 2.6 billion cubic metres of ground water and 122 billion cubic metres of surface water are available, which can easily be used for irrigation.
ROAD TRANSPORT
Investment in road infrastructure is prioritized. Addis Ababa is linked to numerous parts of Ethiopia and bordering countries by the road network. Recently, the country’s total road length reached more than 100,000 km of all-weather roads and connected 70% of the rural areas.
RAILWAYS AND PORTS
The second Growth and Transformation Plan of the country intends to set up a railway network of 5000 km in total (including the lines already completed/ under construction). Ethiopia has access to the Port of Mombasa in the south, Port Sudan in the north-west and the Port of Berbera in the east. Other export and import cargo hubs include the inland dry ports at Semara and Mojo.
© s
hutte
rsto
ck.c
om
18
SP
ICE
S S
EC
TOR
INVE
STM
EN
T P
RO
FILE
: ETH
IOP
IA
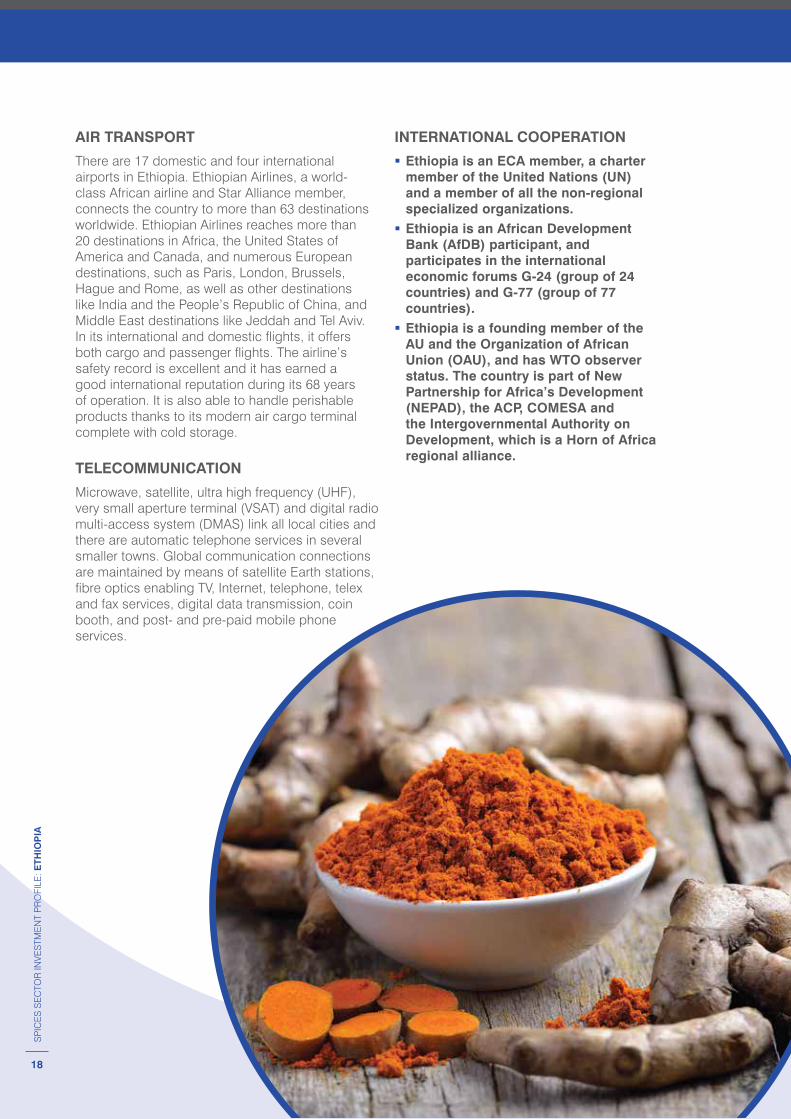
AIR TRANSPORT
There are 17 domestic and four international airports in Ethiopia. Ethiopian Airlines, a world-class African airline and Star Alliance member, connects the country to more than 63 destinations worldwide. Ethiopian Airlines reaches more than 20 destinations in Africa, the United States of America and Canada, and numerous European destinations, such as Paris, London, Brussels, Hague and Rome, as well as other destinations like India and the People’s Republic of China, and Middle East destinations like Jeddah and Tel Aviv. In its international and domestic flights, it offers both cargo and passenger flights. The airline’s safety record is excellent and it has earned a good international reputation during its 68 years of operation. It is also able to handle perishable products thanks to its modern air cargo terminal complete with cold storage.
TELECOMMUNICATION
Microwave, satellite, ultra high frequency (UHF), very small aperture terminal (VSAT) and digital radio multi-access system (DMAS) link all local cities and there are automatic telephone services in several smaller towns. Global communication connections are maintained by means of satellite Earth stations, fibre optics enabling TV, Internet, telephone, telex and fax services, digital data transmission, coin booth, and post- and pre-paid mobile phone services.
INTERNATIONAL COOPERATION
� Ethiopia is an ECA member, a charter member of the United Nations (UN) and a member of all the non-regional specialized organizations.
� Ethiopia is an African Development Bank (AfDB) participant, and participates in the international economic forums G-24 (group of 24 countries) and G-77 (group of 77 countries).
� Ethiopia is a founding member of the AU and the Organization of African Union (OAU), and has WTO observer status. The country is part of New Partnership for Africa’s Development (NEPAD), the ACP, COMESA and the Intergovernmental Authority on Development, which is a Horn of Africa regional alliance.

19
SP
ICE
S S
EC
TOR
INVE
STM
EN
T P
RO
FILE
: ETH
IOP
IA
Ethiopian Spices Sectoral Overview
ETHIOPIA’S GRANULAR SECTORAL TRADE BEHAVIOUR
Many spices are grown on Ethiopia’s rift valley and highlands. From 109 spices, herbs and aromatic plants shortlisted by international organizations for standardization, the country produces as many as 50, out which 23 are trading as export items. Ethiopia mainly produces ginger, turmeric, cumin, rosemary, cardamom, capsicum, fenugreek, coriander, korarima, Timiz, black pepper, hot pepper, rue, celery and thyme. Spices exports are mainly unprocessed or semi-processed primary products, while imported spices are fully processed.
SPICES SUBSECTOR ECONOMY
� Ethiopia has 74.3 million hectors of land suitable for agriculture, out of which 3.7 million hectors is identified by the government for foreign and local investors to invest in agricultural production, including spices.
� Government provides farming land for spices to local and foreign investors based on lease prices of each region.
� Almost 122,700 hectares of land are used for spice farming and spices production is currently 244,000 tons a year. The total capacity for lowland spices farming is estimated to be 200,000 hectares (2014).
� An earlier study by the Ethiopian Export Promotion Agency indicated total production of spices in the three major producing regions of SNNP, Amhara and Oromia was 89,300 tons, with SNNP, Amhara and Oromia regions accounting for 64%, 25% and 11% respectively of total production of spices in the country.
� The spices subsector economy’s growth rate has been rapid. From 2010–2014, the exported value of all products has grown at an average rate of 25.70%.
� The import-export trend of Ethiopian spices can be taken as an indicator for its positive impact in the subsector’s economy.
Table 4: Ethiopia’s exported spice products (US$ thousand) (2010–2014)
Product label EV in 2010 EV in 2011 EV in 2012 EV in 2013 EV in 2014
Ginger, saffron, bay leaves, turmeric, thyme and curry 23 119 26 838 18 170 17 119 15 585
Pepper, peppers and capsicum 1 173 5 142 8 182 8 949 10 435
Seeds of anise, badian, fennel, coriander and cumin, etc. 2 417 5 954 4 617 4 672 8 937
Nutmeg, mace and cardamoms 798 942 407 362 424
Cinnamon and cinnamon tree flowers 38 20 1 136 56
Cloves 0 0 1 0 0
Note: EV = exported value
Source: International Trade Centre (ITC) calculations based on UN COMTRADE statistics (2014)
© s
hutte
rsto
ck.c
om
© s
hutte
rsto
ck.c
om
20
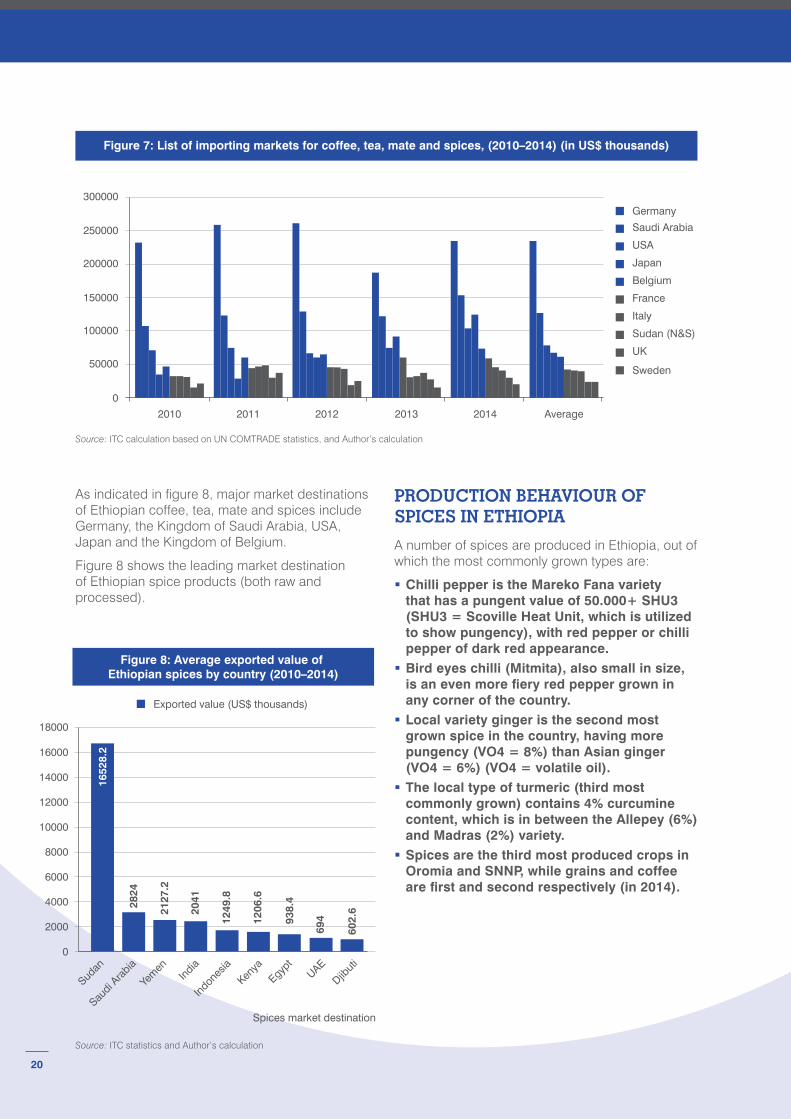
As indicated in figure 8, major market destinations of Ethiopian coffee, tea, mate and spices include Germany, the Kingdom of Saudi Arabia, USA, Japan and the Kingdom of Belgium.
Figure 8 shows the leading market destination of Ethiopian spice products (both raw and processed).
PRODUCTION BEHAVIOUR OF SPICES IN ETHIOPIA
A number of spices are produced in Ethiopia, out of which the most commonly grown types are:
� Chilli pepper is the Mareko Fana variety that has a pungent value of 50.000+ SHU3 (SHU3 = Scoville Heat Unit, which is utilized to show pungency), with red pepper or chilli pepper of dark red appearance.
� Bird eyes chilli (Mitmita), also small in size, is an even more fiery red pepper grown in any corner of the country.
� Local variety ginger is the second most grown spice in the country, having more pungency (VO4 = 8%) than Asian ginger (VO4 = 6%) (VO4 = volatile oil).
� The local type of turmeric (third most commonly grown) contains 4% curcumine content, which is in between the Allepey (6%) and Madras (2%) variety.
� Spices are the third most produced crops in Oromia and SNNP, while grains and coffee are first and second respectively (in 2014).
Source: ITC calculation based on UN COMTRADE statistics, and Author’s calculation
Source: ITC statistics and Author’s calculation
Figure 7: List of importing markets for coffee, tea, mate and spices, (2010–2014) (in US$ thousands)
2010
0
50000
100000
150000
200000
250000
300000
2011 2012 2013 2014 Average
Germany
Saudi Arabia
USA
Japan
Belgium
France
Italy
Sudan (N&S)
UK
Sweden
Figure 8: Average exported value of Ethiopian spices by country (2010–2014)
Exported value (US$ thousands)
Spices market destination
1652
8.2
18000
16000
14000
12000
10000
8000
6000
4000
2000
0
2824
2127
.2
2041
1249
.8
1206
.6
938.
4
694
602.
6
Sudan
Saudi A
rabia
Yem
enInd
ia
Indon
esia
Kenya
Egypt
UAE
Djibut
i
21
SP
ICE
S S
EC
TOR
INVE
STM
EN
T P
RO
FILE
: ETH
IOP
IA
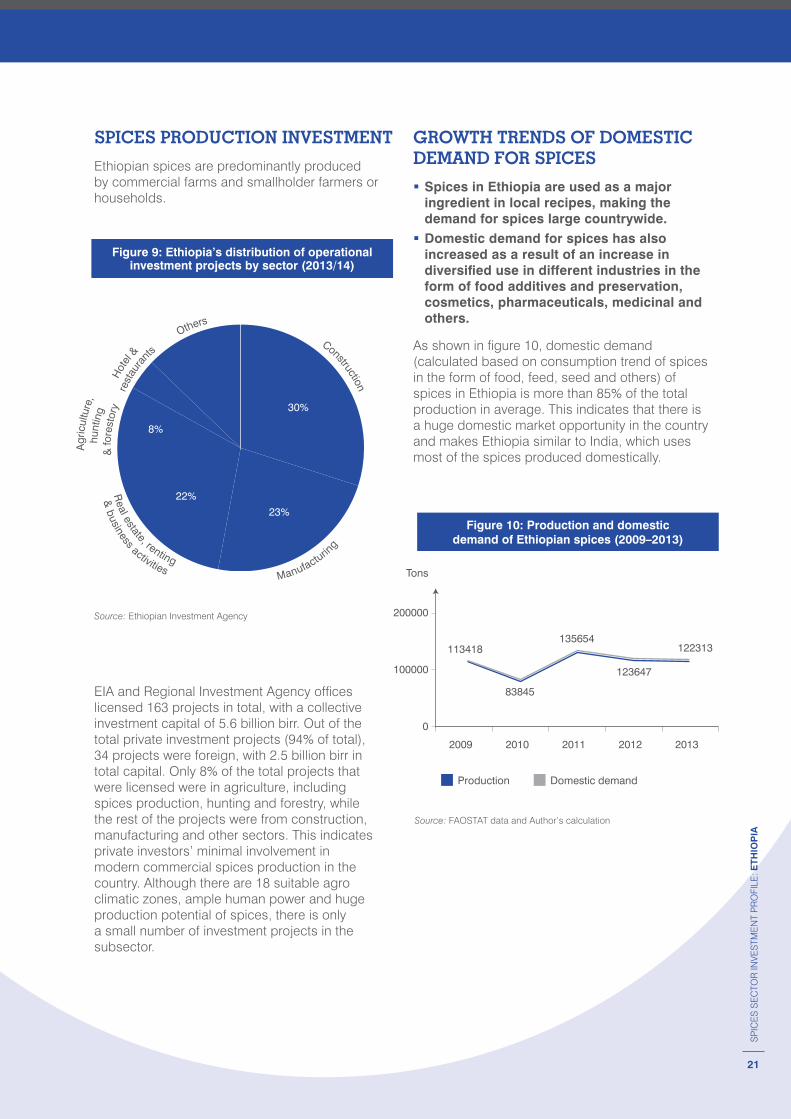
SPICES PRODUCTION INVESTMENT
Ethiopian spices are predominantly produced by commercial farms and smallholder farmers or households.
EIA and Regional Investment Agency offices licensed 163 projects in total, with a collective investment capital of 5.6 billion birr. Out of the total private investment projects (94% of total), 34 projects were foreign, with 2.5 billion birr in total capital. Only 8% of the total projects that were licensed were in agriculture, including spices production, hunting and forestry, while the rest of the projects were from construction, manufacturing and other sectors. This indicates private investors’ minimal involvement in modern commercial spices production in the country. Although there are 18 suitable agro climatic zones, ample human power and huge production potential of spices, there is only a small number of investment projects in the subsector.
GROWTH TRENDS OF DOMESTIC DEMAND FOR SPICES
� Spices in Ethiopia are used as a major ingredient in local recipes, making the demand for spices large countrywide.
� Domestic demand for spices has also increased as a result of an increase in diversified use in different industries in the form of food additives and preservation, cosmetics, pharmaceuticals, medicinal and others.
As shown in figure 10, domestic demand (calculated based on consumption trend of spices in the form of food, feed, seed and others) of spices in Ethiopia is more than 85% of the total production in average. This indicates that there is a huge domestic market opportunity in the country and makes Ethiopia similar to India, which uses most of the spices produced domestically.
Source: Ethiopian Investment Agency
Source: FAOSTAT data and Author’s calculation
Figure 9: Ethiopia’s distribution of operationalinvestment projects by sector (2013/14)
Others
Construction
Manufacturin
g
30%
23%
22%
8%
13%
4%
Real estate, renting
& business activities
rest
aura
nts
& fo
rest
ory
hunt
ing
Agr
icul
ture
,
Hot
el &
Figure 10: Production and domesticdemand of Ethiopian spices (2009–2013)
Production Domestic demand
2009 2010 2011
200000
100000
0
2012 2013
113418135654
122313
123647
83845
Tons
22
SP
ICE
S S
EC
TOR
INVE
STM
EN
T P
RO
FILE
: ETH
IOP
IA
SECTOR INVESTMENT PROMOTION MEASURES
ATTRACTIVE INVESTMENT INCENTIVES
To promote private investment, the Government of Ethiopia has created an incentives package across a range of sectors under Regulations No. 84/2003 for local and foreign investors involved in expansions and new endeavours.
CUSTOMS DUTY EXEMPTION
� A 100% exemption on all investment capital goods imports and imports of construction supplies needed for setting up new organizations or for the upgrading and expansion of existing organizations, including spare parts valued at a maximum of 15% of the imported investment capital goods, as well as exemption for imported raw materials necessary producing goods for export.
� Packing materials and raw materials needed for producing export goods are granted exemptions from customs duty and other taxes imposed on imports. Duties and taxes paid on packing materials and raw materials are drawn back when the final products are exported. The bonded manufacturing warehouse facilities and voucher system are also available.
� All services and goods intended for export are exempt from all export tax and other taxes imposed on exports.
INCOME TAX EXEMPTION
� Income earned from agricultural investments, new agribusiness and manufacturing investments, or information and communication technology (ICT) development, is entitled to an income tax holiday of two to seven years (this varies, dependent on the export volume, location and area of investment).
� Income earned from upgrading or expanding an existing agricultural, agribusiness or manufacturing business is entitled to a two-year income tax exemption if a minimum of 50% of the products produced are exported and if the company increases its production value by 25%.
� Investors who invest to establish a new business in some parts of SNNP, Afar, Benshangul Gumuz and Gambela regions are eligible for a 30% income tax deduction for three successive years after the income tax exemption period has expired.
LOSS CARRIED FORWARD
Companies that have borne losses during this “holiday” are allowed to carry them forward for half the exemption period after that exemption has expired.

23
SP
ICE
S S
EC
TOR
INVE
STM
EN
T P
RO
FILE
: ETH
IOP
IA
EXPORT TRADE DUTY INCENTIVES SCHEME
Investors who supply or export at least 60% of their services or products to an exporter as service or production inputs are eligible for a two-year income tax exemption over and above the exemption period offered. The following are the most important incentives schemes.
� Duty drawback scheme: This exempts investors from paying customs duties and other taxes imposed on locally acquired and imported raw materials utilized when producing goods for export. Duties and other taxes disbursed are drawn back 100% when the finished goods are exported.
� Voucher system: A voucher is a paper document (prepared by MoFED) that records the balance of duty due on imported raw materials to be utilized for producing products for external markets.
� Bonded manufacturing warehouse scheme: This is for producers who are exclusively engaged in the export of their goods, who are in possession of a license that allows them to run such a warehouse, and who are not entitled to utilize the voucher scheme.
� Foreign exchange retention scheme: Foreign currency earned by exporters from their exports should be deposited in a bank and can be used for expenses related to their export business. The designated accounts are Account A (which allows exporters to retain and deposit as much as 20% of their foreign exchange income for future use without export price control by NBE) and Account B (where exporters are allowed to hold 80% of the foreign currency earned from export sales for a maximum of 28 days).
� Franco valuta imports facility: At first, exporters should obtain an import permit from NBE for importing raw materials and other necessary items that might be important for the production of export products.
� Investment loans scheme: Manufacturing, agro-processing and agriculture industries can get 70% of their investment capital needs from the Development Bank of Ethiopia at an incredibly good interest rate, especially if they are export-focussed.
REMITTANCE OF FUNDS
Foreign investors are permitted to make the following convertible foreign currency remittances out of Ethiopia at the existing exchange rate on the date of remittance:
� Interest and principal payment on external loans;
� Dividends and profits from investment; � Payments associated with a transfer of technology agreement;
� Compensation paid to an investor; � Income from the liquidation or sale of a company;
� Income from the transfer of partial ownership of or shares in a company to a local investor;
� In convertible foreign currency, expatriate employees can remit unspent salaries and other income accruing from their work in hard currency.
GOVERNMENT SUPPORT
� The Ethiopian Government is encouraging agro-industrial ventures and has stated that spices are a main area for development.
� Provision of policy incentives that facilitate exporters’ implementation of modern machinery and processing techniques, including post- and pre-harvest processing.
� In some of its semi-specialized and specialized research centres, the Ethiopian Institute of Agriculture Research (EIAR) is doing research relevant to the spices subsector.
� Government commitment in delivering the 10-year spice industry strategic plan.
� Promotion of FDI-initiated commercial farming by government policy.
� The spices subsector is one of the main subsectors that fit within the commercialization of agriculture strategy.
© s
hutte
rsto
ck.c
om

24
SP
ICE
S S
EC
TOR
INVE
STM
EN
T P
RO
FILE
: ETH
IOP
IA
24
SP
ICE
S S
EC
TOR
INVE
STM
EN
T P
RO
FILE
: ETH
IOP
IA
© s
hutte
rsto
ck.c
om
25
Investment Opportunities
There are several avenues open for investment in the Ethiopian spices sector, as its population of 96.96 million constitutes one of Africa’s biggest markets for spices, apart from the international market requirements. Accordingly, a growing amount of market participants (traders, buyers, pharmaceutical manufacturers and oleoresin extraction companies, etc.) are finding it attractive to operate in Ethiopia. Given the domestic consumption and export potential, investors might consider the following investment options.
PRIMARY PRODUCTION
There is opportunity to expand spices production in Ethiopia. While there are 122,700 hectares of land currently under spice cultivation, the potential for lowland spices farming can reach up to 200,000 hectares. Ethiopian conditions are suitable to grow 6,000 vascular plant species, out of which 12% are endemic. The government is keen to promote FDI-initiated commercial farming, with spices farming land provided to investors based on the regions’ lease prices, and foreign investors are encouraged to invest in the spices sector as sole proprietors with total equity ownership.
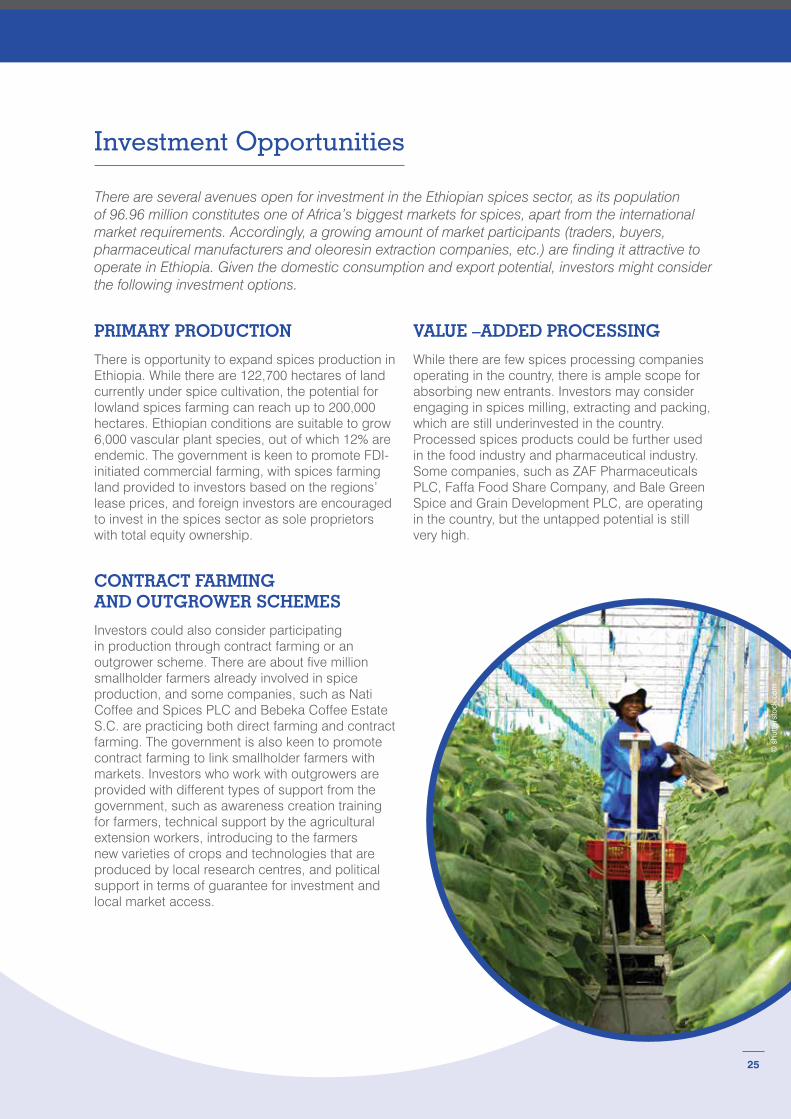
CONTRACT FARMING AND OUTGROWER SCHEMES
Investors could also consider participating in production through contract farming or an outgrower scheme. There are about five million smallholder farmers already involved in spice production, and some companies, such as Nati Coffee and Spices PLC and Bebeka Coffee Estate S.C. are practicing both direct farming and contract farming. The government is also keen to promote contract farming to link smallholder farmers with markets. Investors who work with outgrowers are provided with different types of support from the government, such as awareness creation training for farmers, technical support by the agricultural extension workers, introducing to the farmers new varieties of crops and technologies that are produced by local research centres, and political support in terms of guarantee for investment and local market access.
VALUE –ADDED PROCESSING
While there are few spices processing companies operating in the country, there is ample scope for absorbing new entrants. Investors may consider engaging in spices milling, extracting and packing, which are still underinvested in the country. Processed spices products could be further used in the food industry and pharmaceutical industry. Some companies, such as ZAF Pharmaceuticals PLC, Faffa Food Share Company, and Bale Green Spice and Grain Development PLC, are operating in the country, but the untapped potential is still very high.
© s
hutte
rsto
ck.c
om

26
SP
ICE
S S
EC
TOR
INVE
STM
EN
T P
RO
FILE
: ETH
IOP
IA
26
SP
ICE
S S
EC
TOR
INVE
STM
EN
T P
RO
FILE
: ETH
IOP
IA
27
SP
ICE
S S
EC
TOR
INVE
STM
EN
T P
RO
FILE
: ETH
IOP
IA
Useful Contacts
PUBLIC SECTOR
Ethiopian Revenues and Customs Authority
Telephone: +251 116 629 887E-Mail: [email protected]: www.erca.gov.et
Ministry of Foreign Affairs
Telephone: +251 115 517 345E-Mail: [email protected]: www.mfa.gov.et
Ministry of Industry
Telephone: +251 115 151 373E-Mail: [email protected]: www.moin.gov.et
Development Bank of Ethiopia
Telephone: +251 115 518 889E-Mail: [email protected]: www.dbe.com.et/home
Ethiopian Horticulture Development Agency
Telephone: +251 115 513 065E-Mail: [email protected]: www.ehda.gov.et
Federal Cooperative Agency
Telephone: +251 115 518 040E-Mail: [email protected]: www.fca.gov.et
Ministry of Trade
Telephone: +251 115 518 025Website: www.mot.gov.et/home
Ethiopian Investment Commission
Telephone: +251 115 510 033E-Mail: [email protected]: www.investethiopia.gov.et
Ministry of Agriculture
Telephone: +251 115 518 040E-Mail: [email protected]: www.moa.gov.et
PRIVATE SECTOREthiopian Chamber of Commerce and Sectoral Association
Telephone: +251 115 518 240E-Mail: [email protected]: www.ethiopianchamber.com
Addis Ababa Chamber of Commerce and Sectoral Associations
Telephone: +251 115 528 120E-Mail: [email protected]: www.addischamber.com

28
SP
ICE
S S
EC
TOR
INVE
STM
EN
T P
RO
FILE
: ETH
IOP
IA
Annexes
ANNEX I: INSTITUTIONAL SUPPORT FOR INVESTORS
1. Ethiopian Commodity Exchange (ECX): To improve the export sector, the Government of Ethiopia launched ECX at the end of 2008 and beginning of 2009. ECX is a marketplace in which sellers and buyers get together and trade, with guaranteed quality and payment delivery. ECX is working on other cash crops, but there is a hope that it will start dealing with spices and spices products in 2016.
2. Exporters Association: Ethiopian Pulses, Oilseeds and Spices Processors – Exporters Association (EPOSPEA) was founded in 1998 with the goal of developing its members’ capacity to enable them to be competitive in the international market. EPOSPEA has the following activities.a) Delivering the latest foreign and local
market information;b) Delivering advocacy services to
create an enabling environment;c) Creating international business
opportunities;d) Providing members with business
development services.
3. Ethiopian Industrial Zones Development Corporation (IZDC): Industrial zones (IZs) have been employed as development tools in a number of countries to aid in the promotion of economic development by enabling export-led growth, attracting FDI and local investment, and increasing competitiveness. � By means of the IZ development programme, the Government of Ethiopia plans to create advantageous conditions for the private sector and deal with binding limitations in priority industries along their value chain, including spices, herbs and aromatic plants, in potentially suitable towns and cities in the country.
� IZDC (which is under the Ministry of Industry) is mandated to develop a wide range of industrial parks (10,000 hectares annually) in the country between 2016 and 2025.
29
SP
ICE
S S
EC
TOR
INVE
STM
EN
T P
RO
FILE
: ETH
IOP
IA
ANNEX II: PROCEDURES FOR INVESTMENT START-UP
The investment proclamation (769/2012) allows foreign investors to apply for investment in Ethiopia. The procedure for investment start-up takes approximately two to five days, from reserving the company’s trade name to the final installation of a cash register machine, with a total average cost of 5,500 ETB. The Ethiopian Investment Commission has also started a “one-stop shop” service to its customers to avoid delay of time and unnecessary expenses (World Bank, 2016).
Investment license
Before starting any production activity, an investor should get an investment (business) license and register a minimum capital required for his investment. More information can be found on the Ethiopian Investment Commission website.
Visa and immigration requirements
An Ethiopian entry visa can be obtained from Ethiopia’s diplomatic missions on other continents. Foreign investors are required to have an Ethiopian visa, except for nationals of the Republic of Kenya, the Republic of South Sudan and Republic of Sudan.
Health requirements
Before applying for a visa, foreign visitors must have a valid yellow fever certificate and cholera vaccination. An individual who has entered a cholera-infected region is obliged to have a cholera vaccination within six days prior to arrival in Ethiopia.
Residence permit
The residence permit for foreign investors will be issued by the Department of Immigration and Nationality Affairs upon submission of an investment permit request by the investor. An expatriate staff member in possession of a work permit and a foreign investor who is a shareholder of a business or a branch business are also allowed to possess a residence permit.
© s
hutte
rsto
ck.c
om
30
SP
ICE
S S
EC
TOR
INVE
STM
EN
T P
RO
FILE
: ETH
IOP
IA
Bibliography � BDS (2011), “The Implication of Joining COMESA-EAC-SADC Tripartite FTA on Ethiopia”, research report submitted to the Ministry of Trade and UNDP, Addis Ababa, Ethiopia.
� Commercial Bank of Ethiopia (CBE), Annual report 2013/14
� CBE, Annual Report 2012, monthly reports through January to June, 2013
� Ethiopian Spices Industry sub-sector Development Strategic Plan (2015-2025), 2015
� Ethiopian Growth and transformation Plan II (GTP-II), 2015
� EPOSPEA (2015), Pulses and spices export trend Ethiopia.
� Ethiopia, Ministry of Water, Irrigation and Energy, Annual report 2013/14
� Ethiopia, Ministry of Education, Annual Report 2013/14
� Ethiopia, Ministry of Finance and Economic Development (MoFED), Annual report 2013/14
� Ethiopian Roads Authority, Annual Report 2013/14
� Ethiopian Electric Power Authority, Annual Report 2013/14
� Ethiopian Revenue and Customs Authority, Annual publications 2012/13 & 2013/14
� Ethiopian Investment Commission, Factor Cost (Ethiopian), Annual publication 2015
� Ethiopian, Ministry of Finance & Economic Development, Annual report 2013/14
� Ethiopian Ministry of Water, Irrigation & Energy, Annual report 2015
� Ethiopian Investment Commission (2015), Investment Guide.
� Ethiopian Electric Utility Authority, Annual report 2014
� Ethiopian Central Statistics Agency (2014), Urban Employment & Unemployment Survey.
� Ethiopian Disaster Prevention and Preparedness Agency, Annual Report 2013/14
� Federal Negarit Gazeta, of the Federal Democratic Republic of Ethiopia, Investment proclamation No. 769/2012, page 6572.
� Federal Negarit Gazeta, of the Federal Democratic Republic of Ethiopia, Investment Incentives and Investment areas reserved for domestic investors Council of Ministers Regulation, Regulation No. 270/2012, page No. 6646 & 6653.
� Herms S. (2015), Business Opportunities Report Spices #6 in the series written for the “Ethiopian Netherlands business event”, 5–6 November 2015, Rijswijk, The Netherlands.
� ITC (2014), by Country Report Ethiopia 05/12/2014.
� Netherlands-African Business Council (NABC) & FME-CWN (2015). The oilseeds and pulses Business opportunity report.
� National Bank of Ethiopia (NBE), Annual report 2013/14
� Sandrey, R. and Jensen, H. (2011), “Intra-Africa trade in eastern and southern Africa and the role of South Africa”, In Sandrey, Jensen, Vink, Fundira and Viljoen (eds.): Cape Town to Cairo- An assessment of Tripartite Free Trade Area, Trade Law Center for Southern Africa, National Agricultural Marketing Council, South Africa.
� Seid Nuru, (2015), Prospects and challenges of structural transformation in Ethiopia: Assesing the performance of GTP-I and reflecting on GTP-II.
� Spice Sector Strategy Coordinating Committee (2010), Spice Sub-Sector a strategy for Ethiopia.
� UNCTAD (2009), Economic Development in Africa Report 2009, Strengthening Regional Economic Integration for Africa’ Development, New York and Geneva.
� UNCTAD (2011), Economic Development in Africa Report 2011, Fostering industrial development in Africa in the new global environment (special issue), New York and Geneva.
� UNCTAD, ICC (2004). An Investment Guide to Ethiopia.
� UNDP (2014), Analysis issue No.1, Feb. 2014
� Weldegiorigis, T. (2010), “Domestic Resource Mobilization in Sub-Saharan Africa: The Case of Ethiopia”, the North-South Institute.
� Weldegiorigis, T. et al., (2010), “The challenges and prospects of creating a competitive export sector in Ethiopia”, Addis Ababa, Ethiopia.
� World Bank (2016). Doing Business database.
� World Economic Outlook, April 2013, April 2014 and July 2014
� World Economic Forum (2013). Global Competitiveness Report 2013–2014.
© s
hutte
rsto
ck.c
om

31
SP
ICE
S S
EC
TOR
INVE
STM
EN
T P
RO
FILE
: ETH
IOP
IA
SITA project implemented by: SITA project funded by:

© s
hutte
rsto
ck.c
om