Embed Size (px)
Citation preview
1
SPICA @ MPE
Mission Overview, Science Potential, and Prospective Contribution and Role of MPE
A White Paper for Discussion
December 5, 2011
Authors:
A. Poglitsch
E. van Dishoeck
W. Raab
E. Sturm
D. Lutz
H. Feuchtgruber

2
ISSUE DATE SECTION / PARAGRAPH AFFECTED
REASON/INITIATION DOCUMENTS/REMARKS
0.1 5 Dec 2011 All Initial issue for internal revision
3
Contents
1. Scope ................................................................................................................................................................... 4
1.1 Further reading .......................................................................................................................................... 4
1.2 Acronyms .................................................................................................................................................. 4
2. Mission Overview .............................................................................................................................................. 5
2.1 Spica Satellite ........................................................................................................................................... 5
2.2 SAFARI .................................................................................................................................................... 9
2.2.1 The Instrument .......................................................................................................................................... 9
2.2.2 SAFARI Consortium Organisation ......................................................................................................... 10
2.3 Science Management / Observing Time Allocation .............................................................................. 11
3. Science Potentials ............................................................................................................................................. 13
3.1 Science Cases .......................................................................................................................................... 13
3.1.1 Star and planet formation and evolution ........................................................................................... 13
3.1.2 Exoplanets .......................................................................................................................................... 17
3.1.3 Galaxy evolution ................................................................................................................................ 19
4. Potential MPE Contributions ........................................................................................................................... 24
4.1 Involvement up to now ................................................................................................................................... 24
4.2 Suggestions for future contributions .............................................................................................................. 24
4.2.1 Participation in the Instrument Control Center (ICC) ...................................................................... 25
4.2.2 Detector System Tests ........................................................................................................................ 26
4.2.3 SQUID Array and Cryogenic Preamplifiers Development ............................................................... 28
4.2.4 Filter Wheel Development ................................................................................................................. 29
4.2.5 Summary ............................................................................................................................................. 31
4
1. Scope
This is a white paper to provide a basis for discussions within the Infrared Group at MPE and amongst the board of MPE directors. It gives a summary of the SPICA mission, a description and assessment of capabilities and science cases that are of potential interest to the infrared group in particular and to MPE in general, and suggests possible MPE contributions to the mission. The science cases as such are only briefly described here, for the sake of brevity and only to suggest the science topics for discussion. For detailed descriptions of these (and further) science cases we refer to the Yellow Book (see the section “further reading” below).
1.1 Furtherreading
- [RD1] Science Case part of The SPICA Assessment Study Report (aka “Yellow Book”)
- [RD2] FAR-IR/SUBMILLIMETER SPECTROSCOPIC COSMOLOGICAL SURVEYS: PREDICTIONS OF INFRARED LINE LUMINOSITY FUNCTIONS FOR z<4 GALAXIES, Spinoglio et al. 2011, arXiv1110.4817
- [RD3] Some experiments related to Safari spectroscopic surveys (a Note by Dieter Lutz and Javier Gracia Carpio)
1.2 Acronyms AIV Assembly, Integration and Verification DPU Digital Processing Unit EGSE Electronic Ground Support Equipment EM Engineering Model EMC Electromagnetic Compatibility ESA European Space Agency FM Flight Module FPA Focal Plane Assembly FS Flight Spare FTE Full Time Equivalent ICC Instrument Control Centre ILT Instrument Level Test JAXA Japan Aerospace Exploration Agency PI Principal Investigator PM Project Manager PSF Point Spread Function QM Qualification Model SAFARI S(PIC)A FAR-infrared Instrument SRON Space Research Organisation of the Netherlands
5
2. Mission Overview
The SPICA (Space Infrared telescope for Cosmology and Astrophysics) is a JAXA-led mission to which ESA has been invited to become a partner, by providing the cryogenic telescope assembly and contributing to the ground segment. An additional European contribution is the nationally funded SAFARI Focal Plane Instrument. After its selection as a candidate mission for the Cosmic Vision 2015-2025 (as an M-class “Mission of Opportunity”), the proposed European contribution to SPICA is undergoing the corresponding Assessment Study phase. In Japan, SPICA is part of the JAXA and is in the final phase of in “Preproject” phase, which roughly corresponds to ESA’s “Phase A”, which will extend until the end of this year. The mission has passed its “System Requirement Review” this September, with the strong recommendation to introduce a “Risk Mitigation Phase”. This activity has been split into two parts. Part 1 (September to December 2011) is being done by analysis, mostly. Part 2 will involve industrial partners, which shall be selected in the first quarter of 2012, and will be roughly equivalent to a Phase B1. ESA is considering a proper implementation of a “Phase B1” according to their definition at that time (early 2012) as a decision point regarding their further support of SPICA. Part 2 of this “Risk Mitigation” / Phase B1 exercise will be concluded with a review in the fall of 2012, followed by a Request for Proposals for phases B2/C/D. The final kick-off is planned for early-mid 2013.
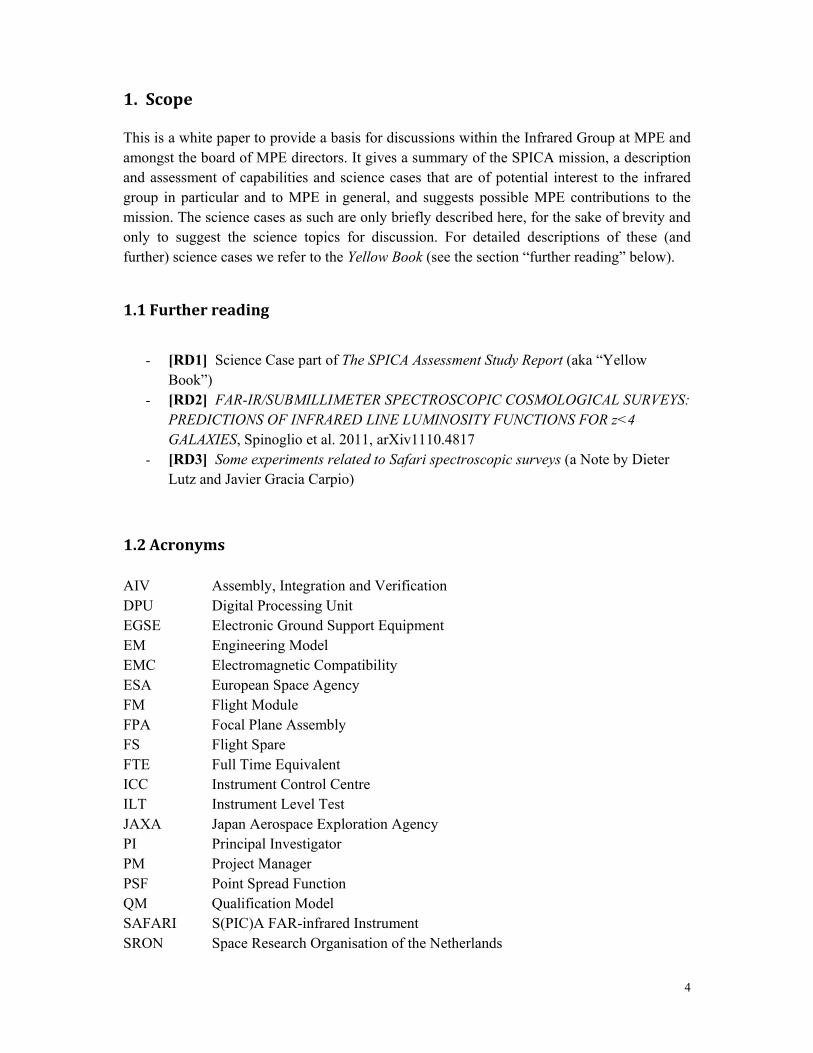
2.1 Spica Satellite SPICA is planned at JAXA as a nominal three year mission (goal 5 years) orbiting at L2 that will be launched on the H-IIA 204 in 2022 from the JAXA Tanegashima Space Centre. High photometric sensitivity observations are made possible with a 3.2 m telescope which is actively cooled down to < 6 K, in order to effectively eliminate the non-astronomical photon noise. The large aperture, monolithic mirror, with the requirement of diffraction limited performance at 5μm, enables high spatial resolution and an adequately controlled point spread function.
SPICA (like Herschel or Planck) will orbit around the Lagrangian point L2, located approximately at 1.5 million km from the Earth, in the anti-sun direction. It is estimated that the mission requires a minimum of five hours ground contact per day. The scientific outcome would be greatly enhanced by an increase in the telemetry budget, which could be achieved through the provision by ESA of a ground station in Europe. The contribution of this additional ground station is also being evaluated in the ESA Assessment Study.
The main contribution by ESA is the telescope, which is largely based on the development done for the Herschel telescope. Two industrial studies (Astrium and Thales) have been carried out under ESA contracts; both have demonstrated the feasibility of the required telescope specifications.
Figure 1: and straylHerschel hthe origina3.2m. Two
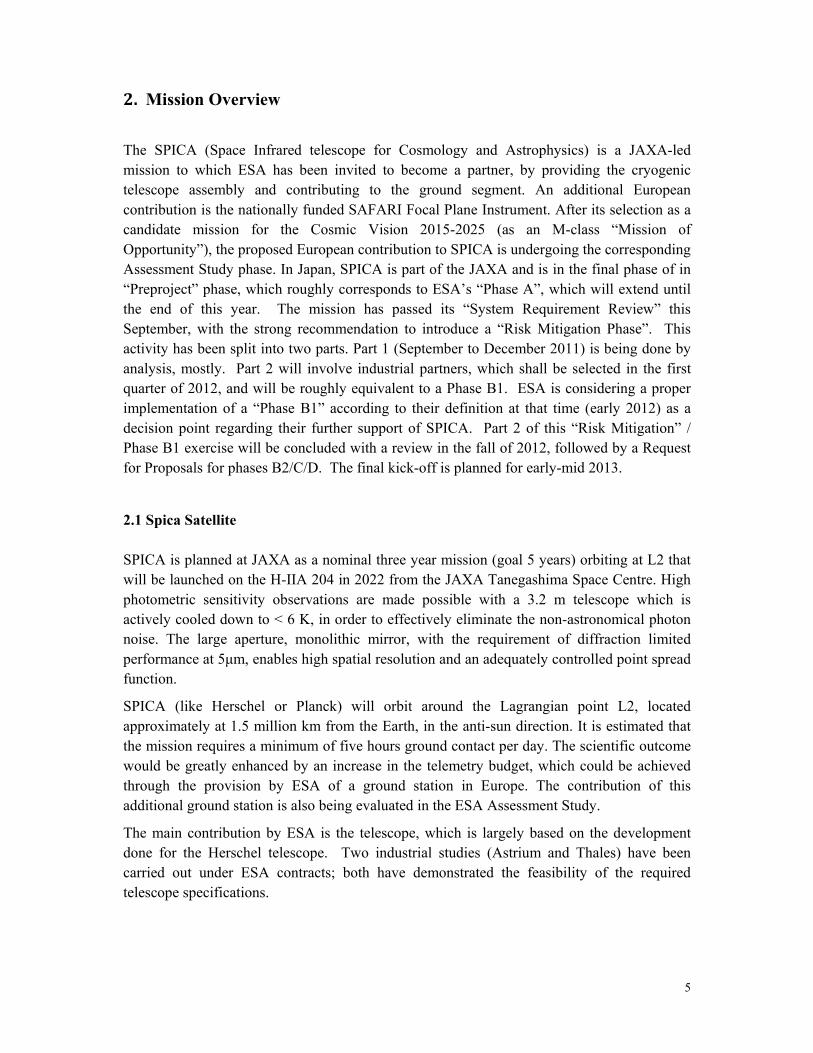
An imptemperathe 4K developthe coolrequire design dpower p
Figure 2: lifetime ofreadout elsuppressio
Main elementslight level, thermheritage but wially foreseen Ho competing in
portant comatures down
K coolers cpment, fromlers is their a steady loadriver. Alsper instrume
The mechanicaf 5 years, their lectronics (dission has been tho
Cooler2ST c4K JT1K JT
s and constrainmal shielding aith a wavefront
H-IIB launcherndustry studies
mponent ofn to ~1K. Ican be conm a breadbo
limited cooad. For anyso, for the fent is unreal
al cooler systemlimited (instanipation and haroroughly invest
r base plate cooler ×4 T cooler ×2 T cooler ×2
nts of the SPICAand surface prot error reduced r (for cost reasohave demonstr
f the satelISAS has bnsidered fuard model
oling powery instrumenfull set of slistically low
m is one of the taneous) coolinrness conductiotigated at ISAS
A satellite. Lefoperties of all e
d by at least oneons) has led to arated the feasib
llite concepbeen workinully demonsto a space-r; in particunt with, e.g.studied focaw.
innovative devng power is a don). Compress
S.
2 staDrivCoAc
(Noi
ft: to enable theelements are a me order of magna reduction of
bility of this tele
pt is a seng on such strated, thequalified sy
ular, they ca, intermittenal plane ins
velopments for Sdesign driver fosor and Stirling
age stirling cycleving frequency 15Hnfig: compressor/dctive balance se attenuation sys
N
Joule ThompsDriving freque
e required low major design dnitude. Use of the telescope d
escope system.
et of mechcoolers for
e 1K cooleystem. Theannot cope wntly used mstrument, th
SPICA. Whileor cold mechanig cooler acoust
e cooler Hz desupressor
stem)
4K /1DrivConOp
su
Noise source
son system ency 0.05Hz
telescope tempdriver. The telethe H-IIA rath
diameter from 3
hanical coor many yearers are stile biggest isswith heat pu
mechanisms he resulting
e they should prisms (FTS scantic noise and its
1K JT Cooler comving frequency / 55nfig: compressor (2pposed positioninguppression
Noise path
6
perature escope uses her than 3.5m to
olers for rs; while ll under sue with ulses but this is a
g cooling
rovide a nner) and s proper
mpressor 5+38Hz(TBD) 2 or 3) noise
7
SPICA Focal Plane Instruments
Quite a number of instrument options have been studied. We just summarize their main features.
MIRACLE (Mid-InfRAred Camera without Lens): A mid-IR imaging camera including a low-resolution spectroscopic capability using Silicon BIB detector arrays (Si:As 2Kx2K, Si:Sb1Kx1K, Si:X 128x128) with a field of view of 5´x5´ in imaging mode and a 5´ long slit for spectroscopy. The resolving power in spectroscopy mode is ~200. The instrument provides continuous spectral coverage from 5µm to 38μm by 2 channels (MIRACLE-S: 5-26μm, MIRACLE-L: 20-38μm). FoVs of MIRACLE-S and -L are separate, but next to each other in the focal plane. The angular resolution is diffraction limited (0.35”@5µm).
MIRMES (Mid-IR Medium-resolution Echelle Spectrograph): An integral-field spectrometer with two independent channels covering the wavelength ranges 10µm to 20µm and 19.5µm to 36.1µm with FoVs of 12´´x 6´´ and 12´´x 12.5´´, respectively. The spectral resolving power is ~1000, and pixel scales are 0.4´´ and 0.5´´, respectively.
MIRHES (Mid-IR High-resolution Echelle Spectrograph): A compact high-dispersion spectrograph with immersion gratings for two wavelength bands, 4-8µm and 12-18µm, with slit lengths of 3.5´´and 6´´ and pixel sizes of 0.3´´and 0.5´´, respectively. The resolving power in both bands is ~30,000.
SCI (SPICA Coronagraph Instrument): A high dynamic range coronagraph in the
mid‐IR, optimized for exo-planet observations. It works in two wavelength bands, 1-5µm
(InSb detector) and 5-27µm (Si:As detector), for non-coronagraphic imaging and spectroscopy, and in coronagraphic mode at wavelengths >5µm, also for imaging and spectroscopy, where the resolving power is up to 200. As a coronagraph, it realizes a contrast of 106. Its FoV covers 1´x 1´.
FPC (Focal Plane Camera): Actually consists of two cameras, one in the visible with a limiting magnitude of 21.5 (AB), which is part of the guiding system, and a NIR (0.8-5µm) camera and spectrometer with a slow readout and a limiting magnitude of 26.3 (AB), also serving as a back-up for the guider camera.

Figure 3: budget reato a recomis also refe
Figure 4: Herschel, = 2 × 10⁻¹The SED oexpected fhour). For
Figure 5: and appropMaintaini
v
100 (3000 km s-1
1000 (300 km s-1
10000 (30 km s-1
Planned (requasons, only a su
mmendation to dferred to as MC
Left panel: PhALMA and JW
19 W Hz−1/2 ).of the galaxy Mfor SPICA (blar ALMA 100km
Left panel: Maopriate cold baffing a temperatu
v
2 m
1)
)
) JWST
FPC-S
MIR
SC
ired / optional)ubset of the optdrop any US in
CS.
otometric perfoWST (red), for a. Note the 2 ord
M82 as redshiftck and green) c
m s−1 resolutio
ain contributorffle design, phoure of the inner
20 m
SPICARHES
CI
MIRACLE
MIRMES
) focal plane intional instrumenstrument at th
formance expeca point source ders of magnituted to z=1, 2, 3,compared to ot
on is assumed. N
rs to the incidenoton backgrounr baffle of <10K
200 m
Hersch
A
BLISS
SAFARI
Optional Functi
Wa
nstruments on Sents can be accis point. The (m
cted for SPICA (μJy, 5σ, 1 houude increase in 5 and 10 is shother facilities (rNote that SPIC
nt background fnd will be predoK is essential, b
λ
hel
onality
avelength
ScieObje
A (RecipeFormat
B (Planet& Gala
C (DramaFormat
SPICA. For elecommodated. Tmandatory) com
SAFARI (blacur) using the gon photometric seown. Right panred) for unreso
CA becomes mo
flux density. Wominantly frombut a serious de
ence ective
MIRACLE (imaging)
MIRMI
(spec(>
e for Planet tion)
tary System xies)
a of Galaxy tion)
R
ectrical power,The JAXA reviembination of M
ck) and MCS (goal sensitivity densitivity compnel: Spectroscopolved line and pore sensitive tha
With the nominm celestial sourcesign driver.
RACLE RMES
ctroscopy) >20m)
SAFARI MIRACLMIRME
(spectrosco(<20m
Requirement
Essential FunctionUses part of functional
mass, and therew (in progress)
MIRACLE and M
green), compardetectors on SPpared to Herschopic performancpoint source (Wan JWST beyon
nal telescope temces. Right pan
LE S opy)
m)
MIRHES SCI F
×
(Option)
Uses full fuity × not applicabl
8
rmal
s) has led MIRMES
red to PICA (NEP hel- PACS. ce
W m−2, 5σ, 1 nd 20μm.
mperature el:
FPC-S U.S. Instrument
×
nctionality e
9
2.2 SAFARI
2.2.1 The Instrument
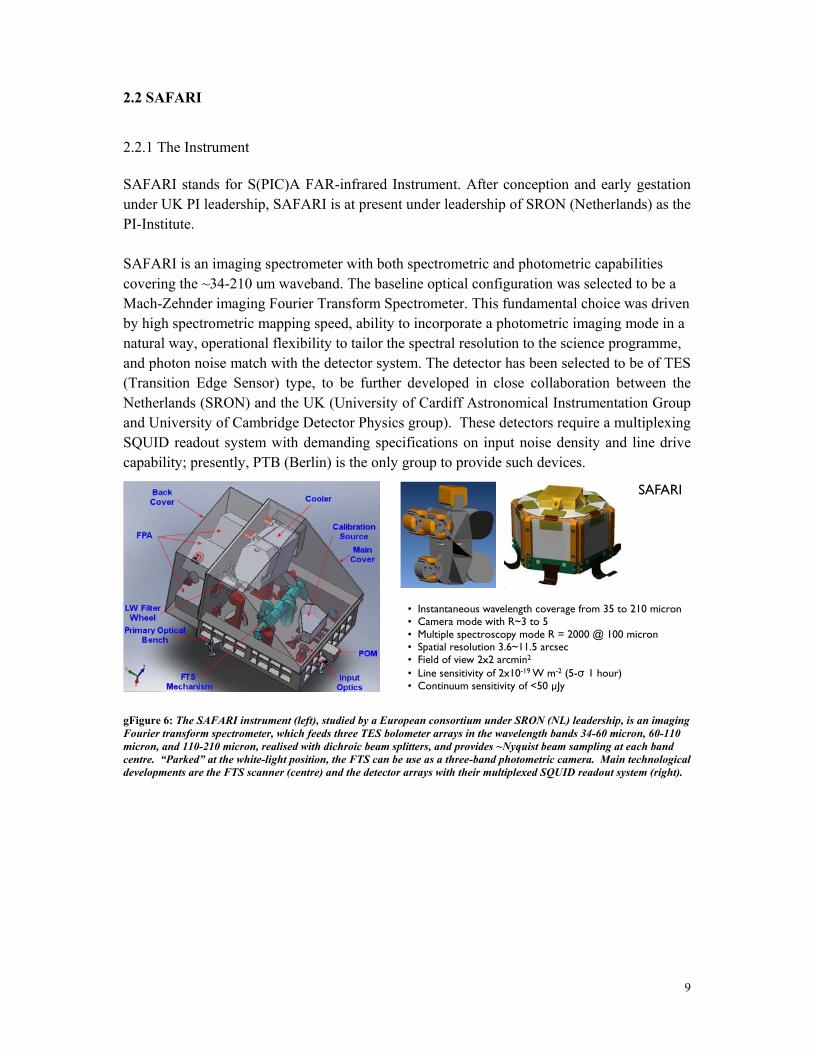
SAFARI stands for S(PIC)A FAR-infrared Instrument. After conception and early gestation under UK PI leadership, SAFARI is at present under leadership of SRON (Netherlands) as the PI-Institute. SAFARI is an imaging spectrometer with both spectrometric and photometric capabilities covering the ~34-210 um waveband. The baseline optical configuration was selected to be a Mach-Zehnder imaging Fourier Transform Spectrometer. This fundamental choice was driven by high spectrometric mapping speed, ability to incorporate a photometric imaging mode in a natural way, operational flexibility to tailor the spectral resolution to the science programme, and photon noise match with the detector system. The detector has been selected to be of TES (Transition Edge Sensor) type, to be further developed in close collaboration between the Netherlands (SRON) and the UK (University of Cardiff Astronomical Instrumentation Group and University of Cambridge Detector Physics group). These detectors require a multiplexing SQUID readout system with demanding specifications on input noise density and line drive capability; presently, PTB (Berlin) is the only group to provide such devices.
gFigure 6: The SAFARI instrument (left), studied by a European consortium under SRON (NL) leadership, is an imaging Fourier transform spectrometer, which feeds three TES bolometer arrays in the wavelength bands 34-60 micron, 60-110 micron, and 110-210 micron, realised with dichroic beam splitters, and provides ~Nyquist beam sampling at each band centre. “Parked” at the white-light position, the FTS can be use as a three-band photometric camera. Main technological developments are the FTS scanner (centre) and the detector arrays with their multiplexed SQUID readout system (right).
• Instantaneous wavelength coverage from 35 to 210 micron • Camera mode with R~3 to 5 • Multiple spectroscopy mode R = 2000 @ 100 micron • Spatial resolution 3.6~11.5 arcsec • Field of view 2x2 arcmin2 • Line sensitivity of 2x10-19 W m-2 (5-σ 1 hour) • Continuum sensitivity of <50 µJy
SAFARI
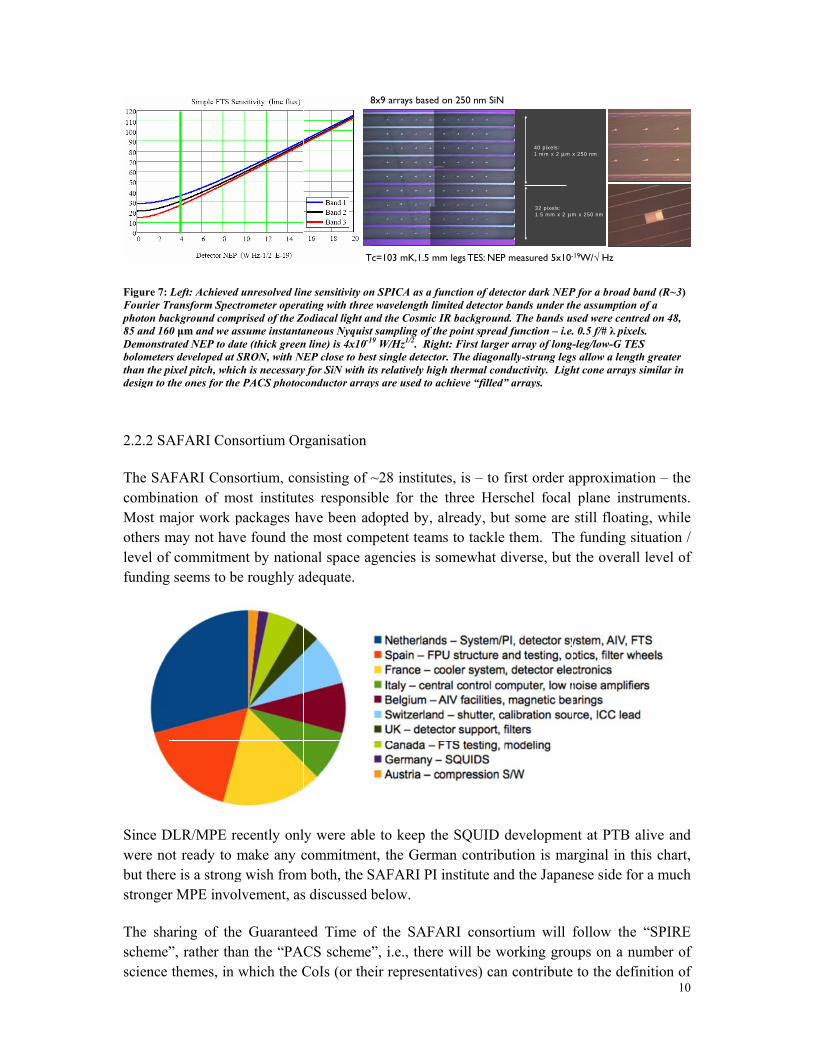
Figure 7: Fourier Tphoton ba85 and 16Demonstrabolometerthan the pdesign to t
2.2.2 SA
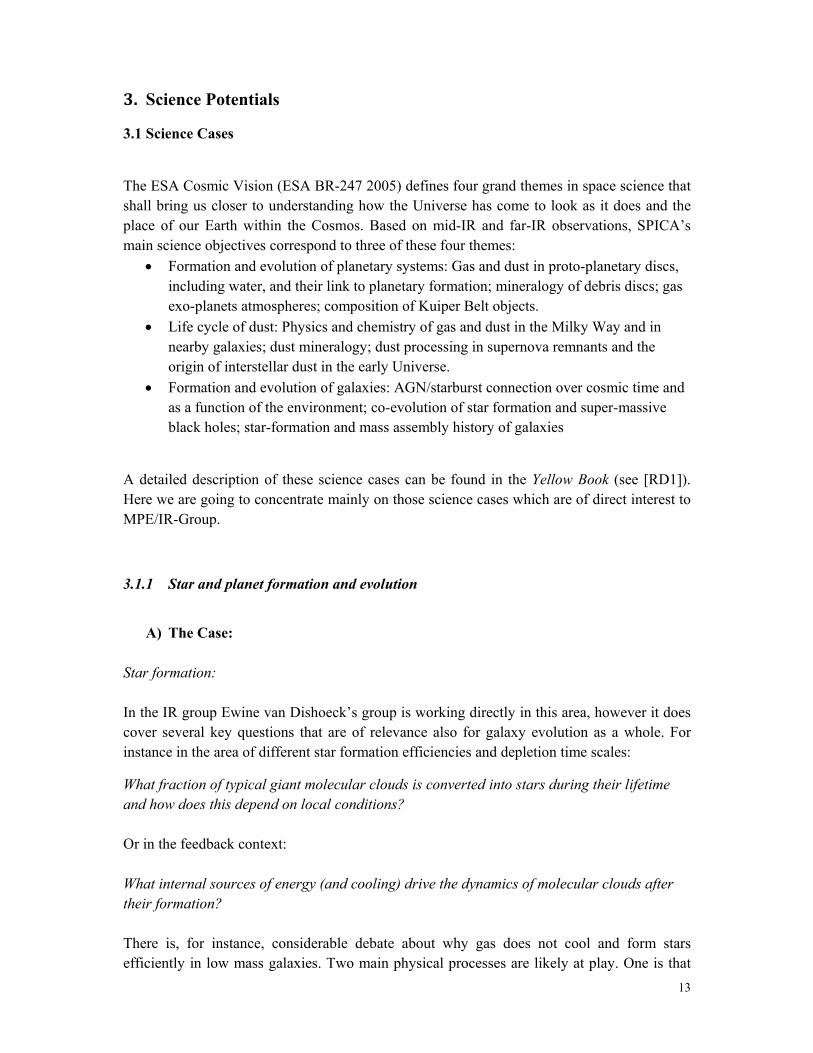
The SAcombinaMost mothers mlevel offunding
Since Dwere nobut therstronger
The shascheme”science
Left: AchievedTransform Specackground comp0 μm and we aated NEP to da
rs developed at pixel pitch, whicthe ones for the
AFARI Con
AFARI Consation of mo
major work pmay not havf commitmeg seems to b
DLR/MPE rot ready to re is a strongr MPE invo
aring of the”, rather thathemes, in
d unresolved linctrometer operaprised of the Z
assume instantaate (thick greenSRON, with NEch is necessarye PACS photoc
nsortium Or
sortium, conost institutepackages have found theent by natiobe roughly a
recently onlmake any cg wish from
olvement, as
e Guarantean the “PAwhich the C
ne sensitivity onating with three
Zodiacal light ananeous Nyquistn line) is 4x10⁻¹
NEP close to besy for SiN with itconductor array
rganisation
nsisting of ~es responsibave been ade most comnal space a
adequate.
ly were ablecommitmen
m both, the Ss discussed b
ed Time oCS schemeCoIs (or the
T
8
n SPICA as a fe wavelength limnd the Cosmic t sampling of th19 W/Hz1/2. Rigst single detectots relatively higys are used to a
~28 institutble for the dopted by,
mpetent teamagencies is s
e to keep thnt, the GermSAFARI PI below.
f the SAFA”, i.e., there
eir represen
Tc=103 mK,1.5 m
8x9 arrays based
function of detemited detector IR background
he point spreadght: First largeror. The diagonagh thermal conachieve “filled”
tes, is – to fthree Hers
already, bums to tackle somewhat d
he SQUID dman contribu
institute an
ARI consore will be w
ntatives) can
mm legs TES: NEP
d on 250 nm SiN
ector dark NEPbands under thd. The bands usd function – i.e.r array of long-ally-strung legs
nductivity. Ligh” arrays.
first order aschel focal
ut some are them. The
diverse, but
developmenution is ma
nd the Japan
rtium will working groun contribute
40 pixels:1 mm x 2 m x
32 pixels:1.5 mm x 2 m
measured 5x10-
P for a broad bahe assumption osed were centre. 0.5 f/# λ pixel-leg/low-G TESs allow a lengthht cone arrays s
approximatiplane instrstill floatin
e funding sithe overall
nt at PTB aarginal in thnese side for
follow the ups on a nu to the defin
x 250 nm
m x 250 nm
-19W/√ Hz
10
and (R~3) of a ed on 48, ls. S h greater similar in
ion – the ruments.
ng, while ituation / level of
alive and his chart, r a much
“SPIRE umber of nition of

11
programmes. However, there is an explicit intention by the PI institute to establish some form of reciprocity, where CoI institutes are supposed to be “paid back” in the science programmes in proportion to their “hard” contributions – i.e., hardware, facilities, tests, ICC work.
2.3 Science Management / ObservingTimeAllocation
The SPICA observing time will be distributed following the principle of “guaranteed” and “open” time. Guaranteed time will be allocated to the scientific institutes directly involved in the building of the focal plane instruments. The instrument consortia will decide internally the distribution of their guaranteed time, under the final responsibility of the instrument PI. Open time will be allocated to proposals submitted by general astronomers, through a competitive process in which the TAC will provide the final recommendations. A single international scientific Observing Time Allocation Committee will be established by JAXA, ESA and other potential mission partners sufficiently early before launch. The composition of the TAC will be arranged such that conflicts of interests with proposers will be avoided. It will be based on scientific excellence.
In the following, the percentages of SPICA time for each category are specified (with respect to total satellite time in the Nominal Observation phase):
Engineering/Calibration Time: 10%
Director’s time, including ToO observations: 5%
Guaranteed time for SPICA team: 25%. It will be shared taking into account the relative contribution of each team to the project, and includes the guaranteed time for instrument teams, science team members, and science operations centres.
Open Time: 60%, which will be further subdivided as: – For astronomers from countries directly involved in the SPICA project: 40% – For the general community, without restrictions of nationality: 20%
The time allocation to European astronomers will be proportional to the European economic contribution to SPICA, which we assume will amount to one third of the total. Consequently, the fraction of European open plus guaranteed time should also be one third of the “allocated” open and guaranteed time. Within this scenario, time reserved to astronomers of the [contributing] ESA member states is distributed in the following way:
European guaranteed Time: 8.3% of total satellite time, of which 95% is reserved for the SAFARI consortium, 3.5% for the ESA SPICA Science Centre, and 1.5% for the European mission scientists.
European open time: 13% of the total satellite time (or 22% of the total open time).

12
Assuming 33.000 hours are available in total (for a goal lifetime of 5 years, therefore a mission operational phase of 4.5 years, and an efficiency of 20hrs per day) this translates into
0.083*0.95*33.000 hrs = 2.600 hrs for SAFARI
0.13*33.000 hrs = 4.300 hrs for European open time
The return for a 10% contribution to SAFARI would therefore amount to 260hrs guaranteed time. Assuming a total cost of SAFARI of 140Mio € this corresponds to a contribution of 14 Mio €.
One might argue, and experience has shown in some cases, that one does not necessarily have to be a major contributor in terms of money and hardware to be a (co-)leader of one of the major science programs if one has a strong science team that knows how to design an observing program, brings in lots of up-to-date knowledge, complementary data and modeling expertise. In that case it is perhaps more important to have a 'foot' in the door of the GT program. The alternative route is to assume that the institute is scientifically strong enough to get a large program approved in the open time. We all have our experience with TACs: sometimes this strategy works, sometimes not. For a 5 yr mission, one would assume it is possible to get a good chunk of time through the open route, although one may then not be the first to do the new science.
13
3. Science Potentials
3.1 Science Cases
The ESA Cosmic Vision (ESA BR-247 2005) defines four grand themes in space science that shall bring us closer to understanding how the Universe has come to look as it does and the place of our Earth within the Cosmos. Based on mid-IR and far-IR observations, SPICA’s main science objectives correspond to three of these four themes:
Formation and evolution of planetary systems: Gas and dust in proto-planetary discs, including water, and their link to planetary formation; mineralogy of debris discs; gas exo-planets atmospheres; composition of Kuiper Belt objects.
Life cycle of dust: Physics and chemistry of gas and dust in the Milky Way and in nearby galaxies; dust mineralogy; dust processing in supernova remnants and the origin of interstellar dust in the early Universe.
Formation and evolution of galaxies: AGN/starburst connection over cosmic time and as a function of the environment; co-evolution of star formation and super-massive black holes; star-formation and mass assembly history of galaxies
A detailed description of these science cases can be found in the Yellow Book (see [RD1]). Here we are going to concentrate mainly on those science cases which are of direct interest to MPE/IR-Group.
3.1.1 Star and planet formation and evolution
A) The Case:
Star formation: In the IR group Ewine van Dishoeck’s group is working directly in this area, however it does cover several key questions that are of relevance also for galaxy evolution as a whole. For instance in the area of different star formation efficiencies and depletion time scales:
What fraction of typical giant molecular clouds is converted into stars during their lifetime and how does this depend on local conditions? Or in the feedback context: What internal sources of energy (and cooling) drive the dynamics of molecular clouds after their formation? There is, for instance, considerable debate about why gas does not cool and form stars efficiently in low mass galaxies. Two main physical processes are likely at play. One is that
supernoescapes second gas maymolecul Mappinmore thwould a
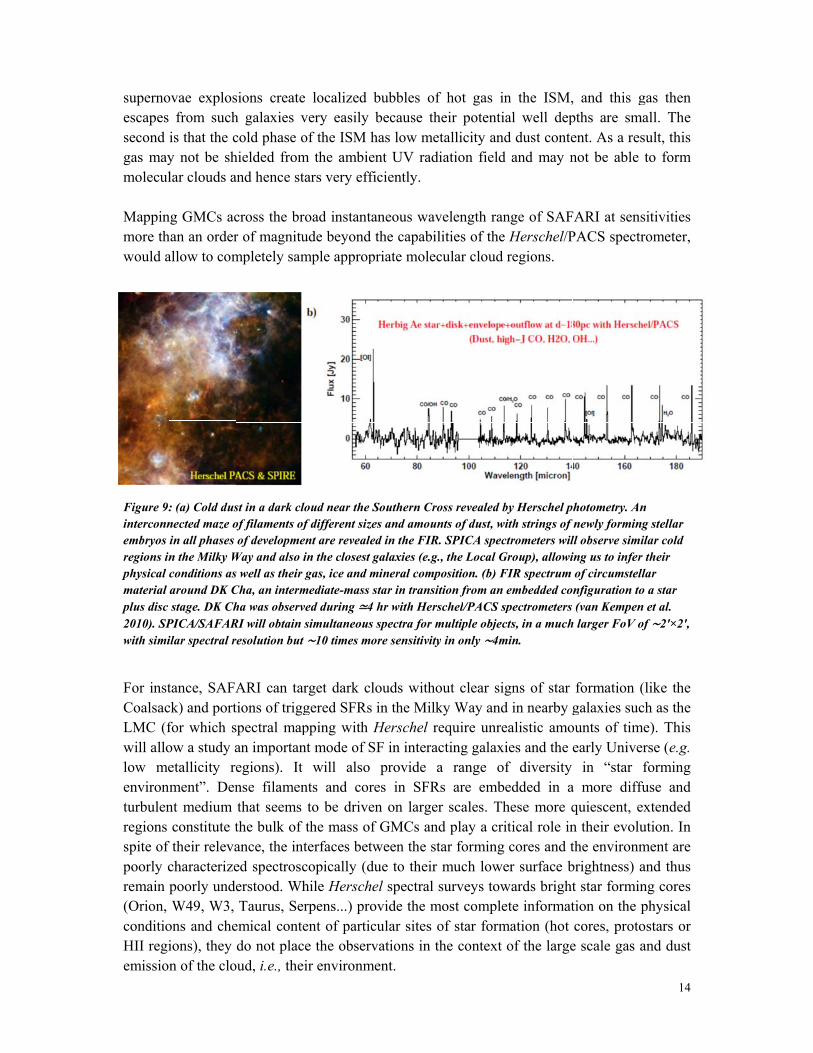
Figure 9:interconnembryos regions inphysical material plus disc 2010). SPwith simi
For instCoalsacLMC (fwill allolow meenvironturbulenregions spite of poorly cremain (Orion, conditioHII regiemissio
ovae explos from suchis that the cy not be shlar clouds a
ng GMCs achan an orderallow to com
: (a) Cold dusnected maze oin all phases n the Milky Wconditions asaround DK Cstage. DK Ch
PICA/SAFARilar spectral r
tance, SAFAck) and portfor which sow a study aetallicity rement”. Dennt medium constitute t
f their relevacharacterizepoorly undeW49, W3,
ons and cheions), they n of the clo
sions createh galaxies vcold phase ohielded fromand hence st
cross the brr of magnitumpletely sam
st in a dark clof filaments ofof developme
Way and also is well as their Cha, an intermha was observRI will obtain resolution but
ARI can tartions of triggspectral mapan importanegions). It nse filamenthat seems the bulk of ance, the inted spectroscerstood. WhTaurus, Se
emical contedo not plac
oud, i.e., the
e localized very easily of the ISM hm the ambietars very eff
road instantude beyondmple approp
loud near the f different siz
ent are revealein the closest gas, ice and m
mediate-mass ved during ≃4simultaneous
t ∼10 times m
rget dark cgered SFRspping with nt mode of S
will also nts and corto be drivethe mass ofterfaces betcopically (dhile Herschrpens...) proent of partic
ce the obserir environm
bubbles ofbecause th
has low meent UV radficiently.
aneous wavd the capabilpriate molec
Southern Crozes and amouned in the FIRgalaxies (e.g.
mineral compstar in transi
4 hr with Herss spectra for more sensitivity
louds withos in the MilkHerschel r
SF in interaprovide a
res in SFRen on largerf GMCs antween the stdue to their hel spectral ovide the mcular sites o
rvations in tment.
f hot gas inheir potentiaetallicity anddiation field
velength ranlities of the cular cloud
oss revealed bnts of dust, wi
R. SPICA spec., the Local Gposition. (b) Fition from an schel/PACS spmultiple objecy in only ∼4m
out clear sigky Way andequire unrecting galaxia range of
Rs are ember scales. Thd play a critar forming much lowe
surveys towmost compleof star formthe context
n the ISM,al well depd dust conte
d and may n
nge of SAFHerschel/Pregions.
by Herschel pith strings of
ctrometers wilGroup), allowiFIR spectrum
embedded cospectrometers cts, in a much
min.
gns of star d in nearby gealistic amoies and the f diversity edded in ahese more qitical role incores and t
er surface bwards brightete informatmation (hot
of the large
, and this gpths are sment. As a renot be able
FARI at senPACS spect
hotometry. Annewly formin
ll observe siming us to inferof circumstelnfiguration to(van Kempen
h larger FoV o
formation galaxies suc
ounts of timearly Unive
in “star a more diffquiescent, en their evoluthe environmbrightness) at star formintion on the cores, proto
e scale gas
14
gas then mall. The
sult, this to form
sitivities trometer,
n ng stellar ilar cold r their llar o a star n et al. of ∼2′×2′,
(like the ch as the
me). This erse (e.g. forming
fuse and extended ution. In ment are and thus ng cores physical ostars or and dust

15
Protoplanetary and debris disks Planets form in disks around young stars during the collapse of the parent molecular cloud cores. Our understanding of the physical and chemical conditions in such disks is still very incomplete, in particular how they evolve from the gas-rich protoplanetary phase to the gas-poor debris disk phase and how planets as diverse as the hot Jupiters and (super-)Earth-like planets form as function of stellar type and location in the galaxy. ISO and Herschel-PACS have shown that far-infrared spectroscopy is a powerful and unique tool to determine the physical structure of the gas, the major carbon- and oxygen chemical species (CO, C+, H2O, OH, O) and the mineralogy of the dust grains in the planet-forming zones of disks. However, ISO and PACS have been able to survey only about 20 of the brightest disks around intermediate mass Herbig Ae/Be stars. The majority of the Sun-like T Tauri stars were too faint even for Herschel.
B) Assessment and Feasibility:
ALMA observations of YSOs will soon help us to resolve their inner structure individually (below scales of a few tens of AU), however ALMA is not designed to map the large scale distribution of gas and dust in GMCs (with spatial scales of several parsec). A full picture of their physical conditions (energy budget, neutral/ionized gas filling factors, density and temperature gradients) has great relevance for Astronomy since it is the widespread gas and dust (the environment) that sets the initial conditions for star formation in diverse regions. SAFARI will map these faint extended regions both in the dust continuum and gas lines simultaneously. Ground-based single-dish sub-mm telescopes (IRAM, JCMT or CCAT in the future) are able to map the low energy transitions of molecules like CO, CN, C2H, ... and the sub-mm dust continuum emission over large spatial scales. However, they cannot access the brightest gas cooling lines ([Si II]34, [OI]63, [C II]158, ...) and they cannot observe the dust SED peak (essential to determine the dust temperature). SAFARI’s large field of view will also help us to trace the action of parsec-scale molecular outflows as they impact the ambient inter-clump medium and the role of UV radiation at large scales. In order to answer the questions posed above, a coordinated spectral survey with SAFARI of several clouds that cannot be accessed spectroscopically with Herschel, both locally and in nearby galaxies is vital.
The Herschel HiGAL key program will survey the entire galactic plane from 60 to 600 micron and, combined with Spitzer-GLIMPSE data, should be able to find all young stellar objects down to the low-mass regime and thus determine star formation efficiencies as functions of environment and galactocentric radius. The HERITAGE - SAGE key programs can do the same for the LMC and SMC, down to a higher-mass limit, and allow studies as function of metallicity. Therefore, there currently does not appear a strong science case to re-do the Galactic plane photometry mapping with SPICA (except perhaps the 45 micron channel).
16
On the other hand, Herschel is performing only very limited spectral mapping of galactic clouds. Although more than 100 (low and high-mass) YSOs are targeted by PACS/SPIRE spectroscopy, most of them are at a single staring position covering just the instrument footprints around the source. Only a handful of PACS maps of ~5-10' in size have been made and then usually just in a single line (see the L1157 H2O map example). Thus, there is a great opportunity for SAFARI to map large areas on scales of tens of pc in all the major gas cooling FIR lines (CO, H2O, OH, [O I], [C II]), investigate how their (relative) contributions change with position from the exciting source, and quantify the feedback effects of UV photons vs X-rays vs outflows and shocks. This should result in a better understanding of the feedback mechanisms and allow a much closer connection to be made with the extragalactic star formation science. With its increased sensitivity by a factor of 10 and more, SAFARI can survey hundreds of T Tauri disks and study their structure as function of spectral type, age, accretion rate, etc. This is particularly exciting because Spitzer spectroscopy has shown that the T Tauri disks are much more line-rich than the Herbig disks, so that many surprises are likely. Also, the T Tauri disk composition allows a much more direct link to be made with solar system and exo-planetary atmosphere studies. The SAFARI data would be complementary to ALMA observations, which probes the cooler gas and dust deeper in the disk.

17
3.1.2 Exoplanets We list this topic here in case there is interest in the institute to get more involved in this science area in the future, be it, e.g., in the context of the new/planned Harvard – MPG Center for Interdisciplinary Astrophysics Frontiers (CIAF), or perhaps in the context of the Morfill succession.
C) The Case:
The observation of exoplanets (EPs) at IR wavelengths offers several advantages compared to traditional studies in the visible domain. First, the star-to-planet flux contrast is much lower than in the visible and second, transiting planets around stars much cooler than the Sun have to be observed in the IR where their emission peaks. The mid infrared region is particularly rich in molecular features that can identify the composition of planetary atmospheres and potentially trace the fingerprints of primitive biological activity.
Two different observational approaches can be used to characterize both outer and inner EPs: direct detection and transit techniques. Direct detection refers to observations where the star and the planet can be spatially separated on the sky with coronagraphs. Due to the limited size of current telescopes, this technique is only able to image EPs at large orbital distances. EPs orbiting very close to the host star (< 0.05 AU) and with a favorable inclination (almost edge-on systems) can be indirectly studied via the transit technique, i.e. by observations when the EP passes in front or behind the star. Although not specifically designed for EP research, transit observations with Hubble and Spitzer have been successfully performed over the past 5 years. Spitzer, e.g., has measured EP photometric transits out to 24 μm demonstrating that the light-curve is simpler (“box-like”) than in the visible domain due to the negligible role of stellar limb-darkening effects. This allows a better determination of the EP radius as a function of wavelength and provides further strong constraints on the atmospheric properties. Transit observations with the Spitzer-IRS MIR spectrometer have been used to extract the absolute intrinsic spectrum of HD209458b hot Jupiter around a Sun-like star.
Chromatic Differential Astrometry (CDA) is a concept to determine the orbital parameters and the spectra of EPs via measurement of the displacement of the photo-centre of a source as a function of its wavelength. It can be applied to inner (0.05 < a < 2 AU from their parent), Jupiter mass exo-planets that cannot be spatially resolved from their parent stars. CDA does not require the planetary orbit to produce eclipses. Therefore this method is complementary to both coronagraphic direct observation and planetary transit monitoring techniques.
While transit spectroscopy with SPICA is currently being discussed for the mid- and far-IR spectrometers MCS and SAFARI, a dedicated FPI for coronographic imaging and spectroscopy (SCI) is under review, too (see chapter 2.1).
D) Assumptions and Feasibility:
In the coming decades many space and ground based facilities are planned that are designed to search for EPs on all scales from massive, young “hot Jupiters”, through large rocky
18
“super-Earths”, for inner planets as well as for outer planets. For instance, EPs are part of the GRAVITY science case (employing astrometric and micro-arcsecond imaging and the CDA technique). SPICA’s capabilities towards exo-planet science has to be judged in this environment of competing projects. Few of the planned facilities, however, will have the ability to characterize the atmospheres which they discover through the application of infrared spectroscopy. For instance, JWST will have photometric coronagraphs in the MIR but without spectroscopy. Other direct imagers/coronographs are available with NACO (e.g. beta Pic was observed with this), GPI (Gemini Planet Imager), HiCIAO at SUBARU, or Nulling Interferometry (e.g. at Keck). Ground based transit surveys are performed, e.g, in the projects HAT (CfA), WASP (UK), XO (STScI), while space-based transit surveys are done with, e.g., COROT (a CNES/ESA mission). Other space-based EP missions, which are planned or on hold are, TPF (NASA), Darwin (ESA), SIM (NASA), or TESS (NASA SMEX).
The M3 ESA mission EChO (Exoplanet Characterisation Observatory) is currently under assessment. If selected, it will provide high resolution, multi-wavelength spectroscopic observations, covering continuously the 0.4-16 µm spectral range. It will be placed in a grand halo orbit around L2. Echo was designed and optimized to look at transiting planets.
Other spectroscopic projects are designed for the search for earth-like planets (like the CARMENES project at Calar Alto, a radial-velocity survey of exo-planets around M dwarfs with optical to NIR spectroscopy, or ESPRESSO at the VLT).
A comprehensive comparison and assessment of SPICA’s abilities and complementarities with respect to all these existing or planned missions is out of the scope of this white paper. The capability for mid-IR spectroscopy combined with a coronagraph is certainly the most important point to be mentioned as a SPICA advantage. Constraining the temperature and atmospheric composition will greatly help in the analysis of all the near-IR/ground-based planet finders (like GPI, or SHERE at the VLT). In addition to the clear advantage of doing mid-IR spectroscopy further complementarity will come from the various kinds of EPs that the different missions will measure with different techniques (e.g. outer vs. inner, giant gas vs. earth-like rocky etc). In this context SPICA (/CSI) will be able to study outer, giant, gas like planets.
A critical number for the assessment of the potential exo-planet science with SPICA is the contrast that can be reached. The baseline design for the SCI supposes the contrast at PSF to be 10-4, which is only marginal for the detection of a significant number of exo-planets. An advanced design supposes the contrast at PSF to be 10-6 with wave front control by a deformable mirror. This design is, however, considered to be not mature enough in the currently ongoing assessment study. The SCI team has therefore performed simulations of methods to enhance the contrast by the subtraction of the PSF (observed with reference stars). Taking into account pointing instabilities and wavefront errors they could show that the contrast can be enhanced to 10-5 - 10-6 even without a deformable mirror by such subtraction techniques. The expected number of detectable planets with SCI is then, depending on wavelength, several tens to more than hundred. This depends also on the age of the system and the distance of the planet form the parent star.
19
3.1.3 Galaxy evolution
A) The Case:
Galaxy evolution is one of the central themes of the IR-group and of the MPE as a whole. With ISO, Spitzer and Herschel (for instance) we have pioneered many different methods of mid- and far-IR diagnostics to characterize and quantify the nature of galaxies and the respective roles of star formation and AGN activity therein. We have spent large efforts with the goal to understand and unravel all kinds of relationships, e.g. between the black hole growth and bulge formation, between SFR and stellar mass, star formation efficiencies and modes of star formation, etc.
The big next step forward that SPICA (in particular SAFARI and the medium resolution branch of the mid-IR spectrometer) promises is the ability to apply, more or less for the first time and to a large extent, the aforementioned diagnostics based on mid-to-far IR line spectroscopy to galaxies at medium and high redshifts. These will provide measured (rather than estimated) redshifts and also unambiguously characterise the detected sources, by measuring the AGN and starburst contributions to their bolometric luminosities over a wide range of cosmological epochs.
The wide SAFARI FOV of 2′ × 2′ will make it possible for the first time to collect blind spectroscopic surveys, wide and deep enough to measure the underlying physical processes driving galaxy evolution out to z ∼ 4 and, in the most luminous/lensed objects, to even higher redshift. By comparing blind surveys with those targeted around known, high-z objects, it will also be possible to determine the role of environment on galaxy evolution. Below we mention just very briefly some of the potentially interesting science cases:
- AGN feedback: outflows of molecular gas in warm and cold phases
Mass outflows driven by stars and active galactic nuclei are a key element in many current models of galaxy evolution. The successful Herschel-PACS measurements of molecular outflows in the local Universe can be extended by SAFARI to higher redshifts
- Querying for the obscured AGN missing from the X-ray background
and
Accretion history of the Universe and black hole masses in obscured environments
The construction of luminosity functions from high ionization lines (like [OIV]) can be used as a means of studying the accretion rate history of the Universe that is an alternative to X-rays, in particular for Compton thick sources. The widths of the same lines depend on the kinematics of the clouds that they probe, determined by either the gravitational potential out to a radius that the AGN luminosity dictates, or by AGN feedback effects. They can be used to weigh the masses of black holes, permitting the

cr
- M
Dzh
- S
Wr(
- B
Ttfwcab
creation of bredshift of 4
Molecular
Detection oz ranges (ouhas only be
Spectrosco
Wide-field redshifts. W(rest-wave)
Beating spa
The third, spto overcomefrom a sourwavelengthconfusion isallows to debelow the c
Figure 10: image, withits spectral full 34 − 21
black hole m4 using the
content ev
of the pure rut to z~2) inen detected
opy of faint
surveys likeWith SAFAR
mid-IR spe
atial confu
pectral dime confusionrce at a givehs, and so ths drasticallyetect and stuontinuum c
A 5′ × 5′ regh the 2′×2′ FOimaging capa
10 μm range,
mass functi[OIV] line.
olution of t
otational linn deep SAFAd in stacked
galaxy pop
e Herschel-RI, it will beectroscopy.
sion
mension offen even in theen redshift ahe high densy reduced reudy individuconfusion lim
gion taken frOV of SAFARability, SAFAin multiple so
ons that inc
the Univers
nes of H2 (SARI surveyspectra of z
pulations th
ATLAS areecome poss
ered by spece deepest exappears onlysity of sourcelative to allual objects, mit.
rom an off-soRI outlined (c
ARI will be abources, simult
clude obscur
se
S(0) and S(1ys. To date, z ∼ 1 galaxi
hrough gra
e finding maible to study
ctroscopic suxplored fieldy at very speces in an indl sources emwhose con
ource part of credit: ESA anble to obtain sptaneously – in
red AGN w
1)) will be fbeyond the ies.
avitational
any lensed sy these lens
urveys provds. Narrow-ecific and ddividual beamitting in thntinuum may
a 250 μm ESnd the SPIREspectral informn a single poin
with SAFAR
feasible for vlocal Unive
lensing
systems at hsed galaxies
vides us wit-band line e
discrete am that caushe continuumy be substan
SA SPIRE puE consortium)mation coverinting
20
RI out to
various erse H2
high s with
h a way emission
ses m. This ntially
ublicity ). With ing the

B) A
As brieffar-infra • Detect• Direct• Partly • Study • Study
Spinogldifferenet al.) winfraredlocal AGhigh z sthe detamotivat[RD3]).
We ado2x2arcm210μm.sigma in
In 450 isourcessensitivpopulati
Berta et16.7 bearespecti
Assessmen
fly summariared space t
t large numbtly measure break the cthe energy their host d
lio et al. (sent simple ‘bwhich are cd/submm daGN hosts a
spectroscopiailed approted some qu. The Spino
opt the depthmin) as SpThe follown 1, 2, etc. l
independen. A sensitive. The tradion (here th
t al. 2010, 2ams/source ively, half o
t and Feasi
ized above telescope ha
bers of hightheir redshi
confusion limsources and
dynamics vi
ee [RD2]) hbackward evcalibrated mata. They thand a yet smic surveys. T
oach of Spiuick own exglio results
hs for a 1hrpinoglio et ing table gilines, over t
nt pointingsity optimizedeoff may
he multiplex
2011 derive confusion
of that (600
ibility:
deep integrave large po
h-redshift gaifts withoutmit which id ISM condia integrated
have presenvolution momostly on phen use relatmaller sampThis is a strinoglio et axperiments broadly agr
r per field sal.: 4.16,
ives the statthe entire re
s there are >ed single apdiffer whe
xing advanta
counts andlimit there
00 and 3000
ral field specotential. At
alaxies and t need for ids affecting b
ditions, via ad line profil
nted predicodels’ (Gruppre-Herschetions of line
ple of star foraightforwaral., plus a which are ree with our
survey of 0.2.58, 2.48
tistics of hoedshifts rang
> 5σ detectiperture specen e.g. aimage will be r
d Herschel care about 10) in our fi
ctroscopic ssufficient se
determine tdentificationbroadband fa variety of es or line w
tions for suppioni et alel (and parte flux to LI
forming galard approachdesire to bdescribed ir own result
.5 sq.deg. (48×10−19Wmow many soge, and for a
ions in at lectrograph w
ming for a reduced).
confusion lim2000 and 6iducial surv
surveys usinensitivity th
their luminon at other wfar-infraredmid- and fa
widths.
uch surveysl., Franceschtly early HIR, based onaxies, to deh. A numberbe able to ‘n the note bts.
450hr total,m−2 for 34–ources are da restricted
east one linould need tocharacterisa
mits at 100 6000 sourcevey. While
ng a fully crhey can
osities/SFRavelengths.
d measuremear-infrared l
s. They adohini et al.,
Herschel) brn a small sa
erive predictr of questio‘play’ withby DL and
, from 450 –60, 60–11detected aboredshift ran
ne of ∼5000o be ∼3 timation of a
and 160μmes per squarthis means
21
ryogenic
s. ents. lines.
opt three Valiante
roadband ample of tions for ns about
h models JG (see
fields of 0, 110–
ove 3 (5) nge z≥1:
0 distinct mes more
specific
m. To the e degree that the

fiducial confusio
More thprovide possiblemodest i.e not fthe PAH
Makingsources
Below wdetectio[RD3].
CII 158
OIII 88 OII 52: SIII 33:
Safari survon, it will re
han half of t robust rede to increasSNR line d
fix the redshHs here.
g the simplifwith at leas
we summarons for vari
:
:
vey is not each it and a
the sources dshifts. [OI]se, by combdetections. Ehifts of the
fied assumpst one such
rize the resuious redshif
yet workinalready help
(∼2500) ha and [SiII] bining robuEssentially high redsh
ption that linline, of whi
ults of [RD3ft bins and
OI 145:
OI 63:
NeIII 3
H2 S(0
ng massivelp breaking t
ave > 5σ demay be ve
ust single liall redshiftift tail of IR
ne widths stich 845 are
3] for one ofor 3 and
:
36:
0) 28
ly into breathe inevitab
tections in aery relevantnes with phts based on R galaxies.
tart to be usat z≥1.
of the model5 sigma is
aking the bble blends.
at least twot here. Thishot-z, or byemission liWe did NO
seful at SNR
ls. For eachgiven. For
NII 122:
NIII 57:
SiII 35:
FeII 26:
broadband H
o lines whichs number shy considerinines will be
OT check fo
R>10, we fi
h line the nur further de
22
Herschel
h should hould be ng more e at z<3, or use of
ind 1721
umber of etails see
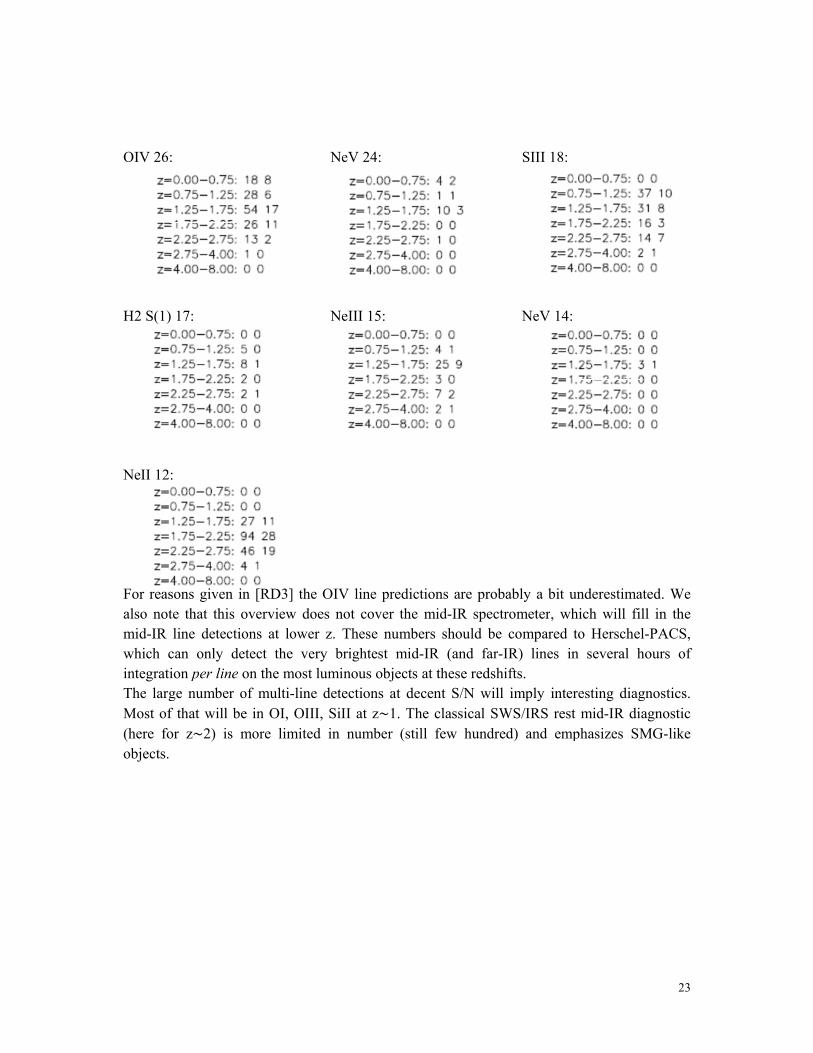
OIV 26 H2 S(1) NeII 12 For reasalso notmid-IR which cintegratThe largMost of(here foobjects.
:
) 17:
:
sons given te that this line detect
can only dtion per linege number f that will bor z∼2) is
in [RD3] thoverview d
tions at lowdetect the ve on the mos
of multi-linbe in OI, Omore limit
NeV 24
NeIII 1
he OIV linedoes not co
wer z. Thesvery brightst luminousne detection
OIII, SiII at ted in num
4:
15:
e predictionover the mie numbers
test mid-IRs objects at tns at decenz∼1. The c
mber (still f
ns are probid-IR spectrshould be
R (and far-Ithese redshint S/N will classical SWfew hundre
SIII 18:
NeV 14:
ably a bit urometer, whcompared
IR) lines inifts. imply inte
WS/IRS rested) and emp
underestimahich will fito Herschen several h
resting diagt mid-IR diphasizes SM
23
ated. We ill in the l-PACS, hours of
gnostics. iagnostic MG-like

24
4. Potential MPE Contributions
A contribution to the SAFARI project could have several advantages:
- access to guaranteed time (with first choice of targets and science topics)
- access to privileged open time (or privileged access to open time)
- in-depth instrument and software knowledge right from the beginning of the observations
- preservation of know-how in the group for space-based operations
- maintain and extend a world class expertise in far-IR detector technology
However, in order to benefit from this on a significant level, the contribution has to reach a “critical mass” below which the gain in knowledge is insignificant and a participation in the regular open time competition could be more efficient. As described in section 2.3 260 hours of guaranteed observing time would be equivalent to ~14 Mio € (pending the exact modalities of GT collaborations). We describe here a potential scenario (with several options) for MPE’s contribution that would reach this “critical mass” in our opinion.
4.1 Involvement up to now
Members of the MPE have been involved in the SAFARI development work since 2004 and have played a central role in all phases of the instrument definition and development. Prior to the move of PI-ship to SRON, a member of the MPE (WR) has been the instrument scientist for SAFARI. Besides our general participation in the instrument development, our main points of involvement so far include the investigation of an alternative (grating) spectrometer design, an upgrade of the “GIRL mechanism” to be used for the FTS scanner stage and the development of large scale photoconductor arrays suitable as baseline “state of the art” detector arrays for SAFARI. AlPog, DL and ES have been involved in the Cosmic Vision proposal and the Yellow Book. AlPog is the leading SPICA coordinator (“Head of Nation” board) for Germany. EvD and ES are members of the ESA SPICA science advisory team and focal plane instrument review team.
4.2 Suggestions for future contributions
MPE and its IR-Group have gained significant expertise in almost all aspects of scientific infrared space missions during the development of ISO-SWS and Herschel-PACS. Hence, there is a large number of areas for the institute for getting involved in a next generation far-IR satellite. During discussions within the SAFARI consortium over the last few years, the following points for a potential MPE involvement have emerged:

25
- Participation in the SAFARI instrument control center
- Detector system tests
- SQUID array and cryogenic pre-amplifier development
- Cryo-mechanism (filter wheel) development
In the following sub-chapters we give a detailed overview over each one of these potential points of involvement. Special emphasis has been placed on the following crucial parameters: timeline (beginning and end of our involvement), required personnel (personnel employed at MPE other than central services), in house resources (resources required from central services) and required budget (total cost other than personnel). The quotes for times and numbers arise from the knowledge we have to date and therefore represent the best estimate we can make at this point of time. In addition to the detailed list of required resources, we will present a summary of total costs at the end of this chapter, including an assumption about a split between MPE and DLR. It is important in this context that all possible contributions listed below are independent of each other, and committing to any one point does not necessarily imply an involvement in any other. For simplicity, we have assumed below a rate of 65.000€/year for all kinds of staff costs. All FTEs are to be understood as FTE per year.
4.2.1 Participation in the Instrument Control Center (ICC)
Based on the extensive experience of previous missions (e.g. the PACS ICC), our institute has gained tremendous expertise in all aspects related to the Instrument Control Center of space missions. Participation in the ICC could therefore cover almost all segments of the SAFARI ICC, especially: software development including data reduction tools, instrument commanding modules, quick look and real time analysis tools as well as EGSE related software developments, documentation (observer’s manual, calibration documents, etc...) as well as user support during the mission life time of SPICA. In the context of a potential ICC participation, the MPE could also provide calibration scientists, who would contribute to the planning of calibration and observing procedures, but also take an active role in instrument test campaigns at all phases of the instrument development. This role would be especially valuable as it would provide insight into the details of instrument operation, which will – as experience has shown – provide a significant advantage for both, the planning of actual SAFARI observations, as well as the reduction of the highly complex data products of the instrument.
Timeline:
A fully staffed ICC is required from the beginning of 2017 (SAFARI QM delivery) until mid-2027 (end of SPICA mission). A ramp-up of the ICC staff will be required between 2012 and end-2016.
26
Suggested personnel and required budget:
6 FTE for 10 years (2017 – 2027) with a ramp-up of 1 FTE/year over 5 years (starting in 2012) will be required for the envisaged contribution to the SAFARI ICC. The cost of this involvement consists mostly of personnel cost. Additional 100 k€ will be required for computer infrastructure and travel costs.
The total required effort for this involvement is 78 man years. The total cost for the ICC contribution, including personnel and computers will therefore be 5.2 M€ (over 15 years, including ramp-up phase). Assuming a split of 24 FTE (MPE) : 54 FTE (DLR) (i.e. ~1:2) this would mean an average MPE contribution equivalent to ~1.6 FTE/year.
In-house resources (central services):
DV-group: computer system support: 0.5 FTE over 10 years (2017 - 2027)
4.2.2 Detector System Tests
MPE was approached by the SAFARI PI and the AIV manager to support the detector and sub-K cooler qualification program. This package encompasses the development of an optical test setup and the verification of the functionality of the fully integrated FPAs (Focal Plane Assembly = detector arrays + read-out + thermal/EMC shield) in conjunction with the sub-K cooler assembly. These tests will form an intermediate integration verification step between detector array tests and the full ILT (Instrument Level Test) and will therefore include:
- Functional verification of all deliverable FPAs with the SAFARI sub-K cooler
- Optical tests on array level (sensitivity, spectral response, cross talk, ghosts, PSF)
- Functional test of the FPA – DPU (data processing unit)
- Standby operation as troubleshooting test bench during QM and FM ILTs
- Full documentation of test setup and test results according to SAFARI qualification procedures
The two natural phases of this contribution consist of: 1) Development and assembly of the test system and 2) The actual test campaigns.
4.2.2.1 Development and Assembly of the Test System
This phase covers the time for design and procurement of the test system and its components, especially: test cryostat with representative cable harness, optical components, light sources, cryo-mechanisms (moving pin hole, spectrometer), independent sub-K cooler and auxiliary electronics. This phase also includes time for test runs and commissioning of the test system.
27
The most demanding aspects of this development are the high requirements for light-tightness and straylight control within the test system.
Timeline:
The test system needs to be ready end-2014 (QM FPAs are delivered). This means the development of the test setup will need to start latest mid-2012, assuming 2½ years of development time. A steep ramp-up of our involvement during the first half of 2012 is therefore required.
Required personnel:
A total of 3 FTE over one year (ramp up during 2012) and 6.5 FTE over 2 years (2013 & 2014) is required to successfully complete this phase. This includes specialists (1 FTE each) for cryo-mechanisms, optics, electronics, computer systems, a PA/QA expert and a management/coordination position, as well as the “phasing in” of a detector specialist during 2014.
The total required effort is 16 FTE corresponding to a total cost for personnel during this phase of 1.04 M€. Here we would consider a split of 7 (MPE) : 9 (DLR) reasonable.
In-house resources (central services):
Konstruktion: mechanical design (external): 1/2 FTE during 2012 + 1 FTE over 2 years (2013 & 2014).
Mechanical workshop: most mechanical components (besides cryostat): 2 FTE over 2 years (2013 & 2014).
Electronics workshop: manufacture of cable harness and auxiliary electronics: 1 FTE over 2 years (2013 & 2014) + 1/2 FTE during 2015.
DV-group: computer system support: 1/2 FTE over 2 years (2013 & 2014)
Required budget:
Cryostat with optical components, cable harness and additional sub-K cooler: 750 k€
Auxiliary electronics equipment (EGSE): 70 k€
Computer system + cards: 50 k€
Mechanism control electronics: 50 k€
General lab equipment: 50 k€
Test runs/commissioning: 30 k€
==========
Total required budget for the test system preparation phase: 1 M€
28
4.2.2.2 Actual Test Phase
All deliverable FPAs (SW, MW, LW on QM, FM and FS level) and sub-K coolers will need to be tested. Test results and recommendations for operation of detectors and coolers will be reported to the SAFRAI detector sub-system manager, AIV manager, PM and PI. The test system needs to be kept ready as troubleshooting test bench during QM and FM ILTs.
Timeline:
Qualification tests of the QM FPAs will start beginning of 2015 (beginning of 2017 in case of the FM FPAs). The test setup will further be needed for FS FPA tests and as troubleshooting test bench until SAFARI FM delivery to JAXA (July 2019). The actual test phase will accordingly begin 2015 and end mid-2019.
Required personnel:
A total of 6 FTE over 5 years is required during this phase. This includes positions for (1 FTE each): a cryostat operator, a detector specialist (to be phased in during 2014), a software specialist, a computer system specialist, a test supervisor/manager/coordinator, and a PA/QA expert.
The total required effort during this phase is 30 man years (proposed split: 10 MPE, 20 DLR), corresponding to a total cost for personnel 1.95 M€.
In-house resources (central services):
Electronics workshop: supporting test campaigns, auxiliary equipment: 0.25 FTE over 5 years (2015 - 2019)
DV-group: computer system support: 0.5 FTE over 5 years (2015 - 2019)
Required budget:
The running costs for the test phase will mostly be due to liquid helium consumption. The total cost for this phase is estimated to be 135k€ (over 5 years).
4.2.3 SQUID Array and Cryogenic Preamplifiers Development
Development of ultra-low noise SQUID arrays is a key element of the SAFARI detector development program. The actual development is carried out by PTB (Physikalisch-Technische Bundesanstalt) – one of the leading institutions in metrology systems. PTB has already started working with MPE to provide SQUID read-outs for the SAFARI detector prototypes. The main role of MPE for this development is to provide support for PTB. MPE will also need to find (and support) an industry partner for space qualification of the SQUID arrays/read-out system.

29
Timeline:
It is important to realize, that the SQUID array development needs to be strictly synchronized with the overall detector development schedule. The schedule calls for delivery of following models: EM – Spring 2013, QM – early 2015, FM – early 2017, FS – mid/end 2018. The collaboration with PTB has already been initiated and development work has started. The development will end with the delivery of FS detector modules in 2018.
Required personnel:
Development of SQUID arrays and cryogenic pre-amplifier will mostly be carried by PTB and a – yet to be determined – industry partner. No hardware development or tests are planned at the MPE. Significantly less personnel is therefore required at MPE as compared to the already mentioned development tasks. The required personnel consists of:
1 FTE for 7 years (2012 - 2018): coordination/management, support of external partners
1 FTE for 6 years (2013 – 2018): detector specialist (partially PA/QA)
1 FTE for 7 years (2013 – 2015): electronics specialist, support of external partners (partially PA/QA)
The total effort for this development is 20 man years (proposed split: 8 MPE, 12 DLR) with total cost for personnel of 1.3 M€.
In-house resources (central services):
Due to the nature of this development program, no in-house resources are required.
Required budget:
The deliverables of all SAFARI detector arrays (2 EM, 3 QM, 3 FM and 3 FS) need to be equipped with suitable SQUID read-out arrays. Assuming a unit cost of 100 k€, procurement of these arrays will require 1.1 M€. An additional 750 k€ will be required for space qualification of these arrays. The development of cryogenic pre-amplifiers will also require 750 k€.
The total required budget for the SQUID array/cryogenic amplifiers is 1.5 M€ (over 7 years).
4.2.4 Filter Wheel Development
The SAFARI instrument employs 2 filter wheels, one for the long wavelength band and one which is shared by the short and mid wavelength bands. The most demanding aspect of this development is the extremely low power dissipation dictated by the thermal budget of the spacecraft. Filter wheel development is currently carried out by INTA in Spain, but in light of the difficulty of the task, SRON has expressed its whish for a more significant involvement of MPE based on the experience gained during the development of the PACS cryo-mechanisms.
30
As the development of the filter wheels is mainly to be carried out by industry, this item mostly consists of industry support, with qualification tests performed at the MPE. These tests would require the development of a cryogenic test system including:
- Modification/adaptation of an existing cryostat
- Development of lab/auxiliary electronics and cable harness
- Documentation of the test setup and test results (the actual qualification documentation is to be prepared by industry)
It is important to note, that this test system is by far less demanding than the one required for the detector/system tests discussed above. Because the filter wheel development is carried out by another institute (INTA) at the moment, we list it here and in the summary table below as “special option” only, i.e. separately from the other options.
Timeline:
According to the SAFARI schedule, the following models need to be delivered: EM: beginning of 2014, QM: mid-2015, FM beginning 2017. The filter wheel development would start beginning of 2012, with first qualification measurements starting mid-2013. FS tests would continue until SAFARI FM delivery (mid-2019). Considering the tight schedule for this development (EM delivery is required already 2 years from now!), it seems clear, that a steep ramp-up of efforts already during 2012 will be required.
Required personnel:
Industry support will require 2 FTE over 8 years (2012 – 2019). These 2 FTE are included in the following, more detailed list of required personnel for the entire development (including test system development and qualification tests):
1 FTE for 8 years (2012 - 2019): Cryo-engineer, test system design, industry support
1 FTE for 8 years (2012 – 2019): coordination/management/test supervisor, industry support
1 FTE for 3 years (2013 – 2015): Electronics development
1/2 FTS for 7 years (2013 – 2019): computer system support/software specialist, data analysis
1 FTE for 6 years (2014 – 2019): PA/QA (external)
The total required effort for this development is 28.5 man years (split: 9 MPE, 19.5 DLR), corresponding to a total cost for personnel of 1.85 M€.
In-house resources (central services):
Konstruktion: mechanical design (external): 1/2 FTE during 2012 + 1 FTE over 2 years (2013 & 2014).
Mechanical workshop: mechanical components for cryostat modifications: 1 FTE over 1 year (2013).
31
Electronics workshop: 1 FTE over 1 year (2013) + 0.25 FTE over 2 years (2014 & 2015).
DV-group: computer system support: 0.5 FTE over 7 years (2013 - 2019).
Required budget:
The development plan calls for delivery of 6 filter wheel models (1 EM, 1 QM, 2 FM and 2 FS). The total cost of all deliverables is 300 k€, assuming a unit cost of 50 k€. On top of this figure, the additional 85 k€ arise for the development of the test system and performing the actual tests: 30 k€ (cryostat modification), 40 k€ (driver electronic + auxiliary equipment), 15 k€ (qualification tests).
The total estimated budget for the filer wheel development is 385 k€.
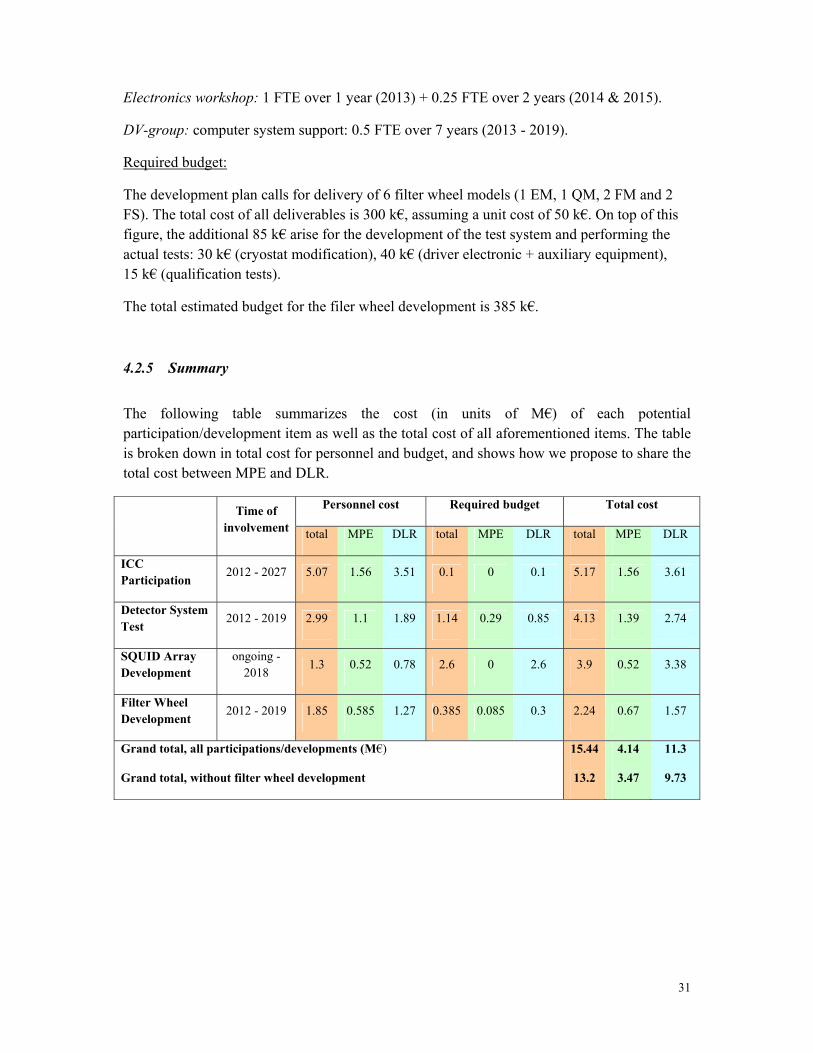
4.2.5 Summary
The following table summarizes the cost (in units of M€) of each potential participation/development item as well as the total cost of all aforementioned items. The table is broken down in total cost for personnel and budget, and shows how we propose to share the total cost between MPE and DLR.
Time of
involvement
Personnel cost Required budget Total cost
total MPE DLR total MPE DLR total MPE DLR
ICC Participation
2012 - 2027 5.07 1.56 3.51 0.1 0 0.1 5.17 1.56 3.61
Detector System Test
2012 - 2019 2.99 1.1 1.89 1.14 0.29 0.85 4.13 1.39 2.74
SQUID Array Development
ongoing - 2018
1.3 0.52 0.78 2.6 0 2.6 3.9 0.52 3.38
Filter Wheel Development
2012 - 2019 1.85 0.585 1.27 0.385 0.085 0.3 2.24 0.67 1.57
Grand total, all participations/developments (M€)
Grand total, without filter wheel development
15.44
13.2
4.14
3.47
11.3
9.73