Embed Size (px)
Citation preview

Sphenoid bone changes in rapid maxillary expansion assessed with cone-beam computed tomography
Objective: Rapid maxillary expansion (RME) is used to expand the maxilla and increase arch perimeter; yet, there are few reports on its effects on the sphenoid bone. With cone-beam computed topography (CBCT), it is possible to visualize sphenoid bone changes. The purpose of this study was to investigate sphenoid bone changes observed in conjunction with RME treatments, using CBCT. Methods: Sixty patients (34 women and 26 men, aged 11–17 years) underwent RME as part of their orthodontic treatment. Patients were randomly assigned to one of three groups: a tooth-anchored group, a bone-anchored group, or a control group. Initial CBCT scans were performed preceding the RME treatment (T1) and again directly after the completion of expansion (T2). Statistical analysis included ANOVA, descriptive statistics, and the intraclass correlation coefficient (ICC). Results: The reliability of the landmark location was at least 0.783, and the largest ICC mean measurement error was 2.32 mm. With regard to distances, the largest change was 0.78 mm, which was not statistically significant (p > 0.05). Statistical significance was established in patient groups of the same sex and treatment type for the following distance measurements: right anterior lateral pterygoid plate to the right edge of the hypophyseal fossa (d2), anterior distance between the medial pterygoid plates (d4), and anterior distance between the left medial and lateral plates (d8). Conclusions: In this study, there were no clinically significant changes in the sphenoid bone due to RME treatments regardless of sex or treatment type.[Korean J Orthod 2016;46(5):269-279]
Key words: Three-dimensional cephalometrics, Expansion, Cone-beam computed tomography, Sphenoid bone
Lucas S. StepankoManuel O. Lagravère
Faculty of Medicine and Dentistry, University of Alberta, Edmonton, AB, Canada
Received October 7, 2015; Revised December 30, 2015; Accepted January 27, 2016.
Corresponding author: Manuel O. Lagravère.Assistant Professor, Faculty of Medicine and Dentistry, Edmonton Clinic Health Academy 5-524, University of Alberta, Edmonton, Alberta T6G 2N8, Canada.Tel +1-780-492-7696 e-mail [email protected]
269
© 2016 The Korean Association of Orthodontists.
The authors report no commercial, proprietary, or financial interest in the products or companies described in this article.
This is an Open Access article distributed under the terms of the Creative Commons Attribution Non-Commercial License (http://creativecommons.org/licenses/by-nc/4.0) which permits unrestricted non-commercial use, distribution, and reproduction in any medium, provided the original work is properly cited.
THE KOREAN JOURNAL of ORTHODONTICSOriginal Article
pISSN 2234-7518 • eISSN 2005-372Xhttp://dx.doi.org/10.4041/kjod.2016.46.5.269
Stepanko and Lagravère • Sphenoid bone changes in maxillary expansion
www.e-kjo.org270 http://dx.doi.org/10.4041/kjod.2016.46.5.269
INTRODUCTION
Arch width discrepancy is a common orthodontic problem for which the treatment of choice is maxillary expansion. Several different protocols are used for this treatment (rapid, slow, and surgical), as are various different types of appliances (i.e., hyrax, haas, and quad-helix). One of the protocols most commonly used is rapid maxillary expansion (RME), wherein a conventional fixed appliance is cemented onto 2 or 4 posterior teeth, and separation of the suture is accomplished by the turning of an expansion screw. This type of treatment has been used for more than a century and was first reported in 1860 by Emerson Angell.1 RME separates the palatal suture and reportedly changes the surrounding sutural structures (i.e., nasal suture, the maxillary zygomatic suture, and zygomatic temporal suture).2
While the purpose of RME is to separate both halves of the maxilla, each bone is connected posteriorly to other bones, which creates resistance to expansion. The sphenoid bone, through the pterygoid plates, is one of these direct attachments. As the conventional appliances used for this treatment are anchored to the teeth, one of the most common side-effects is lateral movement of clinical crowns with concomitant lingual movement of their respective roots.3 Complete skeletal expansion is not accomplished because of resistance of the adjacent hard and soft structures surrounding the maxillary bones. Among these is the sphenoid bone, which is attached to the maxillary bone through the pterygomaxillary suture at the pterygoid plate level.2 Given reports of a posterior maxillary sutural width increase of 1.12 mm due to RME,4 it was hypo-thesized that the sphenoid bone may also be affected by this orthodontic movement. Of note however, the effects of expansion treatment on the sphenoid bone are not very well understood, as traditional radiographs are two-dimensional (2D) and thus do not enable true visualization of the sphenoid bone itself. Because they are 2D, radiographs depict the superimposition of structures, preventing a clear view of the sphenoid bone. This renders analysis of this specific structure via this imaging modality very difficult. As early as 1982, Timms et al.5 reported using a computed tomography (CT) scan to analyze the effects of RME. With the use of cone-beam CT (CBCT), most of the limitations of 2D radiography can be overcome, and a more accurate representation of the changes occurring can be obtained. The application of CBCT in dentistry has resulted in accurate three-dimensional (3D) recreations of previously unseen structures. Furthermore, CBCT’s accuracy and direct visualization of structures have been clearly demonstrated to increase diagnostic accuracy.6 It
also allows dentists to observe and analyze structures without magnification or distortion and facilitates the segmentation of specific bones for analysis.7 Currently, there are no CBCT indication criteria; however, this technology may become the standard diagnostic modality in the future. CBCT images have previously been used to investigate the effects of RME on the sphenoid bone.8 In that study, there was an average opening of 1.88 mm at the maxillary suture and a 0.57-mm increase in the spheno-occipital synchondrosis in patients aged 8–11 years. Although that study shares some similarities with the present study, the sample in the present study consisted of patients aged 11–17 years, and changes in areas of the sphenoid bones other than the synchondrosis were investigated. Magnusson et al.9 recently reported a non-uniform transverse expansion with substantially larger expansion posteriorly than anteriorly. It was also noted that significant lateral tipping was only recorded posteriorly. The purpose of the present study was to investigate skeletal changes in the sphenoid bone using 3D CBCT images after RME treatment with a tooth-borne or a bone-borne maxillary expander. Complete analysis of the sphenoid bone was conducted with a focus on the pterygoid plate region to quantify changes occurring because of RME.
MATERIALS AND METHODS
The present study was approved by the Health Research Ethics Board of the University of Alberta (Pro00001692). The sample used in this study was obtained from a previous research sample.3 A total of 60 patients (26 men, 34 women) aged 11–17 years with maxillary expansion treatment planned were randomly allocated
Table 1. Sex and age distribution in each group
Treatment Sex FrequencyAge (yr)
Mean SD
Group A (BAME) Male 9 14.48 1.60
Female 11 14.20 1.05
Total 20 14.34 1.29
Group B (TAME) Male 8 14.43 1.17
Female 12 13.95 1.30
Total 20 14.23 1.22
Group C (control) Male 9 13.68 1.35
Female 11 13.25 1.12
Total 20 12.97 1.23
BAME, Bone-anchored maxillary expander; TAME, traditio-nal tooth-anchored maxillary expander; SD, standard deviation.

Stepanko and Lagravère • Sphenoid bone changes in maxillary expansion
www.e-kjo.org 271http://dx.doi.org/10.4041/kjod.2016.46.5.269
to three groups during an 18-month recruitment period. Table 1 summarizes the sex and age distribution of the patients in each group. The 20 patients in group A received a traditional tooth-anchored maxillary expander (TAME) (Hyrax with bands on first permanent molars and first premolars). The 20 patients in group B received
a bone-anchored maxillary expander (BAME) composed of two custom milled stainless steel onplants (8 mm in diameter and 3 mm in height), two miniscrews (12 mm in length and 1.5 mm in diameter, Straumann GBR-System; Straumann, Andover, MA, USA), and an expansion screw (Palex II Extra-Mini Expander;
Table 2. Landmarks defined and shown on three-dimensional (3D) and cross-sectional images
Landmark 3D reconstruction Axial view (XY) Saggital view (YZ) Coronal view (XZ)
Foramina ovale
A broad aperture in the greater wing of the sphenoid located lateral posterior to the foramen lacerum, and anterior to the foramen spinosum.
Foramina spinosum
A smaller aperture at the base of the skull anterior to the spine of the sphenoid and posterior lateral to the foramen ovale.
Hypophysial fossa A semi tubular depression located medial between the middle cranial fossae. The landmarks were set on the lateral edges of the saddle-like depression, slightly below the floor of the depression.
Foramina lacerum
Aperture at the base of the skull surrounded by the sphenoid, petrous portion of the temporal bone, and basioccipital. Located lateral and inferior to the hypophysial fossa.

Stepanko and Lagravère • Sphenoid bone changes in maxillary expansion
www.e-kjo.org272 http://dx.doi.org/10.4041/kjod.2016.46.5.269
Table 2. Continued
Landmark 3D reconstruction Axial view (XY) Saggital view (YZ) Coronal view (XZ)
Medial pterygoid plate anterior
A thin plate beginning at the pterygoid process, with the landmark located at the anterior corner of the pterygoid fossa and the medial plate, in the slice showing the longest, most well defined image of the plates.
Medial pterygoid plate posterior
A thin plate beginning at the pterygoid process, with the landmark located at the most posterior section of the medial plate. The slice showing the longest most well defined image of the plates is to be used for the landmark.
Lateral pterygoid plate anterior
A plate forming the medial wall of the infratemporal fossa, with the landmark located at the anterior corner of the pterygoid fossa and the lateral plate, in the slice showing the longest, most well defined image of the plates.
Lateral pterygoid plate posterior
A plate forming the medial wall of the infratemporal fossa, with the landmark located at the most posterior section of the lateral plate. The slice showing the longest, most well defined image of the plates should be used.

Stepanko and Lagravère • Sphenoid bone changes in maxillary expansion
www.e-kjo.org 273http://dx.doi.org/10.4041/kjod.2016.46.5.269
Summit Orthodontic Services, Munroe Falls, OH, USA). This appliance was inserted on each side between the projection of the permanent first molars and second premolar roots deep into the palatal vault and 6 mm from the suture. The 20 patients in group C had treatment delayed for 12 months to serve as a control group. The 12-month delay did not adversely affect the treatment outcome of the patients. CBCT images for all three groups were obtained at baseline (T1), and at 6 months (T2). Patients in groups A and B had the expansion done first, and after the expander was taken off and a 6-month waiting period had elapsed, fixed functional appliances (FFAs) were placed to align the teeth and establish a correct occlusion. Group C
had the expansion and the FFAs inserted at the same time, after a 12-month waiting period. The average treatment time for all patients was 24 months. There were no exclusions due to tooth extractions. The FFAs used were self-ligating brackets (SPEED system; Strite Industries, ON, Canada). All CBCT images were taken using a NewTom 3G (Aperio Services, Verona, Italy) at 110 kV, 6.19 mAs, and 8 mm aluminum filtration. Each image was converted to the Digital Imaging and Communications in Medicine (DICOM) format and then analyzed with AVIZO software (FEI Company, Hillsboro, OR, USA). The DICOM format images were rendered into a volumetric image. From this rendered image, axial and coronal volumetric slices were used to determine
Table 2. Continued
Landmark 3D reconstruction Axial view (XY) Saggital view (YZ) Coronal view (XZ)
Foramina rotundum
A circular aperture in the anterior of the sphenoid allowing for communication between the lateral aspect of the middle cranial fossa and the pterygopalatine fossa. The landmark is seen in a coronal plane, located lateral to the sphenoid sinus.
Pterygoid canal
A circular aperture originating from the base (superior anterior) portion of the medial pterygoid plate, connecting into the pterygopalatine fossa. The landmark is located in the coronal plane lateral to the sphenoid sinus but medial and inferior to the foramen rotundum.
Optic Foramina
An aperture located at the base of the lesser wing of the sphenoid at the posterior superior of the orbit. This landmark is seen in the coronal plane superior and slightly medial to the superior orbital fissure.

Stepanko and Lagravère • Sphenoid bone changes in maxillary expansion
www.e-kjo.org274 http://dx.doi.org/10.4041/kjod.2016.46.5.269
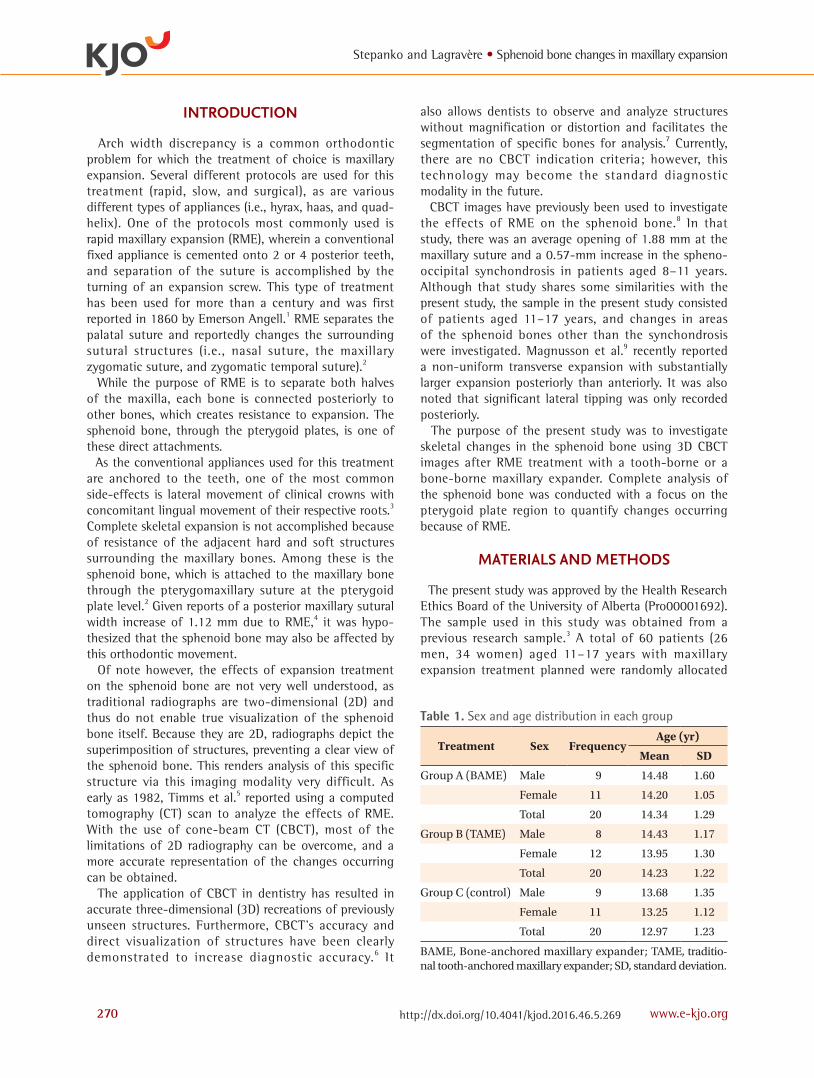
landmark positions. The landmarks used in the present study are defined in Table 2 and shown in Figures 1–3. The principal investigator located the landmarks on each image. The intra-examiner reliability of landmark identification was determined by measuring ten randomly selected images, each repeated three times. Comparisons between different time-points and between patients were made by calculating distances and angles formed by the landmark coordinates. The distance, d, was determined using the following equation:
� � ���X1-X2�2��Y1-Y2�2��Z1-Z2�2
Intra-examiner reliability values were determined using the intraclass correlation coefficient (ICC). Mean differences between two time-points were obtained for each distance measured (T2–T1).
Statistical analysis The sole examiner (LS) was standardized, as pre-viously mentioned, with 10 randomized patients, each completed at 3 separate times. Once the patients were
A B
Figure 1. A frontal slice of the foramina rotundum, pterygoid canals, and optic canals in an ortho slice (A) and a volume-rendered image (B).
A B
Figure 2. A coronal slice demonstrating the foramina ovale and foramina spinosum landmarks in an ortho slice (A) and a volume-rendered image (B) on AVIZO software (FEI Company, Hillsboro, OR, USA).

Stepanko and Lagravère • Sphenoid bone changes in maxillary expansion
www.e-kjo.org 275http://dx.doi.org/10.4041/kjod.2016.46.5.269
evaluated, a 1-week interval was implemented before the second or third round of examination was under-taken. This format was followed to ensure consistency in research. The ICC was calculated to determine the reliability of the 22 landmarks. Only two values calculated were below 0.90, with a reliability of the landmark location of at least 0.783, and the largest ICC mean measurement error was 2.32 mm. Descriptive statistics, ANOVA, a t-test, and univariate analysis were applied to the data collected. IBM SPSS Statistics 23.0
(IBM Co., Armonk, NY, USA) was used for statistical analysis.
RESULTS
The descriptive statistics summarized in Table 3 demonstrate that the largest mean measurement was calculated for distance 2, between the right hypophyseal fossa and the anterior edge of the right lateral pterygoid plate, with a mean value of 0.78 ± 1.78 mm. The largest
Table 3. Descriptive statistics for changes in distances measured between T1 and T2
Distance number Distance (T1−T2) Change (mm)
1 Between foramina ovales 0.25 ± 1.13
2 Vertical height right side, anterior of lateral plate to hypophysial fossa 0.78 ± 1.78
3 Vertical height left side, anterior of lateral plate to hypophysial fossa 0.51 ± 1.74
4 Anterior medial pterygoid plate distance 0.36 ± 0.85
5 Posterior medial pterygoid plate distance 0.16 ± 1.41
6 Anterior lateral pterygoid plate distance 0.56 ± 1.27
7 Posterior lateral pterygoid plate distance 0.73 ± 1.72
8 Left anterior, intra plates distance 0.07 ± 0.85
9 Right anterior, intra plates distance 0.07 ± 0.81
10 Left posterior, intra plates distance 0.13 ± 1.38
11 Right posterior, intra plates distance 0.41 ± 1.46
12 Right optic canal to right pterygoid canal 0.15 ± 1.07
13 Left optic canal to left pterygoid canal −0.02 ± 1.06
Values are presented as mean ± standard deviation.
A B
Figure 3. A coronal slice showing the pterygoid plate landmarks at the anterior and posterior of both the medial and lateral plates. A, Orthoslice of the landmarked structure. B, Three-dimensional view of the landmarked structure.

Stepanko and Lagravère • Sphenoid bone changes in maxillary expansion
www.e-kjo.org276 http://dx.doi.org/10.4041/kjod.2016.46.5.269
intra-plate distance was calculated for distance 11, between the right medial and lateral plates posteriorly, at 0.41 ± 1.46 mm. The largest transverse pterygoid plate distance was found between the posterior of the left and right plates, with a mean change of 0.73 ± 1.72 mm. The mean distance between the posteriors of the left and right medial plates was 0.16 ± 1.41 mm. Intraplate distances anteriorly were almost identical on the left and right, at 0.07 ± 0.85 mm and 0.07 ± 0.81 mm respectively. Table 4 shows the descriptive statistics for each treat-ment group. The largest mean change found was in the left vertical distance between the anterior of the left lateral plate and the left hypophyseal fossa, at 1.11 ± 2.16 mm. In the traditional expander group, this distance was 0.69 ± 1.45 mm, while in the control group it was only 0.54 ± 1.69 mm. The next largest distance was between the posteriors of the lateral pterygoid plates, at 1.01 ± 1.79 mm. In the traditional expander group, this distance was 0.35 ± 1.96 mm, and in the control group, it was 0.83 ± 1.40 mm. Univariate analysis yielded only three areas of statistical significance when correlating gender to distance observed, treatment to distance observed, or gender and treatment to distance observed. As described in Table 5, distance 2 (T2−T1) was statistically significantly correlated with sex and treatment (p = 0.012). Distances 4 and 8 also were also significantly correlated with sex and treatment, with p-values of 0.039 and 0.033, respectively.
DISCUSSION
RME treatment-related structural changes have been measured using 2D radiographs and dental casts for many years, with each modality demonstrating limitations. Two-dimensional radiographs present many visual problems owing to the superimposition of structures and internal or external orientation errors,10 whereas dental casts can only analyze dental changes with reference to other structures found on the cast itself. Few studies exist where the effects of RME on the facial complex have been studied using 3D imaging. Schlicher et al.11 reported 3D CT to be accurate and reproducible for landmark placement for the analysis of bony structures. CBCT provides clinicians with a means to measure distances between anatomical landmarks, eliminating the drawbacks of traditional auxiliary examinations, thus ensuring more reliable and accurate measurements. The use of CBCT allows clinicians to analyze different bony structures, eliminating the undesirable factor of superimposition. This is especially true in the case of the sphenoid bone, where 3D imaging allows for the changes or effects of treatment to be visualized solely on the bone itself. In the present study, the landmarks were tested for reliability with an ICC. This study included a tooth-borne expander group, a bone-borne expander group, and a control group. Both tooth- and bone-borne expanders have been proven to be clinically effective methods,10 yet Lin et al.12
Table 4. Descriptive statistics comparing treatment modalities (bone, traditional, and control)
No Distance (T1−T2) Change (mm)
Group A (BAME)
Group B (TAME)
Group C (control)
1 Between foramen ovales 0.28 ± 1.39 0.24 ± 0.88 0.24 ± 1.12
2 Vertical height right side, anterior of lateral plate to hypophysial fossa 1.11 ± 2.16 0.69 ± 1.45 0.54 ± 1.69
3 Vertical height left side, anterior of lateral plate to hypophysial fossa 0.81 ± 1.72 0.47 ± 1.68 0.25 ± 1.86
4 Anterior medial pterygoid plate distance 0.48 ± 1.09 0.29 ± 0.70 0.31 ± 0.74
5 Posterior medial pterygoid plate distance 0.21 ± 1.14 0.11 ± 1.69 0.15 ± 1.41
6 Anterior lateral pterygoid plate distance 0.25 ± 1.63 0.83 ± 1.18 0.60 ± 0.87
7 Posterior lateral pterygoid plate distance 1.01 ± 1.79 0.35 ± 1.96 0.83 ± 1.40
8 Left anterior, intra plates distance −0.15 ± 0.88 0.29 ± 0.69 0.09 ± 0.93
9 Right anterior, intra plates distance −0.06 ± 0.77 0.19 ± 0.90 0.10 ± 0.79
10 Left posterior, intra plates distance 0.03 ± 1.07 −0.09 ± 1.18 0.47 ± 1.79
11 Right posterior, intra plates distance 0.57 ± 1.61 0.39 ± 1.13 0.28 ± 1.65
12 Right optic canal to right pterygoid canal −0.27 ± 1.34 0.35 ± 0.82 0.38 ± 0.91
13 Left optic canal to left pterygoid canal −0.13 ± 1.25 0.06 ± 0.89 0.01 ± 1.05
Values are presented as mean ± standard deviation.BAME, Bone-anchored maxillary expander; TAME, traditional tooth-anchored maxillary expander.

Stepanko and Lagravère • Sphenoid bone changes in maxillary expansion
www.e-kjo.org 277http://dx.doi.org/10.4041/kjod.2016.46.5.269
demonstrated that patients later in adolescence exhibited larger skeletal movement with less dentoalveolar after-effects from bone-borne expanders. Lagravère et al.3 found that there was no clinical difference in expansion of the dentition between a TAME and a BAME. The primary difference found between the appliances was increased expansion of the upper first premolar in the tooth-anchored group compared to the other groups. Furthermore, Lagravère et al.3 reported tipping in the molars after both bone and tooth-borne expanders, and Nada et al.13 reported an average increase of 9.7% in the nasal airway with hyrax expanders. As measured in cross-section, pharynx enlargement has been reported to be 16.96% and 24.87% at the middle and lower levels, respec-tively.14 This suggested the possibility that forces created by RME could be transferred to other bony structures. As the sphenoid bone is attached directly posterior to the maxilla via the pterygoid plates, examining the effects of RME on the sphenoid seemed logical. Although the true anchoring effect of the pterygoid plates during RME is still under debate, other studies15,16 have concluded that it is a major source of resistance during expansion of the maxilla. Lee et al.17 used finite element analysis to confirm there are higher stresses in the pterygoid region during expansion. Ghoneima et al.2 found negligible expansion of the pterygomaxillary suture as a result of RME, leading to the possibility of force being transferred directly posterior through the suture. An attempt was made to determine whether any of the forces created during RME were being transmitted posteriorly causing expansion of the sphenoid. To analyze this process, the sphenoid was fully captured through the inclusion of landmarks on the greater and lesser wings as well as the pterygoid plates. Focus was placed on the plates due to their close proximity to the maxilla. It should also be noted that landmarks were placed in the coronal and frontal planes to ensure proper analysis. The largest mean change was found in the vertical distance between the anterior of the right lateral pterygoid plate and the right edge of the hypophyseal fossa, at 0.78 mm (Table 2). Comparing this to the vertical distance on the left side between the lateral plate and hypophyseal fossa at 0.51 mm (Table 2), it is reasonable to assume this was an artifact of analysis, and thus is of no clinical importance. This vertical distance is also described in Table 3, where the bone-borne expander was associated with a mean change in height of 1.11 ± 2.16 mm. It is interesting to note that the largest mean change was in a vertical distance, rather than a transverse one. This is an indication of the limited capacity for force to be transferred through the maxilla to the sphenoid during RME. It was thought that if any change occurred it would
Table 5. Statistical significance of treatment modalities and sex correlations
Distance (T1−T2) Correlation Significance
1 Gender 0.824
1 Treatment 0.956
1 Gender–Treatment 0.432
2 Gender 0.548
2 Treatment 0.270
2 Gender–Treatment 0.012
3 Gender 0.808
3 Treatment 0.423
3 Gender–Treatment 0.147
4 Gender 0.093
4 Treatment 0.451
4 Gender–Treatment 0.039
5 Gender 0.855
5 Treatment 0.933
5 Gender–Treatment 0.452
6 Gender 0.126
6 Treatment 0.523
6 Gender–Treatment 0.104
7 Gender 0.899
7 Treatment 0.325
7 Gender–Treatment 0.115
8 Gender 0.751
8 Treatment 0.180
8 Gender–Treatment 0.033
9 Gender 0.769
9 Treatment 0.737
9 Gender–Treatment 0.567
10 Gender 0.674
10 Treatment 0.343
10 Gender–Treatment 0.491
11 Gender 0.582
11 Treatment 0.833
11 Gender–Treatment 0.809
12 Gender 0.335
12 Treatment 0.090
12 Gender–Treatment 0.697
13 Gender 0.268
13 Treatment 0.839
13 Gender–Treatment 0.427

Stepanko and Lagravère • Sphenoid bone changes in maxillary expansion
www.e-kjo.org278 http://dx.doi.org/10.4041/kjod.2016.46.5.269
be located in the anterior of the sphenoid bone, particularly the pterygoid plates. Although this structure occurs bilaterally, there is no central suture to allow for expansion. It has been previously reported that the pterygoid plates are subject to bending anteriorly, further away from the body of the sphenoid.18 The distances from the pterygoid fossa (the space between the medial and lateral pterygoid plates) to landmarks on each plate, medial and lateral at the anterior and posterior borders were analyzed. With the largest average intra-plate change discovered at 0.41 mm (Table 2), it was confirmed that there was no widening of the pterygoid plates due to RME, in either the anterior or posterior pterygoid fossa. When comparing the different treatment modalities, as seen between the foramina ovale (Table 3), the bone-borne, tooth-borne, and control groups all exhibited relatively similar results, with average distance changes of 0.28 ± 1.39 mm, 0.24 ± 0.88 mm, and 0.24 ± 1.12 mm respectively. While no comparison of the efficacy of the treatment modalities was performed, as this was not the purpose of the study, it was observed that neither the bone nor tooth expanders resulted in noticeable changes in the sphenoid. Overall, this study yielded findings different from those of Leonardi et al.8 The age range tested differed between the two studies, with the current study having an older population. Furthermore, the present study analyzed different areas of the sphenoid bone. This study did not quantify the force of the RME treatment on the sphenoid directly, but it did analyze potential changes created if forces were present. It is probable that a slight amount of force is transmitted posteriorly, but because of the sphenoid’s size and interdigitation among intracranial bony structures, the force does not reach the threshold needed to produce noticeable movement. In either of the proposed possibilities of no force or a very slight force reaching the sphenoid, the outcome is still no clinical change. The preceding descriptive statistics are sufficient evidence that no clinical movement occurred due to the maxilla expanding. With a maximum mean value of 0.78 mm, which actually represents a vertical distance rather than a horizontal one, there is no clinical relevance in sphenoid bone changes as a result of RME. The univariate analysis demonstrated correlations between treatment and sex and three distances, which was merely a statistical finding rather than a clinical one. Although the present study used CBCT in patients, this is not common practice in the clinical scenario. Given the risks associated with ionizing radiation, obtaining frequent radiograms is not recommended.
CONCLUSION
The analysis provided evidence that there were no clinically significant changes in the sphenoid bone due to the RME treatments investigated, regardless of sex or treatment type.
REFERENCES
1. Angell EH. Treatment of irregularity of the perma-nent or adult teeth. Dent Cosmos 1860;1:199-600.
2. Ghoneima A, Abdel-Fattah E, Hartsfield J, El-Bedwehi A, Kamel A, Kula K. Effects of rapid maxillary expansion on the cranial and circum-maxillary sutures. Am J Orthod Dentofacial Orthop 2011;140:510-9.
3. Lagravère MO, Gamble J, Major PW, Heo G. Trans-verse dental changes after tooth-borne and bone-borne maxillary expansion. Int Orthod 2013;11:21-34.
4. Lione R, Ballanti F, Franchi L, Baccetti T, Cozza P. Treatment and posttreatment skeletal effects of rapid maxillary expansion studied with low-dose computed tomography in growing subjects. Am J Orthod Dentofacial Orthop 2008;134:389-92.
5. Timms DJ, Preston CB, Daly PF. A computed tomographic assessment of maxillary movement induced by rapid expansion - a pilot study. Eur J Orthod 1982;4:123-7.
6. Merrett SJ, Drage NA, Durning P. Cone beam computed tomography: a useful tool in orthodontic diagnosis and treatment planning. J Orthod 2009; 36:202-10.
7. Gribel BF, Gribel MN, Frazäo DC, McNamara JA Jr, Manzi FR. Accuracy and reliability of craniometric measurements on lateral cephalometry and 3D measurements on CBCT scans. Angle Orthod 2011; 81:26-35.
8. Leonardi R, Cutrera A, Barbato E. Rapid maxillary expansion affects the spheno-occipital synchondrosis in youngsters. A study with low-dose computed tomography. Angle Orthod 2010;80:106-10.
9. Magnusson A, Bjerklin K, Kim H, Nilsson P, Marcus-son A. Three-dimensional assessment of transverse skeletal changes after surgically assisted rapid maxillary expansion and orthodontic treatment: a prospective computerized tomography study. Am J Orthod Dentofacial Orthop 2012;142:825-33.
10. Gunyuz Toklu M, Germec-Cakan D, Tozlu M. Periodontal, dentoalveolar, and skeletal effects of tooth-borne and tooth-bone-borne expansion appliances. Am J Orthod Dentofacial Orthop 2015;148:97-109.
11. Schlicher W, Nielsen I, Huang JC, Maki K, Hatcher

Stepanko and Lagravère • Sphenoid bone changes in maxillary expansion
www.e-kjo.org 279http://dx.doi.org/10.4041/kjod.2016.46.5.269
DC, Miller AJ. Consistency and precision of landmark identification in three-dimensional cone beam computed tomography scans. Eur J Orthod 2012;34:263-75.
12. Lin L, Ahn HW, Kim SJ, Moon SC, Kim SH, Nelson G. Tooth-borne vs bone-borne rapid maxillary expanders in late adolescence. Angle Orthod 2015; 85:253-62.
13. Nada RM, van Loon B, Schols JG, Maal TJ, de Koning MJ, Mostafa YA, et al. Volumetric changes of the nose and nasal airway 2 years after tooth-borne and bone-borne surgically assisted rapid maxillary expansion. Eur J Oral Sci 2013;121:450-6.
14. Vinha PP, Faria AC, Xavier SP, Christino M, de Mello-Filho FV. Enlargement of the Pharynx resulting from surgically assisted rapid maxillary expansion. J Oral Maxillofac Surg 2016;74:369-79.
15. Lima SM Jr, de Moraes M, Asprino L. Photoelastic
analysis of stress distribution of surgically assisted rapid maxillary expansion with and without separation of the pterygomaxillary suture. J Oral Maxillofac Surg 2011;69:1771-5.
16. Seeberger R, Kater W, Davids R, Thiele OC. Long term effects of surgically assisted rapid maxillary expansion without performing osteotomy of the pterygoid plates. J Craniomaxillofac Surg. 2010;38:175-8.
17. Lee SC, Park JH, Bayome M, Kim KB, Araujo EA, Kook YA. Effect of bone-borne rapid maxillary expanders with and without surgical assistance on the craniofacial structures using finite element analys is. Am J Orthod Dentofac ia l Orthop 2014;145:638-48.
18. Bishara SE, Staley RN. Maxillary expansion: clinical implications. Am J Orthod Dentofacial Orthop 1987;91:3-14.