Embed Size (px)
Citation preview
Sperm Function Tests
Beyond the Semen Analysis
Edmund Sabanegh, Jr., M.D.
Chairman, Department of Urology
Glickman Urological and Kidney Institute
Cleveland Clinic
•
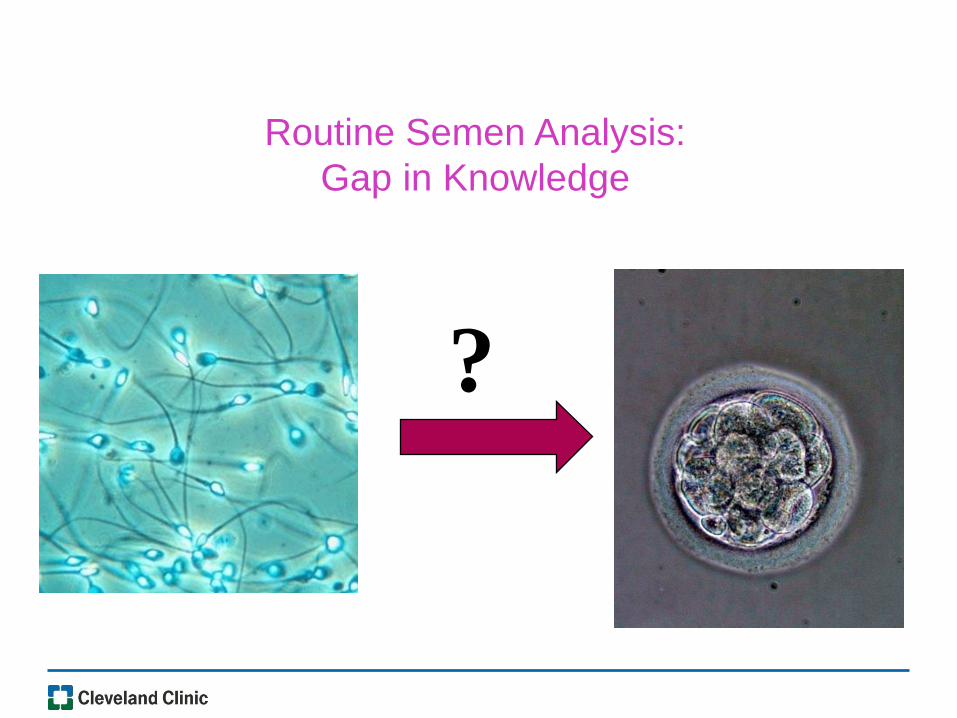
?
Routine Semen Analysis:
Gap in Knowledge
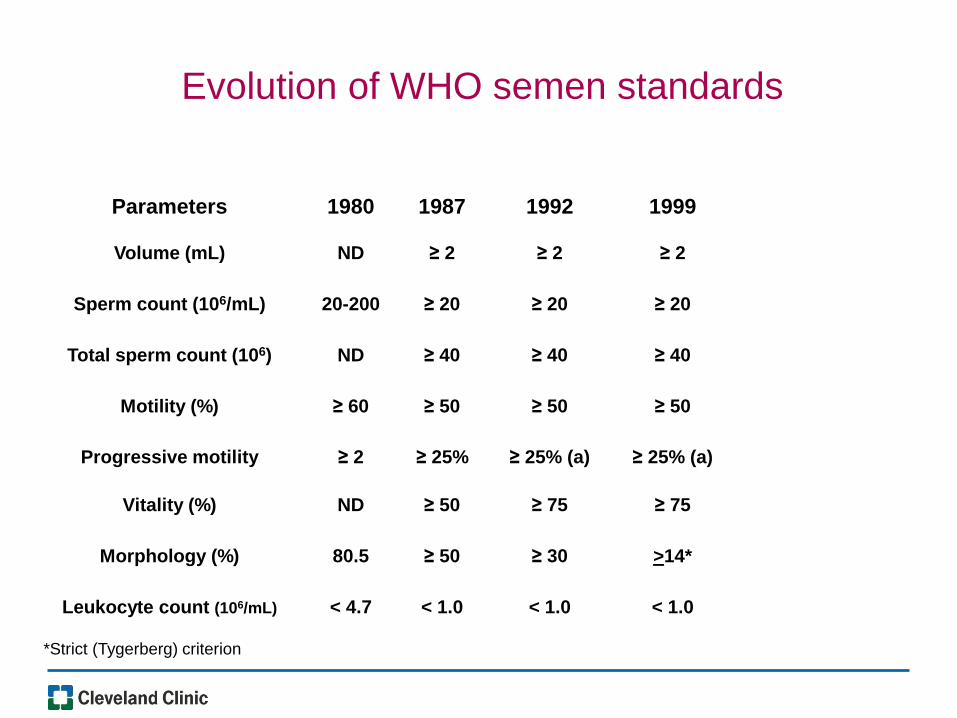
Parameters
1980
1987
1992
1999
Volume (mL) ND ≥ 2 ≥ 2 ≥ 2
Sperm count (106/mL) 20-200 ≥ 20 ≥ 20 ≥ 20
Total sperm count (106) ND ≥ 40 ≥ 40 ≥ 40
Motility (%) ≥ 60 ≥ 50 ≥ 50 ≥ 50
Progressive motility ≥ 2 ≥ 25% ≥ 25% (a) ≥ 25% (a)
Vitality (%) ND ≥ 50 ≥ 75 ≥ 75
Morphology (%) 80.5 ≥ 50 ≥ 30 >14*
Leukocyte count (106/mL) < 4.7 < 1.0 < 1.0 < 1.0
*Strict (Tygerberg) criterion
Evolution of WHO semen standards
Parameters
1980
1987
1992
1999
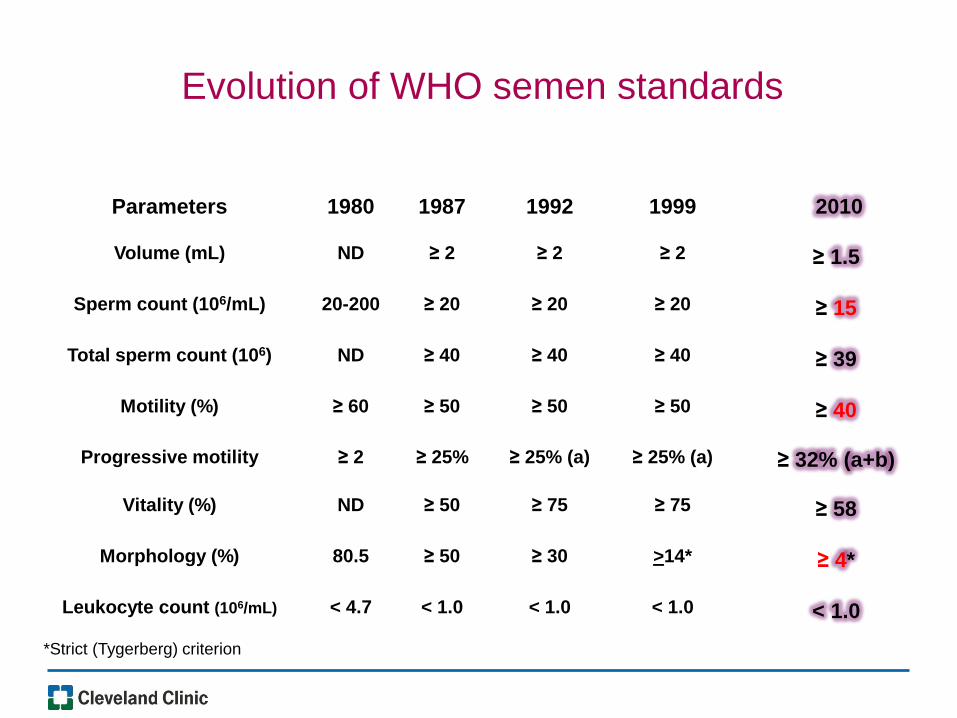
2010
Volume (mL) ND ≥ 2 ≥ 2 ≥ 2 ≥ 1.5
Sperm count (106/mL) 20-200 ≥ 20 ≥ 20 ≥ 20 ≥ 15
Total sperm count (106) ND ≥ 40 ≥ 40 ≥ 40 ≥ 39
Motility (%) ≥ 60 ≥ 50 ≥ 50 ≥ 50 ≥ 40
Progressive motility ≥ 2 ≥ 25% ≥ 25% (a) ≥ 25% (a) ≥ 32% (a+b)
Vitality (%) ND ≥ 50 ≥ 75 ≥ 75 ≥ 58
Morphology (%) 80.5 ≥ 50 ≥ 30 >14* ≥ 4*
Leukocyte count (106/mL) < 4.7 < 1.0 < 1.0 < 1.0 < 1.0
*Strict (Tygerberg) criterion
Evolution of WHO semen standards
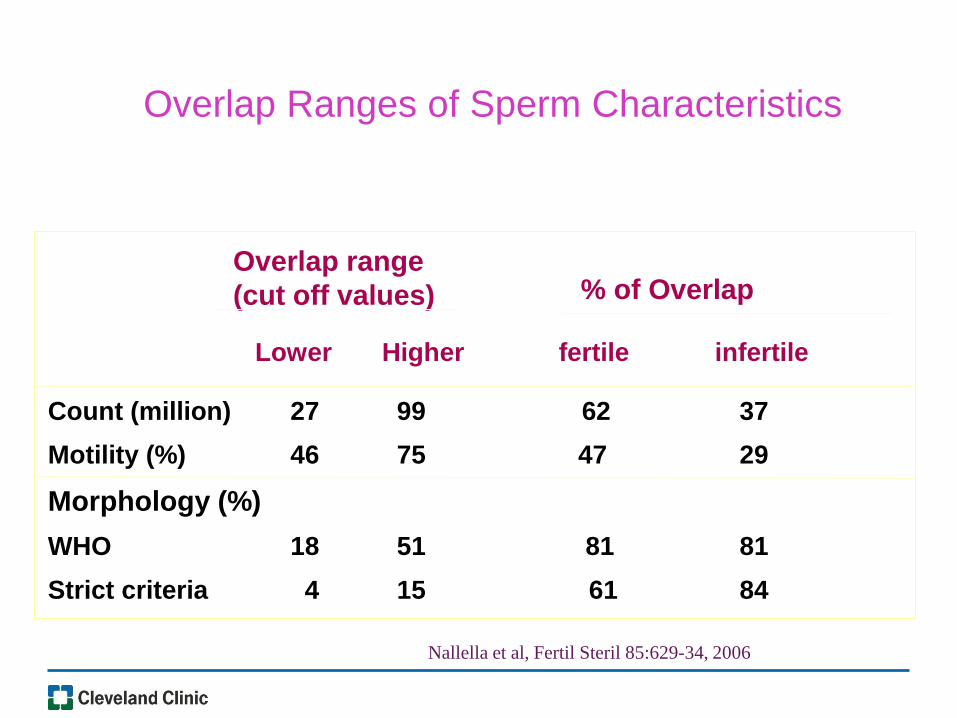
Lower Higher fertile infertile
Overlap range
(cut off values) % of Overlap
Count (million) 27 99 62 37
Motility (%) 46 75 47 29
Morphology (%)
WHO 18 51 81 81
Strict criteria 4 15 61 84
Overlap Ranges of Sperm Characteristics
Nallella et al, Fertil Steril 85:629-34, 2006
Lower Higher fertile infertile
Overlap range
(cut off values) % of Overlap
Count (million) 27 99 62 37
Motility (%) 46 75 47 29
Morphology (%)
WHO 18 51 81 81
Strict criteria 4 15 61 84
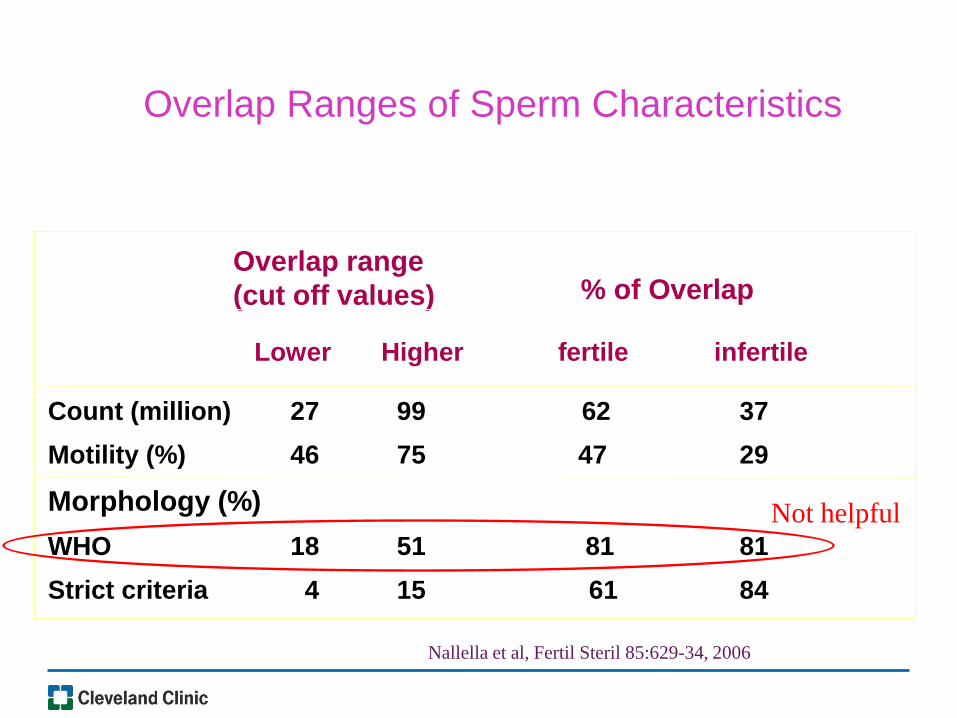
Overlap Ranges of Sperm Characteristics
Nallella et al, Fertil Steril 85:629-34, 2006
Not helpful

Lower Higher fertile infertile
Overlap range
(cut off values) % of Overlap
Count (million) 27 99 62 37
Motility (%) 46 75 47 29
Morphology (%)
WHO 18 51 81 81
Strict criteria 4 15 61 84
Overlap Ranges of Sperm Characteristics
Nallella et al, Fertil Steril 85:629-34, 2006
More helpful

Lower Higher fertile infertile
Overlap range
(cut off values) % of Overlap
Count (million) 27 99 62 37
Motility (%) 46 75 47 29
Morphology (%)
WHO 18 51 81 81
Strict criteria 4 15 61 84
Overlap Ranges of Sperm Characteristics
Nallella et al, Fertil Steril 85:629-34, 2006
Most helpful

WHO 4th Edition, 1999
Variability in Sperm Concentration
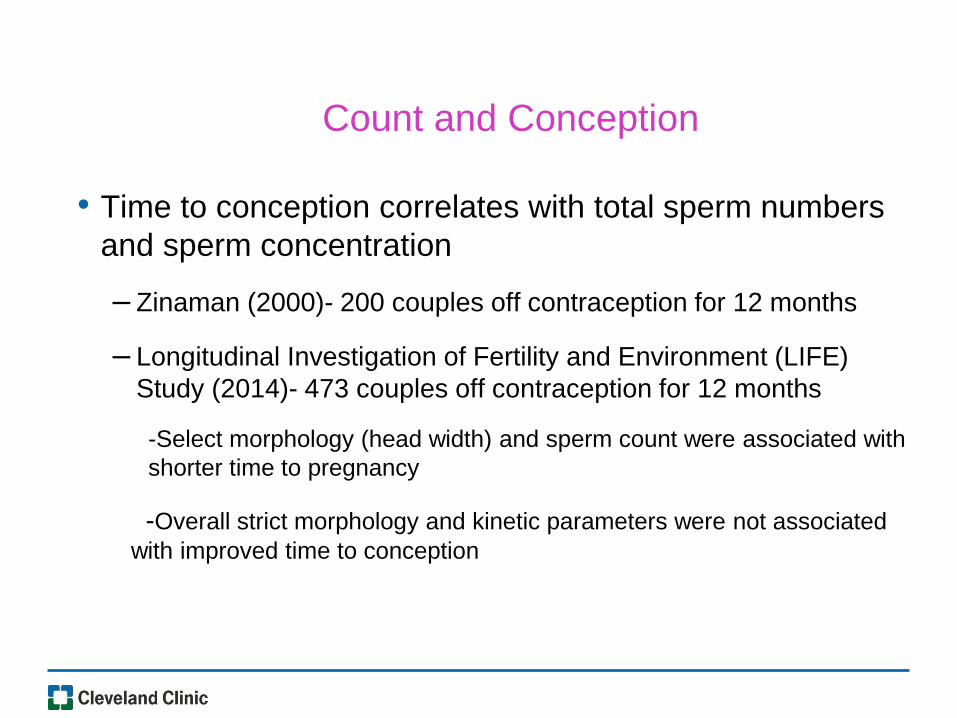
• Time to conception correlates with total sperm numbers
and sperm concentration
– Zinaman (2000)- 200 couples off contraception for 12 months
– Longitudinal Investigation of Fertility and Environment (LIFE)
Study (2014)- 473 couples off contraception for 12 months
-Select morphology (head width) and sperm count were associated with
shorter time to pregnancy
-Overall strict morphology and kinetic parameters were not associated
with improved time to conception
Count and Conception

• Lacks information on sub cellular / molecular
changes in spermatozoa
• Need for tests to evaluate/stratify interventions
Routine Semen Analysis:
Gap in Knowledge

• Poor prediction of fertility since 50% of infertile men have
normal semen parameters
• High inter and intra observer variability
• Morphology in particular is poorly correlated with
outcomes
The dilemma
Men with abnormal semen analyses can be
fertile and infertile men can have normal
parameters
Limitations of Current Semen Testing
1. Specific diagnosis of sperm dysfunction
2. Prediction of fertilization/pregnancy rate
3. Suggest targeted therapy to reverse infertility
Ideal Sperm Function Test

– Sperm chromatin tightly packed due to cross linkages
– Sperm DNA fragmentation (DFI)- first described in 1993
– Correlates with poor semen parameters, leukocytospermia, elevated
oxidative stress
– Associated with unexplained infertility, recurrent miscarriage
– Sperm DNA integrity and morphology- poor correlation (Avendano, 2010)
– DNA sperm integrity correlates with reproductive success
– Elevated DFI- lower spontaneous pregnancy and assisted reproduction
success rates
Sperm DNA
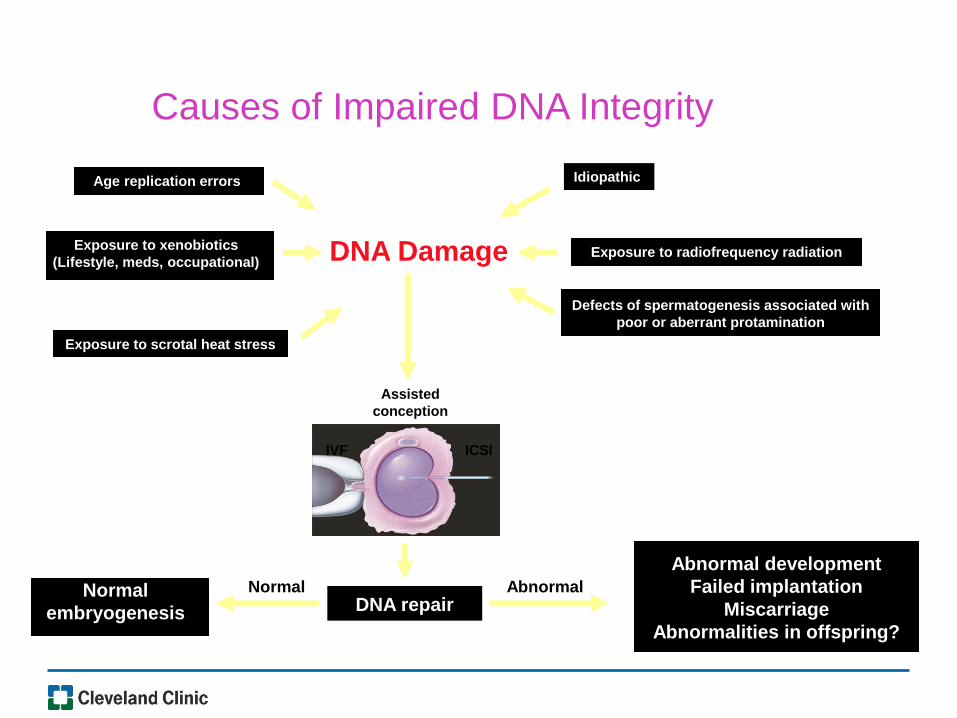
DNA Damage
DNA repair Normal Normal
embryogenesis
Abnormal
Abnormal development
Failed implantation
Miscarriage
Abnormalities in offspring?
Exposure to scrotal heat stress
Age replication errors
Exposure to radiofrequency radiation Exposure to xenobiotics
(Lifestyle, meds, occupational)
Defects of spermatogenesis associated with
poor or aberrant protamination
IVF ICSI
Assisted
conception
Idiopathic
Causes of Impaired DNA Integrity
Sperm karyotyping
Sperm FISH analysis
Sperm DNA fragmentation tests
Sperm DNA Assessment
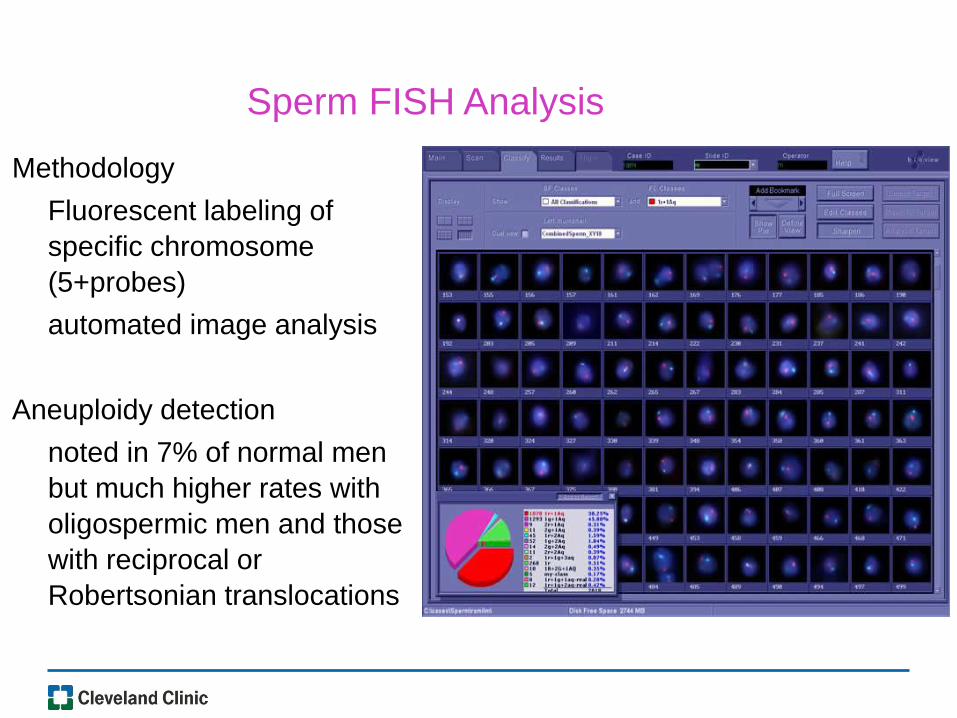
Methodology
Fluorescent labeling of
specific chromosome
(5+probes)
automated image analysis
Aneuploidy detection
noted in 7% of normal men
but much higher rates with
oligospermic men and those
with reciprocal or
Robertsonian translocations
Sperm FISH Analysis
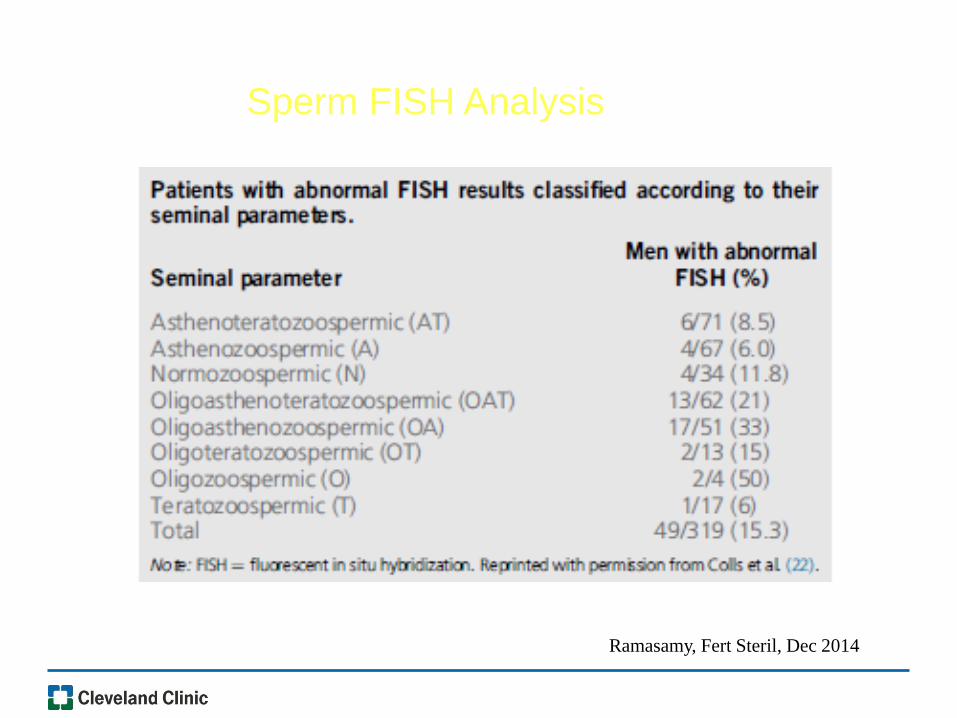
Sperm FISH Analysis
Ramasamy, Fert Steril, Dec 2014
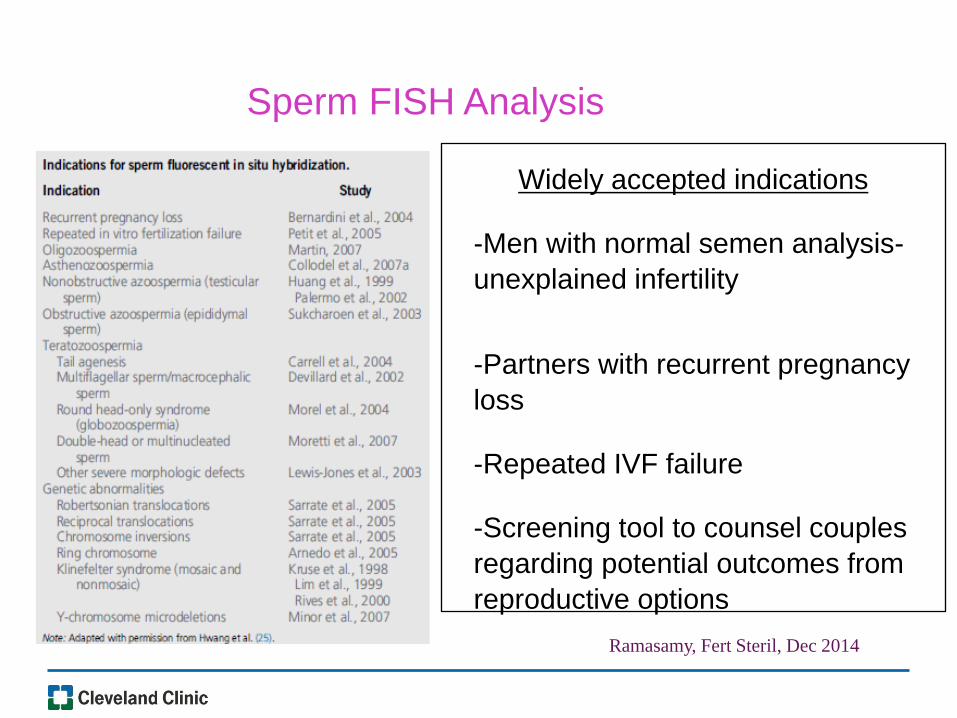
Sperm FISH Analysis
Ramasamy, Fert Steril, Dec 2014
Widely accepted indications
-Men with normal semen analysis-
unexplained infertility
-Partners with recurrent pregnancy
loss
-Repeated IVF failure
-Screening tool to counsel couples
regarding potential outcomes from
reproductive options
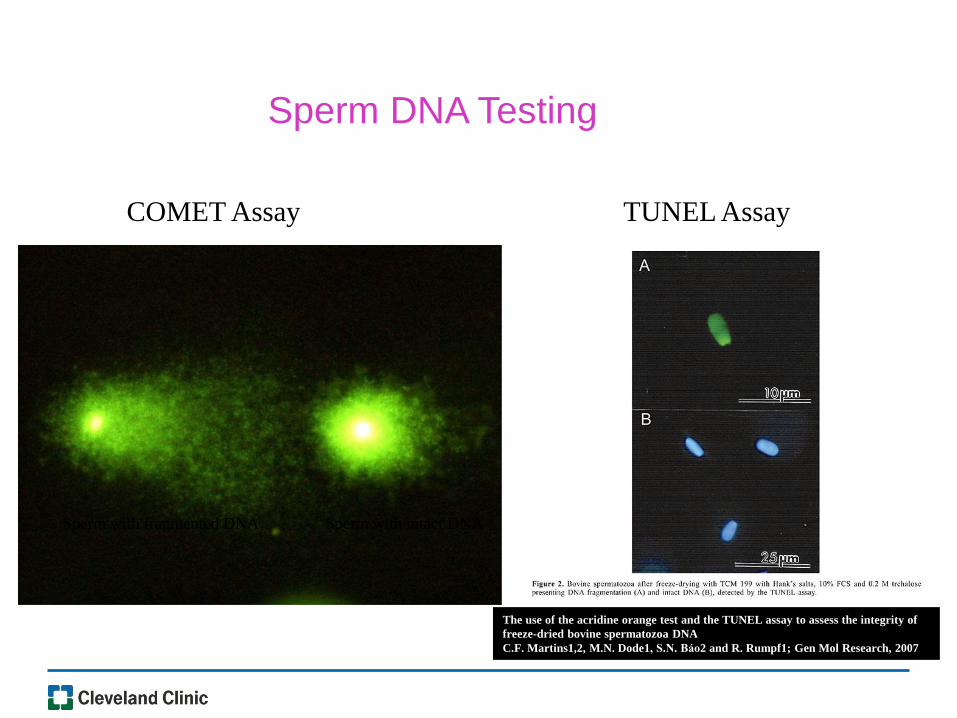
The use of the acridine orange test and the TUNEL assay to assess the integrity of
freeze-dried bovine spermatozoa DNA
C.F. Martins1,2, M.N. Dode1, S.N. Báo2 and R. Rumpf1; Gen Mol Research, 2007
Sperm with fragmented DNA Sperm with intact DNA
COMET Assay TUNEL Assay
Sperm DNA Testing
Natural Conception
7 times more likely to achieve pregnancy if DFI <30% (n = 362, P = 0.0001)
Evenson, 2006; Greco, 2005
Sperm DNA Fragmentation and Pregnancy

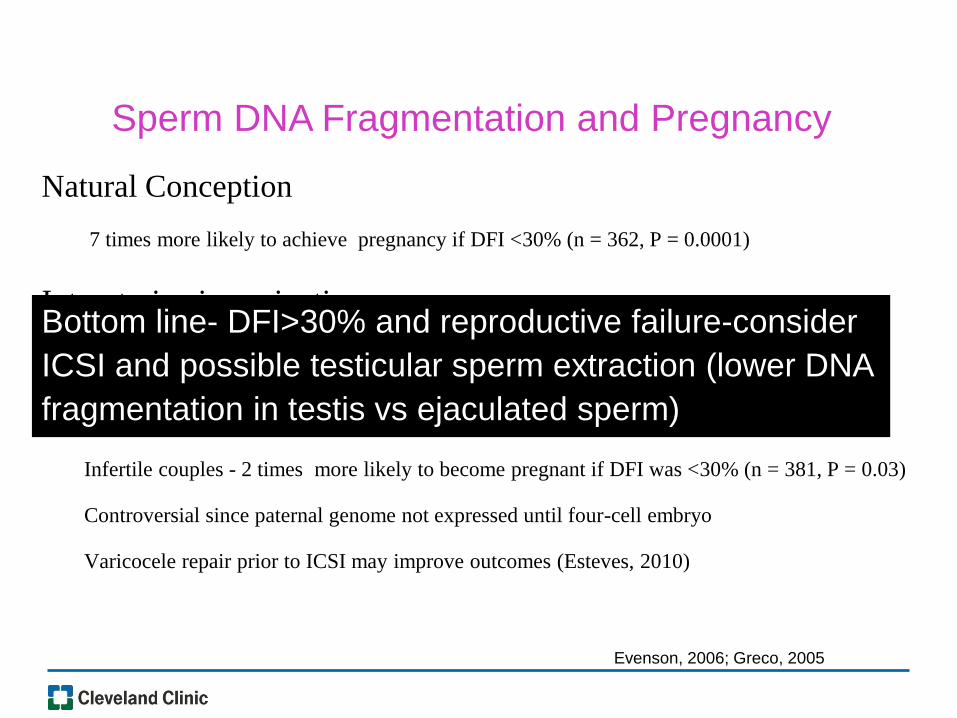
Natural Conception
7 times more likely to achieve pregnancy if DFI <30% (n = 362, P = 0.0001)
Intrauterine insemination
7.3 times more likely to achieve pregnancy if DFI was <30% (n = 518, P = 0.0001)
Evenson, 2006; Greco, 2005
Sperm DNA Fragmentation and Pregnancy
Natural Conception
7 times more likely to achieve pregnancy if DFI <30% (n = 362, P = 0.0001)
Intrauterine insemination
7.3 times more likely to achieve pregnancy if DFI was <30% (n = 518, P = 0.0001)
IVF/ICSI
Infertile couples - 2 times more likely to become pregnant if DFI was <30% (n = 381, P = 0.03)
Controversial since paternal genome not expressed until four-cell embryo
Varicocele repair prior to ICSI may improve outcomes (Esteves, 2010)
Evenson, 2006; Greco, 2005
Sperm DNA Fragmentation and Pregnancy
Bottom line- DFI>30% and reproductive failure-consider
ICSI and possible testicular sperm extraction (lower DNA
fragmentation in testis vs ejaculated sperm)
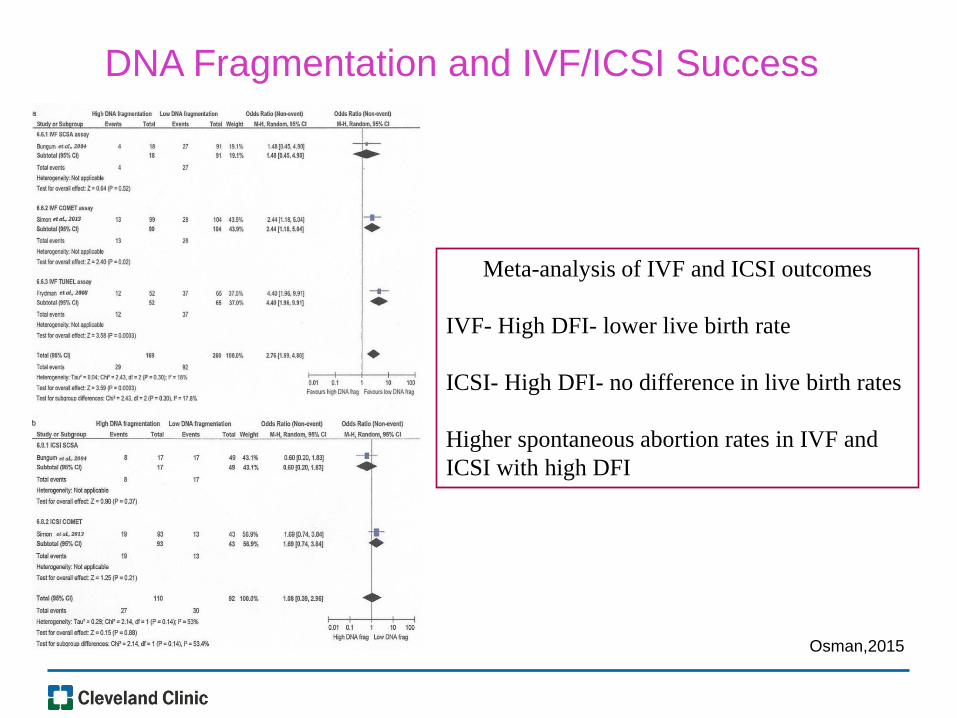
Osman,2015
DNA Fragmentation and IVF/ICSI Success
Meta-analysis of IVF and ICSI outcomes
IVF- High DFI- lower live birth rate
ICSI- High DFI- no difference in live birth rates
Higher spontaneous abortion rates in IVF and
ICSI with high DFI

– High DFI associated with oligospermia
and advanced paternal age
– No effect on intrauterine growth,
postnatal physicial development or
mental status of offspring of high DFI
sperm
– “Elevated sperm dna fragmentation
occurs regularly and the machinery of a
healthy oocyte might come to the
rescue”
Outcome of Pregnancies with
Elevated Sperm DNA Fragmentation
Palermo, Fert Steril, 2014
Unexplained infertility
Recurrent pregnancy loss
Prediction of ART outcome
Assessment of genetic integrity
– Post-chemotherapy
– Advanced paternal age
Indications for Sperm DNA Testing

Lack of standardization of assays
Significant intra-individual variation
Technology does not allow individual sperm assessment for ICSI and
sperm separation methods are not consistently effective in
separating “good DNA” sperm population from compromised
Predictive value for ART may improve if study DFI of motile portion
of ejaculate (Palermo, 2014)
ASRM (2013) and AUA Best Practice (2011)
guidelines- not enough data to recommend
routine sperm DNA testing
Sperm DNA Challenges
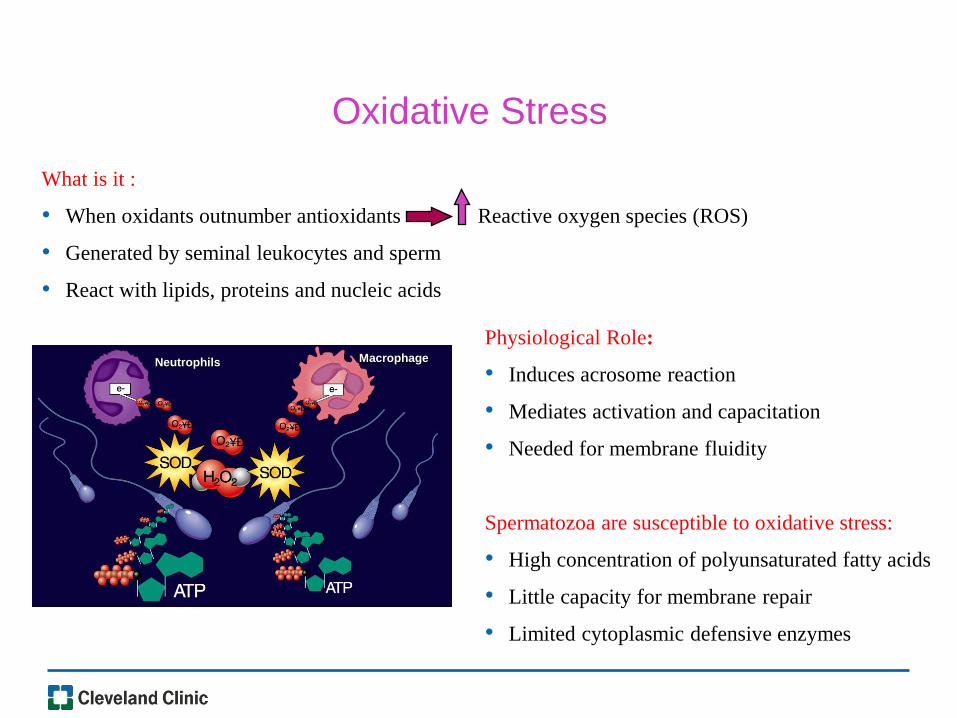
What is it :
• When oxidants outnumber antioxidants Reactive oxygen species (ROS)
• Generated by seminal leukocytes and sperm
• React with lipids, proteins and nucleic acids
Physiological Role:
• Induces acrosome reaction
• Mediates activation and capacitation
• Needed for membrane fluidity
Spermatozoa are susceptible to oxidative stress:
• High concentration of polyunsaturated fatty acids
• Little capacity for membrane repair
• Limited cytoplasmic defensive enzymes
Macrophage Neutrophils
Oxidative Stress
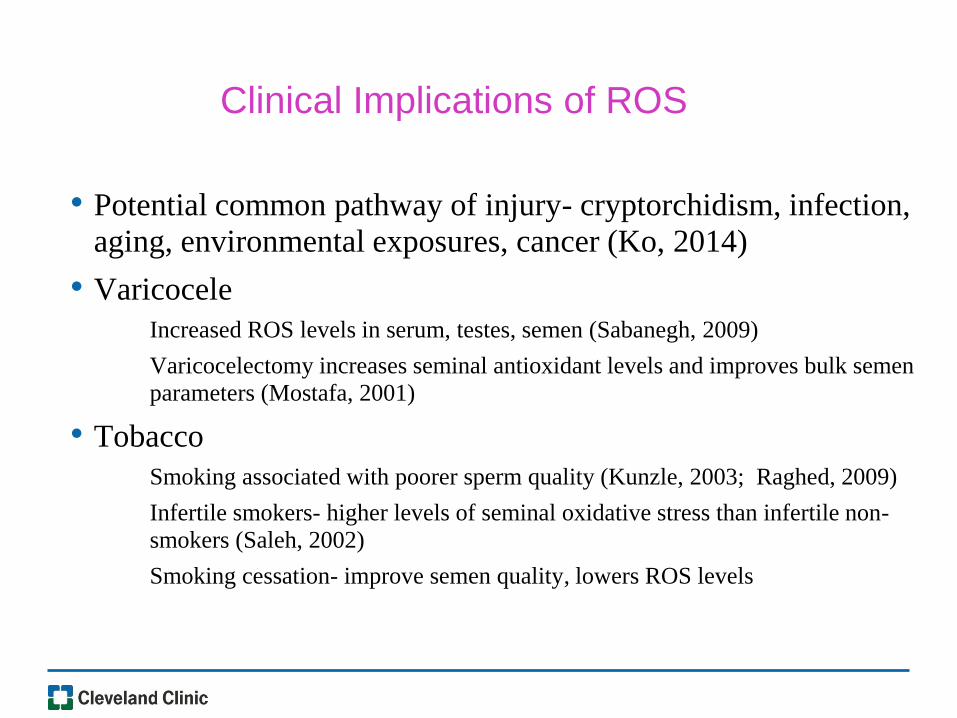
• Potential common pathway of injury- cryptorchidism, infection,
aging, environmental exposures, cancer (Ko, 2014)
• Varicocele
Increased ROS levels in serum, testes, semen (Sabanegh, 2009)
Varicocelectomy increases seminal antioxidant levels and improves bulk semen
parameters (Mostafa, 2001)
• Tobacco
Smoking associated with poorer sperm quality (Kunzle, 2003; Raghed, 2009)
Infertile smokers- higher levels of seminal oxidative stress than infertile non-
smokers (Saleh, 2002)
Smoking cessation- improve semen quality, lowers ROS levels
Clinical Implications of ROS
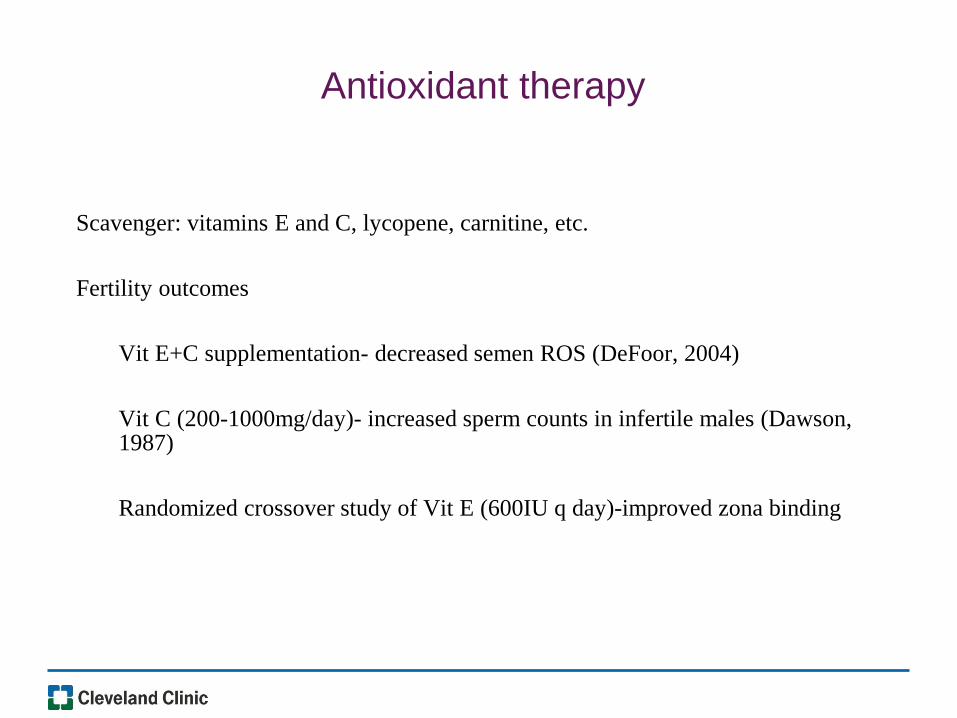
Antioxidant therapy
Scavenger: vitamins E and C, lycopene, carnitine, etc.
Fertility outcomes
Vit E+C supplementation- decreased semen ROS (DeFoor, 2004)
Vit C (200-1000mg/day)- increased sperm counts in infertile males (Dawson, 1987)
Randomized crossover study of Vit E (600IU q day)-improved zona binding

– Microarray
–Analyzes transcriptome of cells- comparison at different stages of
spermatogenesis
– Proteomics
–Seminal fluid has >1000 different proteins and at least 20 have had altered
expression in infertile men (Pilch,2006; Pixton, 2004)
– Genetics and Epigenetics
–Spermatozoal epigenetic disorders (Boissonnas, 2013; Gannon, 2014;
Klaver, 2014)
–RNA defects (De Mateo, 2014; Jodar, 2013)
Emerging Technologies

Proteomics and Male Infertility
2 DE = 2 dimensional gel electrophoresis; MALDI-TOF = matrix assisted laser; LC-MS liquid chromatography mass spectrometry; ROS = reactive
oxygen species; 2-DIGE = 2 dimensional in gel electrophoresis
Study Subjects Sample size Source Technique Main finding Reference
Varicocele Varicocele
Control
(n = 20)
(n=20)
Spermatozoa 2 DE; MALDI-TOF
MS
15 proteins; 4 reduced in varicocele group; 11 overexpressed ;
HSP60 and HSP 90 upregulated in varicocele group
Chan et al. 2013
Varicocele Pre-varicocelectomy
Post-varicocelectomy
(n = 18) Seminal plasma LC/MS 316 proteins; 53 in pre- and 38 in post varicocelectomy;
68 in both groups
Camargo et al. 2012
Oxidative
stress
Controls
Infertile men
ROS + and ROS -
( n = 20)
( n = 32)
spermatozoa 2-DIGE; LC-MS 1,343 spots in ROS – and 1,265 spots in ROS+ samples. 31
spots differentially expressed; 6 spots increased and 25
decreased in ROS- samples.
Hamada et al. 2013.
Oxidative
stress
Controls
Infertile men
ROS + and ROS -
( n = 20)
( n = 32)
Seminal fluid LC-MS 14 proteins; 7 common and 7 unique in both ROS+ and ROS –
grp.
Sharma et al. 2013
Idiopathic
astheno-
zoospermia
Donors
Patients
(n = 30)
(n= 30)
2DE; Tandem mass
spectrometry;
MALDI-TOF
33 DEP; 15 unique proteins Shen et al. 2013
Sperm
motility
proteins
Fertile men
Asthenozoospermic men
(n = 8)
(n = 8)
spermatozoa 2 DE; MALDI-TOF 14 spots; 10 proteins;
Energy metabolism proteins
Zhao et al. 2007
NOA Control
NOA
Post vasectomy
(n =5)
(n =5)
(n = 5)
Seminal plasma Spectral counts 2048 proteins in NOA; Batruch et al. 2011
Astheno-
zoospermia
Controls
Asthenozoospermic men
(n = 10)
( n= 20)
Spermatozoa 2 DE; 17 protein spots; 8 decreased; 9 increased in
asthenozoospermic men
Martınez-Heredia et
al. 2008
Astheno-
zoospermia
Controls
Asthenozoospermic men
(n = 20)
(n = 38)
Seminal plasma SDS PAGE; LC-
MS/MS
741 proteins; 45 upregulated; 56 downregulatedDJ-11
downregulated in asthenozoospermic gp.
Wang et al. 2009

Complexity of Proteomics
Sharma, 2015