Embed Size (px)
Citation preview
1 | P a g e
Spending Review 2018
Public Service Occupational Pensions in Ireland - Cash Flow Analysis
JOHN PENDER FSAI AND ÁINE CHAMBERS
PUBLIC SERVICE PAY AND PENSION POLICY DIVISION
JULY 2018
This paper has been prepared by staff in the Department of Public Expenditure & Reform. The views presented in this paper do not represent the official views of the Department or the Minister for Public Expenditure and Reform.

2 | P a g e
DISCLAIMER
This actuarial review has been prepared for the purpose of the 2018 Spending Review process. It may not be
suitable for use in any other context, for any other purpose or by any other party; we accept no responsibility for
any such use. Any reliance placed on this material for another purpose, or by other parties is entirely at their own
risk. This material should not be shared with any third party unless agreed in writing.
The material in this paper is based on membership data provided to the Department of Public Expenditure and
Reform (the “Department”) as at 31st December 2015. In preparing this material, the Department has relied upon
data supplied by third parties. Whilst reasonable care has been taken to gauge the reliability of this data, the
Department provides no guarantee as to the accuracy or completeness of this data, and the Department accepts
no responsibility and will not be liable for any errors or misrepresentations in the data made by any third party.
The actuarial work involved in the preparation of this material complies with the guidelines set out by the Society of
Actuaries in Ireland in Actuarial Standards of Practice PA-2, General Actuarial Practice (“ASP PA-2”). For the purposes of
ASP PA-2, the “user” of this material is the Department.

3 | P a g e
Table of Contents
1. Executive Summary ........................................................................................................................... 4
2. Introduction ......................................................................................................................................... 6
3. Data .................................................................................................................................................... 8
4. Assumptions ....................................................................................................................................... 9
5. Methodology ..................................................................................................................................... 11
6. Results ............................................................................................................................................. 14
7. Future Considerations ...................................................................................................................... 21
8. Appendix A - Main Benefit Provisions .............................................................................................. 22
9. Appendix B - Recent Developments in Public Service Pensions ................................................ 26
10. Appendix C - Data Analysis ............................................................................................................ 30
11. Appendix D - Assumptions ............................................................................................................... 35
4 | P a g e
1. Executive Summary
1.1. The present study provides cash flow projections of income and expenditure from Pay-As-You-Go public
service occupational benefit schemes over the long-term. Projections were prepared on an individual
member by member basis using data collated for a recently published actuarial review of public service
occupational pensions in Ireland as required by EU Regulation 549 / 2013. These cash flow projections
relate to the benefits payable and contributions receivable in future years, in relation to both past and future
service. The projected cash flows are presented in real money terms.
1.2. It should be noted that the cash flow projections are based on a wide range of assumptions about the future
which are unlikely to be borne out in reality. Readers are encouraged to focus on the trends in the figures
rather than the actual real value of the cash flows.
1.3. The results presented are projections, not forecasts, which should be reviewed in light of updated
information available. This cash flow analysis has been peer reviewed by KPMG, Dublin.
Main Findings
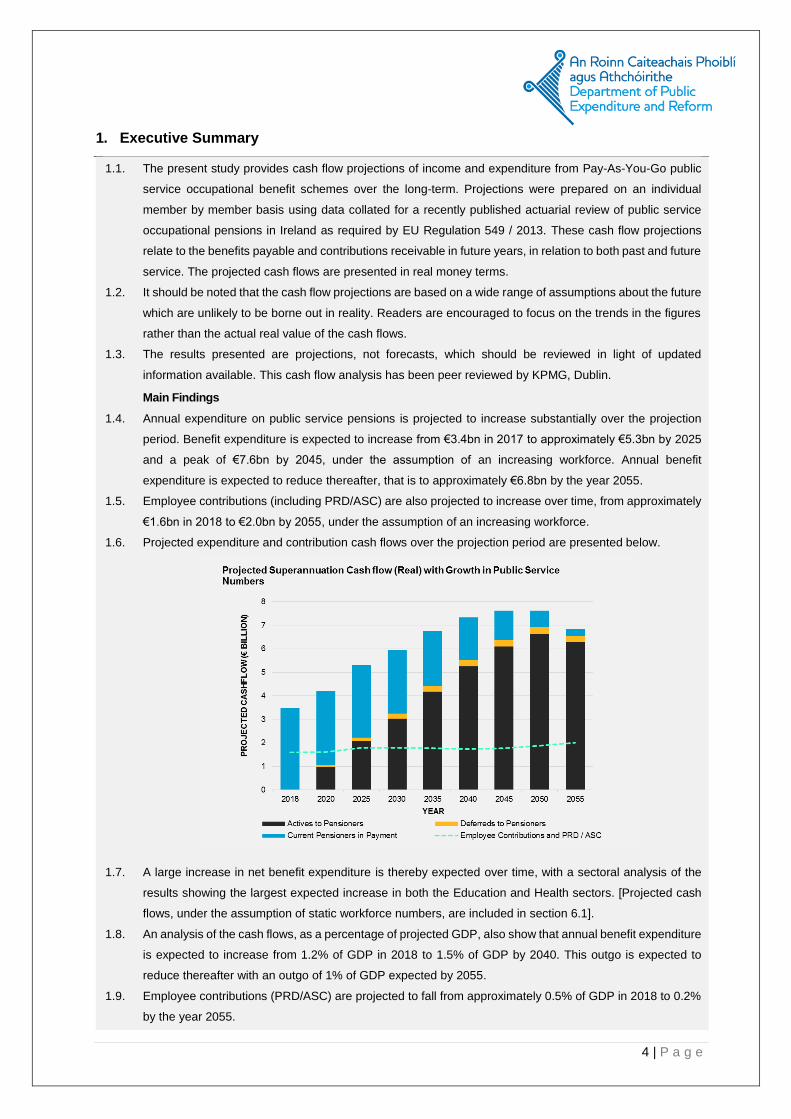
1.4. Annual expenditure on public service pensions is projected to increase substantially over the projection
period. Benefit expenditure is expected to increase from €3.4bn in 2017 to approximately €5.3bn by 2025
and a peak of €7.6bn by 2045, under the assumption of an increasing workforce. Annual benefit
expenditure is expected to reduce thereafter, that is to approximately €6.8bn by the year 2055.
1.5. Employee contributions (including PRD/ASC) are also projected to increase over time, from approximately
€1.6bn in 2018 to €2.0bn by 2055, under the assumption of an increasing workforce.
1.6. Projected expenditure and contribution cash flows over the projection period are presented below.
1.7. A large increase in net benefit expenditure is thereby expected over time, with a sectoral analysis of the
results showing the largest expected increase in both the Education and Health sectors. [Projected cash
flows, under the assumption of static workforce numbers, are included in section 6.1].
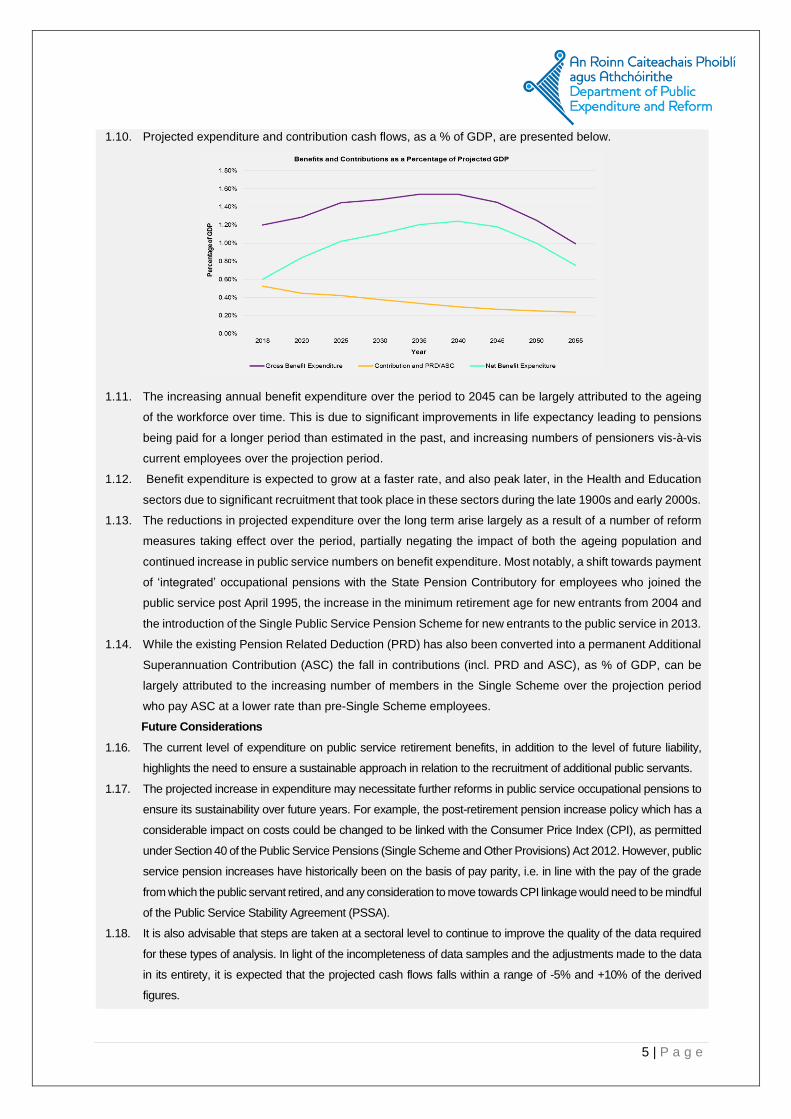
1.8. An analysis of the cash flows, as a percentage of projected GDP, also show that annual benefit expenditure
is expected to increase from 1.2% of GDP in 2018 to 1.5% of GDP by 2040. This outgo is expected to
reduce thereafter with an outgo of 1% of GDP expected by 2055.
1.9. Employee contributions (PRD/ASC) are projected to fall from approximately 0.5% of GDP in 2018 to 0.2%
by the year 2055.
5 | P a g e
1.10. Projected expenditure and contribution cash flows, as a % of GDP, are presented below.
1.11. The increasing annual benefit expenditure over the period to 2045 can be largely attributed to the ageing
of the workforce over time. This is due to significant improvements in life expectancy leading to pensions
being paid for a longer period than estimated in the past, and increasing numbers of pensioners vis-à-vis
current employees over the projection period.
1.12. Benefit expenditure is expected to grow at a faster rate, and also peak later, in the Health and Education
sectors due to significant recruitment that took place in these sectors during the late 1900s and early 2000s.
1.13. The reductions in projected expenditure over the long term arise largely as a result of a number of reform
measures taking effect over the period, partially negating the impact of both the ageing population and
continued increase in public service numbers on benefit expenditure. Most notably, a shift towards payment
of ‘integrated’ occupational pensions with the State Pension Contributory for employees who joined the
public service post April 1995, the increase in the minimum retirement age for new entrants from 2004 and
the introduction of the Single Public Service Pension Scheme for new entrants to the public service in 2013.
1.14. While the existing Pension Related Deduction (PRD) has also been converted into a permanent Additional
Superannuation Contribution (ASC) the fall in contributions (incl. PRD and ASC), as % of GDP, can be
largely attributed to the increasing number of members in the Single Scheme over the projection period
who pay ASC at a lower rate than pre-Single Scheme employees.
1.15. Future Considerations
1.16. The current level of expenditure on public service retirement benefits, in addition to the level of future liability,
highlights the need to ensure a sustainable approach in relation to the recruitment of additional public servants.
1.17. The projected increase in expenditure may necessitate further reforms in public service occupational pensions to
ensure its sustainability over future years. For example, the post-retirement pension increase policy which has a
considerable impact on costs could be changed to be linked with the Consumer Price Index (CPI), as permitted
under Section 40 of the Public Service Pensions (Single Scheme and Other Provisions) Act 2012. However, public
service pension increases have historically been on the basis of pay parity, i.e. in line with the pay of the grade
from which the public servant retired, and any consideration to move towards CPI linkage would need to be mindful
of the Public Service Stability Agreement (PSSA).
1.18. It is also advisable that steps are taken at a sectoral level to continue to improve the quality of the data required
for these types of analysis. In light of the incompleteness of data samples and the adjustments made to the data
in its entirety, it is expected that the projected cash flows falls within a range of -5% and +10% of the derived
figures.
6 | P a g e
2. Introduction
2.1. An actuarial valuation of the State’s Accrued-to-Date liability (the “ADL”) in respect of public service
occupational pension schemes was calculated as €114.5bn as of December 2015.
2.2. This valuation of the ADL was completed in 2017 by the Department of Public Expenditure and Reform on
behalf of the Central Statistics Office (the “CSO”), who are required to show the accrued liabilities of all
funded and unfunded Irish pension schemes as part of the National Accounts, under EU Regulation 549 /
2013.
2.3. The €114.5bn figure represents the present value of all expected future superannuation payments to current
and former employees and their spouses in respect of service to date, plus the liability for all future payments
to current pensioners and their spouses. Thus, the full range of liabilities valued includes the main life
pension and gratuity, a spouse’s pension, a supplementary pension (where applicable) and death in service
benefits including survivors’ pensions and gratuities.
2.4. The valuation of the ADL entailed collation and analysis of a large quantity of individual member data on
active employees, deferred members and current pensioners across the public service, with projections of
future benefit obligations carried out on an individual line by line basis under a ‘Projected Benefit Obligation’
approach. The ADL thereby captured the idiosyncrasies in the rules and entitlements under defined beneift
provision by sector; Civil Service, Health, Education, Defence, Justice, Local Authorities, Non-Commercial
State Agencies; and by cohort; pre 1995, post 1995, post 2004 and post 2013 (“Single Scheme”) entrants
(see Appendix A for detail on the main benefit provisions and Appendix B for detail on recent developments
in public service pensions).
2.5. The ADL of €114.5bn was calculated under the assumption that future pension payments will increase in
line with pay parity (i.e. in line with the pay of the grade from which the public servant retires), as has been
the case historically. Pension increases are however a discretionary benefit and require Ministerial consent.
Section 47 of the Public Service Pensions (Single Scheme and Other Provisions) Act 2012 permits the
government to pay all public service pension increases in line with increases in the Consumer Price Index.
2.6. The value of the ADL was therefore also estimated assuming pensions in payment increase in line with
increases in the Consumer Price Index (CPI). In this scenario, the Accrued Liability figure falls to €97.2bn
as at 31st December 2015. Thus, the pension increase assumption adopted can have a large effect on the
cost of pensions.
2.7. The ADL at year end 2015 represents a significant liability of the Irish State which will fall to be paid over
approximately 70 years following the valuation date. These public sector benefit obligations are primarily
financed on a pay as you go basis with the annual net cost of pensions in payment being funded by the
exchequer. For example, total actual expenditure on public service retirement benefits in 2016 was €3.3bn.
2.8. The progression of the public service pension bill is therefore an important expenditure consideration for the
State. There exists significant uncertainty around the level and incidence of retirement benefit cash flows

7 | P a g e
over future years, particularly in light of the longevity risk associated with defined benefit provision, the
demographic pressures arising from an ageing workforce and the variation in retirement ages across
scheme members in the public service.
2.9. The present study projects the public sector pension bill by sector by adopting an open group valuation
approach over a 40 year time period. Specifically, expenditure and contribution income cash flows are
projected over the long term with the purpose of aiding our understanding of projected cashflow trends over
time, partiularly in relation to the conversion of active members to retiree status, the impact of the
introduction of the Single Scheme, and the expected required subvention from the exchequer over future
years. Unlike the accrued pensions liability which reflects benefits earned to date, these cashflows reflect
the monetary impact of future recruitment and retirement patterns.
2.10. The analysis is presented in absolute real terms, and as a percentage of GDP, under the assumption of
both a static and an increasing public service workforce over the projection period.

8 | P a g e
3. Data
3.1. Data Overview
3.1.1. A large amount of information was required to carry out the cash flow analysis including individual
member data on active employees, deferred members and current pensioners across the public
sector.
3.1.2. Membership data which was collected and collated for the purpose of carrying out an actuarial
valuation of public sector pensions as at 31st December 2015 was used for the projection of the income
and expenditure cash flows.1
3.1.3. The membership data used was, on a whole, deemed to be of reasonable quality and sufficiently
complete. A variety of checks and adjustments, and thorough analyses of the data were performed,
and sample data was scaled up where necessary, as detailed in the report on the actuarial valuation.
3.1.4. It is important to note that the results of this review are critically dependent on the quality and
correctness of the data used. The Department does not accept responsibility for any inaccuracies in
the data supplied by public sector bodies.
3.1.5. A detailed description of the data is presented in Appendix C.
1 Actuarial Review of Public Service Occupational Pension in Ireland as required by EU Regulation 549 / 2013, December (2017).
9 | P a g e
4. Assumptions
4.1. Overview of Assumptions
4.1.1. A number of critical financial and demographic assumptions were required in order to project
retirement benefit cash flows payable in the future.
4.1.2. The macroeconomic assumptions are those produced by the European Commission for Ireland and
used in the 2018 Ageing Report.
4.1.3. The assumptions used in projecting the pension obligations over a future term are as guided by the
Technical Compilation Guide for Pension Data in National Accounts produced by Eurostat and the
European Central Bank; with the exception of the mortality assumptions over which there is an
element of discretion. The mortality tables used reflect the mortality experience of pensioners of
occupational pension schemes in Ireland.
4.1.4. The assumptions should be considered in totality and any one element should not be considered in
isolation.
4.1.5. A summary of the primary assumptions adopted for determining the cash flow projection of public
service occupational pension obligations is set out below.
Table 4.1: Assumptions for cash flow analysis
2 Pension increases for pre 2013 entrants are assumed to be line with salary increases. Post 2013 entrants i.e. Single Scheme
members’ pension increases are in line with inflation i.e. 2% p.a. The labour productivity growth rates are taken from the
projections run by the European Commission and sent to Member States to form the basis of the 2018 Ageing Report.
Inflation 2.00% p.a.
Real Salary increases2 Labour productivity per hour growth rate for Ireland which
translates to an overall nominal rate of 1.45% p.a. in the long term
Mortality Post Retirement
58% ILT 15 (for males)
62% of ILT 15 (for females)
Mortality Post Retirement
Improvement Factors
with an increase to the annuity value of:
0.36% p.a. (single males)
0.30% p.a. (single females)
0.30% p.a. (married members)
for each year between 2014 and the member’s year of retirement.
10 | P a g e
4.1.6. A detailed description of the financial and demographic assumptions made to carry out the present
study is included in Appendix D.
4.2. Sensitivity to Assumptions
4.2.1. The financial assumptions are generally considered to have a more significant effect on the valuation
results than the demographic assumptions. Of these assumptions, those made in relation to the
inflationary type increases (such as in respect of salary and pensions in payment increases) are the
most significant financially.
4.3. Overall appropriateness of assumptions
4.3.1. As mentioned earlier in this section, the assumptions used in projecting the pension obligations are
as guided by the Technical Compilation Guide for Pension Data in National Accounts produced by
Eurostat and the European Central Bank. There was some discretion3 as to the choice of mortality
tables and those used reflect the mortality experience of pensioners of occupational pension
schemes in Ireland. These mortality tables are in common usage for assessing liabilities of
occupational pension schemes in Ireland and reflect a lower life expectancy than the population
average.
4.3.2. ASP PA-2 (paragraph 2.8) requires commentary on the overall appropriateness of the methodology
and assumptions where these are prescribed by another party. Overall the assumptions and
methodology are considered to be reasonable.
3 5.3.1 of the technical compilation guide states that “if the mortality of pension scheme members is assumed to differ widely from
the general population mortality, scheme-specific mortality data should be used if available. This might be the case for e.g. civil
servants, who are generally assumed to have a higher life expectancy than the population average.”

11 | P a g e
5. Methodology
Cashflow Projection methodology
5.1. The Projected Benefit Obligation or (“PBO”) approach is applied when estimating retirement benefit obligations of
defined benefit schemes. This is one of the most commonly used actuarial valuation techniques for pension
valuation purposes.
5.2. Under the PBO approach, it is assumed that pension and gratuity benefits are uprated in line with wage growth, or
consumer price inflation where appropriate, and that pensions in payment are indexed in accordance with the
relevant indexation rules. For this analysis, projected benefits are uprated in line with wage growth pre-retirement
and pensions are also uprated in line with wage growth post retirement (save for post 2013 entrants whose benefits
are uprated in line with CPI), reflecting the historic discretionary practice of parity pay linkage.
5.3. For the estimation of pension liabilities, it is important to distinguish between pension entitlements accrued by
current retirees, and pension entitlements accrued by active members. The former group has its working and
contribution period behind it, and is therefore already entitled to full pension benefits.
5.4. All actuarial modelling has been carried out on an “open group” basis. For this analysis, it is important to consider
an open group approach, namely:
5.4.1. Former public service employees currently in receipt of pensions
5.4.2. Current and former public service employees who have already “accrued” benefits based on service worked
with the public service
5.4.3. Current public service employees who are expected to continue accruing benefits as part of their future
employment
5.4.4. Anticipated future new entrants to the public service who are projected to make contributions and begin
accruing benefits in the Single Public Service Pension Scheme once they start working for the public service.
5.5. Current pensioners or retirees are entitled to pension benefits on the basis of past accrued pension rights. As
outlined above, this group is entitled to full pension benefits. In other words, the benefits they receive in the base
year are fully accrued. It is important to note that current pensioners are entitled to pension benefits not just for one
year but, in fact, to all future pension payments, usually until they pass away. Most employees are also members
of a separate Spouse / Civil Partners and Children’s pension scheme which provides a pension of the order of 50%
of the employee’s retirement pension, plus associated children’s pensions.
5.6. The estimation of retirement benefit entitlements for active members closely follows the approach for current
pensioners.
5.6.1. However, the fact that current employees are not yet entitled to the full pension they would receive after a
complete career needs to be taken into account. Therefore, their future prospective pension and gratuity
payments need to be estimated.

12 | P a g e
5.4.5. The pension benefit at the future point of retirement has been calculated for all active employees for whom
detailed data have been obtained.
5.7. The projections were performed on an individual line by basis which captured the idiosyncrasies in the rules and
entitlements by sector (e.g. Civil Service, Health, and Education) and by cohort (pre-1995, post-95, post 2004
entrants and post 2013 entrants).
5.8. Grade structure is assumed to remain constant over the projection period.
Projected Cash flows – under the assumption of a constant workforce
5.9. The projected retirement outgo, pensions and gratuities, were prepared on the basis of pensions in payment
increasing in line with pay parity for all, save Single Scheme members whose pensions are projected to increase
in line with CPI reflecting the terms of that scheme.
5.10. Under the first approach to the cash flow projections, the public service numbers were assumed to remain static
over the projection period. Thus, overall numbers in the public service at any given point in the future are anticipated
to be the same as current levels. New entrant numbers are then the balancing number such that total public service
numbers less any exits due to retirement / death in service are maintained. See Chart 6.1 overleaf.
5.11. Budget figures prepared by each vote area are shown for 2018.
Projected Cash flows – under the assumption of an increasing workforce
5.12. An alternative approach to projecting the cash flows is to assume increasing public service numbers. The projected
numbers of new entrant employees into the medium and long term is subject to significant uncertainty, in terms of
both likely demand for and supply of labour. The demand for labour in the public service will be affected by core
demands in terms of public services, the impacts of technology and future technological innovation as well as future
approaches to outsourcing. Labour supply levels will continue to be affected by employment trends such as the
rise of the “gig” economy currently, net migration levels etc. Given the significant changes taking place due to the
impact of technological advances, the impacts of these factors on future employment levels in the public service
and indeed across the economy as a whole into the long term future is very challenging to predict.
5.13. On balance, reflecting the above uncertainties and the fact that overall employed numbers in Ireland are projected
to gently increase in the long term, an assumption of new entrant numbers so as to maintain overall public service
numbers at current levels could be within reasonable bounds. The figures shown in Chart 6.2 reflect this underlying
assumption about new entrants.
5.14. An alternative is to project that public service numbers will increase in line with the relevant populations they serve.
One proxy for this which may be applicable for the majority of the public service is the size of the employed
population.
5.15. As a refinement of the above approach to projecting new entrants, it seems reasonable to assume that public
service numbers in the Health service specifically may be more closely correlated with trend in the ageing
population or the rate of change in the average of the aged population and the population as a whole. Similarly
13 | P a g e
public service numbers in the Education sector may be expected to increase in line with the trend in the young
population. These trends in the projected growth of new entrants are reflected in the Health and Education sectors,
with the rate of change in the 15-64 year old population (a proxy for the employed population) used to project new
entrants in other public service sectors.
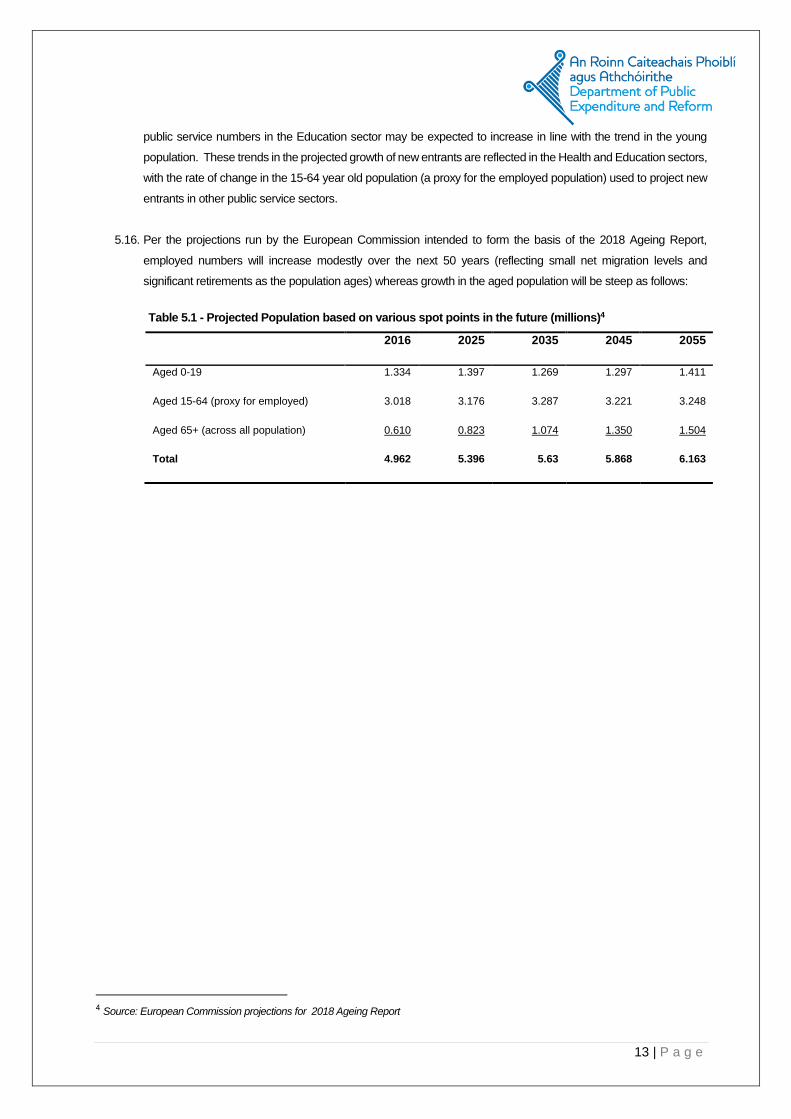
5.16. Per the projections run by the European Commission intended to form the basis of the 2018 Ageing Report,
employed numbers will increase modestly over the next 50 years (reflecting small net migration levels and
significant retirements as the population ages) whereas growth in the aged population will be steep as follows:
Table 5.1 - Projected Population based on various spot points in the future (millions)4
2016 2025 2035 2045 2055
Aged 0-19 1.334 1.397 1.269 1.297 1.411
Aged 15-64 (proxy for employed) 3.018 3.176 3.287 3.221 3.248
Aged 65+ (across all population) 0.610 0.823 1.074 1.350 1.504
Total 4.962 5.396 5.63 5.868 6.163
4 Source: European Commission projections for 2018 Ageing Report
14 | P a g e
6. Results
6.1. Pension expenditure and contribution projection in billions
6.1.1. The projected retirement outgo, pensions and gratuities, are presented below on the basis of
pensions in payment increasing in line with pay parity for all, save Single Scheme members whose
pensions are projected to increase in line with CPI reflecting the terms of that scheme.
6.1.2. The results presented are projections, not forecasts, which should be reviewed in light of updated
information available. The projected benefit payments are presented in real money terms.
6.1.3. One additional critical assumption required for the purpose of the cash flow projections is the size of the
public service workforce over the projected time period. As such, the cash flows are presented under two
approaches; first under the assumption of a constant workforce and secondly under the assumption of an
increasing workforce, over the 40 year period.
Projected Cash flows – under the assumption of a constant workforce
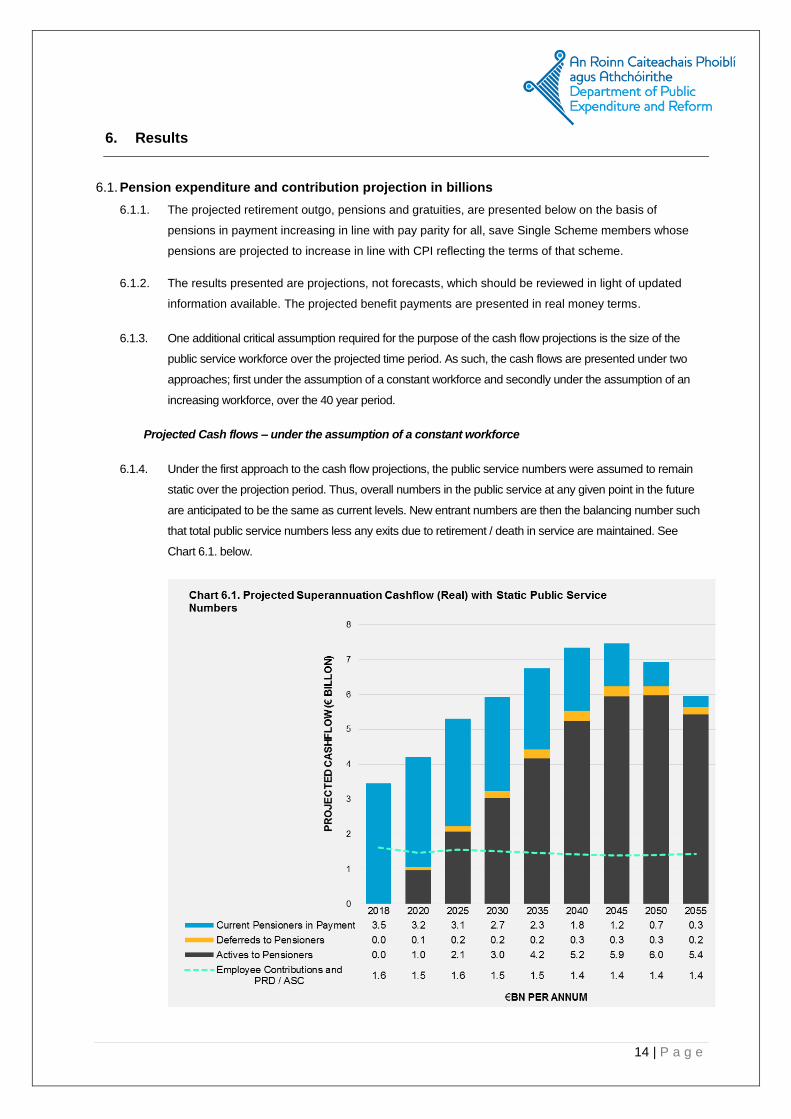
6.1.4. Under the first approach to the cash flow projections, the public service numbers were assumed to remain
static over the projection period. Thus, overall numbers in the public service at any given point in the future
are anticipated to be the same as current levels. New entrant numbers are then the balancing number such
that total public service numbers less any exits due to retirement / death in service are maintained. See
Chart 6.1. below.
15 | P a g e
6.1.5. As can be seen from the above chart, the projected benefit expenditure is expected to increase
substantially, that is to a peak of approximately €7.4bn by 2045, as a result of additional active and
deferred members transitioning to pensioner status.
6.1.6. The increasing annual expenditure expected over the period to 2045 can be largely attributed to the
ageing of the population over time. This is due to increasing longevity resulting in benefits being paid
for a longer period than expected in the past, and increasing numbers of pensioners vis-à-vis current
employees over the projection period. Thus, population ageing is expected to put significant pressure
on general government financing, by driving ageing-related expenditure, as the ratio of pension
recipients to pension contributors is expected to rise.
6.1.7. Annual benefit outgo is however expected to reduce after 2045, falling to approximately €6.0bn by
2055.
6.1.8. The reductions in projected occupational pension expenditure over the long term arise as a result of a
a number of reform measures taking effect over the period, partially negating the impact of the ageing
population on benefit expenditure. Most notably, a shift towards payment of ‘integrated’ occupational
pensions, introduced across the public service in 1995, resulting in a substantial reallocation of
expenditure from occupational pensions to State pensions (Contributory) over the forecast horizon,
the subsequent increase in the retirement age for new entrants from 2004, as well as the introduction
of the Single Scheme for new entrants to the public service in 2013.
6.1.9. The Single Scheme is expected to reduce spending on retirement benefits by in excess of 35% over
the long term. This expected cost saving can be attributed to the later retirement age, career average
rather than final salary benefit accrual and post-retirement indexation in line with increases in the
Consumer Price Index rather than in line with pay-parity.
6.1.10. While Chart 6.1 also shows that employee contributions, including PRD/ASC income, remain
relatively stable over the projection period, this income is expected to reduce marginally over time as
a result of an increasing number of members of the Single Scheme paying ASC at a lower rate than
that of pre-Single Scheme employees due to the lower value of their retirement beneifts accruing.
Projected Cash flows – under the assumption of an increasing workforce
6.1.11. An alternative approach to projecting the cash flows is to assume increasing public service numbers. The
projected numbers of new entrant employees into the medium and long term is subject to significant
uncertainty, in terms of both likely demand for and supply of labour. Thus, the impacts of various factors on
future employment levels in the public service and indeed across the economy as a whole into the long term
future is challenging to predict.
6.1.12. Chart 6.2. below reflects a projection of cash flows allowing for new entrants to increase from 2016 onward
in line with the trend in the underlying populations they serve observed today. See Methodology for more
details on this. Benefits for those accruing service today will not be impacted until circa 30+ years into the
future as these individuals begin to retire.
16 | P a g e
6.1.13. Gross pension expenditure, in real terms, is projected to increase from approximately €3.5bn in 2018 to
€7.6bn in 2045 before falling to €6.8bn in 2055 (See Chart 6.2 above). Employee Contributions (including
PRD/ASC), in real terms, are projected to increase from €1.6bn in 2018 to €2.0bn by 2055.
6.1.14. A breakdown of the gross pension expenditure, in real terms, across each sector over the projection
period is presented in table 6.1 below.
Table 6.1 Gross Benefit Expenditure (Real)
Sector 2018 2020 2030 2040 2050 Peak Year
€ Bn € Bn € Bn € Bn € Bn
Civil Service 0.5 0.6 0.9 1.0 0.9 2041
Education 1.2 1.4 2.0 2.5 2.9 2051
Defence/Justice 0.5 0.7 0.8 1.0 0.9 2041/2046
Health 0.8 0.9 1.4 1.9 2.0 2050
NCSAs 0.2 0.3 0.3 0.4 0.3 2037
Local Authorities 0.2 0.3 0.5 0.6 0.6 2041
Total 3.5 4.2 5.9 7.3 7.6 2048
17 | P a g e
6.1.15. A breakdown of employee contrbutions and PRD/ASC income across each sector over the projection
period is presented in table 6.2 below.
Table 6.2 Employee Contributions and PRD/ASC Income (Real)
Sector 2018 2020 2030 2040 2050 Peak Year
€ Bn € Bn € Bn € Bn € Bn
Civil Service 0.2 0.1 0.2 0.2 0.2 2034
Education 0.7 0.7 0.7 0.6 0.6 2025
Defence/Justice 0.1 0.1 0.1 0.1 0.1 2028/2024
Health 0.5 0.4 0.6 0.7 0.9 2050
NCSAs 0.0 0.0 0.0 0.0 0.0 2018
Local Authorities 0.1 0.1 0.1 0.1 0.1 2019
Total 1.6 1.6 1.8 1.7 1.9 2050
6.1.16. A breakdown of net benefit expenditure across each sector over the projection period is presented in
table 6.3 below.
Table 6.3 Net Benefit Expenditure (Real)
Sector 2018 2020 2030 2040 2050 Peak Year
€ Bn € Bn € Bn € Bn € Bn
Civil Service 0.4 0.5 0.7 0.8 0.7 2041
Education 0.5 0.7 1.3 1.9 2.4 2049
Defence/Justice 0.2 0.3 0.3 0.4 0.3 2041/2046
Health 0.3 0.4 0.8 1.1 1.1 2042
Justice 0.2 0.3 0.4 0.6 0.5 2046
NCSAs 0.2 0.2 0.3 0.4 0.3 2037
Local Authorities 0.1 0.2 0.4 0.5 0.4 2041
Total 1.8 2.6 4.1 5.6 5.7 2048
6.2. Pension Expenditure and Contribution Projections as a % of GDP
6.2.1. Given the long terms nature of the presented projections, a measure of the affordability of pensions is
projected future pension costs in relation to the GDP of the State. This can provide a better understanding
of the share of national income that has to be devoted to public service pensions expenditure over future
years.
6.2.2. It can be argued that the use of a net cash expenditure figure is not an appropriate measure as, along
with being inherently volatile, it represents a mismatch between contributions made in respect of future
18 | P a g e
benefits and payments of previously accrued benefits, and thus provides no insight into long-term
affordability.
6.2.3. The cash flow projections are therefore presented as a percentage of GDP as per the Ageing Report 2018
recently published by the European Commission.
6.2.4. Assuming GDP grows as projected, gross pension expenditure as a percentage of GDP is projected to
rise significantly until 2041 and fall thereafter. While the State currently applies 1.2% of GDP to fund
pension costs, this is projected to increase to 1.5% in 2041 and reduce to 0.99% by 2055.
6.2.5. The pension outflow pattern relative to GDP has a number of significant features, including the following:
Gross benefit expenditure as a percentage of GDP will between 2018 and 2045 from from
approximately 1.2% of GDP in 2018 to a peak of 1.5% in 2041. This increase arises from the
projected growth in the number of pensioners giving rise to a related pensions outflow over this
period which exceeds the growth in GDP.The significant growth in the number of pensioners
reflects the relatively high number of serving employees compared to the existing number of
pensioners.
Between 2045 and 2055 gross benefit expenditure is projected to reduce to approximately 0.99%
of GDP in 2055 as a result of the integration of occupational pensions with the State pension, the
increase in the minimum retirement age and implementation of the Single Scheme, as stated
above.
Employee contributions (incl. PRD/ASC) are projected to fall from approximately 0.5% of GDP in
2018 to approximately 0.2% by the year 2055. This can be largely attributed to the increasing
19 | P a g e
number of members of the Single Scheme over the projection period who pay ASC at a lower
rate than that of pre-Single Scheme employees due to the lower value of their retirement benefits
accruing.
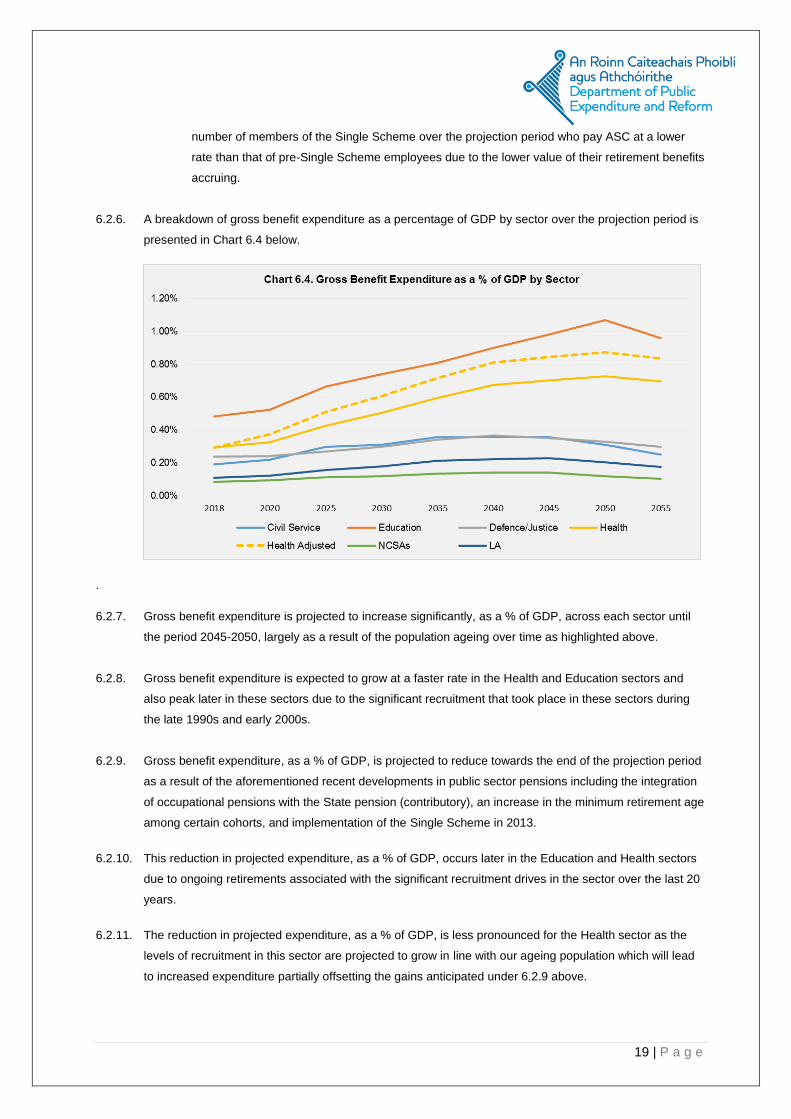
6.2.6. A breakdown of gross benefit expenditure as a percentage of GDP by sector over the projection period is
presented in Chart 6.4 below.
.
6.2.7. Gross benefit expenditure is projected to increase significantly, as a % of GDP, across each sector until
the period 2045-2050, largely as a result of the population ageing over time as highlighted above.
6.2.8. Gross benefit expenditure is expected to grow at a faster rate in the Health and Education sectors and
also peak later in these sectors due to the significant recruitment that took place in these sectors during
the late 1990s and early 2000s.
6.2.9. Gross benefit expenditure, as a % of GDP, is projected to reduce towards the end of the projection period
as a result of the aforementioned recent developments in public sector pensions including the integration
of occupational pensions with the State pension (contributory), an increase in the minimum retirement age
among certain cohorts, and implementation of the Single Scheme in 2013.
6.2.10. This reduction in projected expenditure, as a % of GDP, occurs later in the Education and Health sectors
due to ongoing retirements associated with the significant recruitment drives in the sector over the last 20
years.
6.2.11. The reduction in projected expenditure, as a % of GDP, is less pronounced for the Health sector as the
levels of recruitment in this sector are projected to grow in line with our ageing population which will lead
to increased expenditure partially offsetting the gains anticipated under 6.2.9 above.

20 | P a g e
6.2.12. It should be noted that the data set used for the Health sector may underestimate the service of many
existing active employees given that transfer of service is, for the most part, not captured in the Health
sector data. In light of this incompleteness, a sensitivity analysis was carried out by giving all employees
with a date of entry post their 25th birthday, a revised date of entry of their 25th birthday. This estimated the
potential for a 20% adjustment to expenditure for this sector (see adjusted cash flows for the Health sector
in chart 6.4 above).
6.2.13. The annual gross benefit expenditure, as % of GDP, in the Health sector is in fact expected to surpass
that of the Education sector after the projection period (i.e. post 2055), as the considerable recruitment in
the Health sector expected would feed into the pensions bill once these members retire, from 30 years+
post recruitment.
21 | P a g e
7. Future Considerations
7.1. It should be noted that the cash-flow projections are based on a wide range of assumptions about the future which
are unlikely to be borne out in reality. Readers are encouraged to focus on the trends in the figures rather than the
actual real value of the cash flows. The assumptions underlying these projections are set out in Section 4 of the
report.
7.2. The current level of expenditure on public service pensions, in addition to the level of future liability, does however
suggest the need to ensure a sustainable approach in relation to the recruitment of additional public servants.
7.3. While changes to the retirement age, the introduction of the Single Pension Scheme and the conversion of the
existing Pension Related Deduction (PRD) into a permanent Additional Superannuation Contribution (ASC) have
positively impacted the sustainability of pensions expenditure, demographic factors and the continued increase in
public service numbers mean that the level of expenditure in this area will continue to increase in the years to
come.
7.4. This anticipated increase in expenditure may necessitate further reforms in public service occupational pensions.
For example, the level of post-retirement pension increase policy adopted can have a large effect on the value of
the pension benefit. Historically, public service pension increases have been on the basis of pay parity, i.e. in line
with the pay of the grade from which the public servant retired. Section 40 of the Public Service Pensions (Single
Scheme and Other Provisions) Act 2012 permits the government to pay pension increases in line with increases
in the Consumer Price Index. However, any such consideration would need to be mindful of the Public Service
Stability Agreement (PSSA).
7.5. It is advisable that steps are taken at a sectoral level to continue to improve the quality of the data required for
these types of analysis. Further progress could be made in storing the records in an electronic and ideally in a
centralised format. In light of the incompleteness of data samples and the adjustments made to the data in its
entirety, it is expected that the projected cash flows falls within a range of -5% and +10% of the derived figures.

22 | P a g e
8. Appendix A - Main Benefit Provisions
8.1. Public service pension benefits
The term “public service pensions” refers to a range of different pension arrangements
covering the following various groups of public service employees:
Civil Service
Education
Health
Security, i.e. Gardaí, Defence Forces and Prison Officers
Constitutional, Ministerial and Judicial office holders
Local Government
Non-commercial State sponsored bodies.
8.2. Coverage
There is generally 100% pension coverage of employees and part time/fixed term contract
employees whose normal hours of work constitute at least 20% cent of the normal hours
of work of a comparable full time employee.
8.3. Retirement benefits
In broad terms those who entered the public service before 6th April 1995 are provided
with final salary DB retirement benefits payable at their minimum retirement age of:
1/80th of pensionable salary5 at retirement for each year of reckonable service, to a
maximum pension of 40/80ths of pensionable salary. 50% of this pension is payable to
a surviving spouse or civil partner where the pensioner predeceases his or her
spouse/civil partner, and
A gratuity of 3/80ths of pensionable salary at retirement for each year of reckonable
service, to a maximum gratuity of 120/80ths of pensionable salary. In effect the gratuity
is 3 times the annual pension.
8.4. Integration with State Pension entitlement
The pension entitlement (but not the gratuity) of those who joined the public service after
6th April 1995 is integrated with their State Pension entitlement so that their total pension
is made up partly by a public service pension and the balance by their State Pension.
The integration is accomplished by providing a lower rate of pension accrual, 1/200th
instead of 1/80th for each year of reckonable service, for that part of pensionable
salary which falls below 3.333333 x the maximum annual rate of State Pension
(Contributory) payable to a single person without dependents.
5 Pensionable salary is normally the salary payable on the last day of reckonable service plus the average of the best three
consecutive years’ pensionable emoluments and allowances in the final ten years of service.
23 | P a g e
This switch to integrated pensions in 1995 coincided with:
Such employees being required to pay PRSI at the higher Class A rate, instead of the
lower ‘modified’ Class B, C or D rates of PRSI paid by those recruited before 6th April
1995.
The introduction of an explicit Superannuation contribution for those sectors that had not
previously paid such a contribution, e.g. civil service, and the increase in the contribution
for those who had previously paid a reduced contribution, e.g. Gardaí.
A compensating increase in the pay scales for those sectors required to make a
Superannuation contribution for the first time (Civil Service) or to pay an increased rate
of contribution (Gardaí).
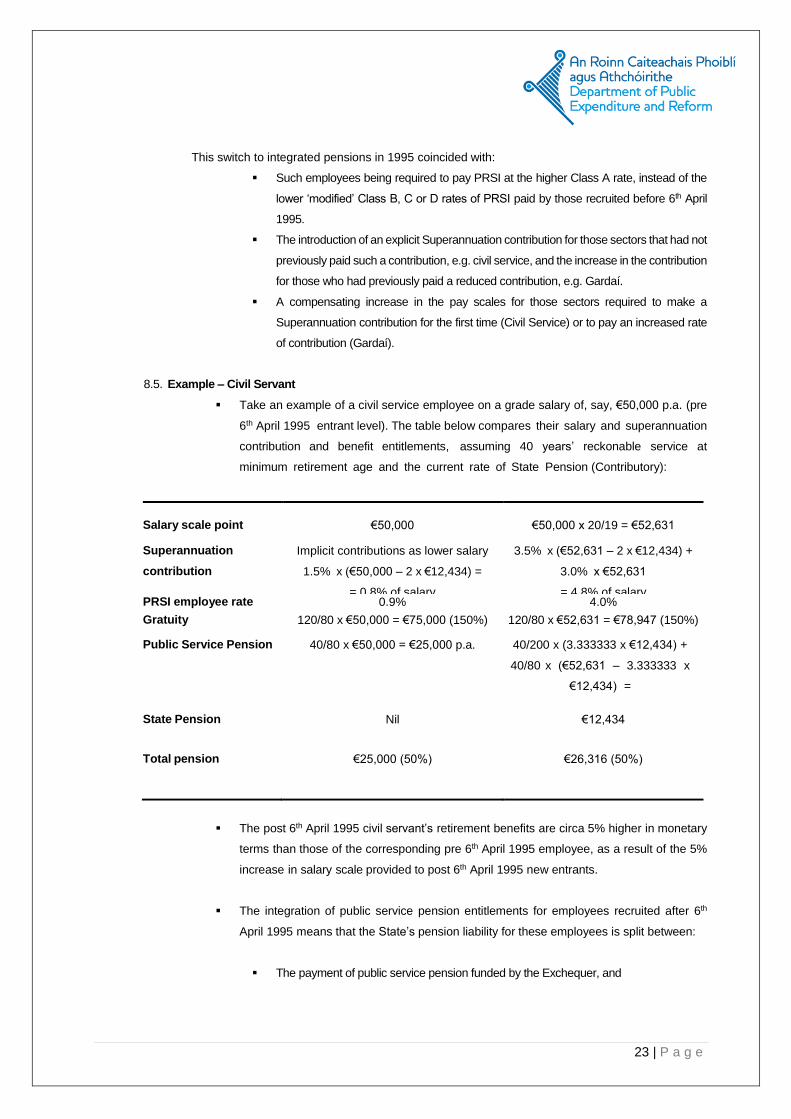
8.5. Example – Civil Servant
Take an example of a civil service employee on a grade salary of, say, €50,000 p.a. (pre
6th April 1995 entrant level). The table below compares their salary and superannuation
contribution and benefit entitlements, assuming 40 years’ reckonable service at
minimum retirement age and the current rate of State Pension (Contributory):
Recruited before 6th April 1995 Recruited after 6th April 1995
Salary scale point €50,000 €50,000 x 20/19 = €52,631
Superannuation
contribution
Implicit contributions as lower salary
1.5% x (€50,000 – 2 x €12,434) =
= 0.8% of salary
3.5% x (€52,631 – 2 x €12,434) +
3.0% x €52,631
= 4.8% of salary PRSI employee rate 0.9% 4.0%
Gratuity 120/80 x €50,000 = €75,000 (150%) 120/80 x €52,631 = €78,947 (150%)
Public Service Pension 40/80 x €50,000 = €25,000 p.a. 40/200 x (3.333333 x €12,434) +
40/80 x (€52,631 – 3.333333 x
€12,434) =
€13,881 State Pension Nil €12,434
Total pension €25,000 (50%) €26,316 (50%)
The post 6th April 1995 civil servant’s retirement benefits are circa 5% higher in monetary
terms than those of the corresponding pre 6th April 1995 employee, as a result of the 5%
increase in salary scale provided to post 6th April 1995 new entrants.
The integration of public service pension entitlements for employees recruited after 6th
April 1995 means that the State’s pension liability for these employees is split between:
The payment of public service pension funded by the Exchequer, and
24 | P a g e
The State Pension paid from the Social Insurance Fund (SIF) and funded by employer
and employee PRSI contributions and, if PRSI contribution income is insufficient to meet
SIF outgoings, an Exchequer subvention to the SIF.
8.6. Added years / fast accrual
Some professional and technical grades have traditionally been entitled to “added”
or “notional years” service of up to 10 years, for reckonable service purposes. This was
reduced to a maximum of 5 years added service for new entrants post 1st April 2005 and
to 0 years for new entrants from 1st January 2013.
Some sectors and grades are entitled to ‘fast accrual’, i.e. they can achieve the maximum
pension and gratuity entitlement with less than 40 years actual service1.
There is a separate Purchase of Notional Service (PNS) scheme whereby public service
employees can, in return for an additional contribution (which is eligible for income tax
relief within statutory limits), buy missing years of service required to bring them to their
maximum reckonable service by their minimum retirement age. Public service
employees can also contribute AVCs in addition to or in conjunction with PNS.
8.7. Minimum retirement age
Public service superannuation benefits are payable without actuarial reduction when an
employee reaches their minimum retirement age, which varies between certain sectors
and by date of entry into service.
Employees recruited before 1st April 2004 generally have a minimum retirement age of
60 and a maximum of 65;
Employees recruited after 1st April 2004 and before 31st December 2012 generally have
a minimum retirement age of 65 but no maximum.
Employees recruited after 1st January 2013 have a retirement age in line with the State
Pension qualifying age [i.e. age 66, increasing with the State Pension (Contributory) age
to 67 in 2021 and to age 68 in 2028. Security: Current earlier minimum retirement ages
for the security sector continue to apply].
Staff may retire at an earlier age but with an actuarial reduction applied to their pension
and gratuity to allow for earlier payment.
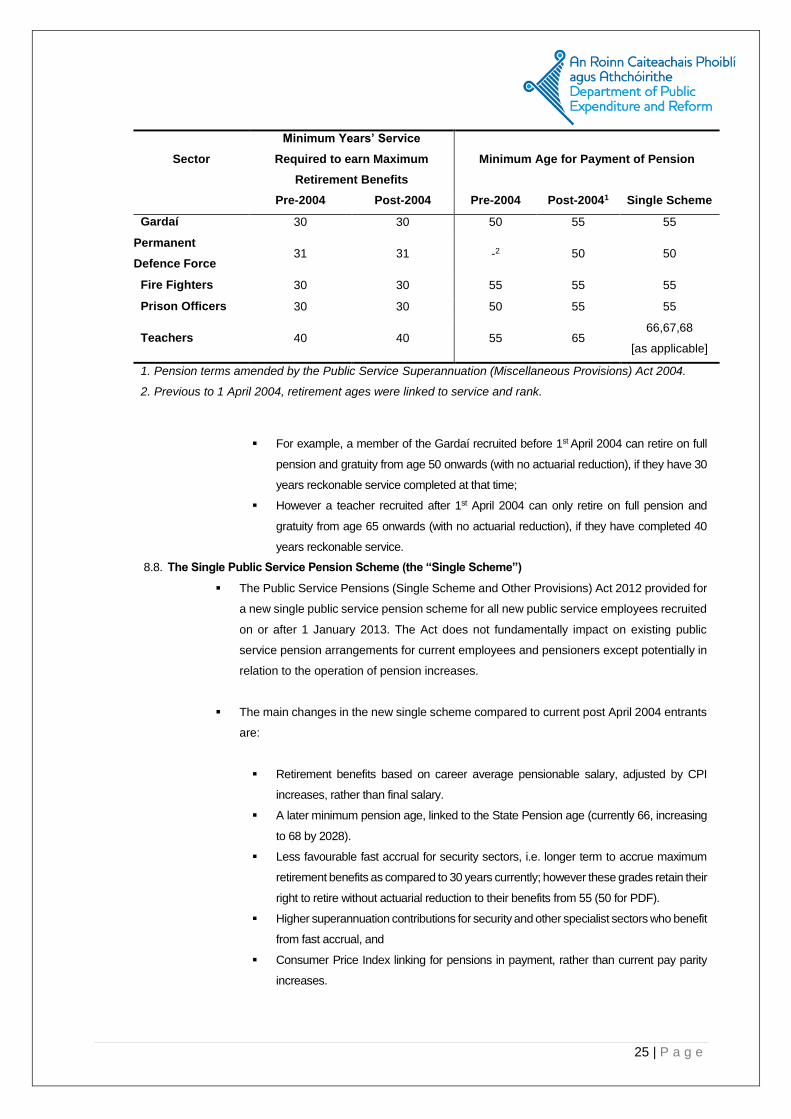
However security and education sectors have earlier minimum retirement ages in certain
cases:
25 | P a g e
Sector
Minimum Years’ Service
Required to earn Maximum
Retirement Benefits
Minimum Age for Payment of Pension
Pre-2004 Post-2004 Pre-2004 Post-20041 Single Scheme
Gardaí 30 30 50 55 55
Permanent
Defence Force 31 31 -2 50 50
Fire Fighters 30 30 55 55 55
Prison Officers 30 30 50 55 55
Teachers 40 40 55 65 66,67,68
[as applicable]
1. Pension terms amended by the Public Service Superannuation (Miscellaneous Provisions) Act 2004.
2. Previous to 1 April 2004, retirement ages were linked to service and rank.
For example, a member of the Gardaí recruited before 1st April 2004 can retire on full
pension and gratuity from age 50 onwards (with no actuarial reduction), if they have 30
years reckonable service completed at that time;
However a teacher recruited after 1st April 2004 can only retire on full pension and
gratuity from age 65 onwards (with no actuarial reduction), if they have completed 40
years reckonable service.
8.8. The Single Public Service Pension Scheme (the “Single Scheme”)
The Public Service Pensions (Single Scheme and Other Provisions) Act 2012 provided for
a new single public service pension scheme for all new public service employees recruited
on or after 1 January 2013. The Act does not fundamentally impact on existing public
service pension arrangements for current employees and pensioners except potentially in
relation to the operation of pension increases.
The main changes in the new single scheme compared to current post April 2004 entrants
are:
Retirement benefits based on career average pensionable salary, adjusted by CPI
increases, rather than final salary.
A later minimum pension age, linked to the State Pension age (currently 66, increasing
to 68 by 2028).
Less favourable fast accrual for security sectors, i.e. longer term to accrue maximum
retirement benefits as compared to 30 years currently; however these grades retain their
right to retire without actuarial reduction to their benefits from 55 (50 for PDF).
Higher superannuation contributions for security and other specialist sectors who benefit
from fast accrual, and
Consumer Price Index linking for pensions in payment, rather than current pay parity
increases.
26 | P a g e
9. Appendix B - Recent Developments in Public Service Pensions
9.1. In broad terms those who entered the public service before 6th April 1995 are provided with final salary
defined benefit (DB) retirement benefits payable at their minimum retirement age of:
9.1.1. 1/80th of pensionable salary6 at retirement for each year of reckonable service, to a maximum pension of
40/80ths of pensionable salary. 50% of this pension is payable to a surviving spouse or civil partner where
the pensioner predeceases his or her spouse/civil partner, and
9.1.2. A gratuity of 3/80ths of pensionable salary at retirement for each year of reckonable service, to a maximum
gratuity of 120/80ths of pensionable salary. In effect the gratuity is 3 times the annual pension.
9.2. Public Service Pension Reform
9.2.1. Significant public service pension reform measures have been implemented since 1995.
9.2.2. In general those measures collectively serve to:
generate additional current revenues / savings;
lock-in substantial long-term savings for the public finances;
impose progressively-constructed moderation on net pension income of retirees and pension
income expectations of serving staff; and
modernise / streamline the pension provision system.
9.2.3. The principal reform measures over recent years are as follows:
1995
In 1995, key changes affecting the pension terms of new joiners to public service employment were
introduced.
Integration with State Pension entitlement
The pension entitlement (but not the gratuity) of those who joined the public service after 6th April
1995 is integrated with their State Pension entitlement so that their total pension is made up partly
by a public service pension and the balance by their State Pension.
The integration is accomplished by providing a lower rate of pension accrual, 1/200th instead of 1/80th
for each year of reckonable service, for that part of pensionable salary which falls below 3.333333 x
the maximum annual rate of State Pension (Contributory) payable to a single person without
dependents.
This switch to integrated pensions in 1995 coincided with:
6 Pensionable salary is normally the salary payable on the last day of reckonable service plus the average of the best three
consecutive years’ pensionable emoluments and allowances in the final ten years of service.
27 | P a g e
Such employees being required to pay PRSI at the higher Class A rate, instead of
the lower ‘modified’ Class B, C or D rates of PRSI paid by those recruited before
6th April 1995.
The introduction of an explicit superannuation contribution for those sectors that
had not previously paid such a contribution, e.g. Civil Service, and an increase in
the contribution for those who had previously paid a reduced contribution, e.g.
Gardaí.
A compensating increase in the pay scales for those sectors required to make a
Superannuation contribution for the first time (Civil Service) or to pay an
increased rate of contribution (Gardaí).
2004
An increase of 5 years in the minimum pension age, to age 65 years, was implemented for new
joiner staff.
2009
A pension levy, or “Pension-related Deduction” (PRD) imposed on public servants under the financial
emergency (FEMPI) legislation. It was estimated at that time as yielding on average 7% of salaries
and saving some €950 million annually, and is now, following FEMPI 2015 “amelioration”, estimated
as yielding some €700 million annually. While not a pension contribution as such, when this PRD is
considered in conjunction with member pension contributions per se, it is seen that current public
servants make a significant input to the cost of their occupational pensions.
As part of the Public Service Stability Agreement (2018-2020), the PRD will be converted into the
Additional Superannuation Contribution (ASC), commencing 2019.
2010
Public service pay cut (average reduction 7%) introduced – depresses pension and lump sum
awards from March 2012 onwards.
2011
Public service pensions in payment above €12,000 reduced via multi-band (progressively
structured) “Public Service Pension Reduction” (PSPR) – average impact of 4% on pensions. [PSPR
was subsequently made more severe for higher-paid pensioners under legislated changes in 2013
(FEMPI 2013), before being very significantly eased over the three-year period 2016-2018 under
FEMPI 2015].
2013
The “Single Public Service Pension Scheme” was launched for new-entrant employees across the
entire public service. Post 1st January 2013, new entrants to the public service join the Single Public
Service Pension Scheme (the “Single Scheme”) which is a career average revalued earnings
scheme with a retirement age in line with the State Pension Age (66 currently rising to 68 in 2028).
Single Scheme members’ benefits are indexed with increases in the Consumer Price Index.
28 | P a g e
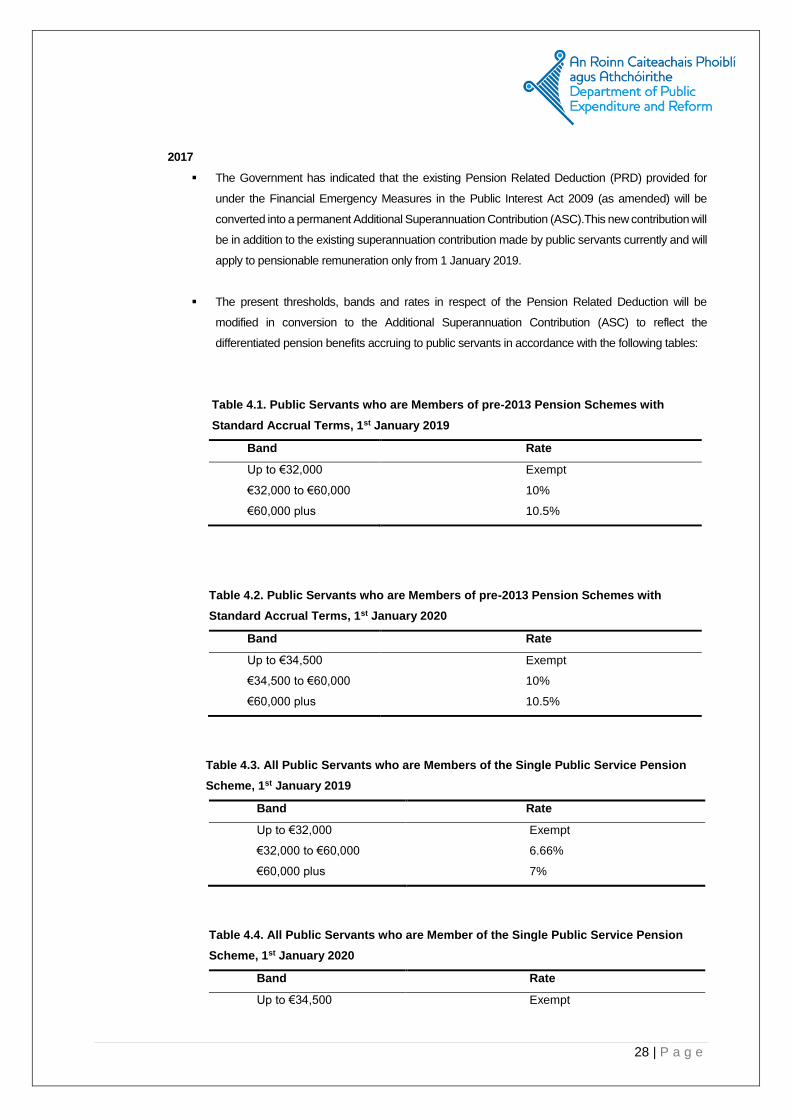
2017
The Government has indicated that the existing Pension Related Deduction (PRD) provided for
under the Financial Emergency Measures in the Public Interest Act 2009 (as amended) will be
converted into a permanent Additional Superannuation Contribution (ASC).This new contribution will
be in addition to the existing superannuation contribution made by public servants currently and will
apply to pensionable remuneration only from 1 January 2019.
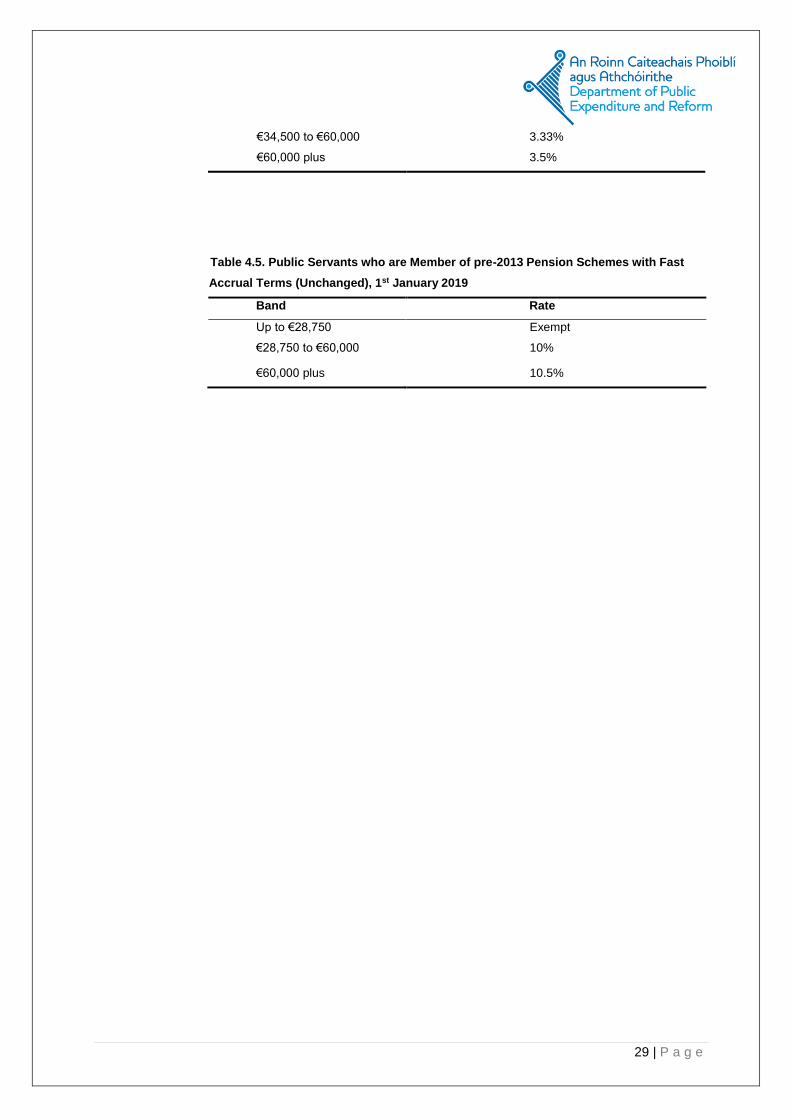
The present thresholds, bands and rates in respect of the Pension Related Deduction will be
modified in conversion to the Additional Superannuation Contribution (ASC) to reflect the
differentiated pension benefits accruing to public servants in accordance with the following tables:
Table 4.1. Public Servants who are Members of pre-2013 Pension Schemes with
Standard Accrual Terms, 1st January 2019
Band Rate
Up to €32,000 Exempt
€32,000 to €60,000 10%
€60,000 plus 10.5%
Table 4.2. Public Servants who are Members of pre-2013 Pension Schemes with
Standard Accrual Terms, 1st January 2020
Band Rate
Up to €34,500 Exempt
€34,500 to €60,000 10%
€60,000 plus 10.5%
Table 4.3. All Public Servants who are Members of the Single Public Service Pension
Scheme, 1st January 2019
Band Rate
Up to €32,000 Exempt
€32,000 to €60,000 6.66%
€60,000 plus 7%
Table 4.4. All Public Servants who are Member of the Single Public Service Pension
Scheme, 1st January 2020
Band Rate
Up to €34,500 Exempt
29 | P a g e
€34,500 to €60,000 3.33%
€60,000 plus 3.5%
Table 4.5. Public Servants who are Member of pre-2013 Pension Schemes with Fast
Accrual Terms (Unchanged), 1st January 2019
Band Rate
Up to €28,750 Exempt
€28,750 to €60,000 10%
€60,000 plus 10.5%
30 | P a g e
10. Appendix C - Data Analysis
10.1. Individual Member Data
Active Employees
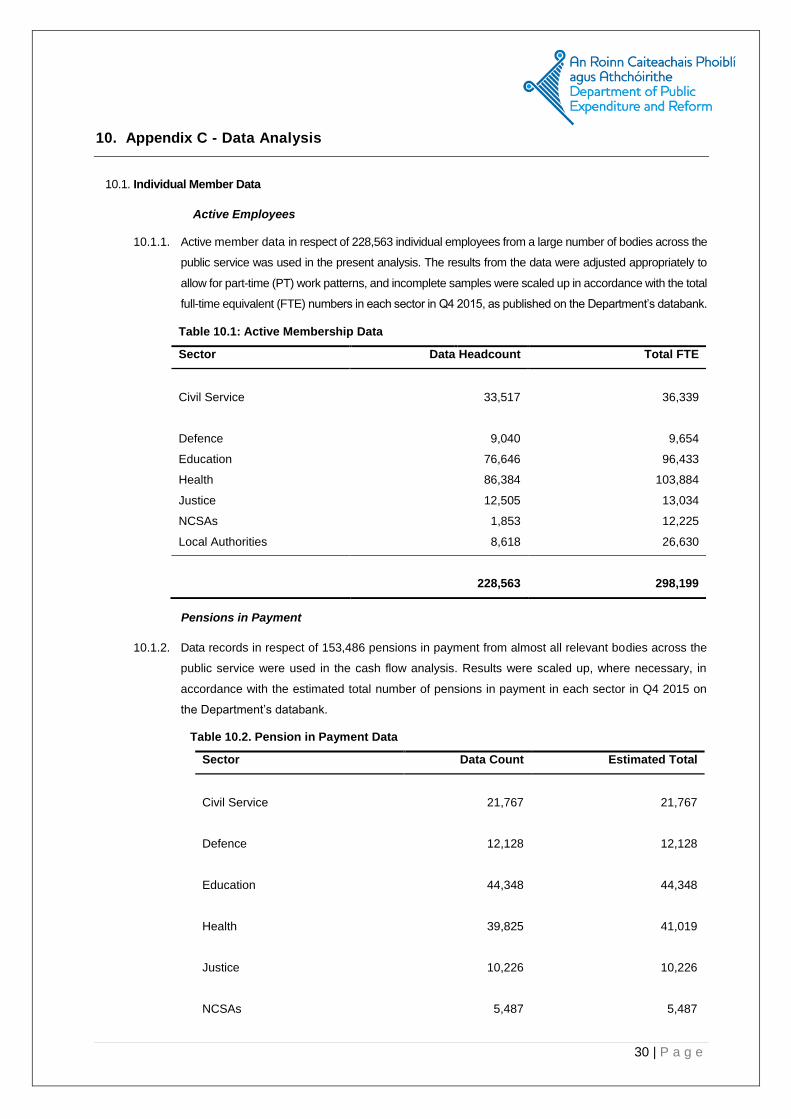
10.1.1. Active member data in respect of 228,563 individual employees from a large number of bodies across the
public service was used in the present analysis. The results from the data were adjusted appropriately to
allow for part-time (PT) work patterns, and incomplete samples were scaled up in accordance with the total
full-time equivalent (FTE) numbers in each sector in Q4 2015, as published on the Department’s databank.
Pensions in Payment
10.1.2. Data records in respect of 153,486 pensions in payment from almost all relevant bodies across the
public service were used in the cash flow analysis. Results were scaled up, where necessary, in
accordance with the estimated total number of pensions in payment in each sector in Q4 2015 on
the Department’s databank.
Table 10.2. Pension in Payment Data
Sector Data Count Estimated Total
Civil Service
21,767
21,767
Defence
12,128
12,128
Education
44,348
44,348
Health
39,825
41,019
Justice
10,226
10,226
NCSAs
5,487
5,487
Table 10.1: Active Membership Data
Sector Data Headcount Total FTE
Civil Service
33,517 36,339
Defence
9,040 9,654
Education 76,646 96,433
Health 86,384 103,884
Justice 12,505 13,034
NCSAs 1,853 12,225
Local Authorities 8,618 26,630
228,563
298,199

31 | P a g e
Local Authorities
19,705
19,705
153,486
154,680
Deferred Employees
10.1.3. A complete data set was used in respect of deferred members of the civil service and a sample was used
for those in the NCSA and Education sectors. Membership data was not available for former public service
employees who remain entitled to a deferred pension in the Health and the Local Authority sectors. As such,
an approximate adjustment was applied to the deferred cash flow projections. Cash flows were not
projected in relation to deferred members in the Justice nor the Defence sector as there are not significant
numbers of deferred pensioners among these cohorts as a result of their lower minimum retirement age.
10.2. Data Quality
10.2.1. A number of checks were performed on the data before use in the cash flow analysis. The checks included
those carried out in relation to the critical data items e.g. average age, salaries, and pension amounts, and
also a comparison of the total amounts of pensions, pay, employees and pensions in payment against the
figures published on DPER’s databank.
10.2.2. The quality of the data received varied considerably between sectors and between public service bodies
within a sector. The main issues surrounding the data were as follows:
Active Employee Data
Files contained several blank or invalid fields for critical data items including date of birth, date of
entry to pension scheme, type of pension scheme, annual pensionable salary, marital status and
gender.
Several data sets contained blank fields for the full-time equivalent (FTE) multiplier corresponding
to employees’ work patterns, and where the FTE multiplier was provided, details on the start and
end date of the part-time employment pattern were for the most part omitted.
A lack of data on pensionable allowances, and on added years either purchased by or awarded
to employees.
A lack of clarity surrounding the status of currently serving employees. For example, in some
instances, the data input in the salary field was very low and it was often unclear whether this
meant that the employee was working on a part-time basis or was no longer employed.
Start date of employment in the public service was not always available. In many instances, start
date reflected the date an employee commenced in a particular sector or body and thus transfer
of service across the public service was not captured.

32 | P a g e
Pensions in Payment Data
Files contained several blank or invalid fields for critical data items including date of birth,
date of retirement, pension commencement date, type of pension scheme and annual
pension value.
Data on contingent dependents’ pensions was not captured.
Deferred Employee Data
A general lack of data and existing information on former public service employees with deferred
pensions.
10.3. Data Adjustments
10.3.1. Several adjustments were made to the data before use in this study e.g.
Where the date of birth or start date fields were blank or invalid, the date was set as the average
date among those in the same pension scheme in the relevant sector.
If type of pension scheme was not provided, the employee was placed in a scheme based on date
of entry.
Where the salary or annual pension field was blank or zero the average salary or pension value in
the relevant sector was used, respectively.
In the case of a blank or invalid entry in the gender field, the employee was given the most common
gender in the data file.
10.3.2. Further detail on the data checks and adjustments is detailed in the report on the latest actuarial valuation
of public service pensions.
10.3.3. Following application of the various adjustments outlined, the overall quality and completeness of the data
used was deemed reasonable for the present purpose although significant improvements in the recording
and collation of data are recommended.
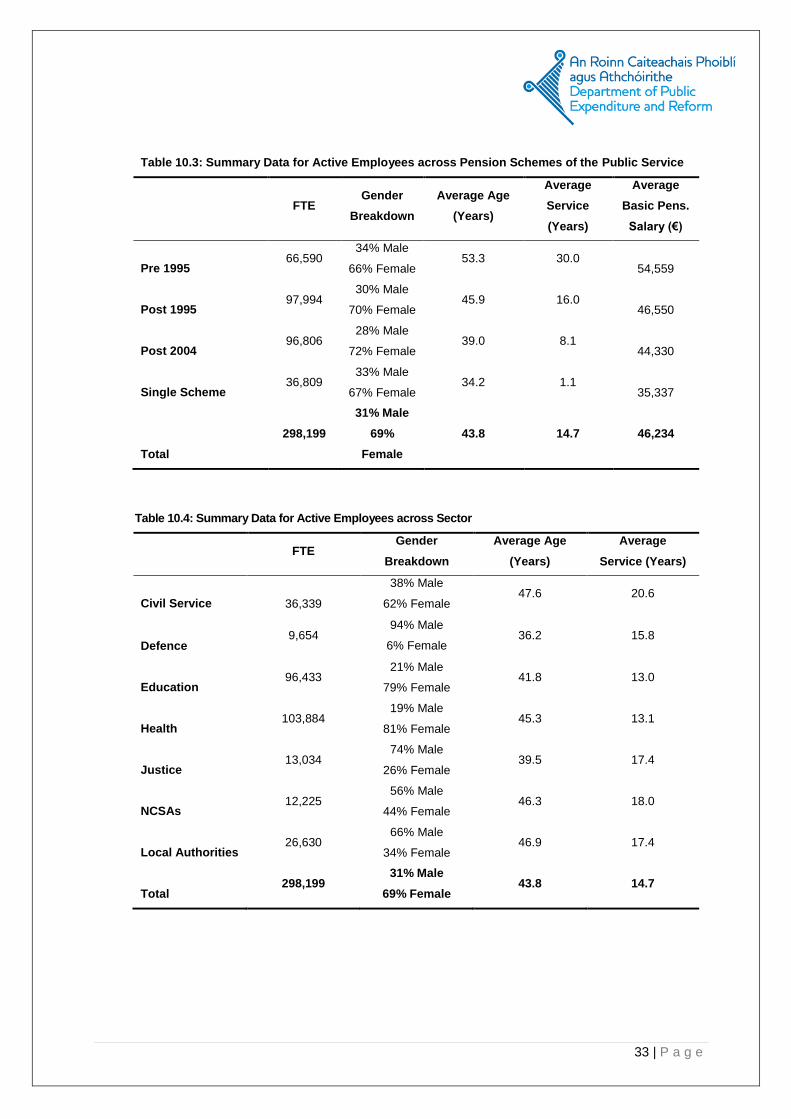
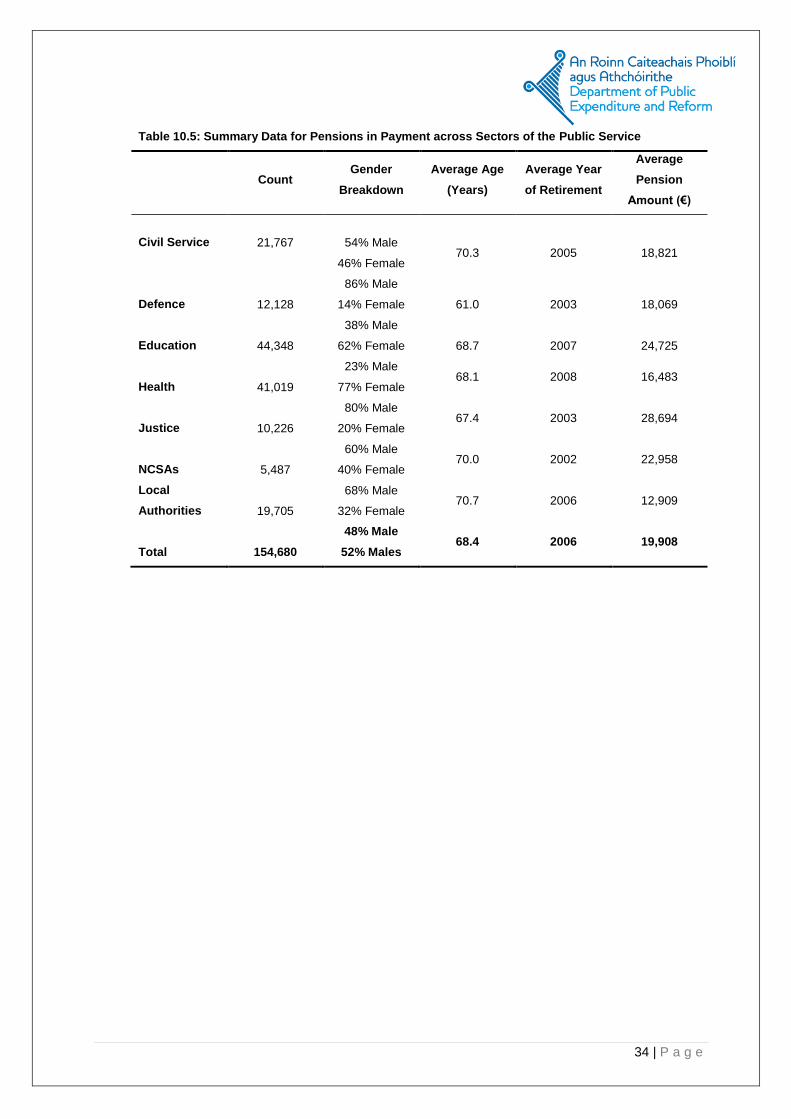
10.4. Data Summaries
3.4.1. The data used in the cash flow analysis, following implementation of the adjustments made to improve
the quality of the data and/or to estimate missing data is summarised below.
33 | P a g e
Table 10.3: Summary Data for Active Employees across Pension Schemes of the Public Service
FTE Gender
Breakdown
Average Age
(Years)
Average
Service
(Years)
Average
Basic Pens.
Salary (€)
Pre 1995 66,590
34% Male
66% Female 53.3 30.0
54,559
Post 1995 97,994
30% Male
70% Female 45.9 16.0
46,550
Post 2004 96,806
28% Male
72% Female 39.0 8.1
44,330
Single Scheme 36,809
33% Male
67% Female 34.2 1.1
35,337
Total
298,199
31% Male
69%
Female
43.8 14.7 46,234
Table 10.4: Summary Data for Active Employees across Sector
FTE
Gender
Breakdown
Average Age
(Years)
Average
Service (Years)
Civil Service
36,339
38% Male
62% Female 47.6 20.6
Defence 9,654
94% Male
6% Female 36.2 15.8
Education 96,433
21% Male
79% Female 41.8 13.0
Health 103,884
19% Male
81% Female 45.3 13.1
Justice 13,034
74% Male
26% Female 39.5 17.4
NCSAs 12,225
56% Male
44% Female 46.3 18.0
Local Authorities 26,630
66% Male
34% Female 46.9 17.4
Total 298,199
31% Male
69% Female 43.8 14.7
34 | P a g e
Table 10.5: Summary Data for Pensions in Payment across Sectors of the Public Service
Count Gender
Breakdown
Average Age
(Years)
Average Year
of Retirement
Average
Pension
Amount (€)
Civil Service
21,767
54% Male
46% Female
70.3
2005
18,821
Defence 12,128
86% Male
14% Female
61.0
2003
18,069
Education 44,348
38% Male
62% Female
68.7
2007
24,725
Health 41,019
23% Male
77% Female 68.1 2008 16,483
Justice 10,226
80% Male
20% Female 67.4 2003 28,694
NCSAs 5,487
60% Male
40% Female 70.0 2002 22,958
Local
Authorities 19,705
68% Male
32% Female 70.7 2006 12,909
Total
154,680
48% Male
52% Males 68.4 2006 19,908
35 | P a g e
11. Appendix D - Assumptions
11.1. Financial Assumptions
11.1.1. Inflation
For calculating pension entitlements, future cash flows can be projected in nominal or in real terms.
If nominal values are projected, both the discount rate and wage growth rate should include future
inflation expectations. If the projection is based on real values, inflation expectations are not explicitly
considered.
Generally, for calculating present values, both approaches (nominal and real values) should lead to
similar results.
An inflation rate of 2% per annum should be applied. This is in line with the European Central
Bank’s inflation rate target of just under 2% per annum over the medium term.
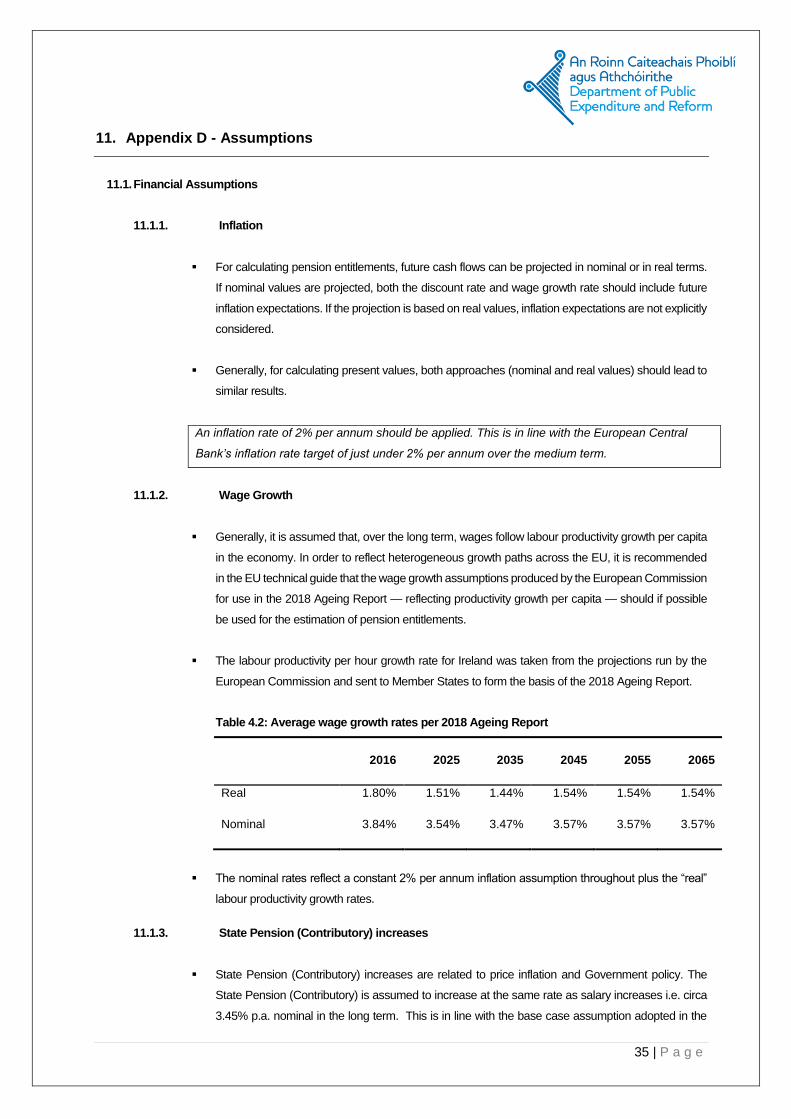
11.1.2. Wage Growth
Generally, it is assumed that, over the long term, wages follow labour productivity growth per capita
in the economy. In order to reflect heterogeneous growth paths across the EU, it is recommended
in the EU technical guide that the wage growth assumptions produced by the European Commission
for use in the 2018 Ageing Report — reflecting productivity growth per capita — should if possible
be used for the estimation of pension entitlements.
The labour productivity per hour growth rate for Ireland was taken from the projections run by the
European Commission and sent to Member States to form the basis of the 2018 Ageing Report.
Table 4.2: Average wage growth rates per 2018 Ageing Report
2016 2025 2035 2045 2055 2065
Real 1.80% 1.51% 1.44% 1.54% 1.54% 1.54%
Nominal 3.84% 3.54% 3.47% 3.57% 3.57% 3.57%
The nominal rates reflect a constant 2% per annum inflation assumption throughout plus the “real”
labour productivity growth rates.
11.1.3. State Pension (Contributory) increases
State Pension (Contributory) increases are related to price inflation and Government policy. The
State Pension (Contributory) is assumed to increase at the same rate as salary increases i.e. circa
3.45% p.a. nominal in the long term. This is in line with the base case assumption adopted in the

36 | P a g e
most recent Actuarial Review of the Social Insurance Fund 2015. The State pension has broadly
been increased such as to represent 33%-34% of average earnings at a given time.
Allowance has been made for the Supplementary Pension in this review.
No allowance for the cost of the State Pension (Contributory) has been made in this review as it is
assumed that this has been provided for via the Social Insurance Fund / PRSI system and thus
costed elsewhere.
11.1.4. Post-retirement pension increases
Pension increases are a discretionary benefit and require Ministerial consent. Pensions for pre-2013
cohorts have increased at full parity. For the most part, general increases for staff are passed on to
pensioners on the same basis. While discretionary, it is assumed that future pension payments will
be indexed in line with general salary increases for the main valuation results presented in this
review.
Post-2013 cohorts, i.e. Single Scheme members’ benefits are indexed in line with increases in the
Consumer Price Index (CPI).
11.1.5. Promotional salary scale
It is understood that the salary increase assumption adopted which is line with labour productivity
growth rates per capita incorporates both general and promotional salary increases.
11.1.6. Expenses
The cost of administration was not factored into the cost of providing the benefits.
11.2. Demographic Assumptions
11.2.1. Life expectancy / mortality rates
The assumed life expectancy in retirement is the most critical demographic assumption.
A standard mortality table recommended by the Society of Actuaries in Ireland was used in the
present analysis.
This mortality table reflected a mortality investigation carried out by the Society of Actuaries in Ireland
over 2013 which considered mortality data from Iarge private sector and public sector pension
schemes in Ireland.
The base table used for the post-retirement mortality assumptions reflected this new study with the
revised rate of mortality improvement factors reflecting an updated analysis performed by the CSO
37 | P a g e
in 2013 which showed that the rate of mortality improvement had slowed down as compared with
previous estimates.
Mortality is based on 58% of ILT15 for males and 62% of ILT15 for females, with a compounded
annual increase from 2014 to the annuity value of:
i. 0.36% (males with no spouse’s pension)
ii. 0.30% (females with no spouse’s pension)
iii. 0.30% (males with a spouse’s pension)
iv. 0.25% (females with a spouse’s pension)
This mortality basis incorporates an explicit allowance for continuing improvements in mortality rates
into the future. That is to say it is expected that members retiring in future years will benefit from
progressively improved life expectancies compared to their counterparts retiring this year. This
mortality assumption (both the base table and the mortality improvement rates into the future) is in
line with that included in the Pensions Authority prescribed guidance in relation to section 34 of the
Pensions Act i.e. it is the mortality table used for the purpose of calculation of transfer values.
The mortality table does not lend itself to direct calculation of life expectancies and thus for the
purpose of illustrating life expectancies in this paper reference is made to an underlying table (88%
ILT 15(M) / 91% ILT 15(F) with allowance for future improvements in line with CSO projections).
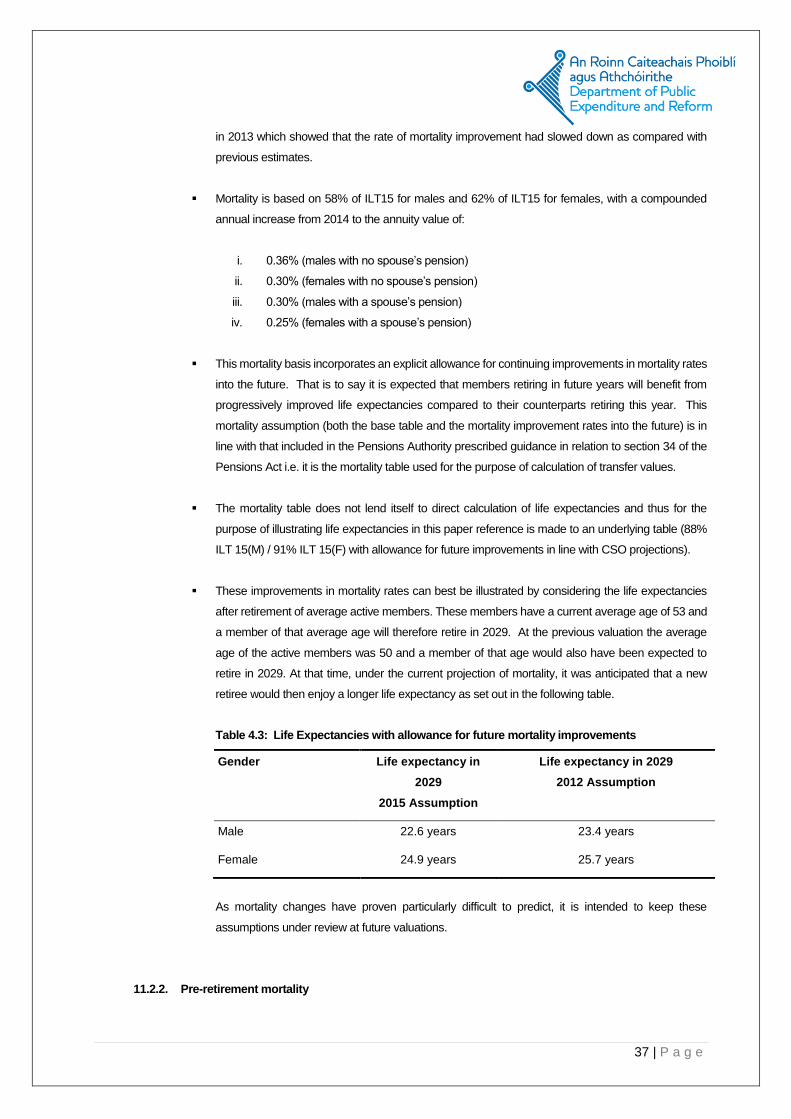
These improvements in mortality rates can best be illustrated by considering the life expectancies
after retirement of average active members. These members have a current average age of 53 and
a member of that average age will therefore retire in 2029. At the previous valuation the average
age of the active members was 50 and a member of that age would also have been expected to
retire in 2029. At that time, under the current projection of mortality, it was anticipated that a new
retiree would then enjoy a longer life expectancy as set out in the following table.
Table 4.3: Life Expectancies with allowance for future mortality improvements
Gender Life expectancy in
2029
2015 Assumption
Life expectancy in 2029
2012 Assumption
Male 22.6 years 23.4 years
Female 24.9 years 25.7 years
As mortality changes have proven particularly difficult to predict, it is intended to keep these
assumptions under review at future valuations.
11.2.2. Pre-retirement mortality
38 | P a g e
Mortality pre-retirement is assumed to be in line with 62% of PNML00 for male lives and 70% of
PNFL00 for female lives.
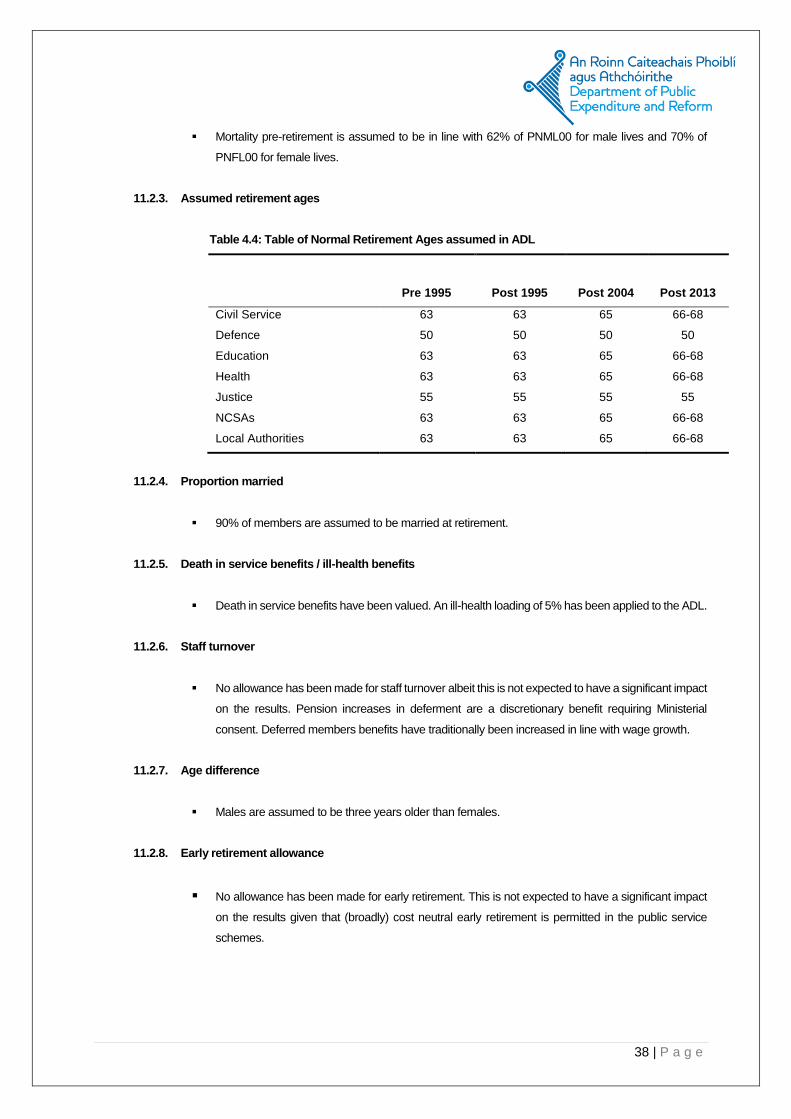
11.2.3. Assumed retirement ages
Table 4.4: Table of Normal Retirement Ages assumed in ADL
Pre 1995 Post 1995 Post 2004 Post 2013
Civil Service 63 63 65 66-68
Defence 50 50 50 50
Education 63 63 65 66-68
Health 63 63 65 66-68
Justice 55 55 55 55
NCSAs 63 63 65 66-68
Local Authorities 63 63 65 66-68
11.2.4. Proportion married
90% of members are assumed to be married at retirement.
11.2.5. Death in service benefits / ill-health benefits
Death in service benefits have been valued. An ill-health loading of 5% has been applied to the ADL.
11.2.6. Staff turnover
No allowance has been made for staff turnover albeit this is not expected to have a significant impact
on the results. Pension increases in deferment are a discretionary benefit requiring Ministerial
consent. Deferred members benefits have traditionally been increased in line with wage growth.
11.2.7. Age difference
Males are assumed to be three years older than females.
11.2.8. Early retirement allowance
No allowance has been made for early retirement. This is not expected to have a significant impact
on the results given that (broadly) cost neutral early retirement is permitted in the public service
schemes.