Embed Size (px)
Citation preview
11
Spectrum Analyzer 102+Spectrum Analyzer 102+Greg Best Consulting, Inc.Greg Best Consulting, Inc.
Presented at Kansas CityPresented at Kansas CitySBE Chapter 59 MeetingSBE Chapter 59 Meeting
March 8, 2012March 8, 2012
22
Spectrum Analyzer 102Spectrum Analyzer 102– Review of last presentationReview of last presentation– DetectorsDetectors
TypesTypesHow each one worksHow each one worksWhen to use which When to use which What difference it makesWhat difference it makesHints and KinksHints and Kinks
– QuestionsQuestions
33
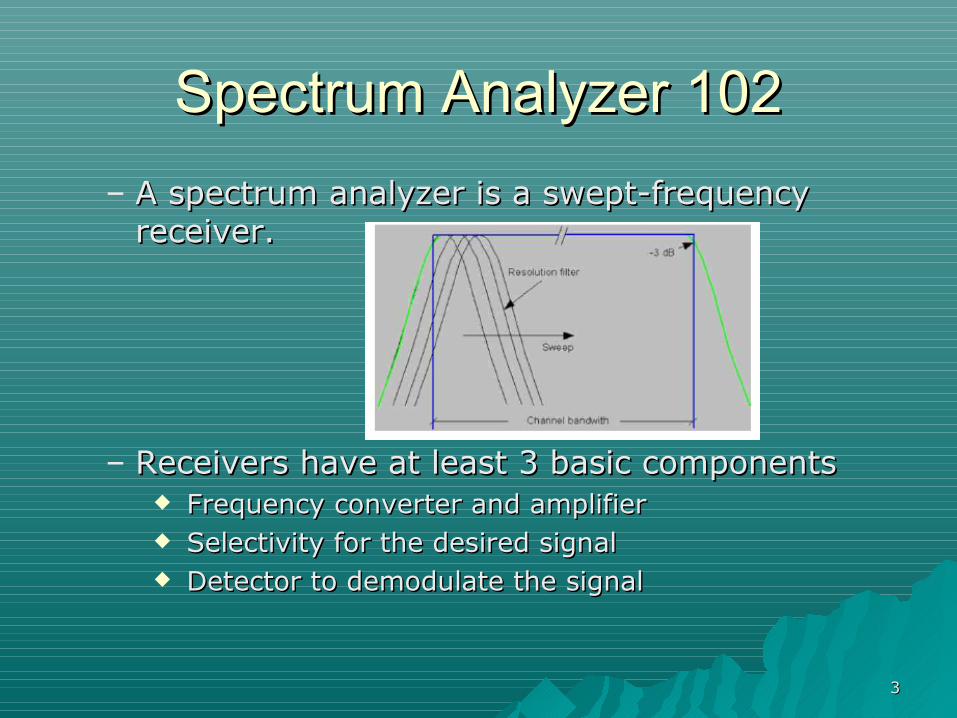
Spectrum Analyzer 102Spectrum Analyzer 102– A spectrum analyzer is a swept-frequency A spectrum analyzer is a swept-frequency
receiver.receiver.
– Receivers have at least 3 basic componentsReceivers have at least 3 basic components Frequency converter and amplifierFrequency converter and amplifier Selectivity for the desired signalSelectivity for the desired signal Detector to demodulate the signalDetector to demodulate the signal
44
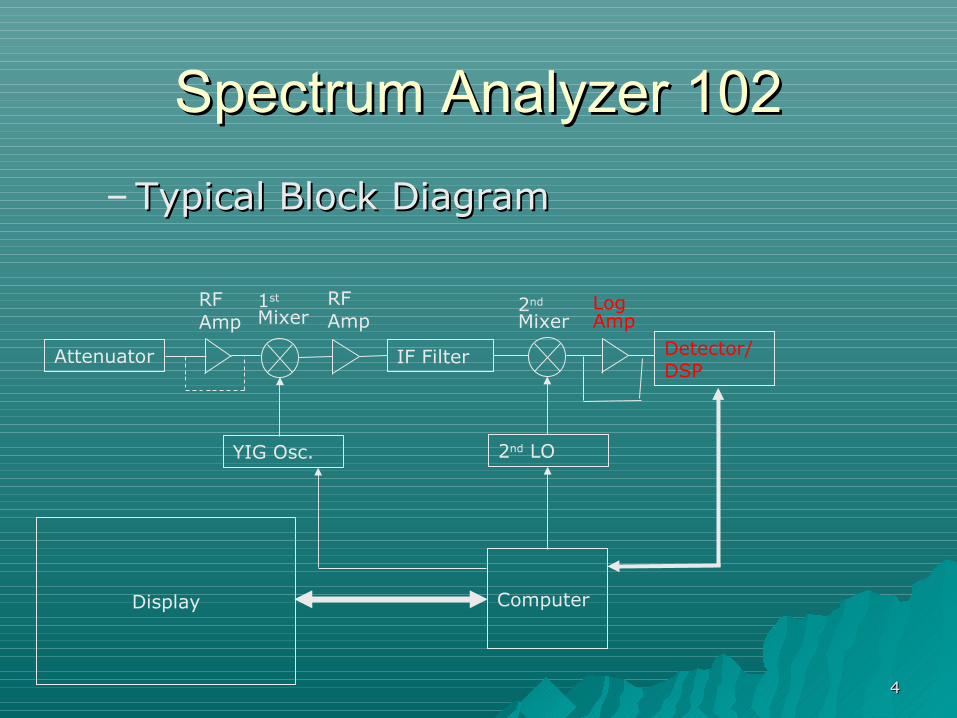
Spectrum Analyzer 102Spectrum Analyzer 102– Typical Block DiagramTypical Block Diagram
Attenuator IF Filter Detector/DSP
Display
YIG Osc. 2nd LO
Computer
LogAmp
RFAmp
1st Mixer
2nd Mixer
RFAmp
55
Spectrum Analyzer 102Spectrum Analyzer 102Reference MaterialReference Material
Rohde & Schwarz Book Rohde & Schwarz Book
Fundamentals Of Spectrum Analysis—Fundamentals Of Spectrum Analysis—Christoph Rauscher, 2007 Christoph Rauscher, 2007 ISBN -3-939837-01-5978ISBN -3-939837-01-5978
66
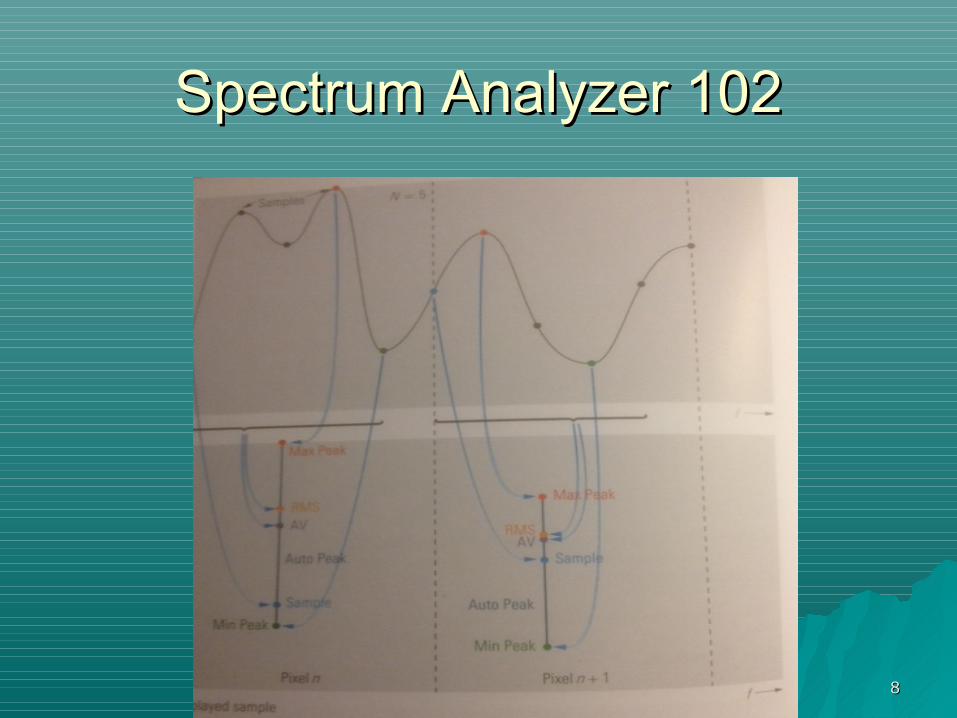
Spectrum Analyzer 102Spectrum Analyzer 102– How do displayed values get born?How do displayed values get born?
– SA has a set number of display pointsSA has a set number of display points# of Points > Span/RBW# of Points > Span/RBW
– At least 1 measured value per point but At least 1 measured value per point but could be many measured valuescould be many measured values
– Measured values get “mapped” to a Measured values get “mapped” to a display point (pixel)display point (pixel)
77
Spectrum Analyzer 102Spectrum Analyzer 102– Detector TypesDetector Types
– Max PeakMax Peak– Min PeakMin Peak– RMSRMS– AverageAverage– SampleSample– Quasi PeakQuasi Peak
88
Spectrum Analyzer 102Spectrum Analyzer 102
99
Spectrum Analyzer 102Spectrum Analyzer 102
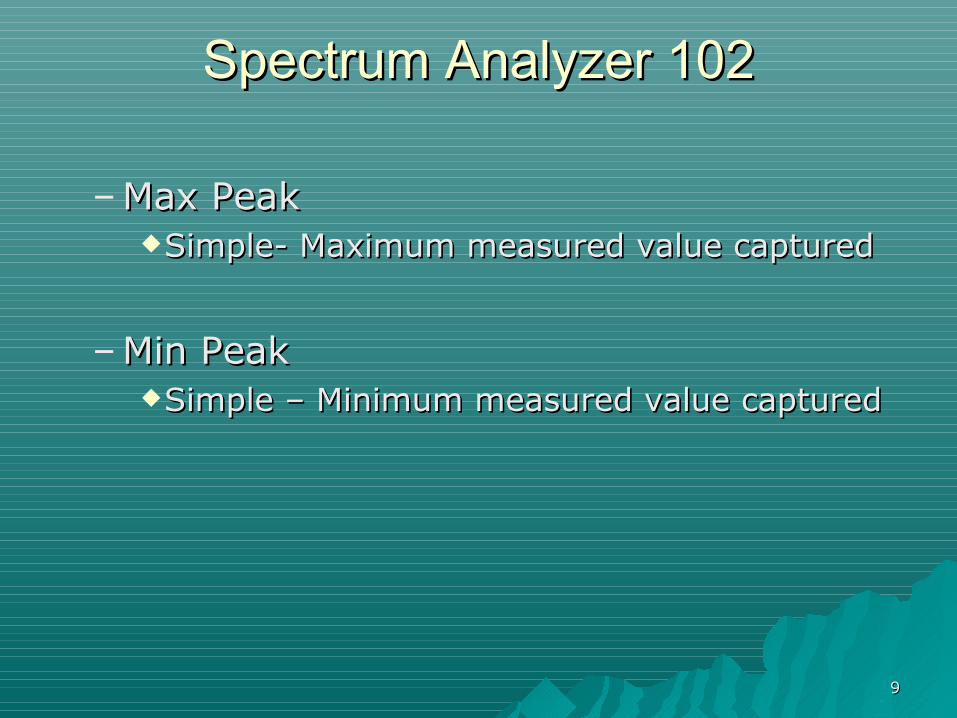
– Max Peak Max Peak Simple- Maximum measured value capturedSimple- Maximum measured value captured
– Min Peak Min Peak Simple – Minimum measured value capturedSimple – Minimum measured value captured
1010
Spectrum Analyzer 102Spectrum Analyzer 102
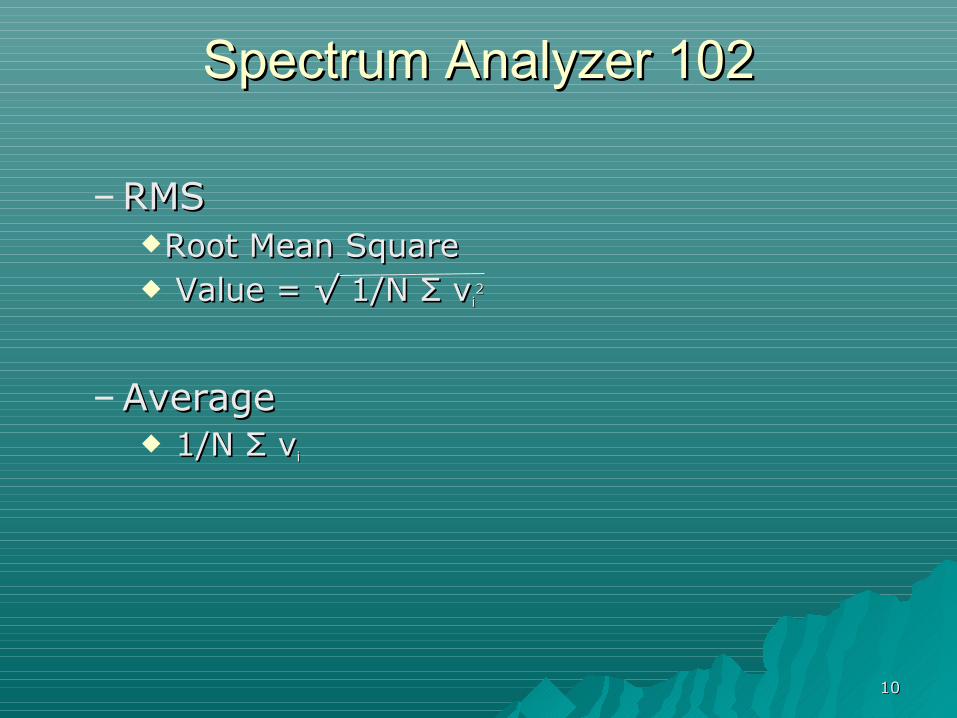
– RMSRMSRoot Mean SquareRoot Mean Square Value = √ 1/N Σ vValue = √ 1/N Σ vii
22
– AverageAverage 1/N Σ v1/N Σ vii
1111
Spectrum Analyzer 102Spectrum Analyzer 102
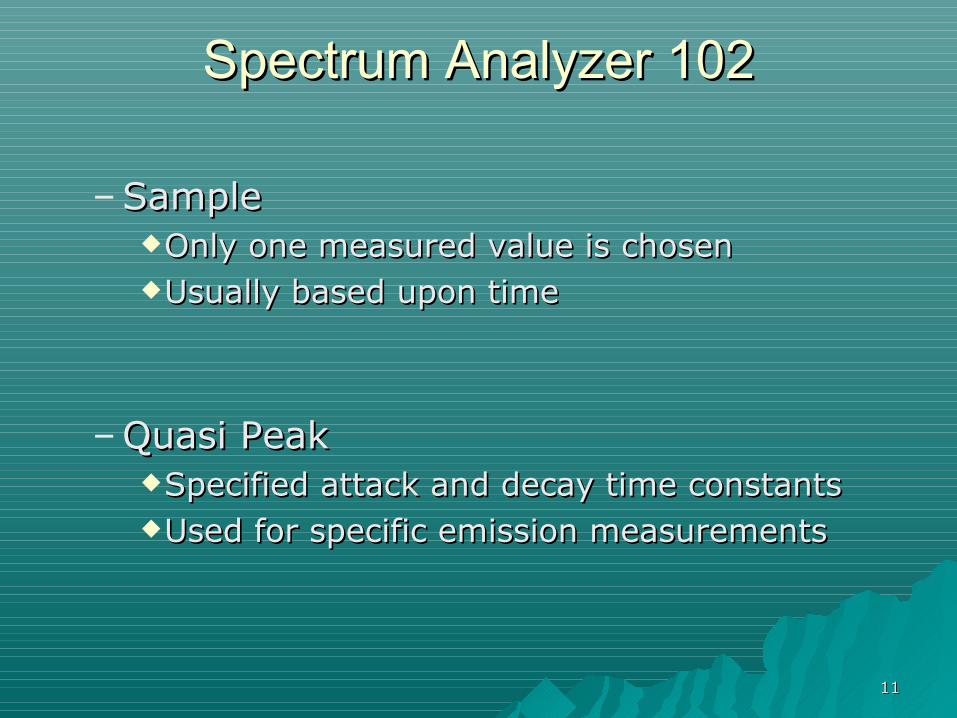
– SampleSampleOnly one measured value is chosenOnly one measured value is chosenUsually based upon timeUsually based upon time
– Quasi PeakQuasi PeakSpecified attack and decay time constantsSpecified attack and decay time constantsUsed for specific emission measurementsUsed for specific emission measurements
1212
Spectrum Analyzer 102Spectrum Analyzer 102
Two types of signalsTwo types of signals
PeriodicPeriodic
Noise-likeNoise-like
1313
Spectrum Analyzer 102Spectrum Analyzer 102
Which detector do I use for the signal Which detector do I use for the signal and what impact is there if I use an and what impact is there if I use an inappropriate one?inappropriate one?
What is the default detector for the What is the default detector for the Spectrum Analyzer?Spectrum Analyzer?
1414
Spectrum Analyzer 102Spectrum Analyzer 102
Which detector do I use for the signal Which detector do I use for the signal and what impact is there if I use an and what impact is there if I use an inappropriate one?inappropriate one?
– What are you trying to measure?What are you trying to measure?
What is the default detector for the What is the default detector for the Spectrum Analyzer?Spectrum Analyzer?
– Depends on the mfgr and the mode of operationDepends on the mfgr and the mode of operation
1515
Spectrum Analyzer 102Spectrum Analyzer 102
Example—SinewaveExample—Sinewave
IF Envelope is measuredIF Envelope is measuredMax peak and min peak will have the same Max peak and min peak will have the same
value at the same time so no error existsvalue at the same time so no error existsAverage Value, Sample, and RMS values should Average Value, Sample, and RMS values should
also be the samealso be the same
1616
Spectrum Analyzer 102Spectrum Analyzer 102
Example—IBOC or DTV signalExample—IBOC or DTV signal
IF Envelope is measuredIF Envelope is measuredDue to randomness of instantaneous voltage Due to randomness of instantaneous voltage
differences between the detectors will result in differences between the detectors will result in different displayed values.different displayed values.
Max peak and min peak will NOT have the same Max peak and min peak will NOT have the same value at the same time difference occursvalue at the same time difference occurs
Average Value, Sample, and RMS values should Average Value, Sample, and RMS values should will also be differentwill also be different
1717
Spectrum Analyzer 102Spectrum Analyzer 102
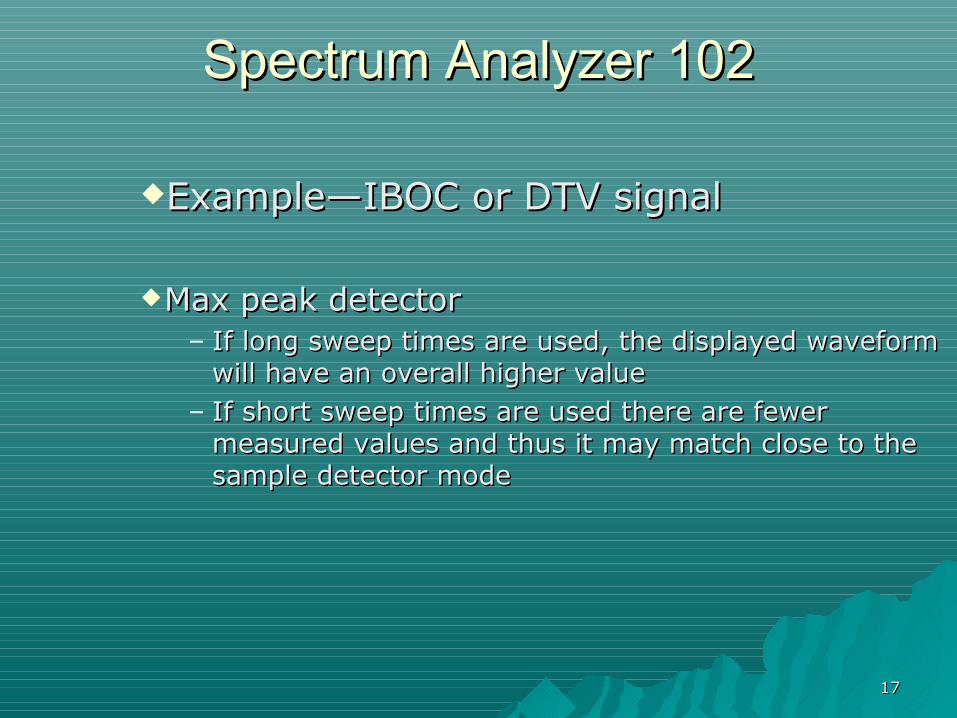
Example—IBOC or DTV signalExample—IBOC or DTV signal
Max peak detectorMax peak detector– If long sweep times are used, the displayed waveform If long sweep times are used, the displayed waveform
will have an overall higher valuewill have an overall higher value– If short sweep times are used there are fewer If short sweep times are used there are fewer
measured values and thus it may match close to the measured values and thus it may match close to the sample detector modesample detector mode
1818
Spectrum Analyzer 102Spectrum Analyzer 102
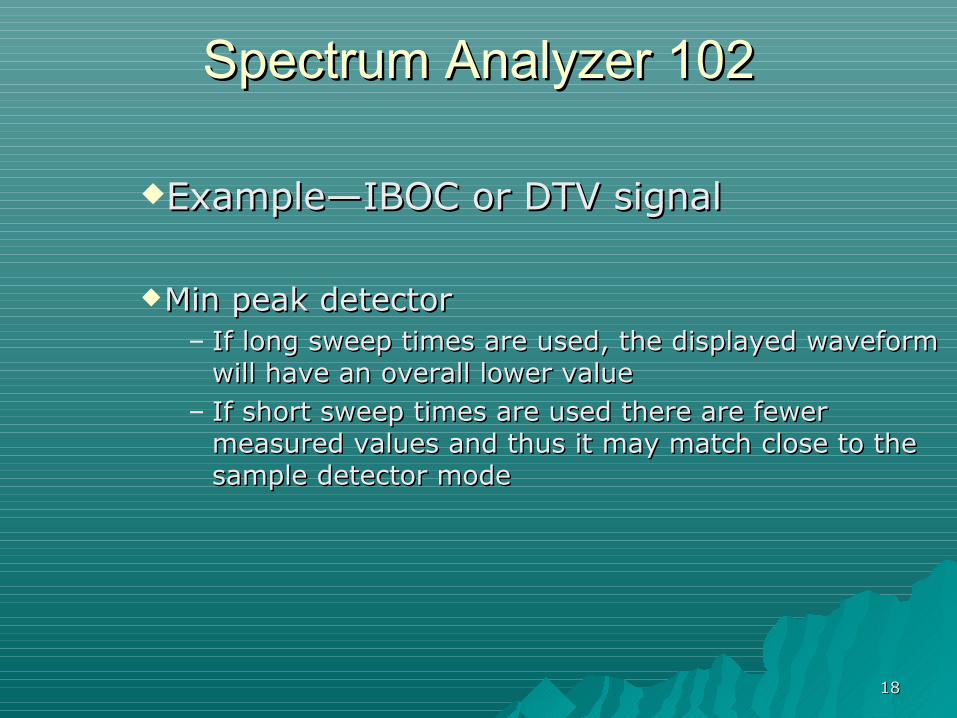
Example—IBOC or DTV signalExample—IBOC or DTV signal
Min peak detectorMin peak detector– If long sweep times are used, the displayed waveform If long sweep times are used, the displayed waveform
will have an overall lower valuewill have an overall lower value– If short sweep times are used there are fewer If short sweep times are used there are fewer
measured values and thus it may match close to the measured values and thus it may match close to the sample detector modesample detector mode
1919
Spectrum Analyzer 102Spectrum Analyzer 102
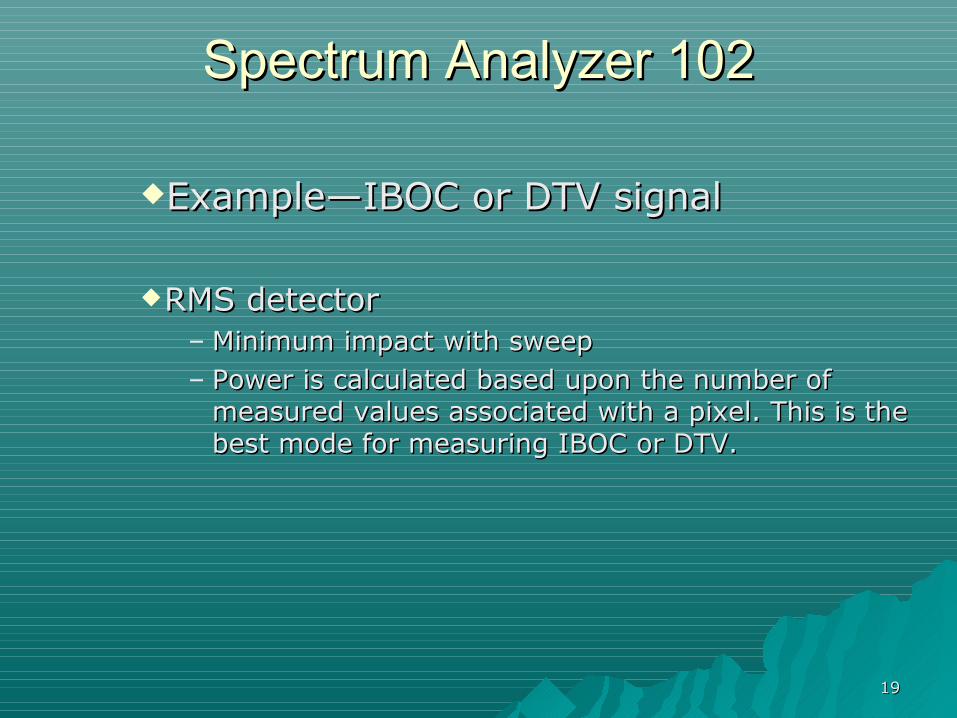
Example—IBOC or DTV signalExample—IBOC or DTV signal
RMS detectorRMS detector– Minimum impact with sweep Minimum impact with sweep – Power is calculated based upon the number of Power is calculated based upon the number of
measured values associated with a pixel. This is the measured values associated with a pixel. This is the best mode for measuring IBOC or DTV. best mode for measuring IBOC or DTV.
2020
Spectrum Analyzer 102Spectrum Analyzer 102
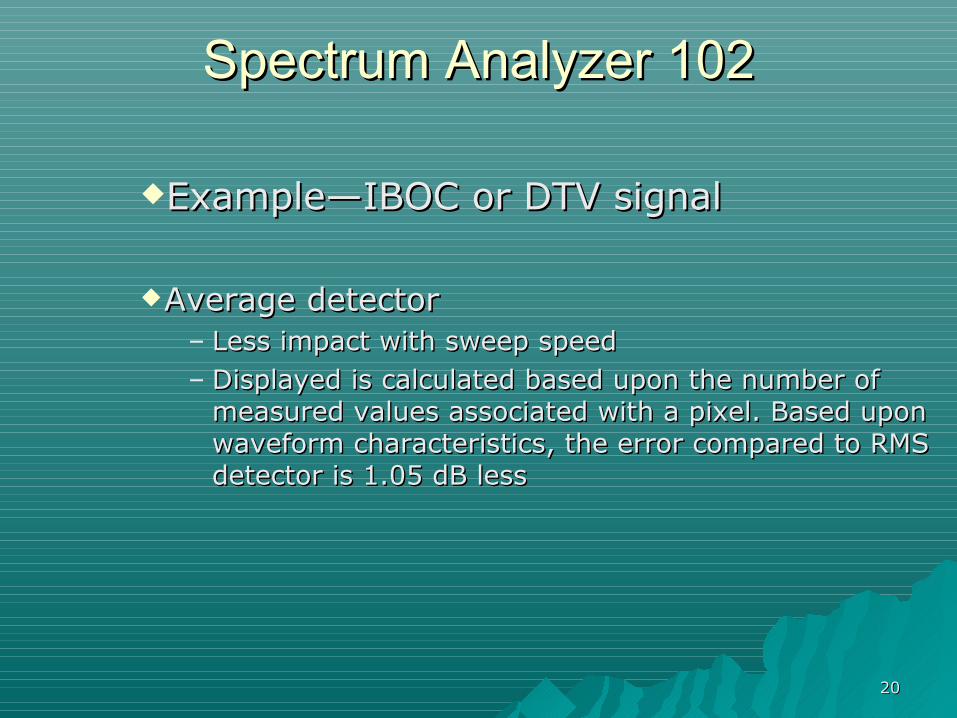
Example—IBOC or DTV signalExample—IBOC or DTV signal
Average detectorAverage detector– Less impact with sweep speedLess impact with sweep speed– Displayed is calculated based upon the number of Displayed is calculated based upon the number of
measured values associated with a pixel. Based upon measured values associated with a pixel. Based upon waveform characteristics, the error compared to RMS waveform characteristics, the error compared to RMS detector is 1.05 dB lessdetector is 1.05 dB less
2121
Spectrum Analyzer 102Spectrum Analyzer 102
Example—IBOC or DTV signalExample—IBOC or DTV signal
Sample detectorSample detector– Vary dependent with sweep speedVary dependent with sweep speed– Displayed is calculated based upon the number of Displayed is calculated based upon the number of
measured values associated with a pixel. Based upon measured values associated with a pixel. Based upon waveform characteristics, the error compared to RMS waveform characteristics, the error compared to RMS detector is 2.5 dB lessdetector is 2.5 dB less
2222
Spectrum Analyzer 102Spectrum Analyzer 102
Impact of video filterImpact of video filter– Video filter reduces the waveform peaks and Video filter reduces the waveform peaks and
smoothens the waveform so less variation no matter smoothens the waveform so less variation no matter what detector is used. If a log amp is used before the what detector is used. If a log amp is used before the envelope detector then there is an additional 1.45 dB envelope detector then there is an additional 1.45 dB of correction to apply compared to sample detector.of correction to apply compared to sample detector.
So if an RMS detector is not available, So if an RMS detector is not available, use the Sample detector and add 2.5 dBuse the Sample detector and add 2.5 dB
2323
Spectrum Analyzer 102Spectrum Analyzer 102
LIVE DEMOLIVE DEMO