Embed Size (px)
Citation preview
684 Volume 51, Number 5, 1997 APPLIED SPECTROSCOPY0003-7028 / 97 / 5105-0684$2.00 / 0q 1997 Society for Applied Spectroscopy
Spectro¯ uorimetric Study of the Inclusion Complex of7-Hydroxymethylnalidixic Acid with g -Cyclodextrin inAqueous Solution
ISABEL DURAÂ N-MERAÂ S,* ARSENIO MUNÄ OZ DE LA PENÄ A,FRANCISCO SALINAS, and ISABEL RODRIÂ GUEZ CAÂ CERESDepartment of Analytical Chemistry, University of Extremadura, 06071 Badajoz, Spain
A ¯ uorimetric study on the spectral character istics and acid-basebehavior of 7-hydroxymethylnalidixic acid has been performed. Thehost± guest complexation process between g -cyclodextrin and 7-hy-droxymethylnalid ixic acid has also been investigated by ¯ uores-cence spectroscopy. Scatchard and Benesi-Hildebr and methodshave been applied to determine the stoichiometry of the complex,and a 1:1 stoichiometric ratio has been established. A K1 5 118 625 M2 1 formation constant has been calculated for the inclusioncomplex, by using the changes produced on the ¯ uorescence of 7-hy-droxymethylnalid ixic acid, when it is included on the hydrophobiccyclodextrin cavity. A ¯ uorimetric method of determination of 7-hy-droxymethylnalid ixic acid, in g -cyclodextrin aqueous solution, hasbeen proposed. The analytical parameters and detection and quan-ti® cation limits of the method have been determined .
Index Headings: 7-Hydroxymethylnalidixic acid; g -Cyclodextrin;Spectro¯ uorimetry.
INTRODUCTION
Nalidixic acidÐ 1-ethyl-1,4-dihydro-7-methyl-4-oxo-1,8-naphthyridine-3-carboxylic acidÐ is a synthetic anti-microbial drug that was ® rst proposed by Lesher et al.1
This compound is extensively used in the treatment ofGram-negative urinary tract infections.2 7-Hydroxyme-thylnalidixic acid (HO-NA) is the major metabolite ofnalidixic acid, in human beings and animals. McChesneyet al.3 found that between 80 and 94% of the total nali-dixic acid excreted is eliminated as 7-hydroxymethylnal-idixic acid, and that the in vitro antibacterial spectrum isvery similar to that of nalidixic acid.
The determination of HO-NA acid usually involvesHPLC methods with UV detection. Sorel et al.4 proposeda chromatographic method for its determination in plas-ma after extraction with CHCl3. Cuisinaud et al.5 deter-mined nalidixic acid and its two major metabolites,HO-NA and propylnalidixate, in human plasma and inurine by HPLC. Shargel et al.6 proposed an HPLC meth-od, using an ion-exchange column and UV detection, forthe determination of nalidixic acid and HO-NA in plas-ma. Van Oort et al.7 proposed a differential pulse polar-ographic method for the determination of nalidixic acidand HO-NA in urine.
Cyclodextrins (CDs) are toroidal-shaped oligomers ofa -D-glucose. The hexamer, heptamer, and octamer formsare referred to as a -, b -, and g -CDs. The structure of thecyclodextrins is that of a truncated cone with averagecavity diameters of 0.57, 0.78, and 0.95 nm for a -, b -
Received 30 May 1996; accepted 4 October 1996.* Author to whom correspondence should be sent.
and g -CD, respectively. The main interest in these com-pounds rises primarily from their ability to include, intheir empty cavities, organic, hydrophobic moleculesfrom aqueous media. Solute molecules capables of form-ing inclusion complexes must have a size compatiblewith the dimensions of the cavity.
The extent of complex formation, quanti® ed by theassociation constant, depends somewhat on the polarityof both the host and guest molecules. However, geometricrather than chemical factors are decisive in determiningthe type of guest molecules penetrating into the cyclo-dextrin cavity.8
In luminescence studies, CDs have been employed toenhance ¯ uorescence emission of different lumino-phors9± 13 and to induce room-temperature phosphores-cence under appropriate conditions.14± 18
As the complexation process implies an interactionproducing a protection of the included species, the CDshave been also used in the pharmaceutical industry toencapsulate drugs that are photosensitive.19± 23
In spite of its relatively low solubility in water, b -CDhas been widely used for analytical purposes because ofits remarkable property of forming inclusion complexeswith a variety of small molecules. Although g -CD is ableto include larger molecules because of its larger cavitysize, and has the advantage over b -CD of its higher watersolubility, it has not been used as frequently.
Previously, we have studied the complexes formed be-tween nalidixic acid and cyclodextrins.24 It was conclud-ed that an inclusion complex was not formed betweennalidixic acid and b -CD, probably because the nalidixicacid molecule is too large to enter the b -CD cavity, orbecause of steric hindrance. However, an inclusion com-plex was formed between nalidixic acid and g -CD.
In this paper, the luminescent characteristics of HO-NA(Scheme I), and of its inclusion complex with g -CD, havebeen investigated, with the object of characterizing theinclusion process involved and proposing a ¯ uorimetricmethod for the determination of this compound.
SCHEME I. Luminescent characteristics of HO-NA.
EXPERIMENTAL
Apparatus. Fluorescence measurements were made ona Perkin± Elmer Model LS50B luminescence spectrome-
APPLIED SPECTROSCOPY 685
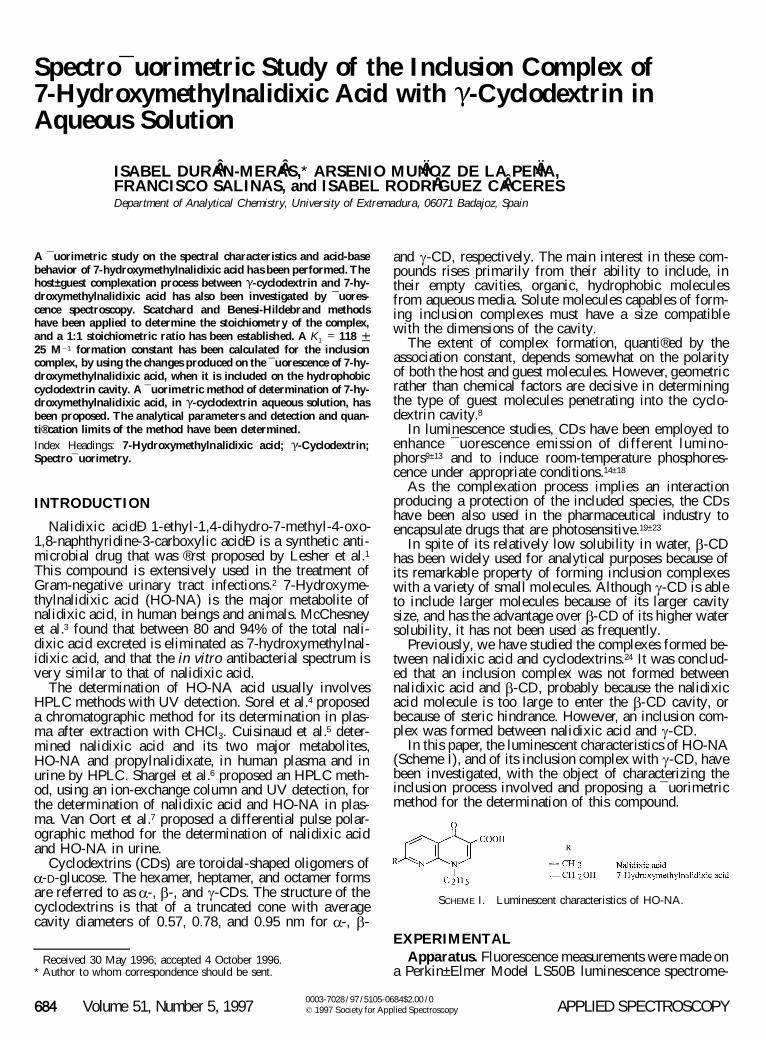
FIG. 1. Excitation (left) and emission (right) spectra of HO-NA inaqueous media.
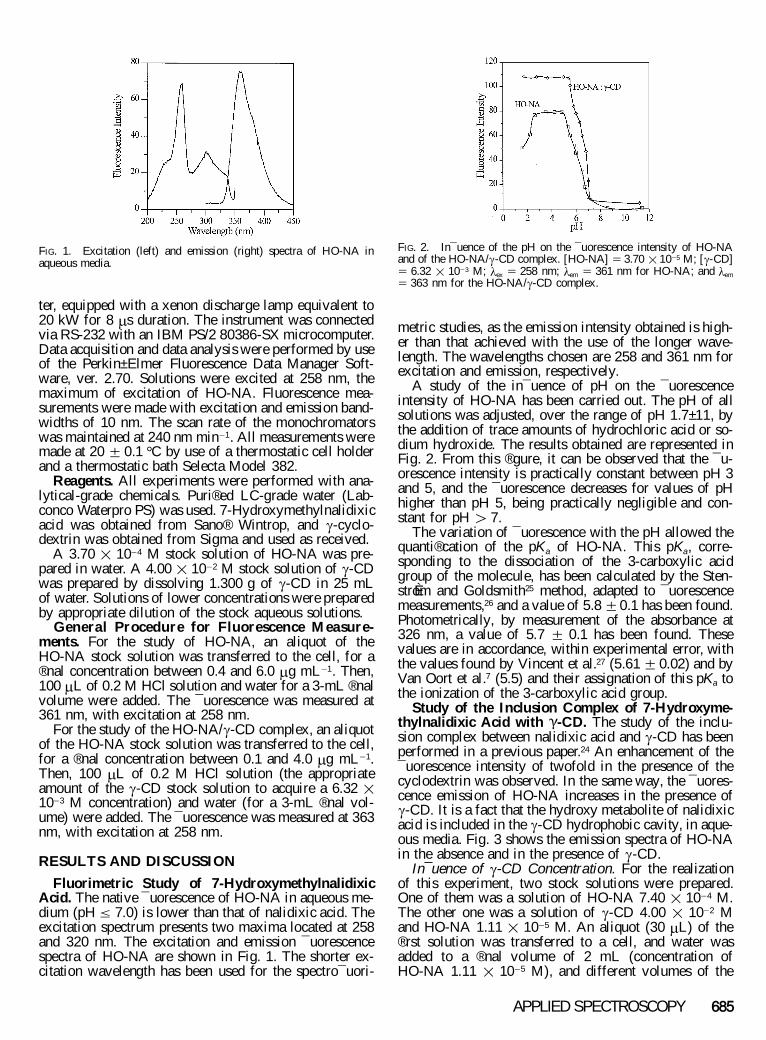
FIG. 2. In¯ uence of the pH on the ¯ uorescence intensity of HO-NAand of the HO-NA/ g -CD complex. [HO-NA] 5 3.70 3 10 2 5 M; [ g -CD]5 6.32 3 102 3 M; l ex 5 258 nm; l em 5 361 nm for HO-NA; and l em
5 363 nm for the HO-NA/ g -CD complex.
ter, equipped with a xenon discharge lamp equivalent to20 kW for 8 m s duration. The instrument was connectedvia RS-232 with an IBM PS/2 80386-SX microcomputer.Data acquisition and data analysis were performed by useof the Perkin± Elmer Fluorescence Data Manager Soft-ware, ver. 2.70. Solutions were excited at 258 nm, themaximum of excitation of HO-NA. Fluorescence mea-surements were made with excitation and emission band-widths of 10 nm. The scan rate of the monochromatorswas maintained at 240 nm min2 1. All measurements weremade at 20 6 0.1 8 C by use of a thermostatic cell holderand a thermostatic bath Selecta Model 382.
Reagents. All experiments were performed with ana-lytical-grade chemicals. Puri® ed LC-grade water (Lab-conco Waterpro PS) was used. 7-Hydroxymethylnalidixicacid was obtained from Sano® Wintrop, and g -cyclo-dextrin was obtained from Sigma and used as received.
A 3.70 3 102 4 M stock solution of HO-NA was pre-pared in water. A 4.00 3 10 2 2 M stock solution of g -CDwas prepared by dissolving 1.300 g of g -CD in 25 mLof water. Solutions of lower concentrations were preparedby appropriate dilution of the stock aqueous solutions.
General Procedure for Fluorescence Measure-ments. For the study of HO-NA, an aliquot of theHO-NA stock solution was transferred to the cell, for a® nal concentration between 0.4 and 6.0 m g mL2 1. Then,100 m L of 0.2 M HCl solution and water for a 3-mL ® nalvolume were added. The ¯ uorescence was measured at361 nm, with excitation at 258 nm.
For the study of the HO-NA/ g -CD complex, an aliquotof the HO-NA stock solution was transferred to the cell,for a ® nal concentration between 0.1 and 4.0 m g mL2 1.Then, 100 m L of 0.2 M HCl solution (the appropriateamount of the g -CD stock solution to acquire a 6.32 3102 3 M concentration) and water (for a 3-mL ® nal vol-ume) were added. The ¯ uorescence was measured at 363nm, with excitation at 258 nm.
RESULTS AND DISCUSSION
Fluorimetric Study of 7-HydroxymethylnalidixicAcid. The native ¯ uorescence of HO-NA in aqueous me-dium (pH # 7.0) is lower than that of nalidixic acid. Theexcitation spectrum presents two maxima located at 258and 320 nm. The excitation and emission ¯ uorescencespectra of HO-NA are shown in Fig. 1. The shorter ex-citation wavelength has been used for the spectro¯ uori-
metric studies, as the emission intensity obtained is high-er than that achieved with the use of the longer wave-length. The wavelengths chosen are 258 and 361 nm forexcitation and emission, respectively.
A study of the in¯ uence of pH on the ¯ uorescenceintensity of HO-NA has been carried out. The pH of allsolutions was adjusted, over the range of pH 1.7± 11, bythe addition of trace amounts of hydrochloric acid or so-dium hydroxide. The results obtained are represented inFig. 2. From this ® gure, it can be observed that the ¯ u-orescence intensity is practically constant between pH 3and 5, and the ¯ uorescence decreases for values of pHhigher than pH 5, being practically negligible and con-stant for pH . 7.
The variation of ¯ uorescence with the pH allowed thequanti® cation of the pKa of HO-NA. This pKa, corre-sponding to the dissociation of the 3-carboxylic acidgroup of the molecule, has been calculated by the Sten-stroÈ m and Goldsmith25 method, adapted to ¯ uorescencemeasurements,26 and a value of 5.8 6 0.1 has been found.Photometrically, by measurement of the absorbance at326 nm, a value of 5.7 6 0.1 has been found. Thesevalues are in accordance, within experimental error, withthe values found by Vincent et al.27 (5.61 6 0.02) and byVan Oort et al.7 (5.5) and their assignation of this pKa tothe ionization of the 3-carboxylic acid group.
Study of the Inclusion Complex of 7-Hydroxyme-thylnalidixic Acid with g -CD. The study of the inclu-sion complex between nalidixic acid and g -CD has beenperformed in a previous paper.24 An enhancement of the¯ uorescence intensity of twofold in the presence of thecyclodextrin was observed. In the same way, the ¯ uores-cence emission of HO-NA increases in the presence ofg -CD. It is a fact that the hydroxy metabolite of nalidixicacid is included in the g -CD hydrophobic cavity, in aque-ous media. Fig. 3 shows the emission spectra of HO-NAin the absence and in the presence of g -CD.
In¯ uence of g -CD Concentration. For the realizationof this experiment, two stock solutions were prepared.One of them was a solution of HO-NA 7.40 3 10 2 4 M.The other one was a solution of g -CD 4.00 3 102 2 Mand HO-NA 1.11 3 10 2 5 M. An aliquot (30 m L) of the® rst solution was transferred to a cell, and water wasadded to a ® nal volume of 2 mL (concentration ofHO-NA 1.11 3 102 5 M), and different volumes of the
686 Volume 51, Number 5, 1997
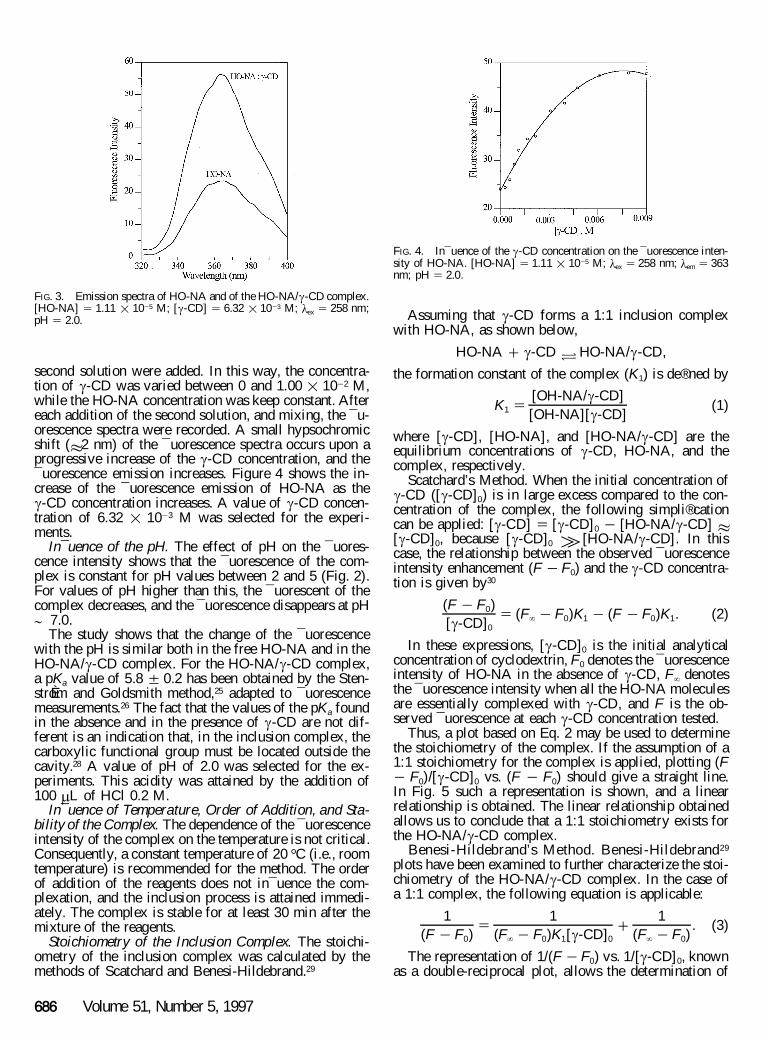
FIG. 3. Emission spectra of HO-NA and of the HO-NA/ g -CDcomplex.[HO-NA] 5 1.11 3 102 5 M; [ g -CD] 5 6.32 3 10 2 3 M; l ex 5 258 nm;pH 5 2.0.
FIG. 4. In¯ uence of the g -CD concentration on the ¯ uorescence inten-sity of HO-NA. [HO-NA] 5 1.11 3 102 5 M; l ex 5 258 nm; l em 5 363nm; pH 5 2.0.
second solution were added. In this way, the concentra-tion of g -CD was varied between 0 and 1.00 3 10 2 2 M,while the HO-NA concentration was keep constant. Aftereach addition of the second solution, and mixing, the ¯ u-orescence spectra were recorded. A small hypsochromicshift ( ø 2 nm) of the ¯ uorescence spectra occurs upon aprogressive increase of the g -CD concentration, and the¯ uorescence emission increases. Figure 4 shows the in-crease of the ¯ uorescence emission of HO-NA as theg -CD concentration increases. A value of g -CD concen-tration of 6.32 3 10 2 3 M was selected for the experi-ments.
In¯ uence of the pH. The effect of pH on the ¯ uores-cence intensity shows that the ¯ uorescence of the com-plex is constant for pH values between 2 and 5 (Fig. 2).For values of pH higher than this, the ¯ uorescent of thecomplex decreases, and the ¯ uorescence disappears at pH; 7.0.
The study shows that the change of the ¯ uorescencewith the pH is similar both in the free HO-NA and in theHO-NA/g -CD complex. For the HO-NA/ g -CD complex,a pKa value of 5.8 6 0.2 has been obtained by the Sten-stroÈ m and Goldsmith method,25 adapted to ¯ uorescencemeasurements.26 The fact that the values of the pKa foundin the absence and in the presence of g -CD are not dif-ferent is an indication that, in the inclusion complex, thecarboxylic functional group must be located outside thecavity.28 A value of pH of 2.0 was selected for the ex-periments. This acidity was attained by the addition of100 m L of HCl 0.2 M.
In¯ uence of Temperature, Order of Addition, and Sta-bility of the Complex. The dependence of the ¯ uorescenceintensity of the complex on the temperature is not critical.Consequently, a constant temperature of 20 8 C (i.e., roomtemperature) is recommended for the method. The orderof addition of the reagents does not in¯ uence the com-plexation, and the inclusion process is attained immedi-ately. The complex is stable for at least 30 min after themixture of the reagents.
Stoichiometry of the Inclusion Complex. The stoichi-ometry of the inclusion complex was calculated by themethods of Scatchard and Benesi-Hildebrand.29
Assuming that g -CD forms a 1:1 inclusion complexwith HO-NA, as shown below,
HO-NA 1 g -CD j HO-NA/g -CD,
the formation constant of the complex (K1) is de® ned by
[OH-NA/g -CD]K 5 (1)1 [OH-NA][ g -CD]
where [ g -CD], [HO-NA], and [HO-NA/g -CD] are theequilibrium concentrations of g -CD, HO-NA, and thecomplex, respectively.
Scatchard’s Method. When the initial concentration ofg -CD ([ g -CD]0) is in large excess compared to the con-centration of the complex, the following simpli® cationcan be applied: [ g -CD] 5 [ g -CD]0 2 [HO-NA/ g -CD] ø[ g -CD]0, because [ g -CD]0 & [HO-NA/g -CD]. In thiscase, the relationship between the observed ¯ uorescenceintensity enhancement (F 2 F0) and the g -CD concentra-tion is given by30
(F 2 F )0 5 (F 2 F )K 2 (F 2 F )K . (2)` 0 1 0 1[ g -CD]0
In these expressions, [ g -CD]0 is the initial analyticalconcentration of cyclodextrin, F0 denotes the ¯ uorescenceintensity of HO-NA in the absence of g -CD, F ` denotesthe ¯ uorescence intensity when all the HO-NA moleculesare essentially complexed with g -CD, and F is the ob-served ¯ uorescence at each g -CD concentration tested.
Thus, a plot based on Eq. 2 may be used to determinethe stoichiometry of the complex. If the assumption of a1:1 stoichiometry for the complex is applied, plotting (F2 F0)/[ g -CD]0 vs. (F 2 F0) should give a straight line.In Fig. 5 such a representation is shown, and a linearrelationship is obtained. The linear relationship obtainedallows us to conclude that a 1:1 stoichiometry exists forthe HO-NA/ g -CD complex.
Benesi-Hildebrand’s Method. Benesi-Hildebrand29
plots have been examined to further characterize the stoi-chiometry of the HO-NA/ g -CD complex. In the case ofa 1:1 complex, the following equation is applicable:
1 1 15 1 . (3)
(F 2 F ) (F 2 F )K [ g -CD] (F 2 F )0 ` 0 1 0 ` 0
The representation of 1/(F 2 F0) vs. 1/[ g -CD]0, knownas a double-reciprocal plot, allows the determination of
APPLIED SPECTROSCOPY 687
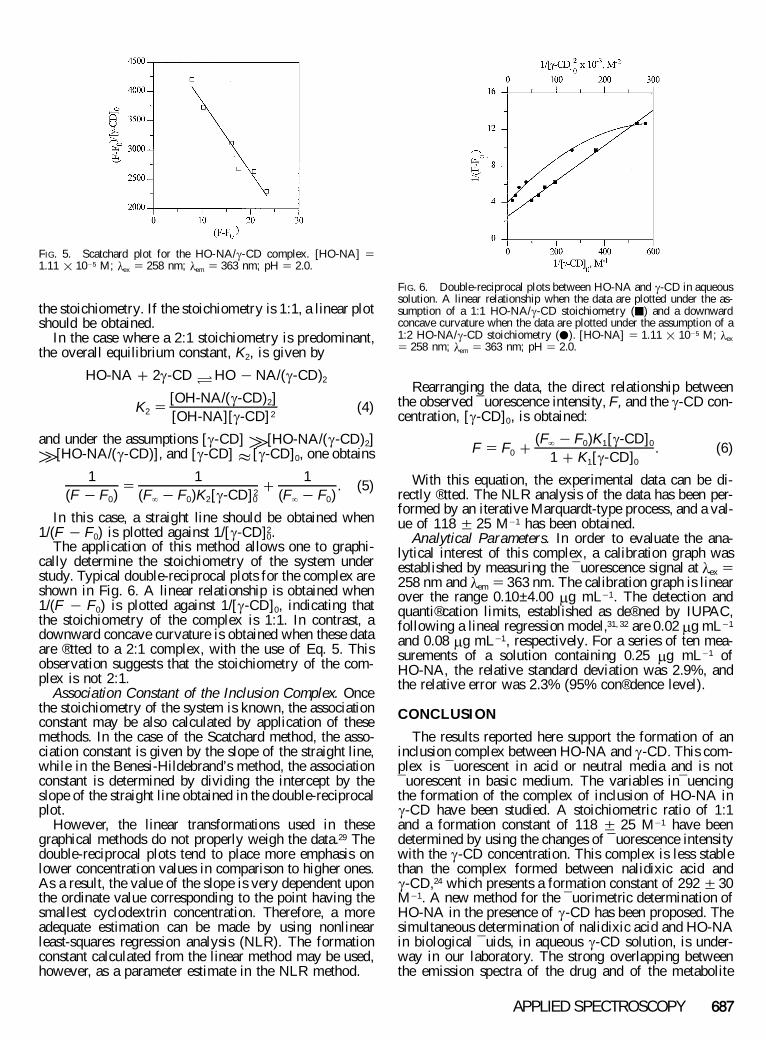
FIG. 5. Scatchard plot for the HO-NA/ g -CD complex. [HO-NA] 51.11 3 102 5 M; l ex 5 258 nm; l em 5 363 nm; pH 5 2.0.
FIG. 6. Double-reciprocal plots between HO-NA and g -CD in aqueoussolution. A linear relationship when the data are plotted under the as-sumption of a 1:1 HO-NA/ g -CD stoichiometry (m) and a downwardconcave curvature when the data are plotted under the assumption of a1:2 HO-NA/ g -CD stoichiometry (v). [HO-NA] 5 1.11 3 102 5 M; l ex
5 258 nm; l em 5 363 nm; pH 5 2.0.
the stoichiometry. If the stoichiometry is 1:1, a linear plotshould be obtained.
In the case where a 2:1 stoichiometry is predominant,the overall equilibrium constant, K2, is given by
HO-NA 1 2g -CD j HO 2 NA/(g -CD)2
[OH-NA/( g -CD) ]2K 5 (4)2 2[OH-NA][ g -CD]
and under the assumptions [ g -CD] &[HO-NA/( g -CD)2]
&[HO-NA/( g -CD)], and [ g -CD] ø [ g -CD]0, one obtains
1 1 15 1 . (5)
2(F 2 F ) (F 2 F )K [ g -CD] (F 2 F )0 ` 0 2 0 ` 0
In this case, a straight line should be obtained when1/(F 2 F0) is plotted against 1/[ g -CD] .2
0
The application of this method allows one to graphi-cally determine the stoichiometry of the system understudy. Typical double-reciprocal plots for the complex areshown in Fig. 6. A linear relationship is obtained when1/(F 2 F0) is plotted against 1/[ g -CD]0, indicating thatthe stoichiometry of the complex is 1:1. In contrast, adownward concave curvature is obtained when these dataare ® tted to a 2:1 complex, with the use of Eq. 5. Thisobservation suggests that the stoichiometry of the com-plex is not 2:1.
Association Constant of the Inclusion Complex. Oncethe stoichiometry of the system is known, the associationconstant may be also calculated by application of thesemethods. In the case of the Scatchard method, the asso-ciation constant is given by the slope of the straight line,while in the Benesi-Hildebrand’s method, the associationconstant is determined by dividing the intercept by theslope of the straight line obtained in the double-reciprocalplot.
However, the linear transformations used in thesegraphical methods do not properly weigh the data.29 Thedouble-reciprocal plots tend to place more emphasis onlower concentration values in comparison to higher ones.As a result, the value of the slope is very dependent uponthe ordinate value corresponding to the point having thesmallest cyclodextrin concentration. Therefore, a moreadequate estimation can be made by using nonlinearleast-squares regression analysis (NLR). The formationconstant calculated from the linear method may be used,however, as a parameter estimate in the NLR method.
Rearranging the data, the direct relationship betweenthe observed ¯ uorescence intensity, F, and the g -CD con-centration, [ g -CD]0, is obtained:
(F 2 F )K [ g -CD]` 0 1 0F 5 F 1 . (6)0 1 1 K [ g -CD]1 0
With this equation, the experimental data can be di-rectly ® tted. The NLR analysis of the data has been per-formed by an iterative Marquardt-type process, and a val-ue of 118 6 25 M2 1 has been obtained.
Analytical Parameters. In order to evaluate the ana-lytical interest of this complex, a calibration graph wasestablished by measuring the ¯ uorescence signal at l ex 5258 nm and l em 5 363 nm. The calibration graph is linearover the range 0.10± 4.00 m g mL2 1. The detection andquanti® cation limits, established as de® ned by IUPAC,following a lineal regression model,31, 32 are 0.02 m g mL2 1
and 0.08 m g mL2 1, respectively. For a series of ten mea-surements of a solution containing 0.25 m g mL2 1 ofHO-NA, the relative standard deviation was 2.9%, andthe relative error was 2.3% (95% con® dence level).
CONCLUSION
The results reported here support the formation of aninclusion complex between HO-NA and g -CD. This com-plex is ¯ uorescent in acid or neutral media and is not¯ uorescent in basic medium. The variables in¯ uencingthe formation of the complex of inclusion of HO-NA ing -CD have been studied. A stoichiometric ratio of 1:1and a formation constant of 118 6 25 M2 1 have beendetermined by using the changes of ¯ uorescence intensitywith the g -CD concentration. This complex is less stablethan the complex formed between nalidixic acid andg -CD,24 which presents a formation constant of 292 6 30M2 1. A new method for the ¯ uorimetric determination ofHO-NA in the presence of g -CD has been proposed. Thesimultaneous determination of nalidixic acid and HO-NAin biological ¯ uids, in aqueous g -CD solution, is under-way in our laboratory. The strong overlapping betweenthe emission spectra of the drug and of the metabolite
688 Volume 51, Number 5, 1997
will be resolved by the use of partial least-squares mul-tivariate calibration.33
ACKNOWLEDGMENTS
The authors acknowledge the DGICYT of the Ministry of Educationand Science of Spain (Project PB95-1141A), and the Consejerõ a deEducacio n y Juventud de la Comunidad de Extremadura (Project EIA-9536), for ® nancial support of this work. Sano® Wintrop (Barcelona) isalso acknowledged for providing the 7-hydroxymethylnalidixic acidused in this study.
1. G. Y. Lesher, E. J. Froelich, M. D. Gruett, and J. H. Bailey, J. Med.Pharm. Chem. 5, 1063 (1962).
2. R. Gleckman, S. Alvarez, D. W. Joubert, and S. J. Matthews, Am.J. Hosp. Pharm. 36, 1071 (1979).
3. E. W. Mc Chesney, E. J. Froelich, G. Y. Lesher, A. V. R. Craim,and D. Rossi, Toxicol. Appl. Pharmacol. 6, 292 (1964).
4. R. H. A. Sorel, A. Hulshoff, and C. Snelleman, J. Chromatogr. 221,129 (1980).
5. G. Cuisinaud, N. Ferry, M. Seccia, N. Bernard, and J. Sassard, J.Chromatogr. 181, 399 (1980).
6. L. Shargel, R. F. Koss, A. V. R. Crain, and V. J. Boyle, J. Pharm.Sci. 62, 1452 (1973).
7. W. J. Van Oort, R. H. A. Sorel, D. Brussee, S. G. Schulman, P.Zuman, and J. Den Hartigh, Anal. Chim. Acta 149, 175 (1983).
8. J. Szejtli. Cyclodextrins and Their Inclusion Complexes (AkademiaiKiado, Budapest, 1982).
9. J. C. Ma rquez, M. Hernandez, and F. Garcõ a Sa nchez, Analyst 115,1003 (1990).
10. D. A. Lerner, B. Del Castillo, and S. MunÄ oz Botella, Anal. Chim.Acta 227, 297 (1989).
11. O. Jules, S. Scypinski, and L. J. Cline Love Anal Chim. Acta 169,355 (1985).
12. W. Baeyens, B. Lin, and V. Coroisier, Analyst 115, 359 (1990).
13. W. Baeyens, B. Lin, V. Corbisier, and A. Raemdonck, Anal. Chim.Acta 234, 187 (1990).
14. S. Scypinski and L. J. Cline Love, Anal. Chem. 56, 322 (1984).15. S. Scypinski and L. J. Cline Love, Anal. Chem. 56, 331 (1984).16. H. J. Casal, J. C. Netto-Ferreira, and J. C. Scaiano, J. Incl. Phenom.
3, 395 (1985).17. S. Hamai, J. Am. Chem. Soc. 111, 3954 (1989).18. A. MunÄ oz de la PenÄ a, I. Dura n Mera s, F. Salinas, T. T. Ndou, and
I. M. Warner, Anal. Chim. Acta 255, 351 (1991).19. J. Szejtli, Pharm. Technol. 3, 15 (1991).20. J. Szejtli, Cyclodextrin Technology (Kluwer Academic Publishers,
Dordrecht/Boston/London, 1988).21. D. Duchene, Cyclodextrins and Their Industrial Uses (Editions de
Sante , Paris, 1987).22. A. MunÄ oz de la PenÄ a, F. Salinas, I. Dura n Mera s, and M. D. Mo-
reno, Anal. Lett. 27, 1893 (1994).23. M. Maa® , B. Laassis, J. J. Aaron, M. C. Mahedero, A. MunÄ oz de
la PenÄ a, and F. Salinas, J. Incl. Phenom. Mol. Recog. Chem. 22,235 (1995).
24. I. Dura n Mera s, A. MunÄ oz de la PenÄ a, F. Salinas, and I. RodriguezCa ceres, Analyst 119, 1215 (1994).
25. W. StenstroÈ m and N. Goldsmith, J. Phys. Chem. 30, 1638 (1926).26. J. W. Bridges, D. S. Davies, and R. T. Williams, Biochem. J. 98,
451 (1966).27. W. R. Vincent, S. G. Schulman, J. M. Midgley, W. J. van Oort, and
R. H. A. Sorel, Int. J. Pharm. 9, 191 (1981).28. A. MunÄ oz de la PenÄ a, F. Salinas, M. J. Go mez, M. I. Acedo, and
M. Sanchez PenÄ a, J. Incl. Phenom. Mol. Recog. Chem. 15, 131(1993).
29. K. A. Connors, Binding Constants: A Measurement of MolecularComplex Stability (John Wiley and Sons, New York, 1987).
30. V. K. Smith, T. T. Ndou, A. MunÄ oz de la PenÄ a, and I. M. Warner,J. Incl. Phenom. Mol. Recog. Chem. 10, 471 (1991).
31. G. L. Long and J. D. Winefordner, Anal. Chem. 55, 713A (1983).32. L. Cuadros Rodriguez, A. M. Garcõ a CampanÄ a, C. Jime nez Linares,
and M. Roma n Ceba, Anal. Lett. 26, 1243 (1993).33. I. Dura n Mera s, A. MunÄ oz de la PenÄ a, F. Salinas, and I. Rodrõ guez
Ca ceres, IV Jornadas Andaluzas sobre Avances en Ana lisis Quõ m-ico, Communication: P-3, Co rdoba, Spain (1994).