Embed Size (px)
Citation preview

Approved for public release; distribution is unlimited.
ERD
C T
R-0
4-3
Investigation of Cyclodextrin-Enhanced Electrokinetic Soil Remediation Fate and Transport of Nitroaromatic Contaminants and Cyclodextrin Amendments in Expansive Clays David Kessler, Charles P. Marsh, John J. McCormick, Donald M. Cropek, Angelo R. Deguzman, Ruben Robles, and David Gent
September 2004
Eng
inee
r R
esea
rch
and
Dev
elop
men
t C
ente
r
75
80
85
90
95
100
0 2 4 6 8 10 12 1
Treatment Time (days)
Perc
ent N
B R
emov
ed
4
High Concentration Low Concentration

Environmental Research – Corps of Engineers ERDC TR-04-3September 2004
Investigation of Cyclodextrin-Enhanced Electrokinetic Soil Remediation Fate and Transport of Nitroaromatic Contaminants and Cyclodextrin Amendments in Expansive Clays David Kessler, Charles P. Marsh, John J. McCormick, Donald M. Cropek, Angelo R. Deguzman, Ruben Robles, and David Gent Engineer Research and Development Center Construction Engineering Research Laboratory PO Box 9005 Champaign, IL 61826-9005
Final Report Approved for public release; distribution is unlimited.
Prepared for U.S. Army Corps of Engineers Washington, DC 20314-1000
Under Work Unit CFM-J002

ii ERDC TR-04-3
ABSTRACT: Nitroaromatic-based compounds can pose a serious threat to ecosystems and human health. These compounds, which have been used in munitions and pesticides, are present in soil and groundwater at military installations and other sites. The presence of these contaminants in clayey soils poses a difficult and potentially costly remediation problem. The low hydraulic conductivity of these soils prohibits the use of conventional pump-and-treat remediation techniques, and high en-ergy costs make the process of excavating and thermally treating the soil highly inefficient and dam-aging to the environment. For these reasons, much research has been done to advance the field of electrokinetic remediation as a viable cleanup technique. Although some studies have reported that organic molecules can be removed from clayey soils by electro-osmosis alone using a purging solu-tion, the addition of amendments to the solution has increased removal efficiencies.
The objective of this research was to advance the state of knowledge on a novel technique for cost-effective remediation of nitroaromatic compounds using cyclodextrin molecules as solubilizing agents and electrokinetically transports them through the contaminated zone. The results provided direct evidence that it is possible to remove nitrobenzene and 2,4-DNT from expansive montmorillonite clay using electro-osmosis both with and without cyclodextrin amendments.
DISCLAIMER: The contents of this report are not to be used for advertising, publication, or promotional pur-poses. Citation of trade names does not constitute an official endorsement or approval of the use of such commer-cial products. All product names and trademarks cited are the property of their respective owners. The findings of this report are not to be construed as an official Department of the Army position unless so designated by other authorized documents. DESTROY THIS REPORT WHEN NO LONGER NEEDED. DO NOT RETURN IT TO THE ORIGINATOR.

ERDC TR-04-3 iii
Contents List of Figures and Tables .............................................................................................................. iv
Conversion Factors......................................................................................................................... vi
Preface.............................................................................................................................................. vii
1 Introduction ................................................................................................................................ 1 Background......................................................................................................................... 1 Objective............................................................................................................................. 3 Approach ............................................................................................................................ 3 Mode of Technology Transfer ............................................................................................. 4
2 Technical Foundations.............................................................................................................. 5 Review of Electrokinetic Theory ......................................................................................... 5
Double Layer Theory ..................................................................................................................... 5 Electro-Osmotic Flow .................................................................................................................... 5
Cyclodextrin Chemistry....................................................................................................... 8 Clay Physics ....................................................................................................................... 9
Clay-Contaminant Interaction Processes....................................................................................... 9 Implications of Crystalline Structure............................................................................................. 10
3 Experimental Procedure .........................................................................................................12 Electro-Osmotic Test Cells and Expanded Procedure...................................................... 12 Sample Analysis ............................................................................................................... 14 Soil Contamination............................................................................................................ 15 Electrostatic Degradation.................................................................................................. 15 X-Ray Diffraction............................................................................................................... 16
4 Results.......................................................................................................................................18 Electrokinetic Transport .................................................................................................... 18 Degradation of CDs and Contaminants............................................................................ 34 X-Ray Diffraction Patterns of Clay-CD Mixtures............................................................... 37
5 Conclusions and Recommendations ...................................................................................40 Conclusions ...................................................................................................................... 40 Recommendations............................................................................................................ 42
References.......................................................................................................................................43

iv ERDC TR-04-3
List of Figures and Tables Figures
Figure 1. Map of predominant clay types throughout the United States. ......................... 2 Figure 2. Chemical structures of the native cyclodextrin molecules. ............................... 8 Figure 3. Engineering drawings of test cells................................................................... 13 Figure 4. Photograph of test cells during operation........................................................ 13 Figure 5. Dependence of electro-osmotic transport on initial solution conductivity........ 18 Figure 6. Current as a function of time across six identical kaolinite samples. .............. 19 Figure 7. Clay sample potential and EO flow. ................................................................ 20 Figure 8. Concentration of β-cd present in cathode chamber as a function of time....... 21 Figure 9. Molar fraction of nitrobenzene solubilized by several different uncharged
cyclodextrins.............................................................................................................. 22 Figure 10. Concentration of α-CD and nitrobenzene in cathode chamber over time
for complex transport experiment (a) and raw data and ratio of ppm α-CD to ppm nitrobenzene (b). ............................................................................................... 23
Figure 11. Accumulated concentration of nitrobenzene, aniline, and α-CD in cathode chamber over time (a); accumulated concentration of nitrobenzene and aniline in cathode chamber over time without α-CD added (b); and concentration of nitrobenzene transported to cathode between sampling times without α-CD added (c). ............................................................................................ 25
Figure 12. Time profiles of concentration of nitrobenzene in the cathode chambers (a) and the anode chambers (b) of two identical experimental cells with added amino β-CD. .............................................................................................................. 28
Figure 13. Time profiles of concentration of 2,4-DNT in the cathode chambers (a) and the anode chambers (b)of two identical experimental cells with added amino β-CD. .............................................................................................................. 29
Figure 14. Concentration of nitrobenzene (a) and 2,4-DNT (b) in the anode and cathode chambers of representative montmorillonite test cells, with electrode chamber solution replaced after each sample without added CD. ........................... 31
Figure 15. Concentration of 2,4-DNT in the anode and cathode chambers of a representative kaolinite test cell with electrode chamber solution replaced after each sample. ............................................................................................................. 32
Figure 16. Average percentage of nitrobenzene removed from montmorillonite by electro-osmosis for several different treatment times (a) and average percentage of nitrobenzene removed from montmorillonite in batch experiments (b). ........................................................................................................ 33

ERDC TR-04-3 v
Figure 17. Fraction of CD remaining over time in batch degradation experiments for β-CD under two different current densities (a) and α- and β-CDs under equal current densities (b)......................................................................................... 35
Figure 18. Concentration of amino β-CD remaining in batch degradation experiment over time................................................................................................. 36
Figure 19. Concentration of nitrobenzene normalized by initial concentration remaining in beaker over time in the presence of an electric field............................ 37
Tables
Table 1. Amounts of soil, water, and cyclodextrin used to prepare samples. ................. 16 Table 2. Solution pH and conductivity after 24 hours of operation in anode and
cathode chambers..................................................................................................... 20 Table 3. Measured basal spacing of montmorillonite and montmorillonite/CD
mixtures..................................................................................................................... 37

vi ERDC TR-04-3
Conversion Factors U.S. standard units of measure can be converted to SI* units as follows:
Multiply By To Obtain acres 4,046.873 square meters
cubic feet 0.02831685 cubic meters
cubic inches 0.00001638706 cubic meters
degrees (angle) 0.01745329 radians
degrees Fahrenheit (5/9) x (°F – 32) degrees Celsius
degrees Fahrenheit (5/9) x (°F – 32) + 273.15. kelvins
feet 0.3048 meters
gallons (U.S. liquid) 0.003785412 cubic meters
horsepower (550 ft-lb force per second) 745.6999 watts
inches 0.0254 meters
kips per square foot 47.88026 kilopascals
kips per square inch 6.894757 megapascals
miles (U.S. statute) 1.609347 kilometers
pounds (force) 4.448222 newtons
pounds (force) per square inch 0.006894757 megapascals
pounds (mass) 0.4535924 kilograms
square feet 0.09290304 square meters
square miles 2,589,998 square meters
tons (force) 8,896.443 newtons
tons (2,000 pounds, mass) 907.1847 kilograms
yards 0.9144 meters
* SI: Système International d’Unités (International System of Measurement).

ERDC TR-04-3 vii
Preface This study was conducted for Headquarters, U.S. Army Corps of Engineers un-der Project 4A161102BT25, “Environmental Research – Corps of Engineers”; Work Unit CFM-J002, “Mediated Adsorption and Removal.” Technical review was conducted for the sponsor by John M. Cullinane, CEERD-EM-J.
The work was performed by the Materials and Structures Branch (CF-M) of the Facilities Division (CF), Construction Engineering Research Laboratory (CERL). The CERL research project manager was Dr. Charles P. Marsh. The technical editor was Gordon L. Cohen, Information Technology Laboratory – Champaign. Martin J. Savoie is Chief, CEERD-CF-M, and L. Michael Golish is Chief, CEERD-CF. The Technical Director of the Installation Operations business area is Gary W. Schanche, CEERD-CV-ZT. The Acting Director of CERL is Dr. Ilker R. Adiguzel.
CERL is an element of the Engineer Research and Development Center (ERDC), U.S. Army Corps of Engineers. The Commander and Executive Director of ERDC is COL James R. Rowan, EN, and the Director is Dr. James R. Houston.

ERDC TR-04-3 1
1 Introduction
Background
It is well known that nitroaromatic compounds can pose a serious threat to eco-systems and human health. These compounds have been used for many years in military munitions and pesticides, and they are present in high concentrations below ground at various sites across the country. This problem is of particular interest to the U.S. Army because it has operated munitions manufacturing fa-cilities on many of its installations. There are hundreds of explosives-contaminated sites around the United States related to Army activities. More than 100 sites are listed in the Defense Site Environmental Restoration Site Tracking System as having groundwater and, by logical extension, soils con-taminated with explosives. These sites have the potential to adversely affect drinking water aquifers, creating the likelihood of regulatory compliance prob-lems. The U.S. Environmental Protection Agency (EPA) recognizes that explo-sives-contaminated drinking water is a problem, and future EPA regulatory lim-its on nitroaromatic compounds in the water supply could seriously impair the military mission by restricting the breadth and scope of the munitions manufac-turing program as well as Army training activities in the field. Consequently, the Army has a high interest in the development of cost-effective techniques for remediation of soil contaminated with nitroaromatic compounds.
It has been proposed by many authors that natural organic material in soil acts as the primary sorbent for organic compounds such as nitroaromatics (16, 17, 31). Other studies have shown that, in certain situations, the clay mineral phase can dominate the adsorption process (20, 36). But owing to the relative difficulty encountered when attempting to decontaminate clay minerals, it is the latter of those two sorption mechanisms that is of primary concern to the present study. Haderlein et al. (12) have calculated adsorption coefficient (Kd) values for various substituted nitrobenzenes (SNBs) and found that many of these compounds form very strong adsorption complexes with several types of clay minerals. These au-thors also report increasing adsorption capacity depending on the specific clay type, in the order kaolinite < illite < montmorillonite (11). This finding suggests that soils composed primarily of montmorillonite would be the most difficult to treat due in large part to the swelling properties of this clay type. If that were

2 ERDC TR-04-3
true it would be a major concern because a large portion of the United States consists of soils with some fraction of clays that have high to medium swelling potential (Figure 1).
MAP LEGEND
Unit contains abundant clay having high swelling potential
Part of unit (generally less than 50%) consists of clay having high swelling potentialUnit contains abundant clay having slight to moderate swelling potential
Part of unit (generally less than 50%) consists of clay having slight to moderate swelling potentialUnit contains little or no swelling clay
Data insufficient to indicate clay content of unit and/or swelling potential of clay (Shown in western most states only)
Figure 1. Map of predominant clay types throughout the United States.
The presence of contaminants in clayey soils poses a difficult and potentially costly remediation problem. The low hydraulic conductivity of these soils prohib-its the use of traditional pump-and-treat remediation techniques, and high en-ergy costs render the process of excavating and thermally treating the soil highly inefficient and damaging to the environment. For these reasons, much research has been done to advance the field of electrokinetic remediation as a viable cleanup technique. Most of the research performed to date has focused on the removal of heavy metal contaminants through coupled electro-osmosis and elec-tromigration of the ionic contaminants (1, 3, 14, 21, 26, 32 – 34, 41) although some studies have been performed detailing the removal of organic molecules by electro-osmosis alone (18, 19, 27, 37, 38). The interested reader is referred to a more complete review of the aforementioned research and the state of the art of

ERDC TR-04-3 3
electrokinetic remediation recently published by M. M. Page and C. L. Page (25). Adding amendments to the purging solution has increased removal efficiencies of organic molecules. For instance, Shapiro and Probstein showed that the removal of phenol from kaolinite was enhanced by adding an alkaline purge solution (37), and Ko et al. used hydroxypropyl-β-cyclodextrin in solution to enhance the solu-bility of phenanthrene and thus facilitate its removal from kaolinite (18). It should be noted that most of these studies were performed on non-expansive clays and do not address the difficulty encountered with an expansive clay type.
Cyclodextrin (CD) molecules have the ability to form complexes with many dif-ferent molecules. In particular, Cahill and Bulusu showed that RDX and HMX, common nitroaromatic molecules, form complexes with γ-CD while TNAZ prefers to complex with β-CD (5).∗ Hawari et al. showed that the addition of CDs en-hanced recovery of RDX from artificially contaminated illite and organic-rich topsoil in batch experiments (13). Later, Sheremata and Hawari reproduced the above result using 2,4,6-trinitrotoluene (39). Perez-Martinez et al. demonstrated enhanced removal of the herbicide 2,4-dicholorophenoxyacetic acid from a Span-ish soil composed mainly of iron oxides using β-CD in a batch study (29).
Objective
The objective of this research was to advance the state of knowledge on a novel technique for cost-effective remediation of nitroaromatic compounds that uses cyclodextrin molecules as solubilizing agents, and transports them through the contaminated zone using an electrokinetic (EK) process.
Approach
First, a thorough review of the relevant literature was performed. Based on the findings of the review and the authors’ previous experience in this technical do-main, an EK test cell was designed and fabricated. Preliminary testing of EK performance through uncontaminated soil without the addition of CD was per-formed to gain insight into the values of enhanced operating parameters. Con-currently, a thorough chemical study of the physical behavior of CDs in the pres-
∗ RDX is Royal Dutch Explosive; HMX is High-Melting Explosive; TNAZ is trinitroazetidine.

4 ERDC TR-04-3
ence of contaminants and clay particles was performed by the ERDC-CERL En-vironmental Chemistry Laboratory. Upon completion of the preliminary ex-periments, testing was conducted to determine the ability of electro-osmotic flow to transport CDs through a clay column. Finally, an experimental study was performed to determine whether CDs in combination with an electrokinetic proc-ess can remove model contaminants from a clay column. Specific issues investi-gated included the following:
1. The ability of electrokinetics to successfully transport CDs, CD/contaminant as-sociation complexes, and contaminants alone through expansive clay.
2. The ability of CD molecules and an electrokinetic process to desorb model con-taminants from expansive clay.
3. A CD/contaminant complex detection method using x-ray diffraction. 4. The stability of the CD molecule under the influence of an electric field.
Mode of Technology Transfer
The findings of this study will be disseminated to the research community through publication in a journal of environmental engineering or applied chemis-try. The results are appropriate and suitable for transition into an Army-sponsored Research, Development, Test, and Evaluation (RDTE) 6.2 advanced development project.

ERDC TR-04-3 5
2 Technical Foundations
Review of Electrokinetic Theory
Double Layer Theory
A first attempt at explaining the recently observed electrokinetic phenomena was put forth by Helmholtz (6) describing what is now known as the “electric double layer.” In his model, the net positive charge at the solid surface attracted a rigidly held parallel layer of negative ions. This layer of negative charges was fixed to the solid surface via coulombic forces. Just beyond this layer of negative charges, at a molecular distance from the wall, existed another layer of positive charges. Helmholtz proceeded to express the potential drop, ∆V, across this dou-ble layer by treating it as a parallel plate capacitor as given in Equation 1:
DedV π4
=∆ (1)
Where e denotes the charge density in the double layer, D is the dielectric con-stant of the solution, and d is the distance across the double layer. This simple model had several shortcomings that were subsequently resolved by the “diffuse double layer” model proposed by Gouy (50). In this model, the fixed inner layer was allowed to have a net negative charge, beyond which an excess of positive ions were available in free solution to balance the charge. These positive ions were not bound to the solid surface and were free to move under the influence of an electric field. The difference in potential between the interface of the fixed and mobile layers and the bulk fluid is termed the zeta potential, ζ, and de-scribes the capacity of the solution to sustain electro-osmosis.
Electro-Osmotic Flow
The first attempt at extending the double layer theory to describing electro-osmotic flow was given by Smoluchowski. He considered the flow through a nar-row cylindrical capillary tube with net positive wall charge. Making several as-sumptions as to the nature of the flow field along with the assumption that the

6 ERDC TR-04-3
diameter of the capillary was large compared with the size of the double layer, he arrived at the following well known expression describing the volumetric flow rate:
LaEDqe πνζ
4= (2)
where a is the cross-sectional area of the capillary, E is the magnitude of the ap-plied electric field, L is the length of the capillary, and υ is the kinematic viscos-ity of the fluid. It is simple to extend this theory to describe the flow rate through a porous medium by modeling the medium as a collection of independ-ent parallel capillaries filling the open space of the medium. This introduces a factor known as porosity, n, to describe the fraction of the medium that is blocked by solid material. The total flow rate through the porous medium would then be given by
ALEk
LAEnDQ ee ==
πυζ
4 (3)
where A denotes the total cross-sectional area of the porous medium and ke is an engineering parameter known as the electro-osmotic permeability. Equation 3 is only a very crude approximation to the real flow situation within a porous me-dium, but can be useful in large-scale engineering calculations.
It is not the intent of the current discussion to present any new advances in the analytical modeling of electro-osmotic flows, but the full governing differential equations for the treatment of electro-osmosis at the pore-scale will be presented for completeness. The three measurable quantities of interest are the spatial and temporal fluid velocity field u(r,t), concentration of ionic species ni(r,t), and electrical potential ψ(r,t).* In a porous medium characterized by small-scale pores, the Reynolds number of the flow will always be much less than unity. This means that the fluid velocity field can be modeled using the unsteady Stokes equations given in Equation 4a below, which are derived from the full Navier-Stokes equations in the limit of vanishing Reynolds number. The rele-
* The bold-face characters in this expression indicate a vector quantity.
ERDC TR-04-3 7
vant physical parameters in this equation include the dynamic viscosity µ and the fluid density ρf. The body force term f is modeled by the relationship given in 4b. In this formulation, gravity is neglected in favor of an electric force density. Note that e denotes the electron charge, ni and zi denote the concentration and valence of the ith ionic species, respectively, and ρ(r,t) denotes the electric charge density. The electric potential field is governed by the Poisson equation given in 4c where ε is used to denote the dielectric constant of the solution. The final re-lations needed to close the system of equations are given in 4d and 4e where ji denotes the flux of the ith chemical species, Di is the ion’s diffusivity, and bi is the ion’s electric mobility.
,2 fuu+∇+−∇=
∂∂ µρ p
tf 0=⋅∇ u (4a)
ψρψ ∇=∇= ∑i
ii zenf (4b)
ερψ −=∇ 2 (4c)
0=⋅∇+∂∂
ii
tn
j (4d)
uj iiiiiii nnbeznD +∇−∇−= ψ (4e)
Equations 4a – 4e completely describe the physics occurring within a narrow pore volume. However, difficulties still exist in scaling this continuum approach to the next level of complexity to describe flow through a porous medium owing to the extreme complexity of the resulting boundary conditions. Recent work by Adler, Berki, and Thovert (2) has advanced the frontiers of this subject, but the current state of the art is far from adequate to model the complex physics associ-ated with decontamination of porous media. It is unclear as to whether a signifi-cant modeling advantage over that of the Smoluchowski model will be realized by including all of the physics given in Equation 4. More research is required in this arena to give a definitive answer.

8 ERDC TR-04-3
Cyclodextrin Chemistry
Cyclodextrins (CDs) are of widespread interest to the research community be-cause of their ability to capture molecules as a part of host-guest interactions. They are produced in large quantities using environmentally friendly technolo-gies for the enzymatic conversion of starch. They also are currently utilized in many commercial applications and analytical methods (42). Applications include pharmaceuticals, cosmetics and fragrances, chromatography, food processing, flavoring, textile processing, paint processing, catalysis, and enzymatic models (15).
Villiers discovered CDs in 1891 by digesting starch with Bacillus amylobacter and Bacillus macerans spores (42, 46). The structures of CDs have been deter-mined (42) and are reproduced in Figure 2. They can be described as crystalline, homogeneous, nonhygroscopic substances forming torus-like rings built up from glucopyranose units. The three major cyclodextrins (α-CD, β-CD and γ-CD) are constructed of six, seven, and eight glucopyranose units, respectively. The CD ring is a conical cylinder with secondary hydroxyl groups situated on one edge of the ring and primary hydroxyls situated on the other edge. The cavity is lined by hydrogen atoms and glycosidic oxygen bridges. Thus, cyclodextrins exhibit hydrophilic nature on the outside of the rings and hydrophobic characteristics inside the cavity. The cavities are approximately 8Å deep and range in diameter from 5⎯10 Å depending on the specific CD, so they can therefore accommodate different sized organic guest molecules. The hydrophilic exterior provides water solubility for the CD while the hydrophobic interior provides an energetically fa-vorable site for adsorption of organic contaminants to create a water soluble in-clusion complex. Hydrogen bonding, electrostatic forces, and van der Waals forces all serve to attract and hold organic molecules in the CD cavity (24).
Figure 2. Chemical structures of the native cyclodextrin molecules.

ERDC TR-04-3 9
An attractive feature of CD molecules is the availability of numerous hydroxyl (OH) groups for chemical modification. The total number of OH groups on each CD molecule, both exterior and interior, is considerable and varies with the size of the specific CD (α-CD =18, β-CD = 21, γ-CD =24). Thus the number of possible derivatives is nearly limitless (42). Examples of replacement of the OH group with the following functional groups have been reported: iodide, azide, thioace-tate, hydroxylamine, alkyl, polyalkylamines (24), monoiodo (45), azido (22, 44), thio (10, 40), hydroxylamino (9), and alkylamino cyclodextrins (30, 43). The chemistry of modification is well characterized, including selective modification at specific sites on the molecule, so one can assemble ‘customized’ CD molecules suitable for a specific application. Also, both anionic CDs and cationic CDs have been synthesized (7). In addition, modified CDs exhibit enhanced complexing properties and solubility compared with the unmodified forms. (The incremental resources needed to investigate various modified CDs as part of the current group of experiments was not available.)
Clay Physics
Clay-Contaminant Interaction Processes
In order to develop an electro-osmotic remediation technology that exploits the unique properties of CDs, it is important to understand the complex physical processes that take place to bind or remove an organic contaminant to the sur-face of a clay mineral. Considerable amounts of research have been performed in this area dating back to the 1960s. Mortland (23) listed several possible interac-tions that can take place between a clay mineral surface and an organic mole-cule. First, depending on the pH of the pore solution, an organic molecule can undergo protonation in which free hydrogen ions in solution bond with functional groups on the organic molecule to form a new organic molecule with a net posi-tive charge. This molecule is then able to adsorb to the clay surface directly by exchanging with the other species of cation present on the clay surface. This ef-fect becomes significant in clays with low water content and exchangeable cations with low hydration energies. A second process that commonly occurs is based on an electron-donor/electron-acceptor model. The exchangeable metal cations act as electron acceptors while the functional groups of the organic mole-cule become electron donors. This leads to an ion-dipole type interaction that indirectly binds the organic molecule to the clay. Metal ions with large hydra-tion energies tend to retain a primary hydration shell, and the organic molecule then binds with this intermediate hydration shell via hydrogen bonding.

10 ERDC TR-04-3
These results for the broad class of organic molecules were then specialized to nitroaromatic compounds by Haderlein et al. (12) and Boyd et al. (4). Haderlein et al. (12) champion the electron donor-acceptor hypothesis while Boyd et al. (4) refute that hypothesis and propose that electron-withdrawing groups (e.g., NO2) engage in site-specific interactions with the exchangeable cations. Regardless of the mechanism, both studies concur that clays with exchangeable cations having low hydration energy can adsorb significantly more nitroaromatic compounds than those having high hydration energies. Also, the type of clay mineral deter-mines the affinity of the compound for adsorption. As noted previously, the rank order of clay mineral types used in this study, from lowest adsorption capacity to greatest, is kaolinite, illite, and montmorillonite. Finally, there is a wide varia-tion in adsorption constants among the different nitroaromatic compounds, with trinitrotoluene (TNT) adsorbing the most strongly to clay surfaces (12).
Implications of Crystalline Structure
Based on early optical microscopy studies, clays were thought to be amorphous hydrous gels consisting predominantly of silicon, aluminum, and iron. Then in 1923 Rinne and, separately, Hadding succeeded in obtaining x-ray diffraction patterns from what turned out to be the crystalline structure of clay minerals. The definitive publication is attributed to Pauling (28) who found a unit cell with dimensions in the plane of cleavage of approximately 0.50 x 0.88 nm that was common to micas, chlorites, pyrophyllite, talc, kaolinite, and gibbsite. As is now known, clays typically consist of layered crystalline structures in which sheets of octahedrally coordinated oxygen atoms centered on aluminum atoms are sequen-tially stacked, or are fused with tetrahedral coordinated layers based on silicon atoms. The varied and differing sequences of layering gives rise to specific types of clay. It should be noted that amorphous, small-diameter soil materials do ex-ist (e.g., allophanes) but they are uncommon. These derive from very young rock such as lava flows, and will eventually alter in time to more conventional clay mineral crystalline structures. Thus, the behavior of the great majority of clay-containing soils is dominated by the layer lattice alumina-silicates. These mate-rials are typically classed as 1:1 (a layer of tetrahedrally coordination around Si4+ bonded to an octahedrally coordinated layer around Al3+ or Mg2+) and 2:1 (a basic layer unit of two tetrahedrally coordinated sheets forming a sandwich with an octahedrally coordinated sheet). The 1:1 layer silicates (e.g., kaolinite, hallo-ysite, dickite, nacrite) are bonded to the next layer at a fixed basal spacing dis-tance of 0.72 nm by hydrogen bonding and display no swelling behavior. The 2:1 layer silicates (e.g., montmorillonite, illite, pyrophyllite, talc, mica, vermiculite) can have fixed basal spacing (e.g., 1 nm for illite via non-exchangeable K+) or can expand, often to a great degree. Montmorillonite, for example, begins with a
ERDC TR-04-3 11
basal spacing of about 1.4 nm but can swell to many tens of nanometers into an expanded tactoid structure.
It is this variability in interlamellar spacing that is of interest and could be ex-ploited to determine the nature and concentrations of the molecules present in solution. Rytwo et al. (35) have shown using x-ray diffraction techniques that the basal spacing of montmorillonite depends strongly on the type of molecule adsorbed and also on the concentration of this molecule. In addition, Dios-Cancela et al. (8) show that the basal spacings of montmorillonite clay to which a particular molecule has adsorbed depend on the exchangeable cation present on the clay surface. It is reasonable then to hypothesize that there exists a notice-able difference between the basal spacing when only a contaminant is present in the pore solution, when a CD molecule is present in the pore solution, and when a CD/contaminant complex is present in the pore solution. An exploratory x-ray diffraction experiment was conducted to test that hypothesis.

12 ERDC TR-04-3
3 Experimental Procedure
Electro-Osmotic Test Cells and Expanded Procedure
Various expansive and non-expansive clays were mixed with water in the follow-ing soil-to-water ratios: montmorillonite 1:1, kaolinite 3:1, illite 5:1, and natural Champaign (IL) clay 3:1. The clay was rolled by hand into a ball and forced into columns. This process was performed carefully and slowly in order to minimize voids in the clay column. Twelve columns were packed with the appropriate type of clay and covered on each end with a 2 mm diameter thick rubber o-ring and a 1.7 mm diameter, 0.2 mm thick filter membrane. A covered column served as a conduit between two electrokinetic chambers. These elements were fastened to-gether with threaded metal rods using 1.6 mm diameter washers and ¼ in. nuts. Engineering drawings of the apparatus are shown in Figure 3 and a photograph of the cells in use is shown in Figure 4.
A specially machined mixed-metal ceramic electrode was placed in each of the test cell reservoirs, one designated as the positive polarity anode chamber and the other as the negative polarity cathode chamber. A constant voltage was sup-plied to the test cells through a Kepco BOP100M power source controlled with Labview 5.1 computer software. Simultaneous current measurements through all 12 cells were taken at 60-minute intervals using a Keithley multimeter and recorded by LabView.
Liquid samples were drawn from the anode and cathode chambers of each cell at various intervals dependent on the particular experiment. The lost volume of liquid was then replaced with the appropriate background solution used in the particular experiment. (Further details of this procedure are provided in text with the results of each experiment.) The liquid samples were then analyzed for concentrations of the possible constituent molecules.

ERDC TR-04-3 13
n
Figure 3. Engineering drawings of te
Figure 4. Photograph of test cells durin
Colum
st cells.
g operation.

14 ERDC TR-04-3
Sample Analysis
Samples were filtered through Gelman GHP 0.2 µm filter membranes prior to analysis and then divided into two equal portions, one for nitroaromatic com-pound analysis and the other for CD analysis. A Waters Associates LC Module I system injected 10 µl samples through a Supelcosil ABZ+ Plus column (15 cm x 3 mm, 5 um particle size) to analyze the nitroaromatic compound content. An Ep-pendorf Column Heater held the temperature of the column constant at 35 °C. The Waters Model 486 UV/Visible absorbance detector detected the nitroaromat-ics at a wavelength of 254 nm. The mobile phase consisted of 70% deionized wa-ter / 30% acetonitrile flowing at 1 ml/min.
Two different high-performance liquid chromatography (HPLC) systems and col-umns were used to analyze the CD concentrations. The first system was used exclusively for detection of the native, α, β, and γ-CDs. A Waters Associates LC Module I plus injected 40 µl samples into a Phenomenex Jupiter C18 column (250 x 4.6 mm, 5µm particle size, 300 Å pore size) maintained at 30.8 °C. A Wyatt Optilab Interferometric Refractometer was used to detect CD by changes in refractive index. For samples containing α and γ-CDs, the mobile phase con-sisted of 1.2% ACN / 98.8% deionized water. β-CD required a 2.2% ACN / 97.8 % deionized water mobile phase to limit the analysis time to 20 minutes. The mo-bile phase flow rate was 1 ml/min.
A second system was required for detection of the modified β-CDs (amino-, car-boxymethyl-, hydroxypropyl-, maltosyl). A Waters Alliance HPLC system in-jected 20 µl samples containing these modified CDs into an Advanced Separa-tions Technologies, Inc. (ASTEC) Cyclobond I 2000 column (250 x 4.6 mm) and maintained a constant 30 °C column temperature. The mobile phase, flowing at 1 ml/min, was 65% acetonitrile / 35% TEA buffer/water solution*. The TEA/water solution pH was adjusted to 4 by adding approximately 1⎯2 ml of glacial acetic acid. An Alltech ELSD (Evaporative Light Scattering Detector) 2000 detected the modified β-CDs. The ELSD 2000 maintained the drift tube temperature at 100 °C, and set the nitrogen flow rate at 1.5 l/min.
* 0.1% by mass triethylamine.

ERDC TR-04-3 15
Soil Contamination
Various soils were artificially contaminated with 2,4-dinitrotoluene and nitro-benzene. Two 100 g portions of each soil were transferred to 500 ml wide-mouthed jars. To one of the jars was added 200 ml of a 2,4-DNT/ACN (10 g/L) solution. Similarly, 200 ml of an nitrobenzene/ACN (10 g/L) solution was added to the other. A total of 15 ml of water was added to all of the soil samples. These jars were then rotated for several days. After this time period, the jars were re-moved from the rotators and left to stand in an upright position for approxi-mately 1 hour to allow the soils to settle. The remaining nitroaromatic/ACN so-lution above the settled soils was removed, and the soil slurries were then spread onto aluminum foil sheets under a fume hood and left to dry at room tempera-ture for at least 4 days. The large pieces of soils that formed were crushed to finer particles using a mortar and pestle.
EPA Method 8330, Determination of Concentration of Nitroaromatics and Ni-tramines by High Performance Liquid Chromatography (49), was used to deter-mine the concentration of nitroaromatic compounds in the soil. A 2 g sample of contaminated soil was mixed with 10 ml of ACN for 1 minute using a Vortex mixer. A Branson Ultrasonics Bath, maintained at 10 °C, sonicated the soil/ACN mixtures for at least 18 hours. After sonication, the samples were left to stand for at least 30 minutes to allow the soils to settle. Then, 5 ml samples of the so-lutions remaining above the settled soils were then transferred to another vial, and 5 ml of KCL solution (5 g KCL dissolved to 1 L mark with deionized water) were added to these and agitated. Again the samples were left to settle. Finally, 5 ml portions of these samples were filtered through Gelman 0.2um polytetra-fluoroethylene (PTFE) filter membranes, disposing of the first 3 ml and saving the last 2 ml for analysis in the Waters LC Module I system, as described above.
Electrostatic Degradation
Batch experiments were conducted to determine the degradation rate of various CDs and nitrobenzene in the presence of an electric field. A specified volume of CD or nitrobenzene in water was placed in a beaker, and two electrodes were suspended into the solution. A paraffin wrap was placed over the top of the beaker to minimize evaporation. A constant current was applied to the elec-trodes using a KEPCO BOP50M power supply controlled by LabView 5.1 soft-ware. The area of the front face of the immersed electrodes was measured. For the purposes of comparisons within this study, this area was assumed to be the effective cross-sectional area from which the current density was calculated.

16 ERDC TR-04-3
Thus the effective current density between experiments was varied by changing the volume of liquid placed into the beaker.
Liquid samples were drawn periodically from the beaker and analyzed for CD or nitrobenzene content using the method described above under “Sample Analy-sis”. The sample volume along with any evaporated liquid was replaced with de-ionized water after each sample was taken. Every effort was made to maintain the liquid at a constant level within the beaker to assure a constant current den-sity throughout the course of the experiment.
X-Ray Diffraction
Eight montmorillonite and eight illite samples were prepared according to Table 1. A soil to cyclodextrin ratio of 1:1 was roughly followed to facilitate the detec-tion of CD using the x-ray diffraction (XRD) technique. It should be noted that an exception to this was necessary for the amino β samples due to their limited availability. The amount of deionized water used in each sample was the mini-mum necessary to completely dissolve the CD because the water would eventu-ally need to be evaporated from the samples. These mixtures were placed on aluminum pans and put in a vacuum oven at 50 °C for approximately 18 hours.
Table 1. Amounts of soil, water, and cyclodextrin used to prepare samples.
Soil Amount (g) CD used Amount (g) DI H2O (in µL) Montmorillonite 1.3237 None 0 4000
Montmorillonite 0.2524 Alpha (α) 0.2513 2000 Montmorillonite 0.2509 Beta (β) 0.2502 2000 Montmorillonite 0.2543 Gamma (γ) 0.246 2000 Montmorillonite 0.2493 Maltosyl β 0.2501 2000 Montmorillonite 0.28 Carboxymethyl β 0.253 2000 Montmorillonite 0.2596 Hydroxypropyl β 0.2506 2000 Montmorillonite 0.2581 Amino β 0.1045 2000 Illite 1.0196 None 0 1000 Illite 0.5194 Alpha (α) 0.5248 1000 Illite 0.5197 Beta (β) 0.5169 1000 Illite 0.5202 Gamma (γ) 0.5603 1000 Illite 0.497 Maltosyl β 0.5489 1000 Illite 0.512 Carboxymethyl β 0.5093 1000 Illite 0.5156 Hydroxypropyl β 0.5192 1000 Illite 1.0299 Amino β 0.2525 1000

ERDC TR-04-3 17
A Bruker General Area Detector Diffraction System (GADDS) was used to collect images of the various powder samples listed in Table 1. This system utilizes point source x-rays using a copper anode with a Kα wavelength of 1.54178 Å. The samples were exposed to x-rays, and diffraction patterns were collected and ana-lyzed at diffraction angles from 1 – 10 degrees. A special 0.5 mm brass backstop was machined to collect the x-rays in the 1 – 2 degree range on the GADDS so the detector would not be directly exposed to the x-rays. These patterns were analyzed using the provided GADDS control software package. Bragg’s Equa-tion, shown below in Equation 5 was used to determine the change in the basal spacing:
λθ nd =sin2 (5)
where d is the basal spacing, θ is the diffraction angle, λ is the x-ray wavelength, and n is an integer.
Diffraction patterns of γ-CD and carboxymethyl β-CD individually were gathered to determine if non-absorbed CD could have affected the diffraction patterns of the other eight samples.

18 ERDC TR-04-3
4 Results
Electrokinetic Transport
Preliminary EK experiments were performed on uncontaminated kaolinite sam-ples to set upper and lower bounds for the ranges of several operating parame-ters. In these experiments, uncontaminated kaolinite was mixed with solutions of known conductivities. The resulting samples were packed into 2 in. columns, and solutions of the same conductivity were placed in the anode and cathode chambers of each cell. The samples were then placed under a constant-voltage electric field (100 V) for 24 hours. The resulting difference in height between the solution in the anode and the cathode chamber was measured and plotted as a function of initial solution conductivity. Results are shown in Figure 5 below. It is evident that there exists some optimal solution conductivity for increased elec-tro-osmotic flow. However, this task was beyond the scope of this study so an optimum value was not pursued. Instead, the boundaries for this operating pa-rameter were set between 500 and 1500 ppm dissolved solids in future experi-ments.
0
5
10
15
20
25
30
35
40
0 500 1000 1500 2000 2500
Conductivity (ppm dissolved solids)
Hea
d D
iffer
ence
(mm
)
Average Cell 1 Cell 2 Cell 3 Cell 4 Figure 5. Dependence of electro-osmotic transport on initial solution conductivity.
The purpose of the preliminary experiment was to determine a unit step re-sponse of the clay system to an applied electric field. The duration of 24 hours

ERDC TR-04-3 19
seems to be a long time scale for such an experiment, but it was necessary to capture the slow physics of the system. Ideally, for this type of experiment, the current flowing through the clay-filled column would have remained approxi-mately constant throughout the duration. However, due to the disparate time scales of soil resistivity change and electro-osmotic flow, this was not the case. The current flowing through the column decreased rapidly with time compared to the timescale for EO flow. This unintended consequence led to the direct veri-fication of the well-know result that the primary force driving EO flow−current density−decreases with time. Some representative results are shown in Figure 6. This phenomenon directly leads to a corresponding decrease in EO flow with time.
0.00E+00
5.00E-01
1.00E+00
1.50E+00
2.00E+00
2.50E+00
3.00E+00
3.50E+00
4.00E+00
4.50E+00
5.00E+00
0 5 10 15 20 25
Elapsed Time (hrs.)
Cur
rent
(mA
)
Cell 1 Cell2 Cell3 Cell4 Cell5 Cell6 Figure 6. Current as a function of time across six identical kaolinite samples.
The prevailing view in the literature is that this decrease in current and EO flow is due to the migration of an acid front from the anode into the clay medium. The zeta potential of the clay is highly dependent on the pH of the pore solution, with decreasing pH resulting in a lower potential. For sufficiently low values of pH, the zeta potential actually reverses sign, causing a reversed EO flow (47), as shown in Figure 7. While the acidity of the soil adjacent to the anode was not di-rectly tested, pH measurements were taken of the solution in the anode cham-ber. These data are presented along with the conductivity of the solution in the anode taken upon conclusion of the experiment in Table 2.

20 ERDC TR-04-3
Figure 7. Clay sample potential and EO flow.
Table 2. Solution pH and conductivity after 24 hours of operation in anode and cathode chambers.
Cell Final Anode pH Final Anode
Conductivity (ppm
dissolved solids)
Final Cathode pH Final Cathode
Conductivity (ppm
dissolved solids)
1 5 140 8.5 155
2 6 180 8.5 170
3 2.5 465 9 150 4 2.5 385 9 145 5 3 280 9 150 6 2.5 375 9 155
These data indicate that the pH in the anode chamber has become significantly more acidic. Similar experiments were performed for solutions of varying initial conductivity, but the results are not shown here. The magnitude of the differ-ence between anode and cathode pH was even greater for those samples al-though the increase generally resulted from a marked increase in the pH of the cathode chamber instead of a further decrease in anode pH. It is not hard to imagine, then, that the pore solution within the clay sample near the anode is acidic as well. These results underscore the need for an effective method of neu-tralizing this pH front.
It was decided that the most effective method of controlling the pH of the soil was to periodically introduce a highly alkaline solution into the anode reservoir. This was accomplished by saturating the anode reservoir with NaOH. The dis-sociated Na+ ions would serve as the charge-carrying medium between reservoirs while the OH- ions would effectively neutralize the H+ ions produced by elec-trolysis at the anode, thereby maintaining a neutral to alkaline solution in the anode chamber.

ERDC TR-04-3 21
Having determined the EK operating parameters, focus was shifted to answering the question of whether EO flow can transport CDs through a clay matrix. Ex-periments were designed to answer this question for expansive montmorillonite clay. The parameters determined above were used in conjunction with the EK test procedure described in the previous section. Solutions of 1000 ppm β-CD mixed in tap water were placed in the anode chambers of the test cells while an equal volume of tap water was placed in the cathode chambers. A constant volt-age of 25 v was applied across the test cells. Samples from the cathode chamber were taken daily and analyzed for β-CD content. Results are shown in Figure 8.
0
20
40
60
80
100
120
0 5 10 15 20 25 30
Time (days)
Con
cent
ratio
n (p
pm)
Figure 8. Concentration of β-cd present in cathode chamber as a function of time.
It is clear from this figure that the β-CD can be migrated through expansive clays by electro-osmosis. An interesting note is that Figure 8 clearly shows the concentration of β-CD decreasing with time in the cathode chamber. This occurs after a sharp increase in the concentration of the solution prior to which no CDs were detected. The most likely explanation for this phenomenon is that the CDs are dragged through the matrix with the pore solution at a given rate. The ini-tial concentration spike corresponds to the initial breakthrough of CDs into the chamber. The decrease in concentration seen over time is due to the breakdown of the CD molecules upon interaction with the cathode. This phenomenon was studied more closely, and the details are presented in a later section. This rate of destruction is faster than the net flux of CDs into the cathode chamber, thereby producing the net decrease in concentration observed. It is unclear as to what process controls the net flux of CDs into the cathode chamber. It should be noted that additional CDs are not introduced into the system during the course of the experiment. Only the CDs that were present initially in the anode cham-ber have the potential to end up in the cathode chamber. This leaves open the possibility that all of the CDs present in the anode chamber had either migrated into the clay or were decomposed at the cathode. Analysis of the solution re-maining in the anode chamber was not performed. Determining the ultimate
22 ERDC TR-04-3
fate of the CD was not attempted owing to the inability to extract CDs from montmorillonite slurries in batch experiments and the difficulties inherent in identifying the breakdown products of uncharged CDs. Thus it was considered impractical to attempt to perform such a study as part of the present work.
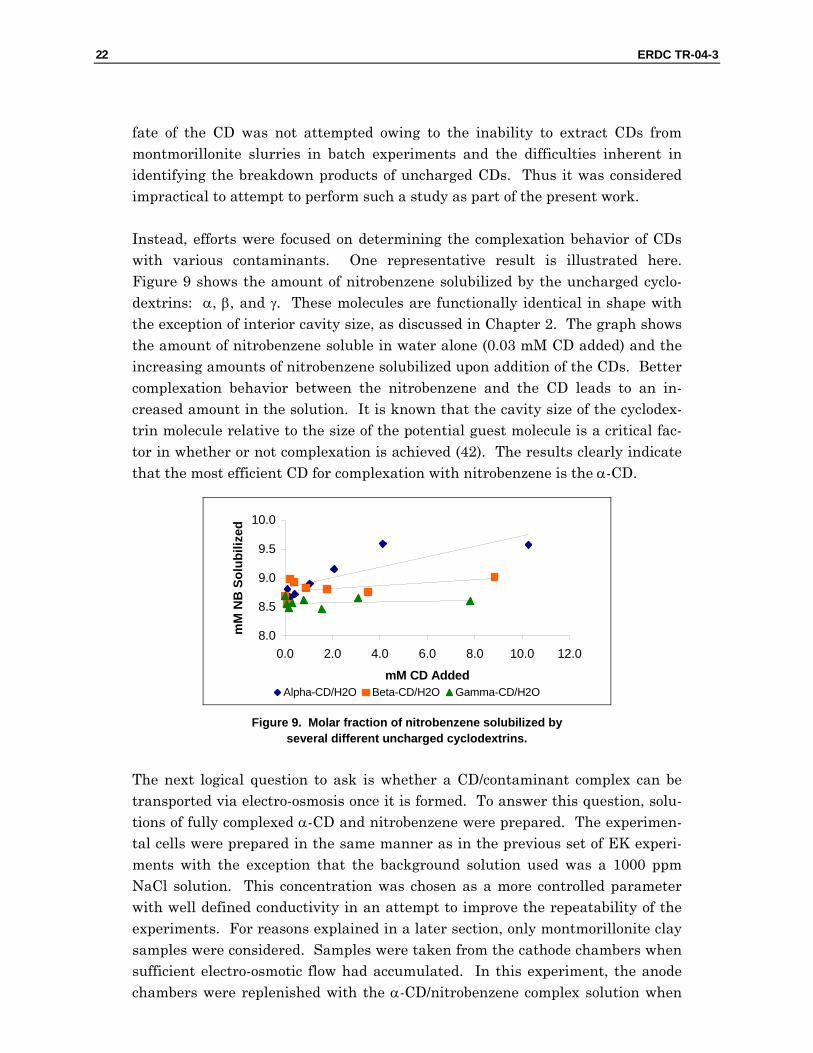
Instead, efforts were focused on determining the complexation behavior of CDs with various contaminants. One representative result is illustrated here. Figure 9 shows the amount of nitrobenzene solubilized by the uncharged cyclo-dextrins: α, β, and γ. These molecules are functionally identical in shape with the exception of interior cavity size, as discussed in Chapter 2. The graph shows the amount of nitrobenzene soluble in water alone (0.03 mM CD added) and the increasing amounts of nitrobenzene solubilized upon addition of the CDs. Better complexation behavior between the nitrobenzene and the CD leads to an in-creased amount in the solution. It is known that the cavity size of the cyclodex-trin molecule relative to the size of the potential guest molecule is a critical fac-tor in whether or not complexation is achieved (42). The results clearly indicate that the most efficient CD for complexation with nitrobenzene is the α-CD.
8.0
8.5
9.0
9.5
10.0
0.0 2.0 4.0 6.0 8.0 10.0 12.0
mM CD Added
mM
NB
Sol
ubili
zed
Alpha-CD/H2O Beta-CD/H2O Gamma-CD/H2O Figure 9. Molar fraction of nitrobenzene solubilized by
several different uncharged cyclodextrins.
The next logical question to ask is whether a CD/contaminant complex can be transported via electro-osmosis once it is formed. To answer this question, solu-tions of fully complexed α-CD and nitrobenzene were prepared. The experimen-tal cells were prepared in the same manner as in the previous set of EK experi-ments with the exception that the background solution used was a 1000 ppm NaCl solution. This concentration was chosen as a more controlled parameter with well defined conductivity in an attempt to improve the repeatability of the experiments. For reasons explained in a later section, only montmorillonite clay samples were considered. Samples were taken from the cathode chambers when sufficient electro-osmotic flow had accumulated. In this experiment, the anode chambers were replenished with the α-CD/nitrobenzene complex solution when

ERDC TR-04-3 23
necessary. A plot of the concentration of α-CD and nitrobenzene present in the cathode chamber with time is shown in Figure 10.
0
5
10
15
20
25
30
35
40
0 2 4 6 8 10 12 14 16
Time (days)
Con
cent
ratio
n (p
pm)
Alpha CD Nitrobenzene a.
Concentration (ppm) Days α-CD Nitrobenzene Ratio 1 0 0 N/A 2 0 0 N/A 5 0 1.15 0 7 34.8 0.56 62.4 8 33.6 0.31 109.4 12 12.6 0.26 47.9 15 14.6 0.48 30.7
b. Figure 10. Concentration of α-CD and nitrobenzene in cathode chamber over time for complex
transport experiment (a) and raw data and ratio of ppm α-CD to ppm nitrobenzene (b).
In this experiment, the breakthrough time for the α-CD was on the order of 1 week, as compared with 2 weeks for the β-CD experiment shown in Figure 8. This difference may be due in part to the difference in molecular size between the α-CD and the β-CD, but it is more likely that the increased breakthrough time was a result of improved electro-osmosis due to the higher concentration of free Na+ ions in the background solution. It was observed that very small con-centrations of nitrobenzene began to appear in the cathode chamber starting around day 5. CD is probably also present in small concentration but below the method detection limit (~10 ppm). These results are tabulated in Figure 10b along with the ratio of the concentration of α-CD to the concentration of nitro-benzene for each sample. The molar ratio of α-CD to nitrobenzene achieved for this experiment in the initial solution was 1.1:1, which corresponds to a mass ratio of 9.1:1. Theoretically, had the complex been transported intact across the clay matrix, that would be the ratio to appear in the cathode chamber. Such was

24 ERDC TR-04-3
not the case here, however. Much more α-CD was transported than nitroben-zene, the reasons for which are unclear. It is possible that the complex reacts at the cathode on a rapid time scale (compared with the time between samples), causing the complexes to separate and the nitrobenzene to degrade more rapidly than the α-CD. It has been established in batch experiments that nitrobenzene degrades very rapidly in the presence of an electric field (see Degradation of CDs and Contaminants, page 34). It is also possible that the complexes break apart within the clay, leaving the nitrobenzene free to preferentially bind to the clay surfaces. More research is necessary in this area to determine the fate of the ni-trobenzene. It is very interesting, however, that nitrobenzene is electrokineti-cally transported through the clay column. Previous studies have not shown EK techniques to be effective for removing nonpolar organic molecules from clay (18, 19, 27, 37, 38). The presence of CD may mitigate the binding mechanism of ni-trobenzene within the clay layers. The fact that this process may be possible in a highly expansive clay, whereas previous studies have considered only nonexpan-sive clays, is highly significant in terms of the potential applicability of this EK technique to a wide variety of soil types with low hydraulic permeability.
While not abandoning the initial concept of using the CD molecule as a solubil-ity-enhancing agent, focus was shifted slightly toward determining the capability of EK to effectively remove nitroaromatic compounds from clayey soils. The next set of experiments directly compared the ability of EK alone and EK with α-CD to remove nitrobenzene from contaminated montmorillonite samples. The ex-periments were prepared and operated under the same conditions as the previ-ous set of experiments with the following exceptions. The clay samples were con-taminated with nitrobenzene according to the method described in a previous section. The solutions introduced into the anode chambers were either 1000 ppm NaCl solution or 1000 ppm α-CD mixed into 1000 ppm NaCl solution, depending on the particular cell. Time profiles of the concentration of nitrobenzene in the cathode chambers are plotted in Figure 11 for three representative test cases. Figure 11a and 11b present data taken from experiments in which the concen-trations of the molecules were allowed to accumulate (or degrade) over time. The concentrations given in Figure 11c represent the concentration of nitrobenzene that accumulated in the cathode chamber between sampling times. When a sample was taken, the entire volume of solution in the cathode chamber was re-moved and replaced with fresh NaCl solution. The high concentration of nitro-benzene present on day 7 reflects the fact that the contaminant had been accu-mulating in the cathode chamber since the previous measurement on day 4.

ERDC TR-04-3 25
0.00
10.00
20.00
30.00
40.00
50.00
60.00
70.00
80.00
90.00
0 5 10 15 20 25 30
Time (days)
Con
cent
ratio
n (p
pm)
Nitrobenzene Alpha CD Aniline a.
0.00
10.00
20.00
30.00
40.00
50.00
60.00
70.00
80.00
90.00
0 5 10 15 20 25 30
Time (days)
Con
cent
ratio
n (p
pm)
Nitrobenzene Aniline b.
0.002.004.006.008.00
10.0012.0014.0016.0018.0020.00
0 1 2 3 4 5 6 7
Time (days)
Con
cent
ratio
n (p
pm)
8
Nitrobenzene c.
Figure 11. Accumulated concentration of nitrobenzene, aniline, and α-CD in cathode chamber over time (a); accumulated concentration of nitrobenzene and aniline in cathode chamber over
time without α-CD added (b); and concentration of nitrobenzene transported to cathode between sampling times without α-CD added (c).
26 ERDC TR-04-3
Several conclusions may be drawn from these data. First, Figures 11a and 11b show that the addition of α-CD to the purging solution has no noticeable effect on the amount of nitrobenzene transported into the cathode chamber. Second, similar to CD, nitrobenzene reacts at the cathode to produce reductive byprod-ucts — in this case, aniline. More quantitative results regarding the nitroben-zene degradation process are given under Degradation of CDs and Contami-nants, page 34. Third, Figure 11b and 11c clearly show that nitrobenzene can be desorbed and removed from montmorillonite clay by the application of an electric field alone.
It is important to note that these results were obtained using expansive mont-morillonite clay as the contaminated soil. It has previously been shown in other studies that α-CD does increase removal efficiencies of various organic molecules from kaolinite, a nonexpansive clay mineral (18). One can also see that in the samples containing α-CD in the purging solution, α-CD appears in the cathode chamber much later than the nitrobenzene (Figure 11a). There are two potential reasons for this. First, if one assumes an approximately uniform distribution of nitrobenzene in the clay matrix, some amount of this molecule is present in the region of the clay nearest to the cathode chamber. Upon initiation of the electric field, this nitrobenzene is mobilized and transported into the cathode chamber. It is clear that this nitrobenzene had to travel a much shorter distance than the α-CD, which was introduced in the anode solution. It should not be surprising, then, that the nitrobenzene would begin to appear in the cathode solutions first. A second possibility is that the transport rate of the α-CD is much slower than that of the nitrobenzene molecule. Based solely on size, it is likely that this is true because the CD molecule is more voluminous than the nitrobenzene mole-cule. Additionally, any complex that is formed would travel at an even slower rate through the clay, further reducing the likelihood that it would be able to complete its journey through the tortuous interconnected clay matrix. It is doubtful that these effects are mutually exclusive, so it is hypothesized that a combination of these two effects results in more rapid population of the cathode chamber by nitrobenzene molecules than by α-CD molecules. It is apparent that the CD/nitrobenzene complexes interact in some way with the expansive mont-morillonite that reduces their effective mobility.
One premise of the argument presented above is that the nitrobenzene molecule is mobilized after only a short period of time following the initiation of the elec-tric field. The basis for this claim lies in the following conjectures. First, it is assumed that there is an abundant source of free sodium ions in the purging so-lutions. The concentration of sodium ions must exceed the cation exchange ca-pacity of the clay matrix, which implies that the number of free sodium ions ex-

ERDC TR-04-3 27
ceeds the number of available interaction sites on the surface of the clay parti-cles. The second assumption is that it is more energetically favorable to have sodium ions interacting with the surface of the clay particles than the neutral nitrobenzene molecules. Finally, the mobility of sodium ions under the influence of an electric field is much greater than the mobility of both nitrobenzene and CD molecules. These three assumptions imply that the free sodium ions are dis-persed throughout the clay matrix almost instantaneously (compared with the timescale for electro-osmotic flow). There are enough sodium ions to occupy all unused interaction sites on the clay surface with an excess of ions remaining in the pore solution. These excess ions will exchange with the nitrobenzene mole-cules adsorbed to the clay surface. Using these assumptions, it can be seen that the nitrobenzene molecules will be left free in the pore solution to be transported by the electro-osmotic flow.
While the above discussion is adequate to explain the ineffectiveness of α-CD in increasing the removal efficiency of the nitrobenzene, it is doubtful that the ar-gument is completely physically realistic. In particular, it is unlikely that the sodium ions will be sufficient to completely liberate all the nitrobenzene mole-cules from the clay surface. With this thought in mind, it was decided to attempt to address the shortcomings of the uncharged α-CD used in the previous set of experiments. By introducing a negatively charged CD into the cathode chamber, one could transport it into the clay matrix via electromigration in the opposite direction of the prevailing EO flow. This approach would ensure that the CD and nitrobenzene would spend at least some time in the proximity of one an-other, affording the possibility of complex formation. The complex thus formed would still carry a net negative charge and thus be transported via electromigra-tion toward the positive anode chamber. An experiment was designed to test this hypothesis. A solution containing 1000 ppm amino β-CD and 1000 ppm NaCl was placed in the cathode chambers of the test cells while 1000 ppm NaCl solution was placed in the anode chambers. Montmorillonite samples contami-nated with nitrobenzene identical to those in the previous set of experiments were placed in the cells. A constant voltage was applied across the cells. Sam-ples were drawn from both the anode and cathode chambers periodically. Time profiles of the concentration of nitrobenzene in the anode and cathode chambers of two representative test cells are shown in Figure 12. The nitrobenzene was transported to both the anode and the cathode chambers in this configuration. It is unclear from these data as to which direction is the preferred mode of travel for the nitrobenzene.

28 ERDC TR-04-3
0
5
10
15
20
25
0 2 4 6 8 10
Time (days)
NB
con
c. (p
pm)
12
Cell 7 Cathode Cell 9 Cathode a.
0
5
10
15
20
25
0 2 4 6 8 10
Time (days)
NB
Con
c. (p
pm)
12
Cell 7 Anode Cell 9 Anode b.
Figure 12. Time profiles of concentration of nitrobenzene in the cathode chambers (a) and the anode chambers (b) of two identical experimental cells with added amino β-CD.
It is noted that nitrobenzene does not bind very strongly to the montmorillonite clay particles. In fact, it has one of the lowest affinities for interaction with clay of any nitroaromatic compound tested, according to data presented in Haderlein et al. (11). Thus, the action of the Na+ ions can effectively desorb the nitroben-zene from the montmorillonite surface to allow it to be transported via electro-osmosis to the cathode chamber. The question arises as to whether the same phenomenon would occur if the clay were contaminated with a molecule having a much higher adsorption constant with montmorillonite. It was found that 2,4-dinitrotoluene (DNT) has an adsorption constant with homo-ionic K+-montmorillonite that is a factor of 1028 greater than that for nitrobenzene. Al-though the montmorillonite samples used in this project were natural soils and not homo-ionic, it is expected that 2,4-DNT should have a similar adsorption

ERDC TR-04-3 29
constant with the natural montmorillonite. An experiment identical to that de-scribed in the previous paragraph was performed using 2,4-DNT as the contami-nant in place of nitrobenzene. As before, the concentration of molecules in both of the chambers was allowed to accumulate over time. Time profiles of the con-centration of 2,4-DNT present in both anode and cathode chambers are pre-sented in Figure 13. These data suggest that electro-osmosis has a much lower capacity for transporting the contaminant to the cathode chamber, but high con-centrations are found in the anode chamber.
0
5
10
15
20
25
30
35
40
45
0 2 4 6 8 10
Time (days)
DN
T C
onc.
(ppm
)
12
Cathode Cell 10 Cathode Cell 12 a.
0
5
10
15
20
25
30
35
40
45
0 2 4 6 8 10
Time (days)
DN
T C
onc.
(ppm
)
12
Anode Cell 10 Anode Cell 12 b.
Figure 13. Time profiles of concentration of 2,4-DNT in the cathode chambers (a) and the anode chambers (b)of two identical experimental cells with added amino β-CD.
This result is very intriguing. The question of what physical process is causing the 2,4-DNT to move preferentially toward the anode now arises. Nominally it may seem that the addition of the amino β-CD is performing as hypothesized,

30 ERDC TR-04-3
but the possibility cannot be dismissed that the 2,4-DNT is being polarized in some sense and transported via electromigration toward the anode chamber.
The samples drawn from the anode chambers were reanalyzed for amino β-CD, but in all cases the concentrations were below the detection limit of the instru-ment. Thus it seems that the amino β-CD was either not able to traverse the clay sample or was destroyed immediately upon arrival in the anode chamber. Experiments were conducted to determine whether nitrobenzene and 2,4-DNT were transported to the anode without the assistance of amino β-CD. These ex-periments were identical in nature to those described above except that the solu-tion added to the cathode chambers did not contain any amino β-CD. After each sample was taken, the entire volume of the anode and cathode chambers was emptied and replaced with fresh NaCl solution. Thus the concentrations shown in Figure 14 represent the amount of the molecule that had accumulated in the electrode chamber between sampling times. The nitrobenzene concentration pro-files behave qualitatively in the same manner as those for the experiments con-ducted with amino β-CD (see Figure 12). There does not seem to be a preferred direction of travel for the molecule. Based on the data presented in Figure 14b, one can argue that the preferred direction of travel for the 2,4-DNT is toward the anode in this case as well, but the amount removed in this case seems to be much lower than that removed in the amino β-CD experiments (see Figure 13b). The data suggest that amino β-CD assists electromigration and removal of tighter bound 2,4-DNT but has very little beneficial effect on the loosely bound nitrobenzene.
For completeness, the same experiment was performed using kaolinite clay sam-ples contaminated with 2,4-DNT. Unlike nitrobenzene, this molecule does sorb well to kaolinite. The concentrations of 2,4-DNT transported out of the clay ma-trix between samples are shown in Figure 15. It appears that the preferred di-rection of travel for the 2,4-DNT in this case is toward the cathode instead of the anode, which is opposite of its behavior in montmorillonite. Strongly trapping the 2,4-DNT within the montmorillonite layers inhibits removal by electro-osmosis, but sorbing the 2,4-DNT onto kaolinite surfaces allows some removal by electro-osmosis to occur. This phenomenon may simply be an issue of accessibil-ity. Future experimental work would be needed to understand this transport process.

ERDC TR-04-3 31
0
2
4
6
8
10
12
14
16
0 2 4 6 8 10 12 14 1
Time (days)
NB
Con
c. (p
pm)
6
Cell 5 Anode Cell 5 Cathode a.
0
2
4
6
8
10
12
14
16
0 2 4 6 8 10 12 14
Time (days)
DN
T co
nc. (
ppm
)
16
Cell 4 Anode Cell 4 Cathode b.
Figure 14. Concentration of nitrobenzene (a) and 2,4-DNT (b) in the anode and cathode chambers of representative montmorillonite test cells, with electrode chamber solution replaced
after each sample without added CD.

32 ERDC TR-04-3
0
2
4
6
8
10
12
14
16
18
0 2 4 6 8 10 12 14
Time (days)
DN
T co
nc. (
ppm
)
16
Cell 7 Anode Cell 7 Cathode Figure 15. Concentration of 2,4-DNT in the anode and cathode chambers of a representative
kaolinite test cell with electrode chamber solution replaced after each sample.
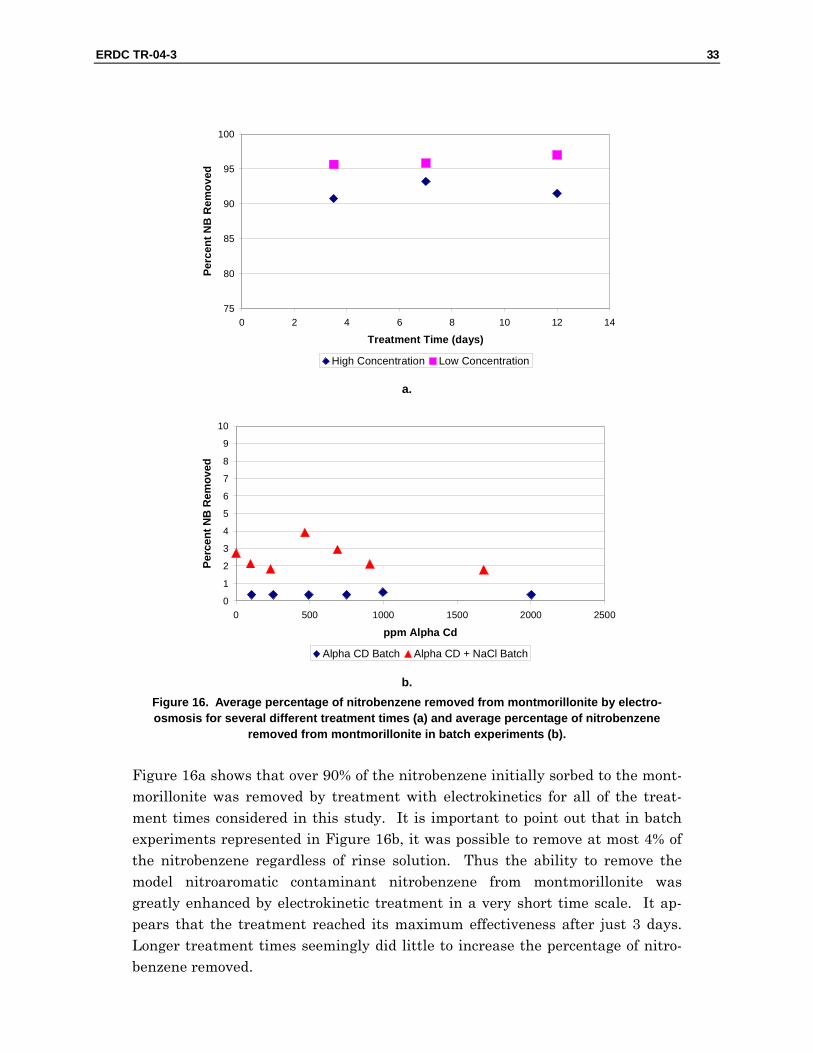
It became apparent that the most effective method of removing nitrobenzene from montmorillonite was to allow the contaminant to be purged from the soil by the electro-osmotic flow alone. To test the overall efficiency of this method, two batches of montmorillonite were contaminated. The first was contaminated us-ing the method described in Chapter 3 under “Soil Contamination,” which en-sures that the maximum possible amount of nitrobenzene is sorbed to the mont-morillonite. For reference, this value was determined experimentally to be ap-proximately 4.25 mg nitrobenzene per gram of montmorillonite. The second batch was prepared by mixing the fully contaminated montmorillonite with un-contaminated montmorillonite in the proper proportion to achieve a net con-tamination equal to one-third that of fully contaminated montmorillonite. The total amount of nitrobenzene present in the samples was then determined using EPA Method 8330 (49), as described previously. Both the anode and cathode chambers were filled with 1000 ppm NaCl solutions. Sodium hydroxide was placed in the anode chamber to maintain an alkaline pH throughout the course of the experiment. A constant voltage was applied across all test cells. Cells were taken offline and the amount of nitrobenzene present in the soil samples was once again determined using EPA Method 8330. Figure 16a shows the av-erage percentage of nitrobenzene removed from cells treated for 3, 6, and 12 days. The data points indicate an average over two identical experiments. For comparison, Figure 16b shows the average percentage of nitrobenzene removed from the contaminated montmorillonite in batch experiments using an α-CD so-lution or an α-CD plus NaCl solution as an extraction solution.
ERDC TR-04-3 33
75
80
85
90
95
100
0 2 4 6 8 10 12 1
Treatment Time (days)
Perc
ent N
B R
emov
ed
4
High Concentration Low Concentration a.
0
1
2
3
4
5
6
7
8
9
10
0 500 1000 1500 2000 2500
ppm Alpha Cd
Perc
ent N
B R
emov
ed
Alpha CD Batch Alpha CD + NaCl Batch b.
Figure 16. Average percentage of nitrobenzene removed from montmorillonite by electro-osmosis for several different treatment times (a) and average percentage of nitrobenzene
removed from montmorillonite in batch experiments (b).
Figure 16a shows that over 90% of the nitrobenzene initially sorbed to the mont-morillonite was removed by treatment with electrokinetics for all of the treat-ment times considered in this study. It is important to point out that in batch experiments represented in Figure 16b, it was possible to remove at most 4% of the nitrobenzene regardless of rinse solution. Thus the ability to remove the model nitroaromatic contaminant nitrobenzene from montmorillonite was greatly enhanced by electrokinetic treatment in a very short time scale. It ap-pears that the treatment reached its maximum effectiveness after just 3 days. Longer treatment times seemingly did little to increase the percentage of nitro-benzene removed.

34 ERDC TR-04-3
Degradation of CDs and Contaminants
As noted several times throughout this report, both CD molecules and nitroben-zene molecules can be broken down in the presence of an electric field. The goal of this portion of the research was to quantitatively determine the rate at which a CD or nitrobenzene molecule will be destroyed and what factors significantly affect that rate. To this end, batch experiments were conducted according to the procedure detailed in Chapter 3 under “Electrostatic Degradation”.
An experiment to determine the dependence of the degradation rate on the cur-rent density was performed. Solutions of 10,000 ppm β-CD were placed in two identical beakers, with twice as much solution being placed in one of them. The extra solution increased the effective area of the immersed electrodes, thereby decreasing the current density since an identical constant current was supplied to both beakers. Solution samples were analyzed to determine any changes in the concentration of CD in the solution over time. The results, presented as the ratio of measured concentrations to initial concentrations, are plotted in Figure 17a.
It is clear from this figure that the applied current density is a very important factor for the rate of CD destruction. An increase in current density by a factor of two resulted in an increase in the rate of destruction by a factor of approxi-mately three for the β-CD sample. It is also important to note that the rate of degradation seems to be almost linear in time. (This result will later be con-trasted to experiments performed on a charged CD.)
A similar experiment was conducted using equal volumes of two different CD solutions to determine whether the type of native CD was a factor in determin-ing the overall rate of degradation. A constant current was applied across a 10,000 ppm β-CD solution and a 10,000 ppm α-CD solution. The relative concen-tration of CD remaining in solution over time is plotted in Figure 17b. One can see that the difference in CD molecules had very little effect on the degradation rate. It should be noted that identification of the breakdown products of the α- and β-CDs was beyond the scope of this study.

ERDC TR-04-3 35
0
0.1
0.2
0.3
0.4
0.5
0.6
0.7
0.8
0.9
1
0 100 200 300 400 500
Time(hrs)
ppm
[BC
D]/p
pm [B
CD
]_in
itial
4.8 mA/m^2 2.6 mA/m^2 a.
0
0.2
0.4
0.6
0.8
1
1.2
0 50 100 150 200 250 300 350
Time (hours)
ppm
CD
/ppm
CD
_ini
tial
Beta CD (2.6 mA/m^2) Alpha CD (2.6 mA/m^2) b.
Figure 17. Fraction of CD remaining over time in batch degradation experiments for β-CD under two different current densities (a) and α- and β-CDs under equal current densities (b).
An identical experiment was performed using a 1000 ppm solution of amino β-CD to determine the effect of the charged functional group on the structural sta-bility of the CD. The results of this experiment are shown in Figure 18. Ini-tially, the amino β-CD degraded very rapidly and had seemed to reach a steady-state value, but then after 8 days of operation, the concentration began to de-grade again. A physical explanation for this phenomenon is not known at this time nor was it investigated any further in this study due to time and budget constraints. This is an area that appears promising for future work.

36 ERDC TR-04-3
0
0.1
0.2
0.3
0.4
0.5
0.6
0.7
0.8
0.9
1
0 1 2 3 4 5 6 7 8 9 1Days
Con
c. A
min
o-B
eta
CD
(ppm
)
0
Figure 18. Concentration of amino β-CD remaining in batch degradation experiment over time.
An interesting note to make about this experiment is that, unlike the native CDs, there are appears to be some sort of ‘buffer time’ for the amino β-CD during which electrostatic degradation stalls. Subject to future verification and addi-tional testing, this effect could be exploited for environmental remediation appli-cations by engineering the molecule to have a specific lifetime after which only environmentally benign breakdown products would remain. Another point of interest is that the breakdown products for the amino β-CD do not include β-CD. Simple loss of amino groups does not appear to be the degradation mechanism.
The behavior of the nitrobenzene molecule under the influence of an electric field was also studied. In a batch experiment similar to those performed with the CDs above, the current density was increased substantially to decrease the time scale of the degradation to the order of hours instead of days in an attempt to decrease any effects caused by uncontrolled experimental variables. Thus, these results must be understood only qualitatively when making a comparison with the CD degradation results. It is interesting to note that much of the degrada-tion occurred almost immediately. In fact, only 40% of the original concentration of nitrobenzene survived the first hour of testing, and the number dropped to close to zero after 5 hours of testing (Figure 19). The rate of decay appears to be pseudo-exponential in contrast to CD degradation. As noted above, nitrobenzene is readily reduced to aniline at the cathode.

ERDC TR-04-3 37
0.0
0.2
0.4
0.6
0.8
1.0
0 1 2 3 4 5 6
Time (hours)
[NB
]/[N
B]f
Figure 19. Concentration of nitrobenzene normalized by initial concentration
remaining in beaker over time in the presence of an electric field.
X-Ray Diffraction Patterns of Clay-CD Mixtures
Experiments using an x-ray diffraction technique were performed to detect any indications that CD molecules could become incorporated into the interlayer spaces in montmorillonite. Samples of montmorillonite, γ-CD and carboxymethyl β-CD, and several different montmorillonite/CD mixtures were analyzed using this technique, and the results of those experiments are presented in Table 3. The sample of montmorillonite with no CD added has a basal spacing of 12.6 Ǻ. This value is consistent with data presented in MacEwan and Wilson (48) for Na-saturated montmorillonite with a bilayer of hydrated water in the inter-lamellar pore space. Having established the reliability of the experimental method, it is very likely that the decrease in the d001 basal spacing observed for the montmorillonite/CD mixtures is a real phenomenon.
Table 3. Measured basal spacing of montmorillonite and montmorillonite/CD mixtures.
Sample ID Peak Angle Basal Spacing (Å) Montmorillonite 3.51 12.61 Mont. + Alpha 4.04 10.94 Mont. + Beta 3.60 12.29 Mont. + Gamma 3.52 12.56 Mont. + Amino Beta 3.68 12.01 Mont. + Maltosyl Beta 3.78 11.69 Mont. + Hydroxypropyl Beta 3.78 11.69 Mont. + Carboxymethyl Beta 3.54 12.48

38 ERDC TR-04-3
Before any attempt is made to explain the possible reasons for such a decrease in the d001 spacing, it should be emphasized that the data clearly show that, for all the CDs tested, there is complete adsorption of the CD to the montmorillonite. This result manifests itself in the absence of any resemblance of the diffraction pattern for the CD/montmorillonite mixtures to the diffraction pattern for the pure CDs. This, in combination with the anomalous decrease in the d001 upon addition of the CDs, strongly suggests that some type of physical adsorption of the CD to the clay particles has occurred.
Returning to the issue of the decrease in interlayer spacing upon addition of CD molecules into the pore space, it is conjectured that water is excluded from the pore space by the CD molecules upon sample drying. The new basal spacing would then depend on the physical size of the CD independent of relative humid-ity of the sample-drying environment. The data for the native α-, β-, and γ-CDs support this claim as the d001 spacing increases with increasing CD size, suggest-ing that the CDs form complexes with the montmorillonite such that the glucose ring is oriented at a steep angle to the surface of the clay particles. This phe-nomenon is seen quite frequently with many long-chain organic molecules. There is considerable debate about the exact nature of the soil-organic molecule bonding mechanism. MacEwan and Wilson (48) list several different possibili-ties but suggest that van der Waals interactions may be the predominant bond-ing mechanism for high-molecular-weight organic molecules that are oriented in this nearly perpendicular manner to the clay particle layer arrangement.
The analysis of the modified CDs is much more challenging. Physical size is not the only factor that may determine the interlamellar spacing of the montmoril-lonite/CD complexes. These modified CDs can carry a net charge of varying strength and polarity. It is highly likely, then, that some other form of bonding mechanism occurs. The cationic CDs (carboxymethyl β-CD) can directly compete with the saturating cations found within the montmorillonite pore structure for available complexation sites on the clay surface. One would suspect that such an electrostatic interaction would tend to be much stronger than the van der Waals interactions that are common for nonpolar organic molecules. This idea would suggest, then, that cationic CDs are bound more tightly to the clay particles than are the native CDs.
The question still remains as to why the interlayer spacing for the samples con-taining the positively charged carboxymethyl β-CD is larger than that for sam-ples containing the negatively charged β-CDs. This result suggests that the cations present at the clay surface in the interlayer region of the montmorillonite are not readily displaced by the carboxymethyl β-CD and such an electrostatic

ERDC TR-04-3 39
reaction as hypothesized above does not occur. Instead, the presence of the CD is in some way shielded from the clay surfaces, and the interlamellar spacing ap-proaches that of pure montmorillonite. The presence of negatively charged β-CDs, on the other hand, results from a smaller d001 spacing than for the un-charged β-CD. This insight once again indicates the need to revise previous con-jecture that the CDs completely exclude water from the interlayer region. It is possible that a surplus of free cations remains near the clay surface and is more strongly attracted to the negative surface groups on the β-CDs. Thus it could be that this stronger interaction leads to a reduction in the angle of incline of the CD, thereby drawing the clay surfaces closer together. A significant amount of future research in this area would be needed to test these conjectures.

40 ERDC TR-04-3
5 Conclusions and Recommendations
Conclusions
This study provided direct evidence that it is possible to remove organic con-taminants — in this case nitrobenzene and 2,4-DNT — from expansive mont-morillonite clay by electro-osmosis. This type of clay mineral is chemically and physically different from the nonexpansive variety and thus behaves much dif-ferently in its capacity to interact with organic molecules, free ions, and electro-osmotic flow. It was not clear at the onset of this project whether previous re-sults obtained with nonexpansive soils would hold for the unique case of an ex-pansive soil. Initial batch experiments showed that extractions with various so-lutions removed very little nitrobenzene from contaminated montmorillonite, while the same process removed nearly all of the nitrobenzene sorbed to kaolin-ite. This result indicated the inherent difficulties associated with cleaning mont-morillonite above and beyond those associated with cleaning kaolinite. In spite of this problem, removal efficiencies of up to 97% were achieved using electro-osmosis alone. It is expected that similar removal efficiencies would be gener-ated upon scaling of this technology to the field scale level, so this is a promising area for future work that needs to be addressed. Another critical test of this technology would be needed to verify that similar results can be obtained when the contaminant in question is a nitroaromatic compound that sorbs more strongly to montmorillonite. The 2,4-DNT used in portions of this work would be a likely candidate for such a study along with other contaminants, such as TNT and RDX, that are relevant to Army activities. Additionally, it may be beneficial to test CL20* proactively as it represents a potential future environmental con-taminant.
The use of native, uncharged cyclodextrins as solubility enhancing agents in combination with electro-osmosis offered little or no improvement over the use of
* CL20: A cyclic nitramine explosive named after Naval Weapons Center China Lake (CL).

ERDC TR-04-3 41
electro-osmosis alone in removing nitrobenzene from montmorillonite clay. This result does not align with previous studies showing enhanced removal efficien-cies of organic molecules in kaolinite clay. In addition, the ability to transport an intact NB/CD inclusion complex through the clay matrix was not clearly dem-onstrated. The introduction of negatively charged amino β-CDs into the system through the cathode chambers of the experimental apparatus was able to induce an increased electrokinetic removal of 2,4-DNT. A further set of specialized, more carefully controlled experiments would be needed to reach a definitive con-clusion on the benefits of amino β-CD for removal of stronger sorbed nitroaro-matic contaminants.
Other results generic to the use of CD molecules in the presence of an electric field were presented. It was found that the structure of the CD molecule is un-stable in the presence of an electrical field. Uncharged CDs (α and β) are effec-tively degraded at a rate dependent upon the current density in the medium in which the CDs are infused. A higher current density results in an increasingly faster rate of degradation while the difference in physical structure and molecu-lar weight between α- and β-CDs has very little effect on the breakdown rate. A charged CD (amino β) is much more unstable in an electric field. Initially, this CD degrades rapidly. Thereafter it seems to survive unscathed for an extended period of time before destruction resumes. By better quantifying this degrada-tion, a kind of designed obsolescence might be engineered for environmental remediation purposes. It also was observed that a CD molecule moves through a clay matrix under the motive EO force at a rate slower than that of smaller or-ganic contaminant molecules that are free in solution.
It also was shown using an x-ray diffraction technique that the CD molecules are physically adsorbed in the interlayer spacing of montmorillonite clay particles. The exact nature and location of the adsorption mechanism is unclear, but it is likely that van der Waals interactions dominate for the uncharged native CD molecules while cationic or anionic interactions probably dominate for the charged CD species. For both of these cases, the most likely orientation for the CD molecule in the interlamellar space is inclined at a steep angle to the clay particle surface. Such a configuration suggests that the d001 spacing is depend-ent on the largest physical dimension of the CD being tested. The implicit as-sumption behind that conclusion is that the inclination angle depends most strongly on the charge density of the clay particles and the total potential energy of the system rather than on the diameter of the CD molecule. The experimental data support such an argument in that the d001 spacing of montmorillonite sam-ples mixed with the native CDs increases with increasing size of the CD mole-cule. Another open question from this investigation is why the d001 spacing actu-
42 ERDC TR-04-3
ally decreases due to the addition of the CD molecules. The argument presented here is that the initial spacing is due to a buildup of water layers within the pore space. The added organic CD molecule serves to displace the water from the pore region, thereby causing the to pore size to shrink until it reaches the limit of the physical dimensions of the CD molecule. A significant opportunity for follow-up research exists in that area. A better understanding of the physical mecha-nisms behind the adsorption of the CD molecules to the clay particles would as-sist in the development of a process to prevent or reverse this adsorption process.
Recommendations
The ability of electro-osmosis to efficiently clean up contaminated soils should continue to be investigated. The current work could be directly extended to re-moval of other types of nitroaromatic compounds from montmorillonite on the laboratory scale. Attention also should be given to the more applied aspects of scaling this type of remediation system to a field-scale model.
The use of CDs as solubility-enhancing agents for remediation should still be pursued. Future work in this arena should focus on determining the ability of the native CDs to help remove other organic compounds that adsorb more strongly to the montmorillonite surface. In such cases, the electro-osmotic flow alone may not be sufficient to free the contaminant from the clay surface and transport it out of the clay matrix. By increasing the length of time the CD is in close proximity to the organic contaminant, the likelihood of complex formation should increase accordingly. In such a scenario, the issue of CD durability would need to be addressed more fully and control strategies would need to be devel-oped for this remediation method.
ERDC TR-04-3 43
References 1. Acar, Y.B., Alshawabkeh, A.N. “Electrokinetic Remediation. I: Pilot-Scale Tests with Lead-
Spiked Kaolinite.” J. of Geotechnical Engineering. v. 122, 1996, 173-185.
2. Adler, P.M., Bekri, S., Thovert, J.F. “Electrokinetics in Porous Media.” Interfacial Electrokinetics and Electrophoresis. Chapter 18. New York: Marcel Dekker, 2002, 521-554.
3. Alshawabkeh, A., Puppala, S. K., Acar, Y. B., Gale, R. J., Bricka, M. “Effect of Solubility on Enhanced Electrokinetic Extraction of Metals.” In Situ Remediation of the Geoenvironment Geotechnical Special Publication. n. 71 1997. ASCE, New York, 532-544.
4. Boyd, S.A., Sheng, G., Teppen, B.J., Johnston, C.T. “Mechanisms for the Adsorption of Substituted Nitrobenzenes by Smectite Clays.” Environmental Science & Technology. v. 35, 2001, 4227-4234.
5. Cahill, S., Bulusu, S. “Molecular Complexes of Explosives with Cyclodextrins.” Magnetic Resonance in Chemistry. v. 31, 1993, 731-735.
6. Helmholtz, H.L. Ann. Phys. Chem., 7, 337, 1879.
7. Croft, A. P.; Bartsch, R. A. “Synthesis of Chemically Modified Cyclodextrins.” Tetrahedron. v. 39, 1983, 1417-1474.
8. Dios-Cancela, G., Mendez-Alfonso, L., Huertas, F.J., Romero-Taboada, E., Sianz-Diaz, C.I., Hernandez-Laguan, A. “Adsorption Mechanism and Structure of the Montmorillonite Complexes with (CH3)2XO (X=C and S), (CH3)3PO, and CH3-CN Molecules.” J. of Colloid and Interface Science. v.222, 2000, 125-136.
9. Fikes, L.E., Winn, D.T., Sweger, R.W., Johnson, M.P., Czarnik, A.W. “Preassociating α-Nucleophiles.” J. Am. Chem. Soc. v.114, 1992, 1493-1495.
10. Griffiths, D. W.; Bender, M. L. Adv. Catal. 1973, 54, 625.
11. Haderlein, S.B., Weissmahr, K.W., Schwarzenbach, R.P. “Specific Adsorption of Nitroaromatic Explosives and Pesticides to Clay Minerals.” Environmental Science & Technology. v. 30, 1996, 612-622.
12. Haderlein, S.B., Schwarzenbach, R.P. “Adsorption of Substituted Nitrobenzenes and Nitrophenols to Mineral Surfaces.” Environmental Science & Technology. v. 27, 1993, 316-326.

44 ERDC TR-04-3
13. Hawari, J., Paquet, L., Zhou, E., Halasz, A., Zilber, B. “Enhanced Recovery of the Explosive Hexahydro-1,3,5-Trinitro-1,3,5-Triazine (RDX) from Soil: Cyclodextrin versus Anionic Surfactants.” Chemosphere. v.32, 1996, 1929-1936.
14. Hamed, J., Acar, Y.B., Gale, R.J. “PB(II) Removal from Kaolinite by Electrokinetics.” J. of Geotechnical Engineering. v. 117, 1991, 241-270.
15. Hedges, A.R. “Industrial Applications of Cyclodextrins.” Chemical Reviews v.98, 1998, 2035-2044.
16. Kile D.E., Chiou, C.T., Zhou, H., Li, H., Xu, O. “Partition of Nonpolar Organic Pollutants from Water to Soil and Sediment Organic Matters.” Environmental Science & Technology, v.29, 1995, 1401-1406.
17. Kleineidam, S., Rugner, H., Ligouis, B., Grathwohl, P. “Organic Matter Facies and Equilibrium Sorption of Phenanthrene.” Environmental Science & Technology. v.33, 1999, 1637-1644.
18. Ko, S., Schlautman, M.A., Carraway, E.R. “Cyclodextrin-Enhanced Electrokinetic Removal of Phenanthrene from a Model Clay Soil.” Environmental Science & Technology. v. 34, 2000, 1535-1541.
19. Kolosov, A.Y., Popov, K.I., Shabanova, N.A., Artem’eva, A.A., Kogut, B.M., Frid, A.S., Yu, V., Zel’venskii, V.Y., Urinovich, E.M. “Electrokinetic Removal of Hydrophobic Organic Compounds from Soil.” Russian Journal of Applied Chemistry. v. 74, 2001, 631-635.
20. Laird, D.A., Barriuso, E., Dowdy, R.H., Koskinen, W.C. “Adsorption of Atrazine on Smectites.” Soil Science Society of America Journal. v. 56, 1992, 62-67.
21. Maini, G., Sharman, A.K., Knowles, C.J., Sunderland, G., Jackman, S.A. “Electrokinetic Remediation of Metals and Organics from Historically Contaminated Soil.” J. of Chemical Technology and Biotechnology. V. 75, 2000, 657-664.
22. Melton, L. D.; Slessor, K. N. Carbohydr. Res. 1971, 18, 29.
23. Mortland, M. M. “Clay-Organic Complexes and Interactions.” Advances in Agronomy. v. 22, 1970, 75-117.
24. Murakami, Y., Kikuchi, J., Hisaeda, Y., Hayashida, O. “Artificial Enzymes.” Chemical Reviews v.96, 1996, 721-758.
25. Page, M.M., Page, C.L. “Electroremediation of Contaminated Soils.” J. of Environmental Engineering. v. 128, 2002, 208-219.
26. Pamukcu, S., Khan, L.I., Fang, H.Y. “Zinc Detoxification of Soils by Electro-Osmosis.” Transportation Research Record. v. 1288, 41-46.
27. Pamukcu, S., Wittle, J.K. “Electrokinetically Enhanced In-Situ Soil Decontamination.” Remediation of Hazardous Waste Contaminated Soils. New York: Marcel Dekker, 1994, 245-298.
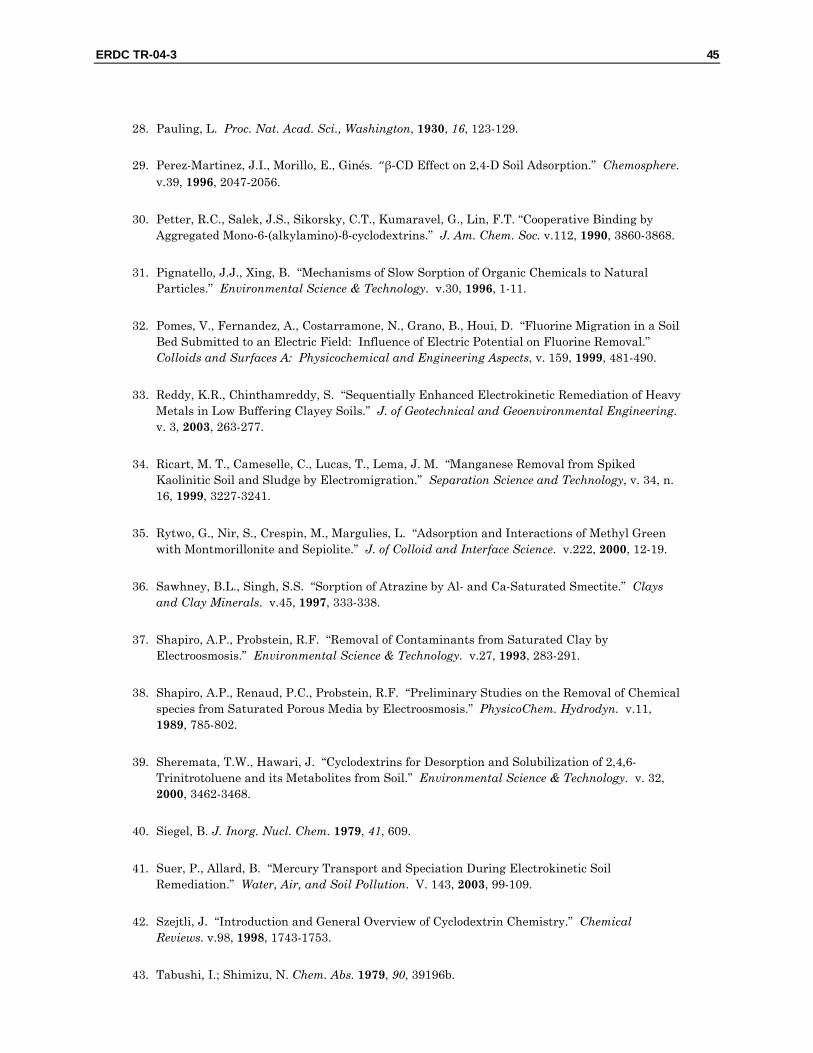
ERDC TR-04-3 45
28. Pauling, L. Proc. Nat. Acad. Sci., Washington, 1930, 16, 123-129.
29. Perez-Martinez, J.I., Morillo, E., Ginés. “β‐CD Effect on 2,4-D Soil Adsorption.” Chemosphere. v.39, 1996, 2047-2056.
30. Petter, R.C., Salek, J.S., Sikorsky, C.T., Kumaravel, G., Lin, F.T. “Cooperative Binding by Aggregated Mono-6-(alkylamino)-β-cyclodextrins.” J. Am. Chem. Soc. v.112, 1990, 3860-3868.
31. Pignatello, J.J., Xing, B. “Mechanisms of Slow Sorption of Organic Chemicals to Natural Particles.” Environmental Science & Technology. v.30, 1996, 1-11.
32. Pomes, V., Fernandez, A., Costarramone, N., Grano, B., Houi, D. “Fluorine Migration in a Soil Bed Submitted to an Electric Field: Influence of Electric Potential on Fluorine Removal.” Colloids and Surfaces A: Physicochemical and Engineering Aspects, v. 159, 1999, 481-490.
33. Reddy, K.R., Chinthamreddy, S. “Sequentially Enhanced Electrokinetic Remediation of Heavy Metals in Low Buffering Clayey Soils.” J. of Geotechnical and Geoenvironmental Engineering. v. 3, 2003, 263-277.
34. Ricart, M. T., Cameselle, C., Lucas, T., Lema, J. M. “Manganese Removal from Spiked Kaolinitic Soil and Sludge by Electromigration.” Separation Science and Technology, v. 34, n. 16, 1999, 3227-3241.
35. Rytwo, G., Nir, S., Crespin, M., Margulies, L. “Adsorption and Interactions of Methyl Green with Montmorillonite and Sepiolite.” J. of Colloid and Interface Science. v.222, 2000, 12-19.
36. Sawhney, B.L., Singh, S.S. “Sorption of Atrazine by Al- and Ca-Saturated Smectite.” Clays and Clay Minerals. v.45, 1997, 333-338.
37. Shapiro, A.P., Probstein, R.F. “Removal of Contaminants from Saturated Clay by Electroosmosis.” Environmental Science & Technology. v.27, 1993, 283-291.
38. Shapiro, A.P., Renaud, P.C., Probstein, R.F. “Preliminary Studies on the Removal of Chemical species from Saturated Porous Media by Electroosmosis.” PhysicoChem. Hydrodyn. v.11, 1989, 785-802.
39. Sheremata, T.W., Hawari, J. “Cyclodextrins for Desorption and Solubilization of 2,4,6-Trinitrotoluene and its Metabolites from Soil.” Environmental Science & Technology. v. 32, 2000, 3462-3468.
40. Siegel, B. J. Inorg. Nucl. Chem. 1979, 41, 609.
41. Suer, P., Allard, B. “Mercury Transport and Speciation During Electrokinetic Soil Remediation.” Water, Air, and Soil Pollution. V. 143, 2003, 99-109.
42. Szejtli, J. “Introduction and General Overview of Cyclodextrin Chemistry.” Chemical Reviews. v.98, 1998, 1743-1753.
43. Tabushi, I.; Shimizu, N. Chem. Abs. 1979, 90, 39196b.
46 ERDC TR-04-3
44. Tsujihara, K.; Kurita, H.; Kawazu, M. Bull. Chem. Soc. Jpn. 1977, 50, 1567.
45. Ueno, A., Moriwaki, F., Osa, T., Hamada, F., Murai, K. “Excimer Formation in Inclusion Complexes of Modified Cyclodextrins.” Tetrahedron. v.43, 1987, 1571-1578.
46. Villiers, A. Compt. Rend. 1891, 112, 536.
47. Eykholt, G.R., Daniel, D.E. “Impact of System Chemistry on Electroosmosis in Contaminated Soil.” J. of Geotechnical Eng. v.120, 1994, 797-815.
48. MacEwan, D.M.C., and Wilson, M. J., Chapter 3 in Crystal Structures of Clay Minerals and Their X-Ray Identification. (G.W. Brindley and G. Brown, Eds.), London: Mineralogical Soc., 1980, 197-248.
49. Environmental Protection Agency (EPA) Method 8330, Determination of Concentration of Nitroaromatics and Nitramines by High Performance Liquid Chromatography.
50. Gouy, G. J. Phys., 9, 457, 1910.

REPORT DOCUMENTATION PAGE Form Approved OMB No. 0704-0188
Public reporting burden for this collection of information is estimated to average 1 hour per response, including the time for reviewing instructions, searching existing data sources, gathering and maintaining the data needed, and completing and reviewing this collection of information. Send comments regarding this burden estimate or any other aspect of this collection of information, in-cluding suggestions for reducing this burden to Department of Defense, Washington Headquarters Services, Directorate for Information Operations and Reports (0704-0188), 1215 Jefferson Davis Highway, Suite 1204, Arlington, VA 22202-4302. Respondents should be aware that notwithstanding any other provision of law, no person shall be subject to any penalty for failing to comply with a collection of information if it does not display a currently valid OMB control number. PLEASE DO NOT RETURN YOUR FORM TO THE ABOVE ADDRESS.
1. REPORT DATE (DD-MM-YYYY) 09-2004
2. REPORT TYPE Final
3. DATES COVERED (From - To)
5a. CONTRACT NUMBER 5b. GRANT NUMBER
4. TITLE AND SUBTITLE Investigation of Cyclodextrin-Enhanced Electrokinetic Soil Remediation: Fate and Transport of Nitroaromatic Contaminants and Cyclodextrin Amendments in Expansive Clays
5c. PROGRAM ELEMENT NUMBER 5d. PROJECT NUMBER 4A161102BT25 5e. TASK NUMBER
6. AUTHOR(S) David Kessler, Charles P. Marsh, John J. McCormick, Donald M. Cropek, Angelo R. Deguzman, Ruben Robles, and David Gent
5f. WORK UNIT NUMBER CFM-J002 8. PERFORMING ORGANIZATION REPORT
NUMBER 7. PERFORMING ORGANIZATION NAME(S) AND ADDRESS(ES) U.S. Army Engineer Research and Development Center (ERDC) Construction Engineering Research Laboratory (CERL) PO Box 9005 Champaign, IL 61826-9005
ERDC TR-04-3
9. SPONSORING / MONITORING AGENCY NAME(S) AND ADDRESS(ES) 10. SPONSOR/MONITOR’S ACRONYM(S) CEERD-EM-J
HQUSACE 441 G Street Washing ton, DC 20314-1000
11. SPONSOR/MONITOR’S REPORT NUMBER(S)
12. DISTRIBUTION / AVAILABILITY STATEMENT Approved for public release; distribution is unlimited.
13. SUPPLEMENTARY NOTES Copies are available from the National Technical Information Service, 5285 Port Royal Road, Springfield, VA 22161.
14. ABSTRACT
Nitroaromatic-based compounds can pose a serious threat to ecosystems and human health. These compounds, which have been used in munitions and pesticides, are present in soil and groundwater at military installations and other sites. The presence of these con-taminants in clayey soils poses a difficult and potentially costly remediation problem. The low hydraulic conductivity of these soils prohibits the use of conventional pump-and-treat remediation techniques, and high energy costs make the process of excavating and thermally treating the soil highly inefficient and damaging to the environment. For these reasons, much research has been done to ad-vance the field of electrokinetic remediation as a viable cleanup technique. Although some studies have reported that organic mole-cules can be removed from clayey soils by electro-osmosis alone using a purging solution, the addition of amendments to the solution has increased removal efficiencies.
The objective of this research was to advance the state of knowledge on a novel technique for cost-effective remediation of nitroaro-matic compounds using cyclodextrin molecules as solubilizing agents and electrokinetically transports them through the contaminated zone. The results provided direct evidence that it is possible to remove nitrobenzene and 2,4-DNT from expansive montmorillonite clay using electro-osmosis both with and without cyclodextrin amendments.
15. SUBJECT TERMS Munitions, notroaromatic compounds, military training, soils, waste disposal, hazardous waste management 16. SECURITY CLASSIFICATION OF: 17. LIMITATION
OF ABSTRACT 18. NUMBER
OF PAGES 19a. NAME OF RESPONSIBLE PERSON
Charles P. Marsh a. REPORT
Unclassified b. ABSTRACT
Unclassified c. THIS PAGE
Unclassified
SAR
57 19b. TELEPHONE NUMBER (include area code) 217-352-6511
NSN 7540-01-280-5500 Standard Form 298 (Rev. 8-98) Prescribed by ANSI Std. 239.18