Embed Size (px)
Citation preview
SPECTRAL REFLECTANCE OF RICE CANOPY AND RED EDGE POSITION (REP) AS INDICATOR OF HIGH-YIELDING VARIETY
M. Abbasi1, A.A. Darvishsefat2, M. E. Schaepman3
1Department of Forestry, Faculty of Earth Science and Natural Resource, Shahrekord University, Shahrekord.
Iran 2Department of Forestry, Faculty of Natural Resource, University of Tehran, Karaj. Iran 3University of Zurich, Winterthurerstrasse 190, CH – 8057 Zurich, p +41 44 635 51 60
[email protected], [email protected], [email protected]
KEY WORDS: Spectral reflectance, rice, red edge position, first derivative, high-yielding variety
ABSTRACT:
Rice is the staple food in Iran. More than 80 percent of rice area is distributed in the two northern provinces of Mazandaran and Gilan, so that investment in increasing the quantity and quality can impact an effective role in economic independence and sustainable agriculture. Increased efficiency in rice production is possible through varietal technology, advances in yield enhancement, and the successful development of hybrid technology. Nondestructive methods such as study the spectral reflectance of rice fields is a reliable way in remote sensing study. In this study we tested the possibility to predict high-yielding rice varieties based on the spectral reflectance data in the red edge position (REP). Spectral reflectance of rice canopies from 350 to 2500 nm were acquired under clear sky in rice filed. The obtained results indicate that REP of Hybrid, Tarom, Neda and Khazar varieties are at longer wavelength, so they are predicted as more productive rice varieties.
11.. INTRODUCTION
Remotely sensed data provide considerable potential for estimating agricultural area and yield forecasting at local, regional, and global scales (Kamthonkiat, et al., 2005; Xiao et al., 2006; Serra et al., 2007, Khajeddin & Pourmanafi, 2007; Ansari Amoli & Alimohmmadi, 2007). Estimation these information by remote sensing mainly depended on the spectral characteristics of field crops. Many studies using rice spectral reflectance data has been done to estimate its product and health condition at red edge region (Yang and Cheng, 2001; Xue, et al., 2004; Shen et al., 2007;Wang et al., 2008).
Some parameters such as chlorophyll content, nitrogen, LAI, biomass and relative water content were studied in the first derivative reflectance curve in the red edge region (Jago et al., 1999; Yoder and Pettigrew-Crosby, 1995; Skidmore and Mutanga 2007). This position is the point of maximum slope on the reflectance spectrum of vegetation between red and near-infrared wavelengths. Technically, the red edge is a spectral reflectance feature characterized by darkness in the red portion of the visible spectrum, due to absorption by chlorophyll, contrasting strongly with high reflectance in the NIR, due to light scattering from refraction along interfaces between leaf cells and air spaces inside the leaf (Bonham-Carter, 1988; Dawson and Curran, 1998, Tinetti et al., 2006). Field crop
reflectance actually was a kind of mixed reflectance, influenced not only by rice canopy but also by soil. Extraction REP which is based on derivative analysis minimizes interpolation errors and soil background effects and computationally, it is one of the simpler curve fitting techniques (Shafri et al., 2006).
Hybrid varieties have the potential to raise the yield of rice and thus overall rice productivity and profitability in the north of Iran. So this has led the public and private sectors to develop the use of hybrid rice technology in recent years. Successful deployment of using hybrid rice in sustainable management, however, requires information about the area and productivity of different rice cultivars. Spectral field reflectance could use in remote sensing data for accessing this information. The increase reflectance in the near infrared range and caused a shift in the position of the red edge toward longer wavelengths depend upon the productivity element in vegetation; have shown the most productivity of some cultivar rather than the other ones. The objectives of this study were to prepare the spectral fingerprint of most important rice cultivars of northern of Iran and study the red edge position related to high-yielding of different rice varieties.
22.. MATERIAL AND METHODS
In: Wagner W., Székely, B. (eds.): ISPRS TC VII Symposium – 100 Years ISPRS, Vienna, Austria, July 5–7, 2010, IAPRS, Vol. XXXVIII, Part 7BContents Author Index Keyword Index
1
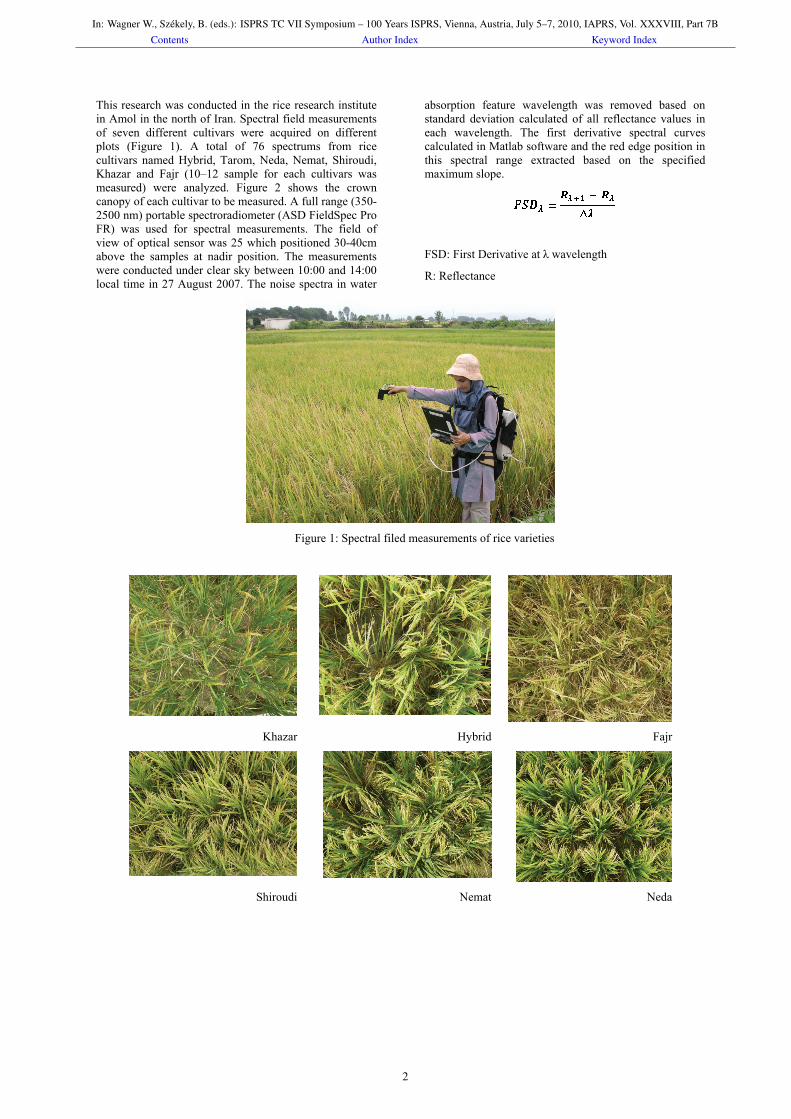
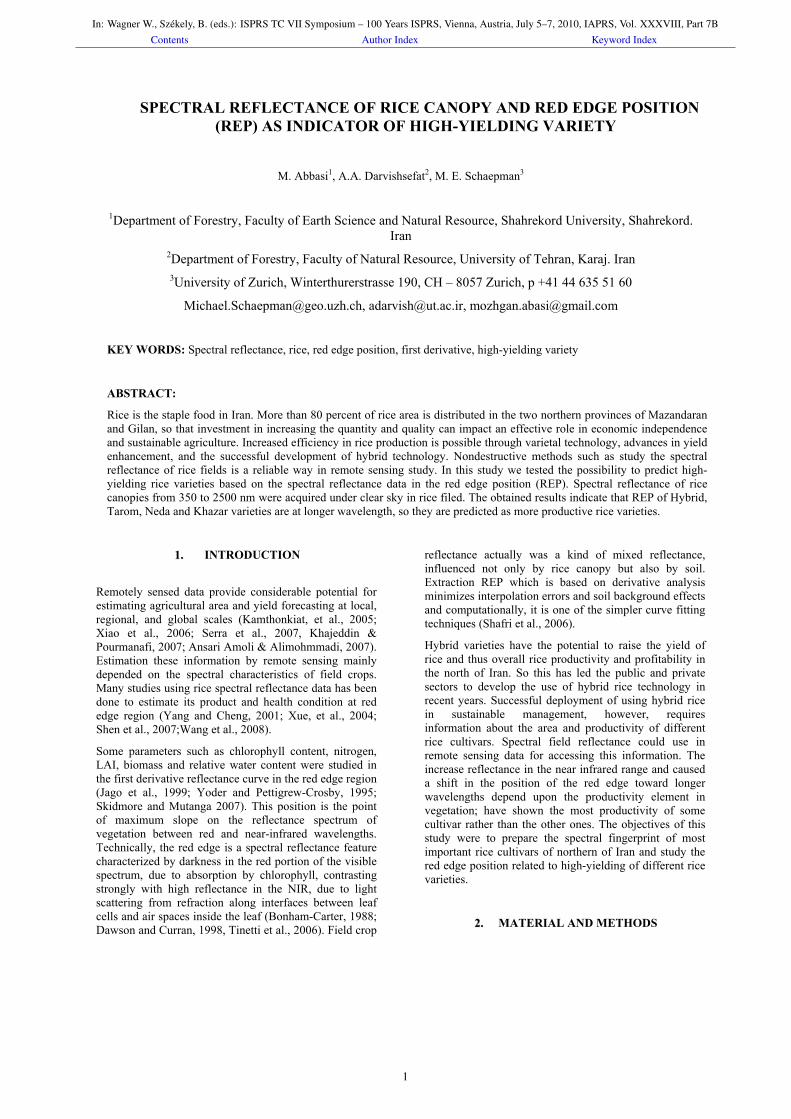
This research was conducted in the rice research institute in Amol in the north of Iran. Spectral field measurements of seven different cultivars were acquired on different plots (Figure 1). A total of 76 spectrums from rice cultivars named Hybrid, Tarom, Neda, Nemat, Shiroudi, Khazar and Fajr (10–12 sample for each cultivars was measured) were analyzed. Figure 2 shows the crown canopy of each cultivar to be measured. A full range (350-2500 nm) portable spectroradiometer (ASD FieldSpec Pro FR) was used for spectral measurements. The field of view of optical sensor was 25 which positioned 30-40cm above the samples at nadir position. The measurements were conducted under clear sky between 10:00 and 14:00 local time in 27 August 2007. The noise spectra in water
absorption feature wavelength was removed based on standard deviation calculated of all reflectance values in each wavelength. The first derivative spectral curves calculated in Matlab software and the red edge position in this spectral range extracted based on the specified maximum slope.
FSD: First Derivative at λ wavelength
R: Reflectance
Figure 1: Spectral filed measurements of rice varieties
Fajr Hybrid Khazar
Neda Nemat Shiroudi
In: Wagner W., Székely, B. (eds.): ISPRS TC VII Symposium – 100 Years ISPRS, Vienna, Austria, July 5–7, 2010, IAPRS, Vol. XXXVIII, Part 7BContents Author Index Keyword Index
2
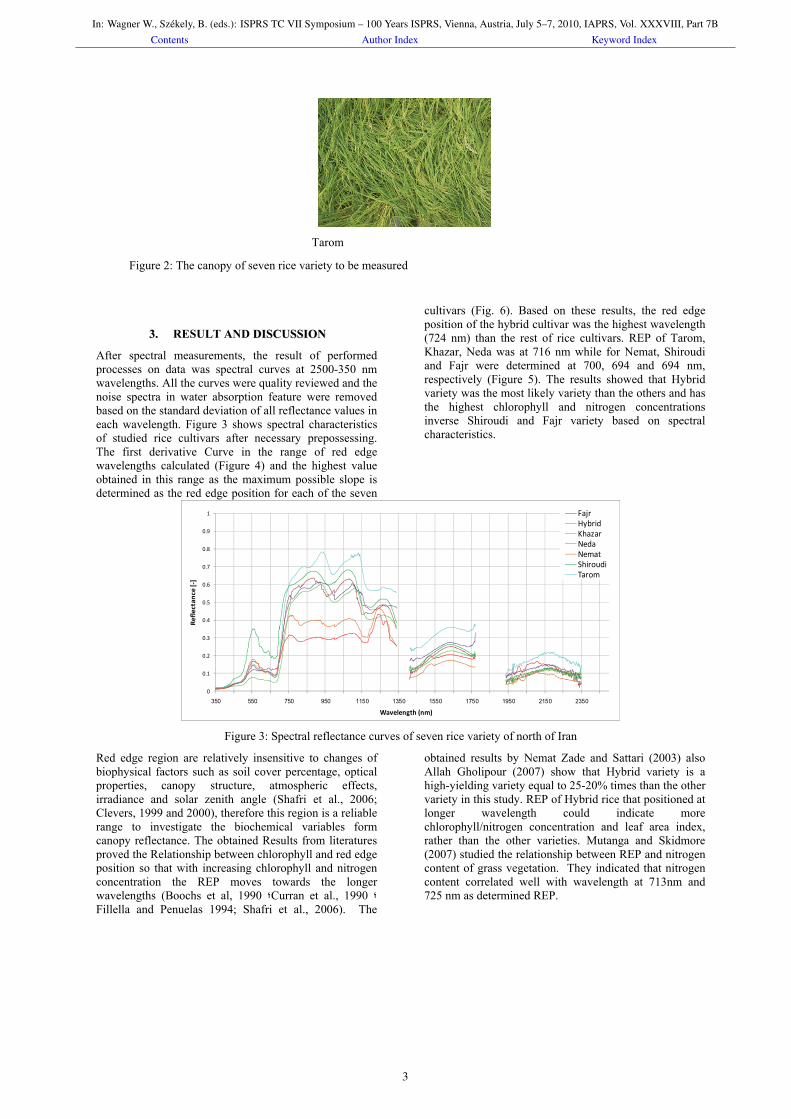
Tarom
Figure 2: The canopy of seven rice variety to be measured
33.. RESULT AND DDIISSCCUUSSSSIIOONN
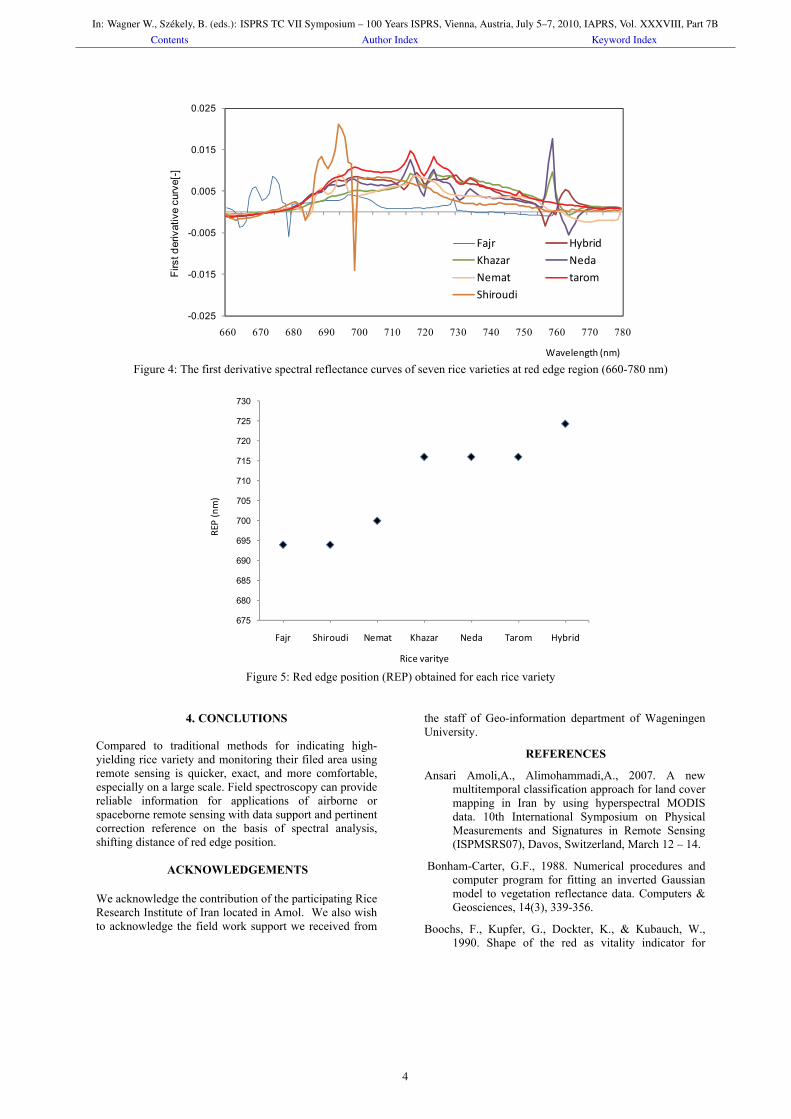
After spectral measurements, the result of performed processes on data was spectral curves at 2500-350 nm wavelengths. All the curves were quality reviewed and the noise spectra in water absorption feature were removed based on the standard deviation of all reflectance values in each wavelength. Figure 3 shows spectral characteristics of studied rice cultivars after necessary prepossessing. The first derivative Curve in the range of red edge wavelengths calculated (Figure 4) and the highest value obtained in this range as the maximum possible slope is determined as the red edge position for each of the seven
cultivars (Fig. 6). Based on these results, the red edge position of the hybrid cultivar was the highest wavelength (724 nm) than the rest of rice cultivars. REP of Tarom, Khazar, Neda was at 716 nm while for Nemat, Shiroudi and Fajr were determined at 700, 694 and 694 nm, respectively (Figure 5). The results showed that Hybrid variety was the most likely variety than the others and has the highest chlorophyll and nitrogen concentrations inverse Shiroudi and Fajr variety based on spectral characteristics.
0
0.1
0.2
0.3
0.4
0.5
0.6
0.7
0.8
0.9
1
350 550 750 950 1150 1350 1550 1750 1950 2150 2350
Ref
lect
ance
[-]
Wavelength (nm)
FajrHybridKhazarNedaNematShiroudiTarom
Figure 3: Spectral reflectance curves of seven rice variety of north of Iran
Red edge region are relatively insensitive to changes of biophysical factors such as soil cover percentage, optical properties, canopy structure, atmospheric effects, irradiance and solar zenith angle (Shafri et al., 2006; Clevers, 1999 and 2000), therefore this region is a reliable range to investigate the biochemical variables form canopy reflectance. The obtained Results from literatures proved the Relationship between chlorophyll and red edge position so that with increasing chlorophyll and nitrogen concentration the REP moves towards the longer wavelengths (Boochs et al, 1990 ؛Curran et al., 1990 ؛Fillella and Penuelas 1994; Shafri et al., 2006). The
obtained results by Nemat Zade and Sattari (2003) also Allah Gholipour (2007) show that Hybrid variety is a high-yielding variety equal to 25-20% times than the other variety in this study. REP of Hybrid rice that positioned at longer wavelength could indicate more chlorophyll/nitrogen concentration and leaf area index, rather than the other varieties. Mutanga and Skidmore (2007) studied the relationship between REP and nitrogen content of grass vegetation. They indicated that nitrogen content correlated well with wavelength at 713nm and 725 nm as determined REP.
In: Wagner W., Székely, B. (eds.): ISPRS TC VII Symposium – 100 Years ISPRS, Vienna, Austria, July 5–7, 2010, IAPRS, Vol. XXXVIII, Part 7BContents Author Index Keyword Index
3
-0.025
-0.015
-0.005
0.005
0.015
0.025
660 670 680 690 700 710 720 730 740 750 760 770 780
Firs
t der
ivat
ive
curv
e[-]
Wavelength (nm)
Fajr HybridKhazar NedaNemat taromShiroudi
Figure 4: The first derivative spectral reflectance curves of seven rice varieties at red edge region (660-780 nm)
675
680
685
690
695
700
705
710
715
720
725
730
Fajr Shiroudi Nemat Khazar Neda Tarom Hybrid
REP
(nm
)
Rice varitye
Figure 5: Red edge position (REP) obtained for each rice variety
44.. CONCLUTIONS
Compared to traditional methods for indicating high-yielding rice variety and monitoring their filed area using remote sensing is quicker, exact, and more comfortable, especially on a large scale. Field spectroscopy can provide reliable information for applications of airborne or spaceborne remote sensing with data support and pertinent correction reference on the basis of spectral analysis, shifting distance of red edge position.
ACKNOWLEDGEMENTS We acknowledge the contribution of the participating Rice Research Institute of Iran located in Amol. We also wish to acknowledge the field work support we received from
the staff of Geo-information department of Wageningen University.
REFERENCES
Ansari Amoli,A., Alimohammadi,A., 2007. A new multitemporal classification approach for land cover mapping in Iran by using hyperspectral MODIS data. 10th International Symposium on Physical Measurements and Signatures in Remote Sensing (ISPMSRS07), Davos, Switzerland, March 12 – 14.
Bonham-Carter, G.F., 1988. Numerical procedures and computer program for fitting an inverted Gaussian model to vegetation reflectance data. Computers & Geosciences, 14(3), 339-356.
Boochs, F., Kupfer, G., Dockter, K., & Kubauch, W., 1990. Shape of the red as vitality indicator for
In: Wagner W., Székely, B. (eds.): ISPRS TC VII Symposium – 100 Years ISPRS, Vienna, Austria, July 5–7, 2010, IAPRS, Vol. XXXVIII, Part 7BContents Author Index Keyword Index
4

plants. International Journal of Remote Sensing, 11 (10), 1741–1753.
Clevers, J.G.P.W., 1999. The use of imaging spectrometry for agricultural applications, ISPRS Journal of Photogrammetry and Remote Sensing, 54 (5), 299–304.
Clevers, J.G.P.W., De Jong, S.M., Epema, G.F., van der Meer, F., Bakker, W., & Skidmore, A.K., 2002. Derivation of the red edge index using MERIS standard band setting. International Journal of Remote Sensing, 23, 3169-3184.
Curran, P.J. Dungan, J.L., & Gholz, H.L., 1990. Exploring the relationship between reflectance red edge and chlorophyll content in slash pine, Tree Physiology 7, 33–48.
Dawson, T.P., & Curran, P.J., 1998. A new technique for interpolating the reflectance red edge position. International Journal of Remote Sensing, 19, 2133–2139.
Fillella, I. && Penuelas, J., 1994. The red edge position and shape as indicators of plant chlorophyll content, biomass and hydric status. International Journal of Remote Sensing, 15,(7), 1459–1470.
Jago, R.A., Cutler, M.E., & Curran, P.J., 1999. Estimating canopy chlorophyll concentration from field and airborne spectra. Remote Sensing of Environment, 68, 217-224.
Allah Gholipour, 2007. (Report in Persian). http://www.agristore.ir/class.aspx?tid=8&sid=41&la=fa
Kamthonkiat,D., Honda, K., Turral, H., Tripathi, N. K., Wuwongse, V., 2005. Discrimination of irrigated and rainfed rice in a tropical agricultural system using SPOT vegetation NDVI and rainfall data. International Journal of Remote Sensing, 26(12), 2527-2547.
Khajedin, S.J., & Pourmanafi, S., 2007. Determination of Rice Paddies Areas Using Digital Data IRS Sensors Around Zayandeh Rud in Isfahan Region, Journal of Science and Technology of Agriculture and Natural Resources, 11(40), 449-464.
Mutanga, O., & Skidmore, A.K., 2007. Red edge shift and biochemical content in grass canopies. ISPRS Journal of Photogrammetry & Remote Sensing, 62, 34-42.
Nemat Zadeh, & G., Sattari, M., 2003. Study some of the nuclear genome of rice cultivars on different fertility control, (Oryza sativa L.) for Hybrid rice seed production. Journal of Agricultural Science (In Persian), Volume 34 (1), 213-219.
Serra, P., More, G., & Pons, X., 2007. Monitoring winter flooding of rice fields on the coastal wetland of Ebre delta with multitemporal remote sensing images. Geoscience and Remote Sensing Symposium, 2007. IGARSS 2007. IEEE International, 2495-2498.
Shafri, H.Z.M., Salleh, M.A.M., & Ghiyamat, A., 2006. Hyperspectral remote sensing of vegetation using red edge position techniques. American Journal of Applied Science, 3(6), 1864-1871.
Shen, Y., Lo, J.C. & Cheng, S.P., 2000. Development of remote sensing techniques to identify nitrogen status of paddy rice. (in Chinese with English abstract). Chin. J. Agromet. 7, 23–32.
Tinetti, G., Rashby, S., & Yung, Y.L., 2006. Delectability of red-edge–shifted vegetation on terrestrial planets orbiting m stars. The Astrophysical Journal, 644, 129–132.
Wang, F. M., Huang, J. F. & Wang, X. Z., 2008. Identification of Optimal Hyperspectral Bands for Estimation of Rice Biophysical Parameters. Journal of Integrative Plant Biology, 50 (3), 291–299.
Xiao, X., Boles, S., Frolking, S., Li, C., Babu, J.Y., Salas, W., & Moore, B., 2006. Mapping paddy rice agriculture in South and Southeast Asia using multi-temporal MODIS images. Remote Sensing of Enviroment. 100, 95–113.
Xue, L., Cao, W., Luo, W., Dai, T., & Zhu, Y., 2004. Monitoring leaf nitrogen status in rice with canopy spectral reflectance. American Society of Agronomy, 96, 135–142.
Yang, C.M., & Cheng, C.H., 2001. Spectral characteristics of rice plants infested by brown planthoppers. Proceedings of Natural Science, 25(3), 180-186.
Yoder, B.J., & Pettigrew-Crosby, R.E., 1995. Predicting nitrogen and chlorophyll content and concentrations from reflectance spectra (400–2500 nm) at leaf and canopy scales, Remote Sensing of Environment, 53(3), 199–211.
In: Wagner W., Székely, B. (eds.): ISPRS TC VII Symposium – 100 Years ISPRS, Vienna, Austria, July 5–7, 2010, IAPRS, Vol. XXXVIII, Part 7BContents Author Index Keyword Index
5


![Concepts and theory: Spectral reflectance, canopy ... · •Link physiology to a predicted Ideotype. ... used to estimate phenology, pests and diseases PI [R 415-R 435]/[R 415 +R](https://img.pdfslide.us/doc/110x75/5f1ac5fc02814456ea34dd26/concepts-and-theory-spectral-reflectance-canopy-alink-physiology-to-a-predicted.jpg)