Embed Size (px)
Citation preview
IntroductionProject Overview
ResultsProject Schedule
DeliverablesReferences
Spectral Clustering on Handwritten DigitsDatabase
Mid-Year Presentation
Danielle [email protected]
Advisor: Kasso [email protected]
Department of Mathematics
University of Maryland- College ParkAdvance Scientific Computing I
December 10, 2015
December 10, 2015Middlebrooks Spectral Clustering on Handwritten Digits Database Mid-Year Presentation
IntroductionProject Overview
ResultsProject Schedule
DeliverablesReferences
Outline
1 Introduction
2 Project Overview
3 Results
4 Project Schedule
5 Deliverables
6 References
Middlebrooks Spectral Clustering on Handwritten Digits Database Mid-Year Presentation
IntroductionProject Overview
ResultsProject Schedule
DeliverablesReferences
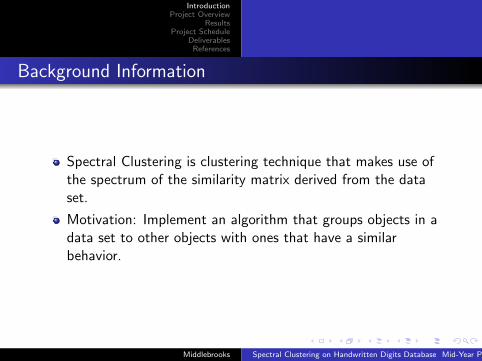
Background Information
Spectral Clustering is clustering technique that makes use ofthe spectrum of the similarity matrix derived from the dataset.
Motivation: Implement an algorithm that groups objects in adata set to other objects with ones that have a similarbehavior.
Middlebrooks Spectral Clustering on Handwritten Digits Database Mid-Year Presentation
IntroductionProject Overview
ResultsProject Schedule
DeliverablesReferences
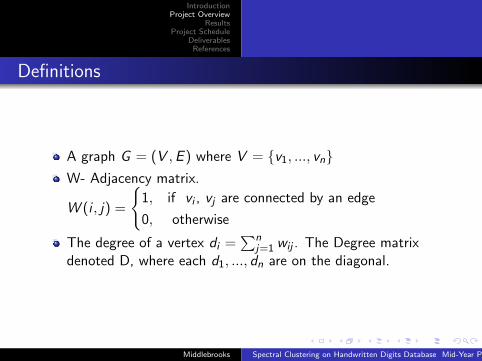
Definitions
A graph G = (V ,E ) where V = {v1, ..., vn}W- Adjacency matrix.
W (i , j) =
{1, if vi , vj are connected by an edge
0, otherwise
The degree of a vertex di =∑n
j=1 wij . The Degree matrixdenoted D, where each d1, ..., dn are on the diagonal.
Middlebrooks Spectral Clustering on Handwritten Digits Database Mid-Year Presentation
IntroductionProject Overview
ResultsProject Schedule
DeliverablesReferences
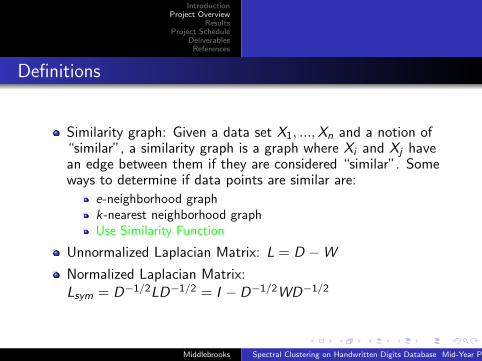
Definitions
Similarity graph: Given a data set X1, ...,Xn and a notion of“similar”, a similarity graph is a graph where Xi and Xj havean edge between them if they are considered “similar”. Someways to determine if data points are similar are:
e-neighborhood graphk-nearest neighborhood graphUse Similarity Function
Unnormalized Laplacian Matrix: L = D −W
Normalized Laplacian Matrix:Lsym = D−1/2LD−1/2 = I − D−1/2WD−1/2
Middlebrooks Spectral Clustering on Handwritten Digits Database Mid-Year Presentation
IntroductionProject Overview
ResultsProject Schedule
DeliverablesReferences
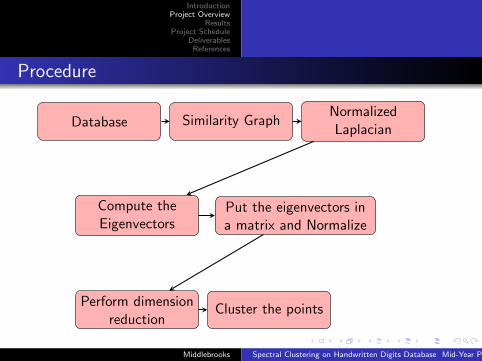
Procedure
Database Similarity GraphNormalizedLaplacian
Compute theEigenvectors
Put the eigenvectors ina matrix and Normalize
Perform dimensionreduction
Cluster the points
Middlebrooks Spectral Clustering on Handwritten Digits Database Mid-Year Presentation
IntroductionProject Overview
ResultsProject Schedule
DeliverablesReferences
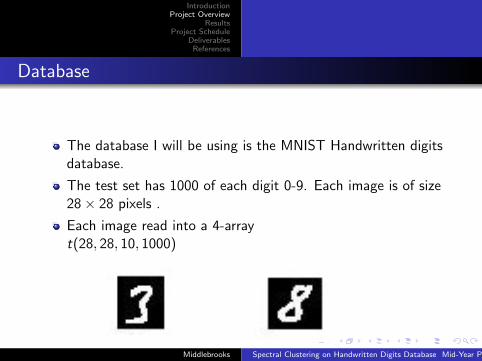
Database
The database I will be using is the MNIST Handwritten digitsdatabase.
The test set has 1000 of each digit 0-9. Each image is of size28× 28 pixels .
Each image read into a 4-arrayt(28, 28, 10, 1000)
Middlebrooks Spectral Clustering on Handwritten Digits Database Mid-Year Presentation
IntroductionProject Overview
ResultsProject Schedule
DeliverablesReferences
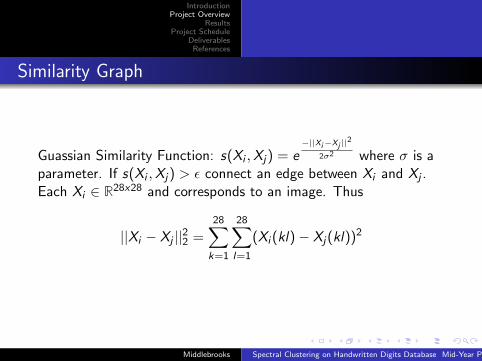
Similarity Graph
Guassian Similarity Function: s(Xi ,Xj) = e−||Xi−Xj ||
2
2σ2 where σ is aparameter. If s(Xi ,Xj) > ε connect an edge between Xi and Xj .Each Xi ∈ R28x28 and corresponds to an image. Thus
||Xi − Xj ||22 =28∑k=1
28∑l=1
(Xi (kl)− Xj(kl))2
Middlebrooks Spectral Clustering on Handwritten Digits Database Mid-Year Presentation
IntroductionProject Overview
ResultsProject Schedule
DeliverablesReferences
Implementation
Personal Laptop: Macbook Pro.
I will be using Matlab R2014b for the coding.
Middlebrooks Spectral Clustering on Handwritten Digits Database Mid-Year Presentation
IntroductionProject Overview
ResultsProject Schedule
DeliverablesReferences
Normalized Laplacian Matrix
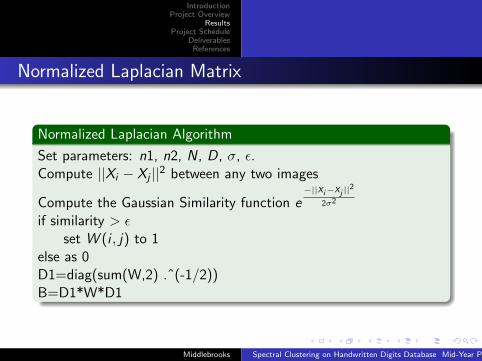
Normalized Laplacian Algorithm
Set parameters: n1, n2, N, D, σ, ε.Compute ||Xi − Xj ||2 between any two images
Compute the Gaussian Similarity function e−||Xi−Xj ||
2
2σ2
if similarity > εset W (i , j) to 1
else as 0D1=diag(sum(W,2) .ˆ(-1/2))B=D1*W*D1
Middlebrooks Spectral Clustering on Handwritten Digits Database Mid-Year Presentation
IntroductionProject Overview
ResultsProject Schedule
DeliverablesReferences
Validation of Normalized Laplacian
Since we know the smallest eigenvalue of the Unnormalizedlaplacian will be zero with eigenvector 1, we can validate ourcomputation of the Unnormlized laplacian or equivalently theNormalized laplacian with eigenvector D1/21
X
Middlebrooks Spectral Clustering on Handwritten Digits Database Mid-Year Presentation
IntroductionProject Overview
ResultsProject Schedule
DeliverablesReferences
Validation of Normalized Laplacian
Since we know the smallest eigenvalue of the Unnormalizedlaplacian will be zero with eigenvector 1, we can validate ourcomputation of the Unnormlized laplacian or equivalently theNormalized laplacian with eigenvector D1/21 X
Middlebrooks Spectral Clustering on Handwritten Digits Database Mid-Year Presentation
IntroductionProject Overview
ResultsProject Schedule
DeliverablesReferences
Computing first K Eigenvectors
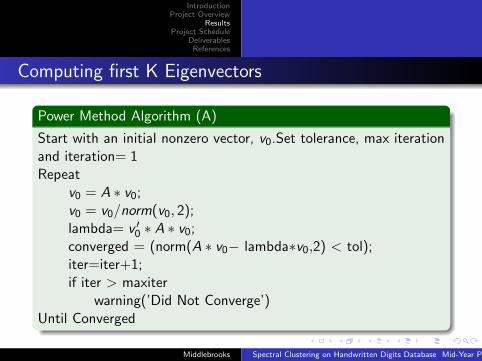
Power Method Algorithm (A)
Start with an initial nonzero vector, v0.Set tolerance, max iterationand iteration= 1Repeat
v0 = A ∗ v0;v0 = v0/norm(v0, 2);lambda= v ′0 ∗ A ∗ v0;converged = (norm(A ∗ v0− lambda∗v0,2) < tol);iter=iter+1;if iter > maxiter
warning(’Did Not Converge’)Until Converged
Middlebrooks Spectral Clustering on Handwritten Digits Database Mid-Year Presentation
IntroductionProject Overview
ResultsProject Schedule
DeliverablesReferences
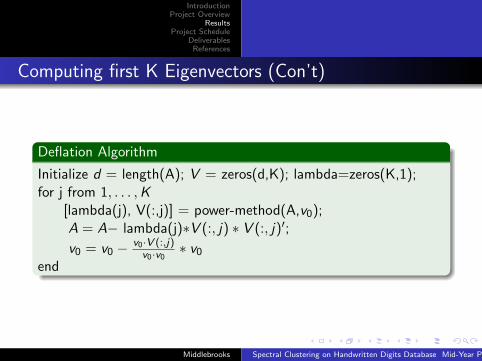
Computing first K Eigenvectors (Con’t)
Deflation Algorithm
Initialize d = length(A); V = zeros(d,K); lambda=zeros(K,1);for j from 1, . . . ,K
[lambda(j), V(:,j)] = power-method(A,v0);A = A− lambda(j)∗V (:, j) ∗ V (:, j)′;
v0 = v0 − v0·V (:,j)v0·v0
∗ v0
end
Middlebrooks Spectral Clustering on Handwritten Digits Database Mid-Year Presentation
IntroductionProject Overview
ResultsProject Schedule
DeliverablesReferences
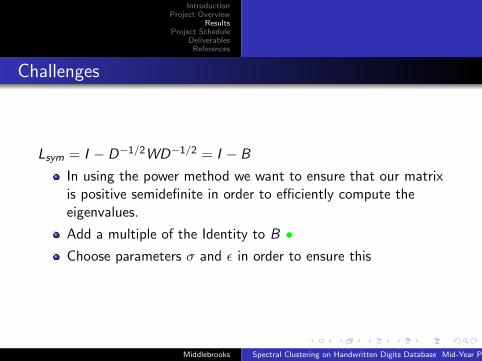
Challenges
Lsym = I − D−1/2WD−1/2 = I − B
In using the power method we want to ensure that our matrixis positive semidefinite in order to efficiently compute theeigenvalues.
Add a multiple of the Identity to B •Choose parameters σ and ε in order to ensure this
Middlebrooks Spectral Clustering on Handwritten Digits Database Mid-Year Presentation
IntroductionProject Overview
ResultsProject Schedule
DeliverablesReferences
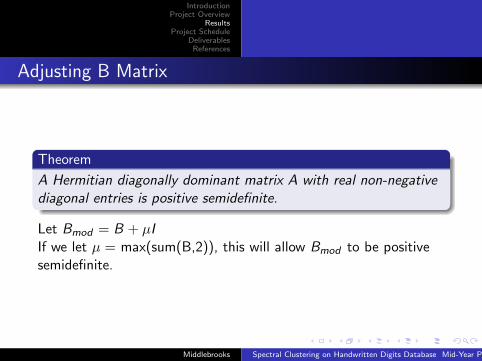
Adjusting B Matrix
Theorem
A Hermitian diagonally dominant matrix A with real non-negativediagonal entries is positive semidefinite.
Let Bmod = B + µIIf we let µ = max(sum(B,2)), this will allow Bmod to be positivesemidefinite.
Middlebrooks Spectral Clustering on Handwritten Digits Database Mid-Year Presentation
IntroductionProject Overview
ResultsProject Schedule
DeliverablesReferences
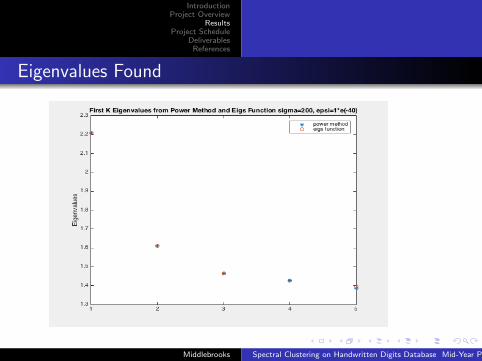
Eigenvalues Found
Middlebrooks Spectral Clustering on Handwritten Digits Database Mid-Year Presentation
IntroductionProject Overview
ResultsProject Schedule
DeliverablesReferences
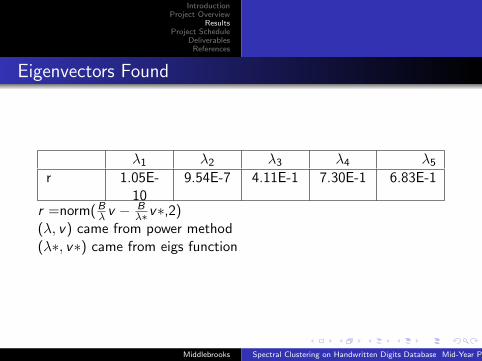
Eigenvectors Found
λ1 λ2 λ3 λ4 λ5
r 1.05E-10
9.54E-7 4.11E-1 7.30E-1 6.83E-1
r =norm(Bλ v −Bλ∗v∗,2)
(λ, v) came from power method(λ∗, v∗) came from eigs function
Middlebrooks Spectral Clustering on Handwritten Digits Database Mid-Year Presentation
IntroductionProject Overview
ResultsProject Schedule
DeliverablesReferences
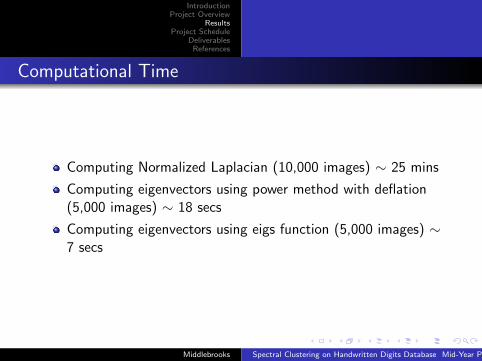
Computational Time
Computing Normalized Laplacian (10,000 images) ∼ 25 mins
Computing eigenvectors using power method with deflation(5,000 images) ∼ 18 secs
Computing eigenvectors using eigs function (5,000 images) ∼7 secs
Middlebrooks Spectral Clustering on Handwritten Digits Database Mid-Year Presentation
IntroductionProject Overview
ResultsProject Schedule
DeliverablesReferences
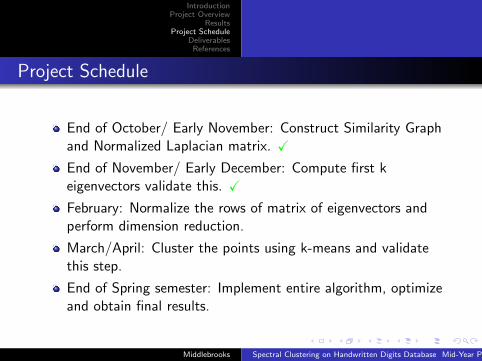
Project Schedule
End of October/ Early November: Construct Similarity Graphand Normalized Laplacian matrix. X
End of November/ Early December: Compute first keigenvectors validate this. X
February: Normalize the rows of matrix of eigenvectors andperform dimension reduction.
March/April: Cluster the points using k-means and validatethis step.
End of Spring semester: Implement entire algorithm, optimizeand obtain final results.
Middlebrooks Spectral Clustering on Handwritten Digits Database Mid-Year Presentation
IntroductionProject Overview
ResultsProject Schedule
DeliverablesReferences
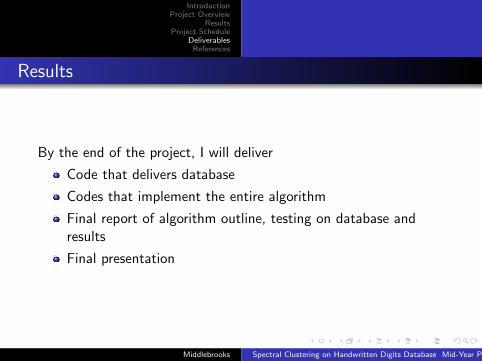
Results
By the end of the project, I will deliver
Code that delivers database
Codes that implement the entire algorithm
Final report of algorithm outline, testing on database andresults
Final presentation
Middlebrooks Spectral Clustering on Handwritten Digits Database Mid-Year Presentation
IntroductionProject Overview
ResultsProject Schedule
DeliverablesReferences
References
[1.] Von Cybernetics, U. A Tutorial on Spectral Clustering.Statistics and Computing, 7 (2007) 4.
[2.] Shi, J. and Malik J. Normalized cuts and image segmentation.IEEE Transations on Pattern Analysis and Machine Intelligence, 22(2000) 8.
[3.] Chung, Fan. Spectral Graph Theory. N.p.: AmericanMathematical Society. Regional Conference Series in Mathematics.1997. Ser. 92.
[4.] Vishnoi, Nisheeth K.Lx = b Laplacian Solvers and theirAlgorithmic Applications. N.p.: Foundations and Trends inTheoretical Computer Science, 2012.
Middlebrooks Spectral Clustering on Handwritten Digits Database Mid-Year Presentation
IntroductionProject Overview
ResultsProject Schedule
DeliverablesReferences
Thank you
Middlebrooks Spectral Clustering on Handwritten Digits Database Mid-Year Presentation


![Final Report of Term Project— ANN for Handwritten Digits ... · Final Report of Term Project— ... Meanwhile, there are available matlab function minimize.m from internet[3]. With](https://img.pdfslide.us/doc/110x75/5e9f5b417e09f46f1b2d81d9/final-report-of-term-projecta-ann-for-handwritten-digits-final-report-of-term.jpg)