Embed Size (px)
Citation preview

Digits - A Dataset for Handwritten Digit Recognition
Alexander K. Seewald
Austrian Research Institute for Artificial IntelligenceFreyung 6/6, A-1010 Vienna, Austria
[email protected], [email protected]
Abstract
In this paper we describe the preprocessingsteps for a contributed digit dataset, goingall the way from a physical page of paper –filled out by students – past digital scanningto computerized segmentation, resizing, andblurring. Surprisingly, very little expertisecan be transferred from other datasets to ournew dataset for a state-of-the-art SVM classi-fier, although the performance for each sepa-rate dataset is acceptable. This may indicatethat at least SVM, and possibly also otherlearners, are sensitive to small changes in pre-processing, emphasizing the need not only tocreate benchmark datasets for handwrittendigit recognition, but also to document theirpreprocessing as detailed as possible and aimto replicate that as well. Our work is a smallstep in that direction.
1 Introduction
Handwritten digit recognition is a major researchtopic. E.g. [3] gives a comprehensive survey of thefield including major feature sets, learning algorithms,and datasets. Contrary to OCR which focusses on therecognition of machine-printed output, where specialfonts can be used and the variability between charac-ters with the same font, size, and font attributes isreasonably small, the inter-person as well as the intra-person variability of handwritten digits is surprisinglyhigh. This makes the recognition problem far morechallenging. On the other hand, the moderate numberof classes1 makes it more amenable to be rephrasedas a classification task even with a relatively smallamount of training data.
110 rather than more than 64 for lowercase and upper-case characters plus digits and comma, dot, colon etc..
In the process of holding a lecture for students at theMedical University in Vienna, we chose to let stu-dents contribute and analyze their own dataset forhandwritten digit recognition. An input page was de-signed on which each student was to write 100 digits,equally distributed among zero to nine. Additionally,each student chose whether to contribute his digits tothe public domain, for further experiments by the au-thor under non-disclosure to third parties, or not con-tribute them at all. 44 students contributed their inputpages, and of these 37 contributed them to the pub-lic domain. The latter data has been made availableat alex.seewald.at/digits, while we continue usingthe larger full data for our own experiments. We arelooking forward to create similarily-sized datasets eachyear, provided the lecture will continue to take place.Others are cordially invited to contribute as well –all our code is available freely for non-commercial pur-poses. Just send us a mail so we know what you intendto do with it, and see if we can help.
We report preliminary results on our and two otherhandwritten digit recognition datasets, and were sur-prised that although the task is always the same, al-most no expertise can be transferred between thesedatsets, even though we followed the known prepro-cessing steps by the letter and also checked formatsimilarity in other ways.
2 Preprocessing
Here, we describe the full processing of our data: fromthe design of the input page over digital scanning, celland digit segmentation towards downscaling and blur-ring.
2.1 Design of input page
Rather than tackling the complex problem of generalsegmentation just to extract the sample digits, wechose an input page layout that makes segmentation

Figure 1: Left: Empty input page, Right: Filled-ininput page after scanning (student data intentionallymade unreadable)
AI Methoden der Datenanalyse VO & LU - Anmeldung & Trainingsdaten 1
Matrikelnummer
Name
0 1 2 3 4 5 6 7 8 9
Bitte tragen Sie handschriftlich die Ziffern 0-9 in die entsprechenden Spalten ein. Versuchen Sienicht, besonders schon zu schreiben, sondern so wie immer. Jede Ziffer sollte ungefahr in der Mittedes Kastchens sein. Arbeiten Sie zugig und ruhig in Ihrem gewohnten Tempo.Die Daten werden eingescannt, anonymisiert und digital weiterverarbeitet, und bilden Trainings-daten fur die Laborubung. Sollten Sie aus irgendwelchen Grunden Beispiele Ihrer Handschrift nichtzur Verfugung stellen wollen, dann tragen Sie bitte keine Ziffern ein.
Ich bin damit einverstanden, daß nach Abschluß der LVA die von mir erstellten Daten:
2 fur weitere Forschungsprojekte des Lehrveranstaltungsleiter verwendet werden konnen, al-lerdings ohne Weitergabe an dritte Personen (aquivalent einem Non-Disclosure Agreement)
2 der Allgemeinheit zur Verfugung gestellt werden (zB im UCI Data Mining Repository)
Zutreffendes bitte ankreuzen!
relatively easy, see the left side of Figure 1. A tableconsists of horizontal and vertical lines, which are rec-ognizable in the horizontal and vertical histograms asmajor peaks, where adjacent peaks have the same dis-tance – namely the width and height of each cell. Seealso Figure 2.
Additionally, each student wrote their student ID(fully numeric) on the first line of the page, above thetable. As we know each student’s id, this data could inthe future be used to develop and test approaches tohandwritten digit segmentation, but is currently un-used as the number of samples is too small.
2.2 Scanning
The right side of Figure 1 shows a filled-in inputpage after scanning with 600 dpi on a Canon IR 2200with automatic document feeder. The output was4950x6996 pixels in size. The Canon generally doesa very good job to map grayscale values to black-and-white – one student writing with a pencil and anotherwho wrote with a red pen were both mapped to black-and-white reasonably well, and the classification accu-racy does not suffer unduly.
2.3 Cell Segmentation
Although we had full control over the input page, seg-mentation was still somewhat tricky. Figure 2 showsthe horizontal and vertical histograms extracted froma sample scanned input page. For preprocessing weused the open-source ImageMagick C/C++ library(www.imagemagick.org) plus several hundred lines ofC code.
The horizontal histogram was less problematic to an-alyze. The top 11 peaks usually corresponded to the
Figure 2: Scanned input page with horizontal and ver-tical histograms
eleven vertical lines of the table. However, in somecases one of the top 11 peaks included at least one setof digits which were exceptionally well aligned alongthe vertical axis. Since these were always near a largerpeak, we chose to ignore peaks which were less thanabout half the cell size (in pixels) away from a largerpeak. This parameter was called MERGE_INTERVAL
and set to 150, as the cell size of the table is around300x300 pixels at 600dpi. All parameter values are inpixels and need to be adjusted for different resolutionsand/or page sizes.
For the vertical histogram, we used the same ap-proach with the same value of MERGE_INTERVAL. Un-fortunately there were a lot of high peaks correspond-ing to the base lines of the machine-printed text onthe top and the bottom of the page, which wereregularily confused with lines from the table. Thisshould not come as a surprise, since yertical his-tograms are used to determine the position of linesof text in OCR, and there are about a dozen linesof machine-printed text on the page. Therefore, wehad to ignore intervals at the top and bottom of thepage (i.e. 0 to EXCLUDE_VERTICAL_TO (1500), andEXCLUDE_VERTICAL_FROM (4850) to 6996 pixels).
The initial analysis from the histograms gives us a setof coordinates that determine the positions and sizesfor each cell. However, as we can see from Figure 3 (leftside) the lines are not perfectly axis-parallel horizontal
or vertical lines as the automatic page feeder does notalign the page perfectly. Additionally, each page wasaligned differently. As we already had a good approx-imation of line positions, we chose to refine them asfollows.
For each horizontal line in the table (previously es-timated by the vertical histogram), we searched forthe true line along each point in the middle be-tween two adjacent crossing vertical lines. Thesearch was done in the vertical axis-parallel direc-tion (± SEARCH_ARRAYLINE_INTERVAL (20), i.e. be-tween 20 pixels below and above the midpoint). Aline was defined as the nearest sequence of more thanIGNORE_SIZE (2) black pixels within the searched in-terval, and the central pixel was used as the true lineposition in that case. This gives at most 10 samples(x,y) for the true line position. In reality, the num-ber was smaller as not in all cases the line could befound2. To exactly define one line in 2D, two sam-ple points would be sufficent. To get a very robustapproximation of the true line position, we appliedlinear regression to all found position samples. Thesame approach was used for the vertical lines, i.e. us-ing the midpoint between two adjacent crossing hor-izontal lines, and searching in horizontal axis-paralleldirection.
Figure 3 shows the improvement of using just hori-zontal and vertical histograms versus refinement withour local search approach and linear regression. Therefinement procedure outlined here captures the exacttable positions almost perfectly for all our scanned in-put pages. However, in one of our scanned pages ascanning error in the form of a 1-point thin horizontalline somewhere within the table region led to a mis-take in the positioning of a single horizontal line andfive samples in the corresponding columns were madeunusable. Increasing SEARCH_ARRAYLINE_INTERVAL
solves this, but introduces more serious errors. Fur-ther work is needed to recover from these kinds of er-rors, which seem to appear in about 2% of all scannedpages.
2.4 Digit Segmentation
What remains to be done is to extract one sampledigit from each cell that is defined by the vertical andhorizontal lines of the table, which have already beenreconstructed in the last step. We can no longer as-sume the lines to be perfectly horizontal and vertical.However, this is desirable for an efficient algorithm,so as first step we determined the largest axis-parallelrectangle which fits into the parallelogram given by the
2In that case, it either was connected to a digit or bro-ken by white speck noise at the midpoint.
four crossing-points of adjacent horizontal and verticallines defining each cell.
This rectangle is in an all black area, i.e. almost allof the pixels along the border of this rectangle shouldbe black. To get into the inner area of the cell, thesize of the rectangle is reduced pixel by pixel sym-metrically around its center until less than one fiftieth(THRESHOLD_PERCENT_INVERSE (50)), i.e. 2%, of itsborder pixels are black. This yields the largest rect-angle within the cell, i.e. on the outer border of thewhite area in which we expect the digit to be.
To enclose the digit, the size of the rectangle is re-duced pixel by pixel, for each side separately. Foreach side, the size is reduced until at least one fiftieth(THRESHOLD_PERCENT_INVERSE_2 (50)), i.e. 2%, of theborder pixels from that side are black for five consec-utive steps. The size is afterwards increased by thesame amount so that no part of the digit is lost. Thiswas found to be a very efficient way to handle specknoise, provided it is not connected with the digit. Thefinal result is the smallest rectangle that contains thedigit, so segmentation is complete.
Five samples could not be recovered in this segmen-tation step, as the cells contained parts from severaldigits due to overlap between the contents of differ-ent cells. All in all the segmentation was successful:99.71% of the contributed digits were successfuly seg-mented by our algorithm, and half of the unusablesamples came from a single scanning error which couldeasily be corrected by rescanning the incorrect page(see last section), or by further improvements to cellsegmentation.
2.5 Resizing and Blurring
There are two different ways to normalize the size ofa digit: One, we may resize the digit by leaving itsproportions intact. We called this 1:1 scaling. Whilethis gives a natural-looking digit, a tall digit will havemany white pixels just because of its proportion, andthese do not contribute much to the recognition pro-cess. Two, we may resize the digit arbitrarily to usethe available space as fully as possible, and have thelearning algorithms cope with the resulting distortions.We called the latter approach arbitrary scaling.
Downscaling always means a loss of information. Ifwe were to downscale to a black-and-width bitmap,the loss of information would be quite huge. There-fore, downscaling is usually done to a grayscale bitmapwhere the gray values still retain some information ofthe distribution of black pixels within each downscaledpixel. We used the Mitchell filter from ImageMagickfor downscaling, which was default for that operation.It has a parameter to control blurring. A setting of 0.5

Figure 3: Left: Horizontal/vertical lines from histograms, Right: Refined via local search and linear regression.
Figure 4: Left: b=0.5, 1:1 scaling; Right: b=2.5, arbi-trary scaling
gives natural-looking digits with sharp edges. A set-ting of 2.5 with arbitrary scaling gives blurred-lookingdigits but improves classification performance. Fig-ure 4 shows the former setting on the left, and thelatter on the right.
All in all, a setting of blur=2.5 for the Mitchell fil-ter and arbitrary scaling to 16x16 pixels were foundto give the best results with several different classi-fiers. In fact, for arbitrary scaling to 16x16 pixels,the test set error as a function of blur was found to
be approximately quadratic with a global minimum atblur=2.5. We have also prepared the digits in MNISTand USPS-compatible format for the expertise trans-ferral experiments.
2.6 MNIST and USPS
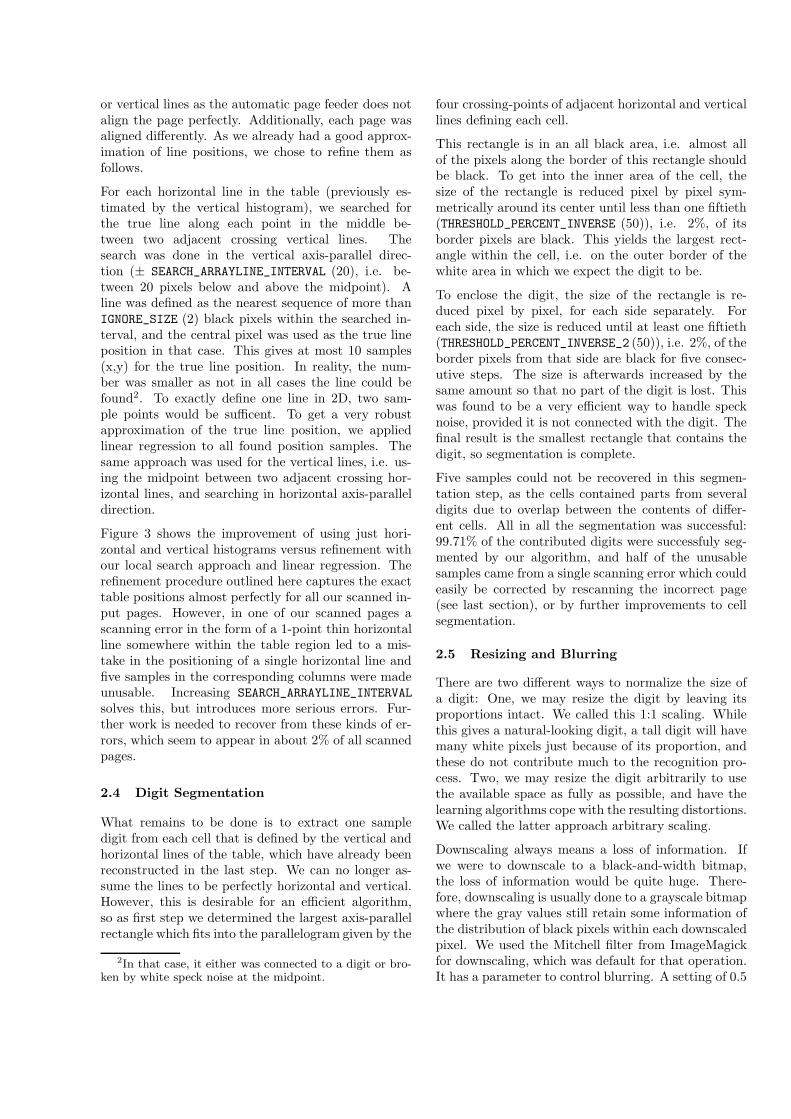
The US Postal (USPS) handwritten digit dataset is de-rived from a project on recognizing handwritten digitson envelopes [1]. The digits were downscaled to 16x16pixels and 1:1 scaled. The training set has 7291 sam-ples, and the test set has 2007 samples. We have out-put our digits in a similar format by using 1:1 scalingplus Mitchell filter downsampling with blur=0.5. Thisyields the most similar grayscale histogram to USPS.Figure 5 shows samples from USPS and from our re-formatted dataset.
The MNIST dataset, one of the most famous in digitrecognition, is derived from the NIST dataset, and hasbeen created by Yann LeCun [2]. The digits fromNIST were downscaled to 20x20 pixels and centeredin a 28x28 pixel bitmap by putting center-of-gravityof the black pixels in the center of the bitmap. It
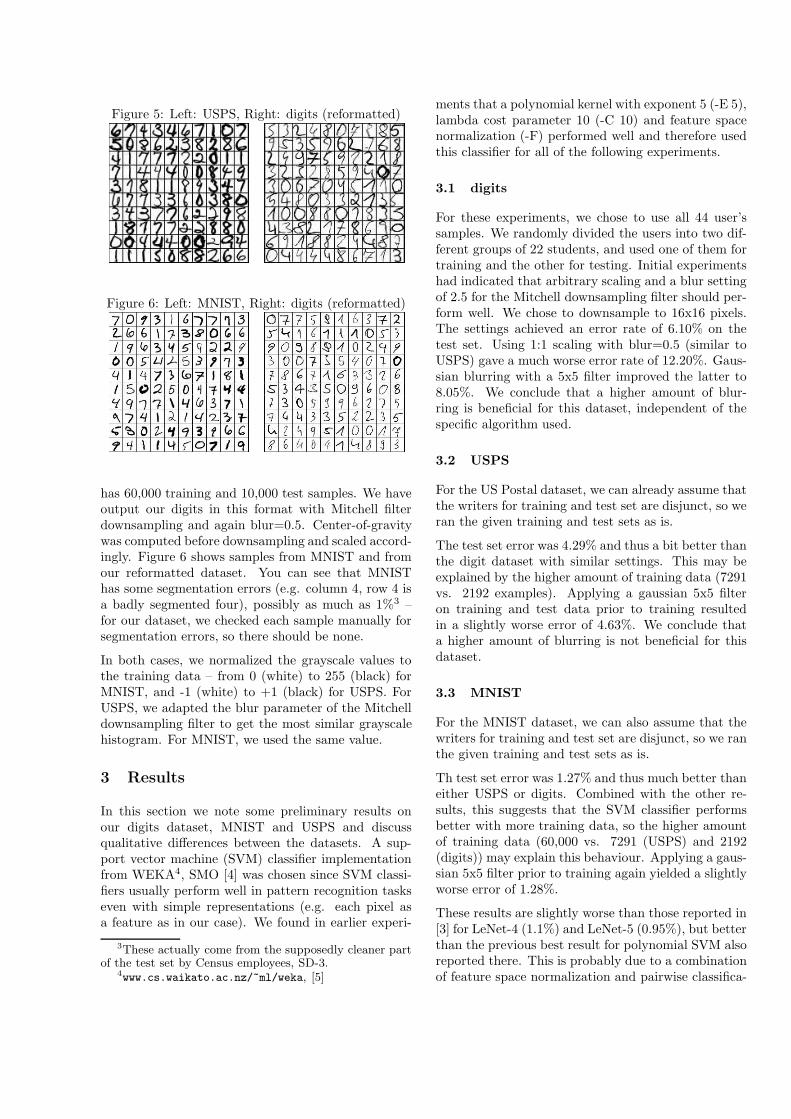
Figure 5: Left: USPS, Right: digits (reformatted)
Figure 6: Left: MNIST, Right: digits (reformatted)
has 60,000 training and 10,000 test samples. We haveoutput our digits in this format with Mitchell filterdownsampling and again blur=0.5. Center-of-gravitywas computed before downsampling and scaled accord-ingly. Figure 6 shows samples from MNIST and fromour reformatted dataset. You can see that MNISThas some segmentation errors (e.g. column 4, row 4 isa badly segmented four), possibly as much as 1%3 –for our dataset, we checked each sample manually forsegmentation errors, so there should be none.
In both cases, we normalized the grayscale values tothe training data – from 0 (white) to 255 (black) forMNIST, and -1 (white) to +1 (black) for USPS. ForUSPS, we adapted the blur parameter of the Mitchelldownsampling filter to get the most similar grayscalehistogram. For MNIST, we used the same value.
3 Results
In this section we note some preliminary results onour digits dataset, MNIST and USPS and discussqualitative differences between the datasets. A sup-port vector machine (SVM) classifier implementationfrom WEKA4, SMO [4] was chosen since SVM classi-fiers usually perform well in pattern recognition taskseven with simple representations (e.g. each pixel asa feature as in our case). We found in earlier experi-
3These actually come from the supposedly cleaner partof the test set by Census employees, SD-3.
4www.cs.waikato.ac.nz/~ml/weka, [5]
ments that a polynomial kernel with exponent 5 (-E 5),lambda cost parameter 10 (-C 10) and feature spacenormalization (-F) performed well and therefore usedthis classifier for all of the following experiments.
3.1 digits
For these experiments, we chose to use all 44 user’ssamples. We randomly divided the users into two dif-ferent groups of 22 students, and used one of them fortraining and the other for testing. Initial experimentshad indicated that arbitrary scaling and a blur settingof 2.5 for the Mitchell downsampling filter should per-form well. We chose to downsample to 16x16 pixels.The settings achieved an error rate of 6.10% on thetest set. Using 1:1 scaling with blur=0.5 (similar toUSPS) gave a much worse error rate of 12.20%. Gaus-sian blurring with a 5x5 filter improved the latter to8.05%. We conclude that a higher amount of blur-ring is beneficial for this dataset, independent of thespecific algorithm used.
3.2 USPS
For the US Postal dataset, we can already assume thatthe writers for training and test set are disjunct, so weran the given training and test sets as is.
The test set error was 4.29% and thus a bit better thanthe digit dataset with similar settings. This may beexplained by the higher amount of training data (7291vs. 2192 examples). Applying a gaussian 5x5 filteron training and test data prior to training resultedin a slightly worse error of 4.63%. We conclude thata higher amount of blurring is not beneficial for thisdataset.
3.3 MNIST
For the MNIST dataset, we can also assume that thewriters for training and test set are disjunct, so we ranthe given training and test sets as is.
Th test set error was 1.27% and thus much better thaneither USPS or digits. Combined with the other re-sults, this suggests that the SVM classifier performsbetter with more training data, so the higher amountof training data (60,000 vs. 7291 (USPS) and 2192(digits)) may explain this behaviour. Applying a gaus-sian 5x5 filter prior to training again yielded a slightlyworse error of 1.28%.
These results are slightly worse than those reported in[3] for LeNet-4 (1.1%) and LeNet-5 (0.95%), but betterthan the previous best result for polynomial SVM alsoreported there. This is probably due to a combinationof feature space normalization and pairwise classifica-

tion. Note that based on our estimation of around 1%segmentation errors, errors below that value may notbe significantly different from zero.
3.4 Transferring expertise over datasets
We were interested in determining if expertise can betransferred over datasets, i.e. if models trained forMNIST or USPS were able to classify our full digitdataset with comparable error rates. For a realisticdigit recognition system, this is an essential feature.It turned out that is not the case: when training onMNIST, the test set error is 30.39% when tested onthe full digit dataset; and when training on USPS, theerror is 49.03%. In each case we used the appropriatelyreformatted digits dataset. Switching off the SVM in-put data normalization (-N 2) did not improve on theseresults. While the baseline error of 90% was greatlyimproved, the performance is still orders of magnitudeworse than could be expected from previous results.It seems that at least the SVM classifier is suscep-tible to small differences in preprocessing which areinsufficiently documented for MNIST and USPS, e.g.the algorithm used for downsampling and its settings.This weakness may also apply to other classifiers.
3.5 Human error
We chose 100 random samples from the digits datasetand asked our students to classify them in small groupsof around 2-4 people. The error rate of human classi-fication according to this experiment is around 0.67%.As many datasets, among them USPS and MNIST,use human expertise to determine the true class of adigit, there is likely to be some class noise in all thesedatasets additionally to the segmentation errors whichwe already noticed. It should be noted that the digitswere given in the format of digits (i.e. blurred andarbitrarily scaled, see Figure 4 (right)), and due to thedata collection procedure there was no context aroundeach digit. Both might have increased the human errorrate.
4 Conclusion
We have created a new handwritten digit recognitiondataset from scratch, with the help of students for theAI Methods of Data Analysis class of 2005. Whilethe collected dataset is still small, we have noted somesurprising results concerning the generality of hand-written digit recognizers.
One general observation is that the error rate for SVMssinks with higher amounts of training data, usuallydrastically. From our digits dataset over USPS andfinally MNIST, this is indeed the case. In the same
direction, the influence of blurring on the performanceis reduced: Blurring helps on our small digit dataset,but has little effect on USPS or MNIST. We think thatwith more data, SVMs create more robust models andare therefore less influenced by blurring.
However, the inability to transfer expertise over toother similar datasets is worrying and indicates thata general purpose handwritten digit recognizer is stillsome way in the future.
The most obvious lesson from this is that for a state-of-the-art recognizer, it is best to train it on self-collecteddata. Using publicly available datasets for this pur-pose seems to work very badly, and it is unlikely thatthe published error rates can be reproduced on one’sown data – as we found out. However, significantamounts of training data seem to be needed for state-of-the-art performance. Pooling datasets from multi-ple sources may be an option, as would be to comparewith datasets where preprocessing is more comprehen-sively documented. We intend to address these ques-tions in future work.
5 Acknowledgements
The Austrian Research Institute for Artificial Intelli-gence is supported by the Austrian Federal Ministry ofEducation, Science and Culture and by the AustrianFederal Ministry for Transport, Innovation and Tech-nology. We gratefully acknowledge the support of thestudents of AI Methods of Data Analysis, class 2005.
References
[1] Hastie, T., Tibshirani, R., Friedman, J.H. The Ele-ments of Statistical Learning. July 2003, Springer,Berlin/Heidelberg. ISBN 0387952845.
[2] Y. LeCun, L. Bottou, Y. Bengio, and P.Haffner. ”Gradient-based learning applied to doc-ument recognition.” Proceedings of the IEEE,86(11):2278-2324, November 1998.
[3] Liu, L., Nakashima, K., Sako, H., Fujisawa, H.Handwritten digit recognition: benchmarking ofstate-of-the-art techniques. In Pattern Recogni-tion, 36 (2003), pp. 2271–2285.
[4] Platt, J. Fast Training of Support Vector Machinesusing Sequential Minimal Optimization. Advancesin Kernel Methods - Support Vector Learning, B.Scholkopf, C. Burges, and A. Smola, eds., MITPress, 1998.
[5] Ian H. Witten and Eibe Frank (2005) ”Data Min-ing: Practical machine learning tools and tech-niques”, 2nd Edition, Morgan Kaufmann, SanFrancisco, 2005.