Embed Size (px)
Citation preview
•O«=>OsCM
A TECHNICAL :-MEMORANDUM
4
NASA TM X-2906
•At
)• ;f ,f
MEASURED AND CALCULATEDSPECTPvA IN A DEPLETED URANIUM AND .LITHIUM HYDRIDB SHIELDED REACTOR
by Gerald P. Lahti and Robert A, Mueller
Lewis Research Center
Cleveland, Ohio 44135
* Ar
•-<t"
,*
SATIONAL AERONAUTICS AND SPACE ADMINISTRATION * WASHINBTON, D. L * OCTOBER 1973
https://ntrs.nasa.gov/search.jsp?R=19730024861 2020-06-03T13:04:05+00:00Z
1. Report No.
NASA TM X-29064. Title and Subtitle
MEASURED AND CALCULATE
IN A DEPLETED URANIUM ANSHIELDED REACTOR
7. Author(s)
Gerald P. Lahti and Robert A.
9. Performing Organization Name and Address-
Lewis Research CenterNational Aeronautics and SpaceCleveland, Ohio 44135
12. Sponsoring Agency Name and Address
National Aeronautics and SpaceWashington, D.C. 20546
2. Government Accession No.
D FAST NEUTRON SPECTRA[D LITHIUM HYDRIDE
Mueller
Administration
Administration
3. Recipient's Catalog No.
5. Report DateOctober 1973
6. Performing Organization Code
8. Performing Organization Report No.
E-748510. Work Unit No.
503-05
11. Contract or Grant No.
13. Type of Report and Period Covered
Technical Memorandum14. Sponsoring Agency Code
15. Supplementary Notes
16. AbstractMeasurements of MeV neutron spectra were made at the surface of a lithium hydride and de-pleted uranium shielded reactor. Four shield configurations were considered: these wereassembled progressively with cylindrical shells of 5-centimeter-thick depleted uranium,13-centimeter-thick lithium hydride, 5-centimeter-thick depleted uranium, and 3-centimeter-thick depleted uranium. Measurements were made with a NE-218 scintillation spectrometer;proton pulse height distributions were differentiated to obtain neutron spectra. Calculationswere made using the two-dimensional discrete ordinates code DOT and ENDF/B (version 3)cross sections. Good agreement between measured and calculated spectral shape was ob-served. Absolute measured and calculated fluxes were within 50 percent of one another; ob-served discrepancies in absolute flux maybe due to cross-section errors.
17. Key Words (Suggested by Author(s))
Shielding materialsNeutron spectra
18. Distribution Statement
Unclassified - unlimited
19. Security Classif. (of this report)Unclassified
20. Security Classif. (of this page)Unclassified
21. No. of Pages
1422. Price'Domestic, $2.75Foreign, $5.25
* For sale by the National Technical Information Service, Springfield, Virginia 22151
MEASURED AND CALCULATED FAST NEUTRON SPECTRA IN A DEPLETED
URANIUM AND LITHIUM HYDRIDE SHIELDED REACTOR
by Gerald P. Lahti and Robert A. Mueller
Lewis Research Center
SUMMARY
Measurements of MeV neutron spectra were made at the surface of a cylindricalshield arrangement surrounding a small (25.4-cm diam), cylindrical uranyl fluoride(UO^Fn) - water solution reactor. Four shield configurations were considered: Thesewere assembled consecutively with cylindrical shells of 5-centimeter-thick depleted ura-nium, 13-centimeter-thick lithium hydride, 5-centimeter-thick depleted uranium, and3-centimeter-thick depleted uranium. Measurements were made using a NE-218 scin-tillation spectrometer. Proton recoil pulse height distributions were differentiated toobtain neutron spectra. Calculations of leakage flux were made with the two-dimensionaldiscrete ordinates code DOT using ENDF version 3 cross sections. Comparisons of ex-perimental and calculated results on an absolute basis show some deviations, with thedeviations growing with increasing shield thickness. This discrepancy may be due tocross-section errors. However, excellent agreement between measured and calculatedspectral shapes was observed.
INTRODUCTION
The design of a minimum weight shield for a nuclear power reactor requires con-fidence in calculations and cross-section data. To check neutron transport calculations,a number of transmission experiments were conducted using both small neutron sourcesand the NASA Zero-Power Reactor Facility. This series of experiments first examinedgeometrically clean spherical configurations of lead and other materials (refs. 1 and 2)and then cylindrical configurations of lead and water (ref. 3).
The present report describes calculations and measurements made for the cylin-drical reactor surrounded by alternate layers of depleted uranium and lithium hydride.Calculations were made using the two-dimensional discrete ordinates transport code
DOT (refs. 4 and 5). Neutron cross sections were from ENDF/B (version 3) files; thebasic data were collapsed to a 43-group multigroup library using SUPERTOG-1H (ref. 6).Measurements were made using a 1.22-centimeter inside diameter by 1. 27-centimeterlong NE-218 scintillator. The measurements of proton recoil spectra were differentiatedusing the TUNS code (ref. 7) to obtain neutron spectra.
EXPERIMENTAL SETUP
Facility
The test facility used in these experiments is the NASA Zero Power Reactor Facil-ity. The uranyl fluoride - water solution reactor in this facility is 25.4 centimeters indiameter, and, depending on the fuel concentration and reflector material, can be oper-ated at heights up to 76 centimeters. The reactor is licensed to operate at a maximum
12of 100 watts thermal (total neutron source strength of about 8x10 neutrons/sec). Thereactor vessel is 0. 278 centimeter thick and is made of AISI 316 stainless steel. Thereactor is surrounded by a 244-centimeter-diameter by 104-centimeter-deep cylindricaltank; shielding materials may be arranged about the reactor in this tank.
Present Experimental Setup
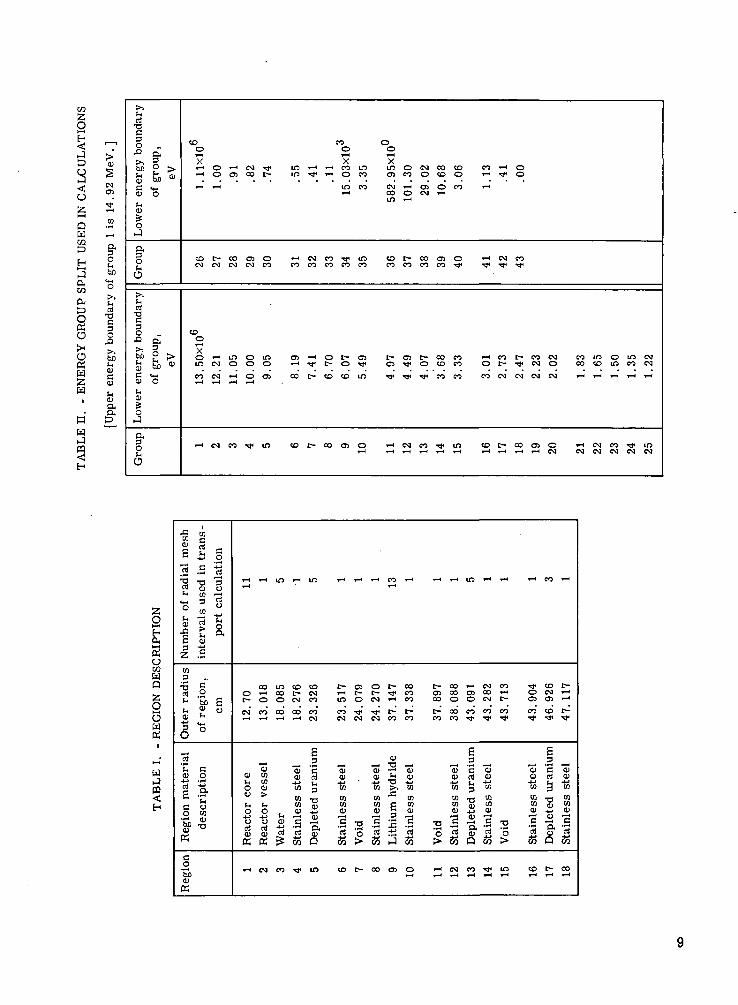
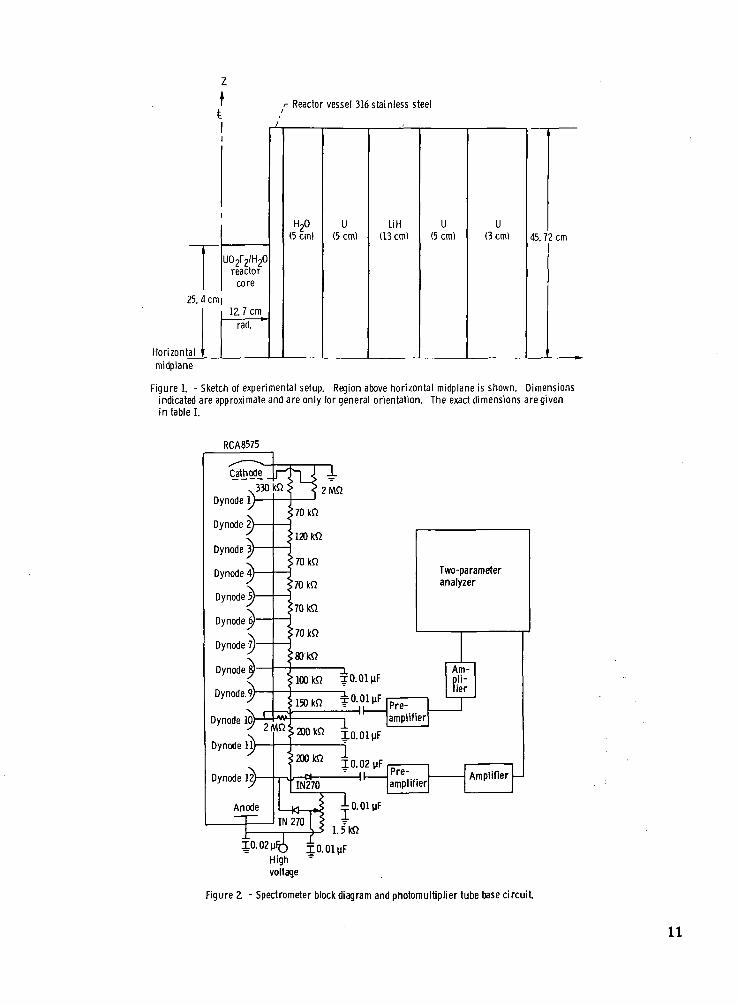
The present experimental setup is illustrated schematically in figure 1. Exact di-mensions and material descriptions are given in table I. The reactor is surrounded by91-centimeter-high cylindrical shells of water (5 cm), depleted uranium (5 cm thick),lithium hydride (13 cm thick) followed by two more of depleted uranium (5 cm and 3 cmthick). Midplane measurements of the neutron transmission were made for these fourconfigurations:
(1) Core plus water plus the first 5-centimeter-thick depleted uranium layer(2) Configuration 1 plus a 13-centimeter-thick lithium hydride layer(3) Configuration 2 plus a 5-centimeter-thick depleted uranium layer(4) Configuration 3 plus a 3-centimeter-thick depleted uranium layer.
The thicknesses of these layers correspond roughly to those considered for space powerreactor shields. The midplane measurements were made with the detector at the outersurface of each configuration.
Shield Material Fabrication
The depleted uranium shells were rolled from plate and canned with 0.19 centimeter(75 mil thick) stainless steel. The lithium hydride shells were cast in segments usingtechniques developed in connection with the Atomic Energy Commission's SNAP reactorprogram. The lithium hydride was internally reinforced using a stainless-steel honey-comb matrix. About a 94-percent theoretical density of lithium hydride was achieved inthose castings. Details of this lithium hydride casting may be found in reference 8.
MEASUREMENTS
Spectrometer
Measurements of the neutron spectra emerging from the shield assembly were madeat the horizontal midplane using a 1. 22-inside-diameter by 1. 27-centimeter-long NE-218scintillator. The scintillator was optically coupled to an RCA 8575 photomultiplier tubeusing a 1. 3-centimeter light pipe. A modified Owens type of pulse shape circuit (as de-scribed in ref. 9) was used. This circuit is used with a two-parameter pulse-height an-alyzer to separate proton recoil (neutron-induced scattering events) and electron recoil(gamma-ray-induced scattering events) occurring within the scintillator. A spectrometerblock diagram is illustrated in figure 2. The proton recoil region of the two-parameteranalyzer data was summed using the PREJUD code (ref. 10); the output data fromPREJUD was then differentiated using the TUNS code (ref. 7) to obtain neutron spectra.Reference 7 also contains more details on this experimental technique.
Power Calibration
To compare calculated results with the experimental measurements on an absolutebasis, both were normalized to correspond to a reactor thermal power level of 1 watt.The reactor power was calibrated by mapping the thermal flux within the reactor withdysprosium foils, which had previously been calibrated against indium foils. The totalfission rate was then calculated from the thermal neutron flux level determined by thesefoil measurements. This was then correlated with integral counting data taken over theperiod of measurement using a helium-3 proportional counter. The helium-3 propor-tional counter data was then used to determine reactor power levels for all othermeasurements.
Experimental Error
Systematic errors. - The uncertainty in the absolute power level of the reactor isestimated to be ±15 percent. Because of the nature of the method of determining powerlevel, this relative error will be approximately constant throughout the present series ofexperiments and is one possible source of systematic error. The relative power leveluncertainty is less than 5 percent.
Another source of systematic error is introduced through the detector efficienciesused in the spectrum unfolding code. The efficiency data used was that for a slightly dif-ferent detector and was measured without a light pipe between the detector and the photo-multiplier tube. One test measurement, however, showed little difference in efficienciesbetween the detector systems; thus, only a small error is anticipated from thisuncertainty.
Random errors. - Counting statistics introduce a random error to the measure-ments. These are represented by the error bars appearing in the plots of experimentallymeasured neutron spectra and are an inverse measure of the count rate observed.
CALCULATIONS
The leakage flux per unit energy in the four experimental configurations describedearlier was calculated using the two-dimensional discrete ordinates code DOT. DOT wasrun in a reactivity-calculation mode to account for neutron production in the outer ura-nium layers. A symmetric S-8 (48 angle) quadrature and P-3 scattering approximationswere used. The experiment was mocked up for calculation as described in table I.Table I also lists the number of radial mesh intervals considered. Midplane symmetrywas assumed; 27 axial intervals were used in the calculation. Table n lists boundariesfor the 43-group split used in the calculations. The top 30 groups correspond to a leth-argy split of Au = 0.1. The resonance and thermal groups were necessary in the cal-
poc 9^Rculation because of the neutron production in both u and u in the depleted uraniumshield layers.
Multigroup cross sections used were assembled from ENDF/B (version 3) data usingthe SUPERTOG-m code. Data for several elements were taken from GAM-H files. Thesources of cross-section data used is listed in table IH. Macroscopic cross sectionswere assembled using atom densities listed in table IV.
COMPARISON OF MEASURED AND CALCULATED -SPECTRA
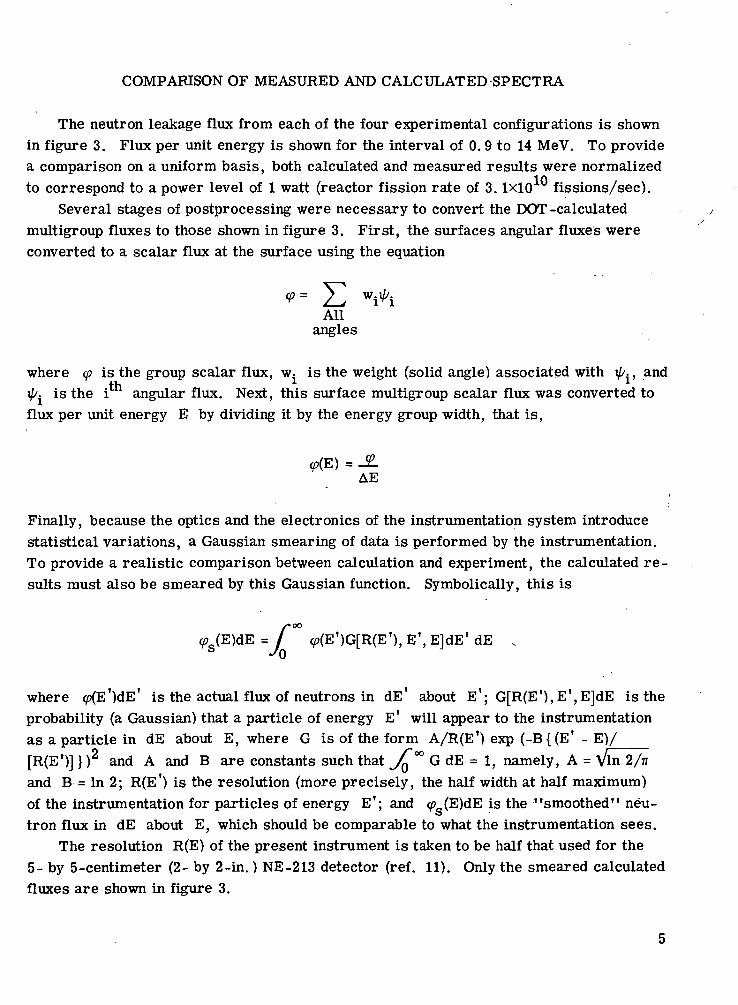
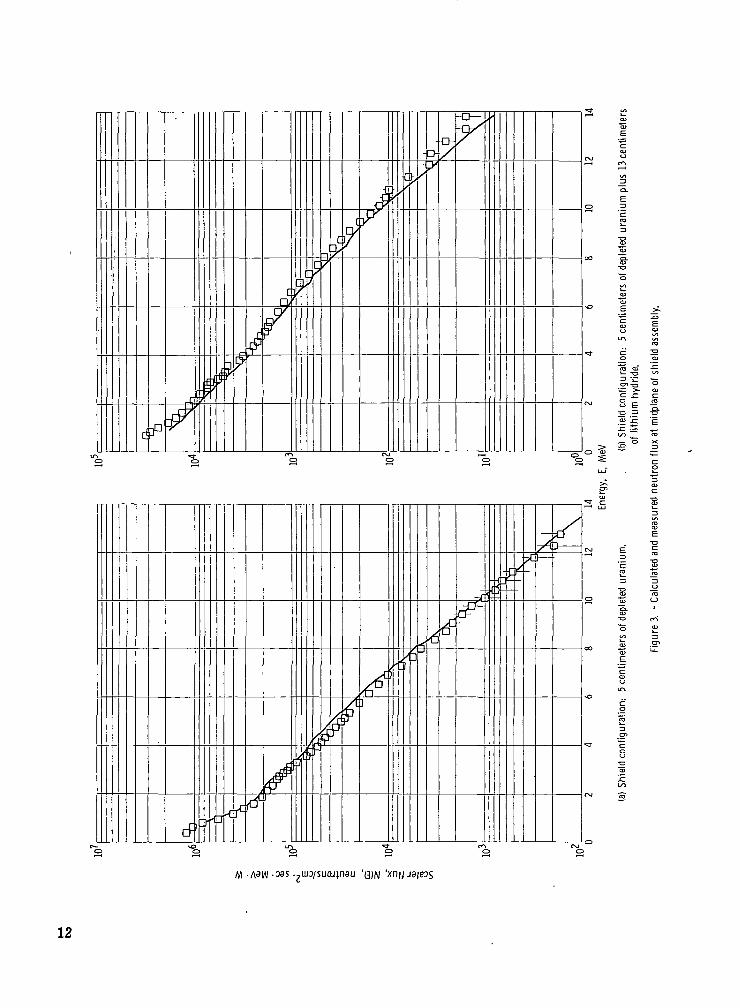
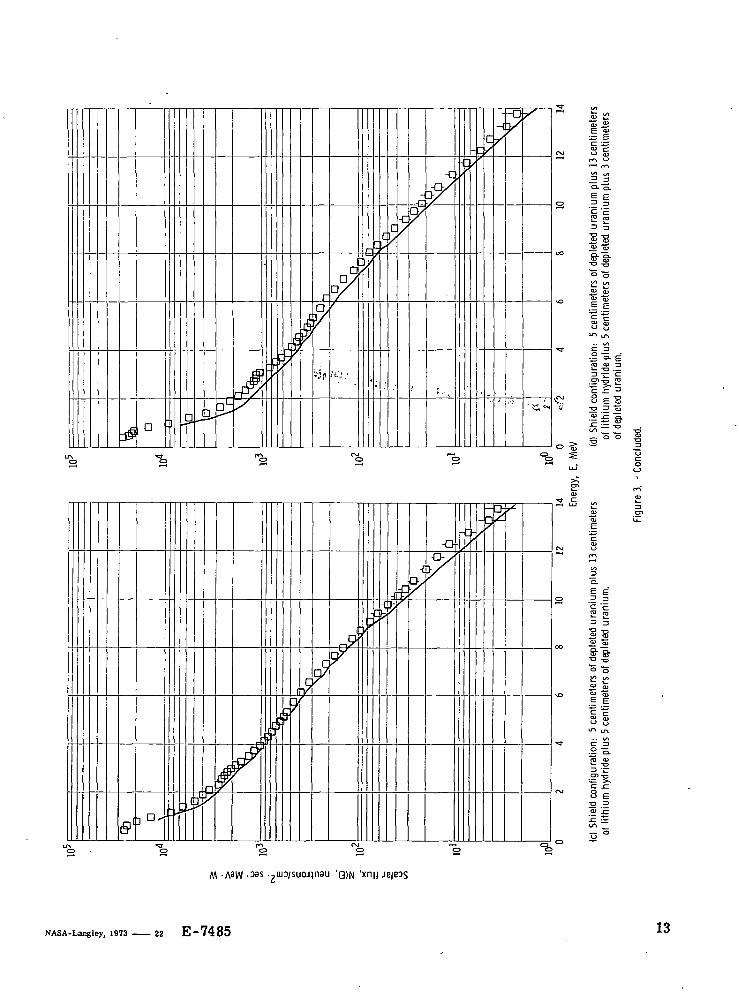
The neutron leakage flux from each of the four experimental configurations is shownin figure 3. Flux per unit energy is shown for the interval of 0. 9 to 14 MeV. To providea comparison on a uniform basis, both calculated and measured results were normalizedto correspond to a power level of 1 watt (reactor fission rate of 3. 1x10 fissions/sec).
Several stages of postprocessing were necessary to convert the DOT -calculatedmultigroup fluxes to those shown in figure 3. First, the surfaces angular fluxes wereconverted to a scalar flux at the surface using the equation
Allangles
where cp is the group scalar flux, Wj is the weight (solid angle) associated with I/A, andi//. is the i angular flux. Next, this surface multigroup scalar flux was converted toflux per unit energy E by dividing it by the energy group width, that is,
(p(E) = -2.AE
Finally, because the optics and the electronics of the instrumentation system introducestatistical variations, a Gaussian smearing of data is performed by the instrumentation.To provide a realistic comparison between calculation and experiment, the calculated re-sults must also be smeared by this Gaussian function. Symbolically, this is
<pg(E)dE = f <p(E')G[R(E'), E', E]dE* dE N•^ 0
where <p(E')dE' is the actual flux of neutrons in dE* about E'; G[R(E'),E',E]dE is theprobability (a Gaussian) that a particle of energy ET will appear to the instrumentationas a particle in dE about E, where G is of the form A/R(E') exp (-B{ (E* - E)/[R(E')J}) and A and B are constants such that L °° G dE = 1, namely, A = \/ln 2/77and B = In 2; R(E*) is the resolution (more precisely, the half width at half maximum)of the instrumentation for particles of energy E'; and <p (E)dE is the "smoothed" neu-stron flux in dE about E, which should be comparable to what the instrumentation sees.
The resolution R(E) of the present instrument is taken to be half that used for the5- by 5-centimeter (2- by 2-in.) NE-213 detector (ref. 11). Only the smeared calculatedfluxes are shown in figure 3.
In all cases, the measured and calculated spectral shapes (fig. 3) show excellentagreement. Differences in absolute magnitude greater than the uncertainty in the powercalibration appear in the results for configuration 4. There also appears to be an in-crease in the difference between measured and calculated results with increasing shieldthickness. Some possible reasons for the differences include:
(1) Cross sections in error. A 5 percent error in, say, the total cross section ofdepleted uranium would result in a 20 percent error in calculated transmission throughthe 13 centimeters of depleted uranium considered here. Because differences aregreater when lithium hydride is present, lithium hydride cross sections are more suspect.
(2) Cracks and voids in the cast lithium hydride (as described in ref. 8), which couldpermit higher transmission than calculated for homogeneous material.
(3) Inaccurate transport calculations due to inadequate spatial and angular mesh and/or scattering order. But this is presently discounted; an S angular quadrature wasused in one calculation and showed only a few percent difference from the Sgcalculations.
The increasing discrepancy with added thickness can most reasonably be attributedto cross section errors. Because of the good agreement in spectral shape, the inelasticcross section is not suspect. This leaves the total and/or elastic scattering cross sec-tion in doubt. But a definitive determination of such a discrepancy cannot be determinedfrom an integral experiment such as this.
On a positive note, the calculated results are all within 50 percent of the measuredresults. Thus, an engineering design tool, the calculative method (and cross sections)presently used is accurate to within this value.
CONCLUDING REMARKS
Measurements and calculations of MeV neutron spectra emerging from a depleteduranium and lithium hydride shielded reactor have been made. In general, the agree-ment between experiment and calculation is good. Spectral shapes are in excellentagreement. Comparisons made on an absolute basis are within 50 percent for all casesconsidered. Differences in spectra of the order of 50 percent were observed in the con-figuration using the thickest shield, namely, 13 centimeters of depleted uranium and 13centimeters of lithium hydride. " This difference is possibly attributable to inhomogene-ities (cracks and voids) in the cast lithium hydride or to erroneous cross sections.
Latest ENDF (version 3) cross sections for lithium 6 and 7, hydrogen, uranium 235 and238, and iron were used in the calculations.
Lewis Research Center,National Aeronautics and Space Administration,
Cleveland, Ohio, July 2, 1973,503-05.
REFERENCES
1. Shook, D. F.; Fieno, D.; Ford, C. H.; and Alexander, R. L.: An Integral Test ofInelastic Scattering Cross Sections Using Measured Neutron Spectra from ThickShells of Ta, W, Mo, and Be. NASA TM X-52979, 1971. Also in Proceedings ofthe Third Conference on Neutron Cross Sections and Technology. AEC Rep. CONF-710301, vol. I, 1971, pp. 98-105.
2. Shook, D. F. ; Fieno, D.; Ford, C. H.; and Wrights, G. N.: An Integral Test of In-elastic Cross Sections of Pb and Mo Using Measured Neutron Spectra. NASA TMX-68074, 1972. Also in Trans. ANS, vol. 15, 1972, p. 527.
3. Lahti, Gerald P. ; and Wrights, Gilbert N. : Measured and Calculated Fast-NeutronSpectra in a Lead-and-Water Shielded Reactor. NASA TM X-67861, 1971; alsoTrans. ANS, vol. 14, no. 1, June 1971, pp. 399-400.
4. Mynatt, Fred R. : A User's Manual for DOT: A Two-Dimensional Discrete OrdinatesTransport Code with Anisotropic Scattering. Rep. K-1694, Union Carbide Corp.,1967.
5. Seltesz, R. G. ; Disney, R. K. ; and Collier, G.: User's Manual for the DOT-HWDiscrete Ordinates Transport Computer Code. Rep. WANL-TME-1982. Westing-house Astronuclear Lab., Dec. 1969.
6. Wright, R. Q.; Lucius, J. L.; Greene, N. M. ; and Craven Jr. , C. W. : SUPERTOG:A Program to Generate Fine Group Constants and Pn Scattering Matrices fromENDF/B. Rep. ORNL-TM-2679, Oak Ridge National Lab. (AD-693232), Sept. 1969.
7. Shook, Donald F.; and Pierce, Clarence R.: Comparison of Neutron Spectra Meas-ured with Three Sizes of Organic Liquid Scintillators Using Differentiation Analysis.NASA TM X-2646, 1972.
8. Welch, F. H.: Lithium Hydride Shield Segment Fabrication. Rep. AI-71-40,Atomics International (NASA CR-120782), Sept. 3, 1971.
9. Shook, Donald F.; and Blue, James W. : Circuit Modification Aids in AtomicParticle Discrimination. NASA Tech. Brief 70-10689, 1970.
10. Semler, Thor T.: PREJUD - A Computer Code for the Preliminary Analysis ofTwo-Dimensional Pulse Height Analyzer Data. NASA TM X-2181, 1971.
11. Clifford, C. E. ; Straker, E. A.; Muckenthaler, F. J. ; Verbinski, V. V.;Freestone, R. M. , Jr.; Henry, K. M.; and Burrus, W. R.: Measurements ofthe Spectra of Uncollided Fission Neutrons Transmitted Through Thick Samples ofNitrogen, Oxygen, Carbon, and Lead: Investigation of the Minima in Total CrossSections. Nucl. Sci. Eng. , vol. 27, no. 2, Feb. 1967, pp. 299-307.
COz
O
ot—t
Q
co
coCM&
§(H
g
w
0)73C3
1 1 Q
> t &"
s - b,^;O "^
05 CU "o
i-l CU
.2 §- ij& a§ 8& 6««-(
1 1C 3
O °% & at>, ^"> ^
S> Jf 8 >[3 cu & ^£ cu "o
eu cutt £
& 3
a.g6
CD CO0 O
x1 ><i-l O •-< CM T}< in i-l i-H CO ini-l O O5 CO C- l O T j i ' - I O C O
IH 1-1 m co1— 1
c o t - c o o i O i - i c M c o T j < i nC M C M C M C M C O C O C O C O C O C O
CDO
xO ' - ' i n o m o s ' - ' o t - o ii n c x i o o o i — i ^ t - o ^ t *CO CXI i— 1 O O5 C O t - C O C D i n
^ ^ C M C O T ^ i n C O t - C O O 5 O
oo1— 1Xi n o c g c o c D c o i - < oO i C O O C D O i - i r f O
CM -H O5 O CO i-<CO O CXI i-lin 1-1
C D C - C O O 5 O i - H C M C OC O C O C O C O - ^ T f ^ T f
c - o s t - c o c o *— i co t- co cxi c o i n o i n c x iO S T f O C D C O O t - T ^ C M O C O C D i n c O C M
i—* cxi co ^* in co c~ co 05 o *™^ CM co ^* in
COcuErt
M-lO
cu.nfa3!5to3
73dt<
^
£
a
Reg
ion
mat
er
cocu
CO
ctf
c73Q>CO3CO
ol
cu
.b
^c(Jbocu
o
desc
ript
ion
co•s3Orto
o.
Ro
1— 1
oc-CXI
Rea
cto
r co
re
1-1
CO
oCO1— (
l
Rea
ctor
ves
se
CXI
inCOoCO1-H
Wat
er
CO
CO
t—CM
COT-t
Sta
inle
ss s
tee
tr
CDCMCO
COCXI
F3
Dep
lete
d u
ran
in
c-r-4inCOCXI
Sta
inle
ss s
tee
CO
entr-O
•CM
2£
c-
or-exi•*fCXI
Sta
inle
ss s
tee
CO
1— 1
I—*»-*c-co
cuTi
Lit
hium
hy
dri
05
COCOCO
t-co
Sta
inle
ss s
tee
o
C- COO5 COCO O
C- COCO CO
Voi
dS
tain
less
ste
e
i-l CM
i-( CM COOS CO i-lO CXI t-
CO CO CO
^ ^ ^
53
Dep
lete
d ur
anS
tain
less
ste
eV
oid
co Tt« in
o05
CO
^
Sta
inle
ss s
tee
CO
CDCM05
CD
^
fi3
Dep
lete
d u
ran
c-
t—
t-•
Sta
inle
ss s
tee
CO
o
SuCOWQ
IW
wJ0)<:H
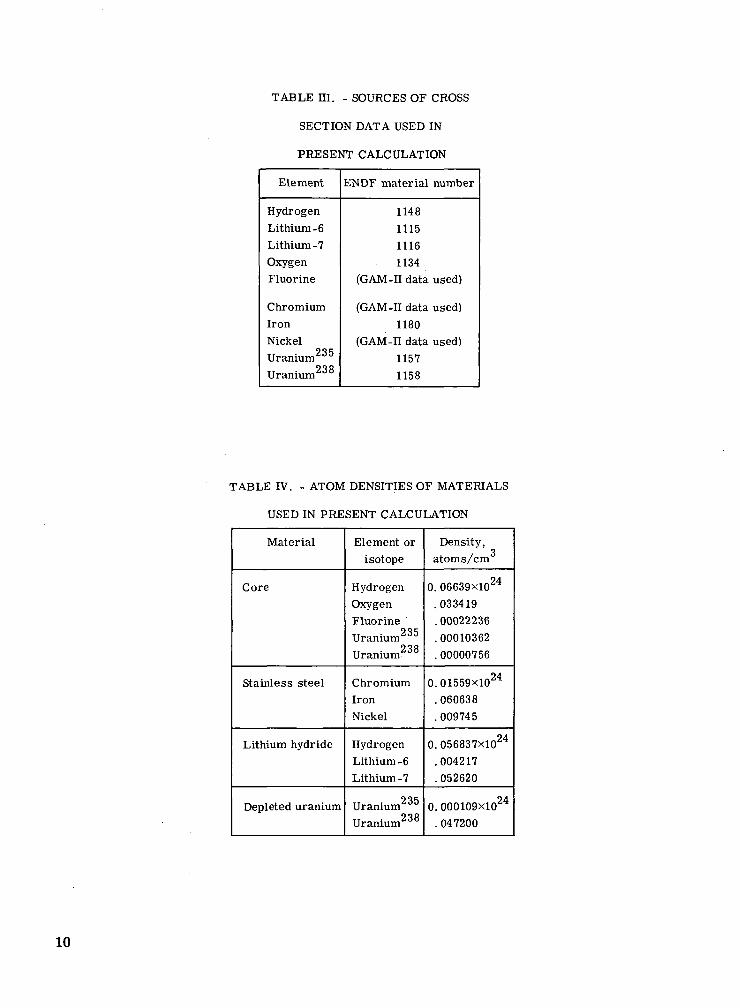
TABLE HI. - SOURCES OF CROSS
SECTION DATA USED IN
PRESENT CALCULATION
Element
HydrogenLithium -6Lithium -7OxygenFluorine
ChromiumIronNickelUranium235
Uranium238
ENDF material number
1148111511161134
(GAM-n data used)
(GAM-II data used)1180
(GAM-n data used)11571158
TABLE IV. - ATOM DENSITIES OF MATERIALS
USED IN PRESENT CALCULATION
Material
Core
Stainless steel
Lithium hydride
Depleted uranium
Element orisotope
HydrogenOxygenFluorineUranium235
Uranium
ChromiumIronNickel
HydrogenLithium -6Lithium -7
Uranium235
Uranium
Density,O
atoms/cm
0. 06639X1024
.033419
.00022236
.00010362
. 00000756
0.01559X1024
. 060638
.009745
940.056837X10
.004217
. 052620
940. 000109X10^
.047200
10
Reactor vessel 316 stainless steel
U02F2/H20reactor
core
25. 4cm i
Horizontal
1Z 7 cm^rad.
H20(5cm)
U(5cm)
LiH(13cm)
U(5cm)
U(3cm) 45. 72 cm
,fc.
midplane
Figure 1. - Sketch of experimental setup. Region above horizontal midplane is shown. Dimensionsindicated are approximate and are only for general orientation. The exact dimensions are givenin table I.
RCA8575
_LU.U£ \irj ' ||270
Pre-amplifier
Amplifier
Highvoltage
Figure Z - Spectrometer block diagram and photomultiplier tube base circuit
11
•~ _Q
C IE
_ TO
si f.— £ E
> e
I io> ro-
"
-A9W - 'Q)N '
12
X
rtqlp/
--o**-+y OJ °J
•f 1
Q. o.
§1c 'c2 CO3 -)
• -o"S oC 2^ O)11
2-g.E
IIc 'c£ CO
=1 3s a> "Z
S- s-•o -o
£2 C» a>
1
S s<-> (_)
•n u-,
=§"§,c ^8 e
M -A3W - un/suojjnau
NASA-Langley, 1973 22 E-7485 13
WAS-HtftSTON, D.e, 2(3546
# . .. , y. .ft
I • f, -«AND P&KS I»AID
*
4 J> 4 *;• ».
4. f f. 4- -;
.? * f- •> > JEf ll
» fr-
TECHNICAL MOtBS: ftss iroaiof I
10 existing.
TECHNICAL MEMORANDUMS:Information receiv^ag Rmi»ibtxaUiSe of preJiroi«aty data, secodty das$ifica~don, or other reasons. Also includesproceedings with rirber limited wtij&tributkxi.
CONTRACTOR REPORTS: SdcncISc and.ttfhmc-al Lcforms.rion generated ond-er ,1 NASAconuaci or gwot and consideredtomriburion to existing k
KSOJCATIOM&:- infetnntioof«KB « of vabe to NASA activities.
include final reports of major
handbooks, sourcebooks, and specialbibiiografibte-s.
TECHNOIOGY UTILIZATIONPUBLICATIONS: lnfi»naoon on technologyused by NASA rhat may* be of particularintcrCjT in. ci'i:iint;r'_:ii and other non-jcrosparca.pplicatiuos- Pubhcanoos include lech Briefs,Technology L-t!li?at>:;n tttporr^ andTechnc-Io^f
on f/»e avoHofaffify of fhese pub/rrafrons may be obtained from:
SCIENTIFIC AND TECHNICAL INFORMATION OFFICE
NATIONAL A E R O N A U T I C S A N D S P A C E ADMINISTRATION
Washington, D.C. 20546