Embed Size (px)
Citation preview

1998;39:285-293.J Nucl Med. Michael D. Devous, Sr., Ronald A. Thisted, Gillian F. Morgan, Robert F. Leroy and Christopher C. Rowe SPECT Brain Imaging in Epilepsy: A Meta-Analysis
http://jnm.snmjournals.org/content/39/2/285This article and updated information are available at:
http://jnm.snmjournals.org/site/subscriptions/online.xhtml
Information about subscriptions to JNM can be found at:
http://jnm.snmjournals.org/site/misc/permission.xhtmlInformation about reproducing figures, tables, or other portions of this article can be found online at:
(Print ISSN: 0161-5505, Online ISSN: 2159-662X)1850 Samuel Morse Drive, Reston, VA 20190.SNMMI | Society of Nuclear Medicine and Molecular Imaging
is published monthly.The Journal of Nuclear Medicine
© Copyright 1998 SNMMI; all rights reserved.
by on April 26, 2014. For personal use only. jnm.snmjournals.org Downloaded from by on April 26, 2014. For personal use only. jnm.snmjournals.org Downloaded from

through a failure to provide a normal level of protection againstinitiation and spread. Although the thalamus plays a role in theinitiation, propagation and/or symptoms of seizures, it is uncertain whether thalamic dysfunction is related to alterations inthalamic blood flow, and thalamic perfusion is reduced in aninterictal state. Further investigation of thalamic dysfunctionand alterations in blood flow is needed.
CONCLUSIONAlthough ipsilateral thalamic hypoperfusion on interictal
SPECT is too small to assist in seizure localization, it may aidin the localization of seizure foci. This finding occurs ipsilateralto epileptic foci in the temporal lobe, not in the contralateralthalamus. This finding may reflect either thalamic hypometab-olism secondary to decreased efferent activity from the temporal lobe structures or functional alteration of thalamic metabolism by the regulation of cortical excitability and seizurepropagation or both.
REFERENCES1. Henry TR. Mazziotta JC, Engel J Jr. et al. Quantifying interictal metabolic activity in
human temporal lobe epilepsy. J Cereb Blood Flow Melab l990;10:748-757.
2. Sperling MR. Our RC. Alavi A. et al. Subcortical metabolic alteration in partialepilepsy. Epilepsia 1990:31:145-155.
3. Henry TR. Mazziotta JC. Engel J Jr. et al. Interictal metabolic anatomy of mesialtemporal lobe epilepsy. Arch Neural l993;50:582-589.
4. Rausch R, Henry TR. Ary CM, et al. Asymmetric interictal glucose hypometabolismand cognitive performance in epileptic patients. Arch Neural 1994;51:I39-144.
5. Won JH. Lee JD. Chung TS. Park CY, Lee BI. Increased contralateral cercbellaruptake """Tc-HMPAO on ictal brain SPECT. J NucÃMed l996;37:426-429.
ft. Duncan R. Patterson J. Bone I. Wyper DJ. Reversible cerebellar diaschisis in focalepilepsy. Lancet l987;ii:625-626.
7. Park CH, Kim SM. Streletz LJ, Zhang J, Intenzo C. Reverse crossed cerebellardiaschisis in complex partial seizures related to herpes simplex encephalitis. Clin NucÃMed 1992:17:732-735.
8. Reivich M. Crossed cercbellar diaschisis. Am J Neuroradiol 1992:13:62-64.
9. Von Mcnakow C. Diaschisis (1914 article translated by G. Harris). In: Pribram KH, ed.Brain and Behaviour 1: moods, states and mind. Baltimore, M D: Penguin; 1969:27-36.
10. Yamauchi H. Fukuyama II. Kimura J. Hemodynamic and metabolic changes in crossedcerebellar hypoperfusion. Stroke 1992:23:855-860.
11. Baron JC, Bousser MG. Comar D, Castaigne P. Crossed cerebellar diaschisis in humansupratentorial infarction [Abstract]. Ann Neural 1980:128:8.
12. Tien RO. Ashdown BC. Crossed cerebellar diaschisis and crossed cerebellar atrophy:correlation of MR findings, clinical symptoms and supratentorial diseases in 26patients. Am J Roenlgenol I992;158:l 155-1159.
13. Kim SE, Choi CW, Yoon BW, et al. Crossed cerebellar diaschisis in cerebralinfarction: WmTc-HMPAO SPECT and MRI. J NucÃMed 1997;38:I4-19.
14. Wise RJS, Bernardi S, Frackowiak RSJ, Lcgg NJ, Jones T. Serial observations on thepathophysiology of acute stroke: the transition from ischemia to infarction as reflectedin regional oxygen extraction. Brain 1983:106:197-222.
15. Baron JC, Levasseur M, Mazoyer B, et al. Thalamocortical diaschisis: positronemission tomography in humans. J Neural Neurosurg Psychiatry 1992;55:935-942.
16. Aggleton JP, Burton MJ, Passingham RE. Cortical and subcortical afférentsto theamygdala of the rhesus monkey (Macacla mulatta). Brain Res 1980; 190:347-368.
17. Saunders RC, Rosene DL. A comparison of the efferents of the amygdala and thehippocampal formation in the rhesus monkey. I. Convergence in the entorhinal.prorhinal and perirhinal cortices. J Comp Neural 1988:271:153-184.
18. Van Hoesen GW. Rosene DL, Mesulam MM. Subicular input from temporal cortex inthe rhesus monkey. Science 1979;205:608-610.
19. Mehler WR. Subcortical afferent connections of the amygdala in the monkey. J CompNeural !980;l90:733-762.
20. Price JL. Amarai DG. An autoradiographic study of the projections of the centralnucleus of the monkey amygdala. J Neurosa 1981;1:1242-1259.
21. Amarai DG, Price JL. Amygdalo-cortical projections in the monkey (Macaca fascicu-laris). J Comp Neural 1984:230:465-496.
22. So N, Gloor P, Quesney LF, Jones-Gotman M, Oliver A, Anderson F. Depth electrode
investigations in patients with bitemporal epileptiform abnormalities. Ann Neural1989;25:423-431.
23. Holman BL, Carvalho PA, Zimmerman RE, et al. Brain perfusion SPECT using anannular single crystal camera: initial clinical experience. J NucÃMed 1990;31:1456-
1461.24. Urich H. Postictal cerebral hcmiatrophy: with a contribution of the problem of crossed
cerebellar atrophy. Acta Neuropathol 1984;62:332-339.
25. Mori H, Mizutani T, Yoshimura M, Yamanouchi H, Shimada H. Unilateral braindamage after prolonged hemiconvulsions in the elderly associated with theophyllineadministration. J Neural Neurosurg Psychiatry 1992:55:466-469.
26. Velasco M, Velasco F, Alcalá H, Davila G. Diaz-de-Leon AE. Epileptiform EEC
activity of the centromcdian thalamic nuclei in children with intractable generalizedseizures of the Lennox-Gastaut syndrome. Epilepsia I991;32:310-321.
27. Chugani HT. Rintahaka PJ. Shewmon DA. Ictal pattern of cerebral glucose utilizationin children with epilepsy. Epilepsia 1994;35:813-822.
28. Jeanmonod D. Magnin M. Morel A. Low-threshold calcium burst in the human
thalamus. Common physiopathology for sensory, motor and limbic positive symptoms.Brain 1996:119:363-375.
29. Lin FH, Wang Y, Lin S. Cao Z, Hosford D. GABAB receptor-mediated effects insynaptosomes of lethargic (Ih/Ih) mice. J Neurochem 1995:65:2087-2095.
30. Yan QS, Jobe PC, Dailey JW. Thalamic deficiency in norepinephrine release detectedvia intracerebral microdialysis: a synaptic determinant of seizure predisposition in thegenetically epilepsy-prone rat. Epilepsy Res 1993:14:229-236.
SPECT Brain Imaging in Epilepsy: A Meta-AnalysisMichael D. Devous, Sr., Ronald A. Thisted, Gillian F. Morgan, Robert F. Leroy and Christopher C. RoweNuclear Medicine Center, The University of Texas Southwestern Medical Center, Dallas, Texas; Department of Statistics,University of Chicago, Chicago, Illinois ; Guilford Pharmaceuticals, Baltimore, Maryland: Department of Neurology,Medical City Dallas, Dallas, Texas; and Department of Nuclear Medicine, Queen Elizabeth Hospital, Woodville South,South Australia,
A meta-analysis of SPECT brain imaging in epilepsy was performedto derive the sensitivity and specificity of interictal, postictal or ictalrCBF patterns to identify a seizure focus in medically refractorypatients. Methods: Papers were obtained by pooling all publishedarticles identified by two independent literature searches: (a) Dialnet(EMBASE) or Radiine by CD-ROM and (b) Current Contentssearched manually. Literature inclusion criteria were: (a)patients hada localization-related epileptic syndrome; (b) more than six patientswere reported; and (c) patients had at least an interictal EEC-documented epileptiform abnormality. Of 46 papers meeting thesecriteria, 30 contained extractable data. SPECT results were compared to localization by standard diagnostic evaluation and surgicaloutcome. Meta-analytic sensitivities for SPECT localization in patients with temporal lobe seizures relative to diagnostic evaluationwere 0.44 (interictal), 0.75 (postictal) and 0.97 (ictal). Similar results
Received Apr. 8, 1997; accepted May 12, 1997.For correspondence or reprints contact: Dr. Michael D. Devous. Sr., Nuclear Medicine
Center, UT Southwestern Medical Center, 5323 Harry HiñesBlvd., Dallas. TX 75235-
9061.
were obtained relative to surgical outcome. False-positive rateswere low relative to diagnostic evaluation (7.4% for interictal and1.5% for postictal studies) and surgical outcome (4.4% for interictaland 0.0% for postictal studies). Results: The results were notdependent on tracer used (or dose), the presence of CT-identifiedstructural abnormalities, blinding of image interpretation or cameraquality (although data were more variable with low-resolution cameras). There were insufficient data for conclusions regarding extra-temporal-seizure or pediatrie epilepsy populations. Conclusion:Insights gained from reviewing this literature yielded recommendations for minimal information that should be provided in futurereports. Additional recommendations regarding the nature andfocus of future studies also are provided. The most important ofthese is that institutions using SPECT imaging in epilepsy shouldperform ictal, preferably, or postictal scanning in combination withinterictal scanning.Key Words: epilepsy; meta-analysis; SPECT
J NucÃMed 1998; 39:285-293
META-ANALYSISOF SPECT IN EPILEPSY•Devous et al. 285
by on April 26, 2014. For personal use only. jnm.snmjournals.org Downloaded from

jLpilepsy surgery increasingly is considered the treatment ofchoice for people with medically refractory partial seizures oftemporal lobe origin (7). Recently, Rougier et al. (2) reported alongitudinal assessment of seizure outcome after temporallobectomy. Of 76 patients, 49 were seizure-free 5 yr postsur-gery. A review by Engel et al. (3) of more than 6,000 epilepsysurgeries from 1986-1990 showed that 68% of the patientshaving limbic resections became seizure-free, and a further 24%had seizure frequency reduced by at least 90%. It has beensuggested that more than 200,000 patients in the U.S. mightbenefit from surgical treatment, but the need for multiple,complex, preoperative investigations to accurately localize theseizure focus limits the use of surgical treatment.
EEG monitoring, using scalp, cortical or depth electrodes,is the current gold standard used for accurate focus localization (4). However, the interictal EEG often does not adequately localize the epileptic focus (5). Seizure monitoringcombining ictal scalp EEG with simultaneous videotaping ofbehavior during seizures also is often inadequate for theanatomic localization of epileptic foci (6,7). Thus, the use ofintracranial electrodes during seizure monitoring was developed for more precise seizure focus localization (8). Thismethod derives spatial sampling capability only from precisesurgical placement of the electrodes. Unfortunately, intracranial monitoring is invasive, with definite morbidity andmortality, as well as expensive. In recent years, growingrecognition of the characteristic clinical features of themesial temporal lobe epilepsy syndrome (9) and improvedMRI technique and interpretation for detecting mesial temporal sclerosis (10) have reduced reliance on invasiveelectrode studies in many patients.
PET with IKF-fluorodeoxyglucose (FDG) has shown that,
during the interictal period, areas of decreased glucose metabolism may be identified that correspond to the depth electrodeEEG (and ultimately pathological) localization of the seizurefocus. Several authors (11,12) report an incidence of 60%-90%of temporal lobe hypometabolism in groups of patients withcomplex partial seizures. Interictal PET-FDG imaging mayreplace the need for depth electrode recording for selectedpatients at some institutions, but clinical utility is limited by itsrestricted availability and high cost (13). Regional cerebralblood flow (rCBF) also has been demonstrated to be abnormalat the site of the epileptic focus (14). During seizures, rCBFmay increase at the site of the epileptic event (15,16). Interic-tally, the epileptic focus may demonstrate either regionalhypoperfusion (commonly) or hyperperfusion (rarely) (17).SPECT is a widely available tool that may be used to measurerCBF noninvasively. Thus, SPECT may be useful for investigating and localizing epileptic foci in patients suffering frommedically refractory epileptic seizures.
Despite a large number of interictal SPECT studies in theliterature (18,19), there are few with large patient cohorts,and there is large variation in the stated sensitivity of thistechnique. Tracer injection at the time of a seizure appears tosignificantly improve the accuracy and sensitivity of seizurelocalization with SPECT, though the number of publishedictal or postictal studies is small. Consequently, the truesensitivity for SPECT rCBF imaging is yet to be establishedfor either interictal, postictal or ictal scans. Also, therelationship between SPECT and surgical outcome has notbeen established, nor has the efficacy of interictal or ictalSPECT to localize seizure foci been determined when theEEG is nonlocalizing.
This meta-analysis (20) of SPECT brain imaging in epilepsywas performed to address these issues to the degree possible
with existing literature. Our purpose was to review the availablepublished literature and to combine, where possible, studiesfrom different institutions to improve the understanding of thecontribution of SPECT brain imaging to the management ofpatients with medically refractory epilepsy.
MATERIALS AND METHODSPapers initially selected for review were obtained by pooling all
published articles identified by two independent literature searches:(a) Dialnet (EMBASE) or Radline through CD-ROM and (b)Current Contents searched manually. The reference sections ofthree comprehensive literature reviews on SPECT imaging inepilepsy (18,19,21) were examined for any additional papersmissed in the process. All conference abstracts, case history reportsand narrative reviews were rejected from this initial pool and thefinal list was reviewed for completeness by one of the authors. Thisprocess identified 53 papers for review. One of these papers wasnot reviewed as it was not obtainable through normal channels(British Lending Library, London).
Eligible papers were reviewed next against the following inclusion criteria, which were established a priori by consensus discussion of the authors: (a) patients had a localization-related epilepticsyndrome; (b) patient number ^ 6 reported; and (c) patients had atleast an interictal EEG-documented epileptiform abnormality. Eachpaper was reviewed and included or rejected by consensus on thesole basis of these predetermined criteria. Forty-six papers metthese criteria.
Wherever possible, patient-level information was used to classify results rather than summaries provided in the manuscripts (22).Patient-level information was reviewed on a patient-by-patientbasis by the authors as a group to classify the inclusion status andoutcome of each patient. Sixteen of the 46 papers meeting theinitial inclusion criteria were subsequently excluded because theydid not contain sufficiently detailed descriptions of results topermit data extraction (e.g., no data on EEG localization). Papersincluded in the analysis are listed in Appendix A. A full list of thepapers reviewed but not included in the meta-analysis is availableon request.
Patients were categorized in several ways, as: (a) medicallyrefractory or medically responsive (if not explicitly stated inmanuscript, then patients were assumed to be not refractory); (b)adult or pediatrie (<13 yr); and (c) of general or special patientpopulations (e.g., included only patients with normal CT scans,only patients with unilateral EEG findings, exclusion of patientswith ambiguous EEG or SPECT results). Also, because mostreports used 99mTc-HMPAO, those SPECT studies using other
radiopharmaceuticals were analyzed as a separate group.The electroencephalographic data were classified as unilateral,
bilateral, localizing or nonlocalizing. Surgical outcome was classified as good or poor (accepted for this analysis only with aminimum of 12 mo surgical follow-up and defining outcome asgood if the patient was either seizure-free or had > 90% reductionin seizure frequency).
SPECT images were classified as unifocal ipsilateral to EEG,unifocal contralateral to EEG, multifocal ipsilateral, multifocalbilateral and normal. Data related to interictal, ictal and postictalSPECT were entered separately. Ictal SPECT was defined as atracer injection during an observed clinical seizure or within 30 secof the seizure completion during seizure monitoring. Therefore,postictal SPECT was defined as an injection later than 30 secpostseizure completion with seizure monitoring, but in associationwith a seizure (typically not more than 5 min postictal).
Some manuscripts provided information relevant to more thanone of these imaging time frames. Therefore, data were organizedby "series." That is, a collection of results from a single manuscript
286 THEJOURNALOFNUCLEARMEDICINE•Vol. 39 •No. 2 •February 1998
by on April 26, 2014. For personal use only. jnm.snmjournals.org Downloaded from
comprising findings from a particular patient population. The maindistinctions among series were adult/pediatric and ictal/interictal/postictal. Thus, a paper reporting data on both ictal and interictalseizures would result in two series in the database. When possible,efforts were made to exclude any studies that might reportduplicated subject information. Consequently, not all series enteredin the database were usable ultimately.
Three additional characteristics of reported results were recorded: (a) the site of focus as temporal, extratemporal or mixed(papers that reported temporal and extratemporal patients combined); (b) whether image interpretation was blinded to otherpatient data (especially EEC); and (c) whether image resolutionwas low (camera resolution > 12 mm), medium (8-12 mm) orhigh (^8 mm).
For each data series, we analyzed SPECT findings with respectto unilateral EEC findings. Sensitivity (sensi) was defined to bethe fraction of unifocal ipsilateral SPECT findings among allunilateral EEGs. A second, broader definition of sensitivity alsowas evaluated (sens2), defined as unifocal or multifocal SPECTfindings ipsilateral to EEC localization. Similarly, discordantSPECT was defined as a unifocal SPECT finding contralateral toEEC (false 1), and unifocal or multifocal SPECT findings contralat-eral to EEC (false2).
With respect to surgery, sensitivity was defined as the fraction ofunifocal SPECT findings ipsilateral to the operative side, among allgood surgical outcomes. As with the comparison to EEG, bothnarrow (unifocal SPECT finding) and broad (unifocal or multifocalSPECT findings) definitions were used for sensitivity (sens3,sens4) and false localization rate (false3, false4).
The method of DerSimonian and Laird (23) was used tocalculate meta-analytic estimates of sensitivity (/*) based on thecombined reports and to assess possible heterogeneity across series(Q). Exact confidence intervals were calculated using the methoddescribed by Brownlee (24). Multiple logistic regression was usedto assess factors affecting the determination of SPECT sensitivityrelative to diagnostic evaluation. Factors included series type(interictal/postictal/ictal), dose, camera resolution and blinding.
Six questions that potentially could be addressed by the meta-analytic process were established by consensus discussion beforeany of the papers were reviewed. The first two questions representour primary focus:
1. What are the sensitivity and false-positive rate of interictal,postictal or ictal SPECT relative to diagnostic evaluation in(a) localization and (b) lateralization of a seizure focus?
2. What are the sensitivity and false-positive rate of interictal,postictal or ictal SPECT relative to surgical outcome inlocalization of a seizure focus?
In addition, we thought it would be useful to attempt to useextant literature to address the following secondary questions:
3. What is the differential relationship to surgical outcomeamong unifocal, multifocal-ipsilateral and multifocal-bilat-eral SPECT abnormalities?
4. What are the sensitivity and false-positive rate of interictal, postictal or ictal SPECT in pediatrie epilepsy?
5. Are sensitivity or false-positive measures a function oftechnical factors such as instrumentation quality or ra-diopharmaceutical dose?
6. With what frequency is /ivperperfusion seen in theinterictal state?
RESULTS
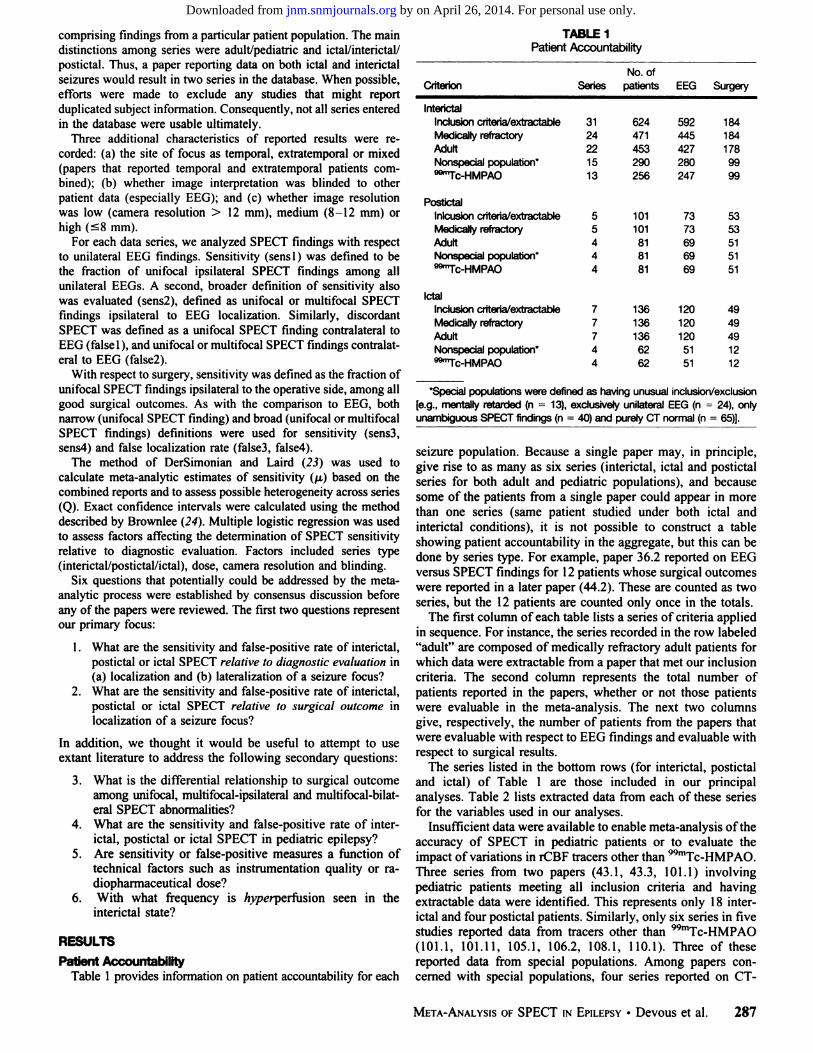
Patient AccountabilityTable 1 provides information on patient accountability for each
TABLE 1Patient Accountability
Criterion SeriesNo. of
patients EEG Surgery
InterictalInclusion criteria/extractableMedically refractoryAdultNonspecial population*""Tc-HMPAO
PostictalInlcusion criteria/extractableMedically refractoryAdultNonspecial population'""Tc-HMPAO
IctalInclusion criteria/extractableMedically refractoryAdultNonspecial population"""Tc-HMPAO
3124221513
77744
624471453290256
101101818181
1361361366262
592445427280247
7373696969
1201201205151
1841841789999
5353515151
4949491212
'Special populations were defined as having unusual inclusion/exclusion
[e.g., mentally retarded (n = 13), exclusively unilateral EEG (n = 24), onlyunambiguous SPECT findings (n = 40) and purely CT normal (n = 65)].
seizure population. Because a single paper may, in principle,give rise to as many as six series (interictal, ictal and postictalseries for both adult and pediatrie populations), and becausesome of the patients from a single paper could appear in morethan one series (same patient studied under both ictal andinterictal conditions), it is not possible to construct a tableshowing patient accountability in the aggregate, but this can bedone by series type. For example, paper 36.2 reported on EEGversus SPECT findings for 12 patients whose surgical outcomeswere reported in a later paper (44.2). These are counted as twoseries, but the 12 patients are counted only once in the totals.
The first column of each table lists a series of criteria appliedin sequence. For instance, the series recorded in the row labeled"adult" are composed of medically refractory adult patients for
which data were extractable from a paper that met our inclusioncriteria. The second column represents the total number ofpatients reported in the papers, whether or not those patientswere évaluablein the meta-analysis. The next two columnsgive, respectively, the number of patients from the papers thatwere évaluablewith respect to EEG findings and évaluablewithrespect to surgical results.
The series listed in the bottom rows (for interictal, postictaland ictal) of Table 1 are those included in our principalanalyses. Table 2 lists extracted data from each of these seriesfor the variables used in our analyses.
Insufficient data were available to enable meta-analysis of theaccuracy of SPECT in pediatrie patients or to evaluate theimpact of variations in rCBF tracers other than WmTc-HMPAO.
Three series from two papers (43.1, 43.3, 101.1) involvingpediatrie patients meeting all inclusion criteria and havingextractable data were identified. This represents only 18 interictal and four postictal patients. Similarly, only six series in fivestudies reported data from tracers other than 99mTc-HMPAO
(101.1, 101.11, 105.1, 106.2, 108.1, 110.1). Three of thesereported data from special populations. Among papers concerned with special populations, four series reported on CT-
META-ANALYSISOF SPECT IN EPILEPSY•Devous et al. 287
by on April 26, 2014. For personal use only. jnm.snmjournals.org Downloaded from

TABLE 2SPECT Versus EEG: Extracted Variable by Series*
Interictalseries1.14.15.19.116.122.128.134.139.143.1144.148.1201.1Postictal
series13.322.344.3201.3letal
series22.236.239.2No.
ofpatientst585102862946551272328212233406Sensi00.3750.8000.40.4640.50.310.3910.40.60.6670.7140.4350.7860.50.750.739110.667Sens20.40.3750.8000.90.5710.50.5170.3910.60.60.6670.7140.5220.7860.50.750.783110.833Falsel00.12500.10.21400.0690.06500.200000.500000False20.60.12500.10.39300.0690.10900.200.2860.0430.0710.500.043000DoseHigh—HighHighHighLowHighHighHighHighHighLowHighHighLowHighHighLowHighHighCameraLow—MedMedLowMedMedMedHighMedMedLowHighMedMedMedHighMedMedHighBlindNoNoYesNoNoNoYesYesYesYesYesYesYesYesNoYesYesNoNoYes
The index number xx.yz identifies the series within paper xx;y = 1,2 or 3 for interictal, ictal and postictal, respectively, and z is added to distinguish multiple
series from the same paper and observation period.TNo. of patients = number of patients in the series with unilateral EEG findings.
normal subjects. Two series were non-99mTc-HMPAO (105.1,110.1 ) and two ( 14.1,40.1 ) reported data using 99mTc-HMPAO.
Relationship of SPECT to EEGA survey of Table 2 suggests that the ictal and postictal
results for sensitivity, especially the definition sensi, arestrikingly better than for the interictal findings, as expected.Multiple logistic regression analysis indicated that series typewas a statistically significant determinant of sensitivity. Theeffects of dose, resolution and blinding did not reach statisticalsignificance. The odds of SPECT correctly identifying a unifocal lesion on the ipsilateral hemisphere (when EEG findingswere unilateral) were 45 times larger using ictal rather thaninterictal observations, and four times larger using postictalrather than interictal. "Odds" can be thought of as the number
of correctly diagnosed patients for every incorrectly diagnosedpatient.
Table 3 lists the combined sensitivity measures (p. for sens 1)derived from meta-analysis for all series. These results arecompared to results from individual series in Figure 1. The only
TABLE 3Combined Sensitivities: SPECT Versus Diagnostic Evaluation
95% dfS
InterictalPostictalIctal0.4380.7540.9670.323-0.5530.631-0.8520.887-0.99631.800.7072.9891233
V ¡sthe meta-analytic derived combined sensitivity across all series (23).t95% CI = 95% confidence intervals for p.*Q is a measure of homogeneity (23).§df= degrees of freedom.
significant heterogeneity was found in the interictal series (Q =31.8, df = 12, p < 0.01). This heterogeneity is completelyaccounted for by removing the three series with low-resolutioncameras (1.1, 16.1, 48.1). These three studies had observedsensitivities ranging from 0% to 72%. Among the medium- andhigh-resolution studies, there was no evidence of heterogeneity(Q = 10.4, df = 9, p > 0.5). However, removing the threelow-resolution series had little effect on interictal sensitivity (/A= 0.430) or confidence intervals (95% CI = 0.349-0.513).None of the ictal or postictal studies used low-resolutioncameras.
A broader definition of sensitivity (sens2) includes, as positive findings, the presence of a SPECT lesion at the EEGpositive site in addition to SPECT lesions at other sites in thesame hemisphere (multifocal ipsilateral). The combined sensitivity (/u, for sens2) was 0.582 (95%CI = 0.480-0.684) forinterictal data, 0.769 (0.648-0.865) for postictal data and 0.980(0.891-0.999) for ictal data.
While the majority of patients analyzed had seizures oftemporal lobe origin, one series (39.1) reported on patients ofpurely extratemporal seizures and four others reported onpopulations of mixed temporal and extratemporal seizures. Todetermine if a purely temporal lobe seizure population would beassociated with a different sensitivity, our data were reanalyzedwithout these five series. The resultant combined sensitivitywas 0.46 (0.36-0.54). This result is not different from the
original analysis.Data that relate to generating misleading results (contralateral
unifocal) are found also in Table 2. The rates of misleadingfindings are quite low in the ictal and postictal settings (the 50%rate from series 22.3 is based on a sample size of 2). Theestimated rate of this type of error is 7.4% for interictal and
288 THEJOURNALOFNUCLEARMEDICINE•Vol. 39 •No. 2 •February 1998
by on April 26, 2014. For personal use only. jnm.snmjournals.org Downloaded from

Diagnostic Evaluationnterictal Series-J..lj1.10
4.105.109.1016.1022.1028.1034.1039.1043.1144.1048.10
201.101
1— i i il i i ' '0 0.43 1
Meta-Analysis95%CIPostictal
Seriesi1330
22304430
201301
1—i i i i i i i»00.75 1Meta-Analysis95%CI
letal SeriesT—
>2220
36.2039.201
1 T 1 1 1 l i i«00.96
Mela-Analysis95%CJ
FIGURE 1. Individual and meta-analytic (¿t)sensitivities(sensi) for SPECTdata relative to diagnostic evaluation. Median values are noted by verticalbars and 95% confidence intervals (CI) are noted by horizontal bars.
1.5% for postictal studies, based on the combined data, andthese differences are statistically significant (p = 0.026). Theoptimistic observed rate of 0% in the ictal category may be dueto the relatively small combined sample sizes, as the confidenceintervals suggest (the upper end of the 95% confidence interval
TABLE 4Variables Relating SPECT to Surgical Outcome*
Outcome SensS Sens4 FalseS False4
Interjetaiseries28.134.143.1144.1201.120/2338/412/312/1219/200.20.4470.50.6670.4740.50.4470.50.6670.5260.050.0530.5000.050.0530.500.053
Postictal Series13,344.3201.3
letal series44.2
16/1912/1219/20
12/12
0.812 0.812 0.000 0.0620.750 0.750 0.000 0.0000.737 0.789 0.000 0.053
1.000 1.000 0.000 0.000
"Outcome = number of patients with good outcome/series total.
based on all of the data in this group is 5.9%). The broaderdefinition of misleading results (unifocal contralateral + multifocal bilateral) was slightly higher: interictal = 9.5%; postictal = 6.2%.
Relationship of SPECT to Surgical OutcomeData extracted from the series reporting surgical cases are
reported in Table 4. The data are again consistent with increasedaccuracy being associated with ictal and postictal observations.Table 5 lists the combined sensitivity measures (¡JLfor sens3)derived from meta-analysis for all series. The differencesbetween groups are statistically significant (p < 0.01). Theseresults are compared to results from individual series in Figure 2.
A broader definition of sensitivity (unifocal ipsilateral +multifocal ipsilateral) also was constructed to relate SPECT tosurgical outcome data. The combined sensitivity (/u for sens4)was 0.505 (CI = 0.399-0.612) for interictal data, and 0.787(0.643-0.893) for postictal data. Combined data for ictal
studies cannot be obtained since surgical outcome and ictalSPECT data were only available from a single series.
SPECT results that were misleading relative to surgicaloutcome were rare for either the conservative definition (unifocal contralateral) or the broader definition (unifocal contralateral + multifocal bilateral). For interictal series, they were 4.4%and 5.5%. For postictal series, they were 0.0% and 4.3%. Again,combined results for ictal studies cannot be obtained since thesecome from only a single series.
Other AnalysesWe next analyzed two subsets of papers that were not used in
our principal analysis. One set focused on the sensitivity ofSPECT relative to diagnostic evaluation when radiopharmaceu-ticals other than WmTc-HMPAO were used. As previously
TABLE 5Combined Sensitivities: SPECT Versus Surgical Outcome
u* 95%CIT Q* df«
InterictalPostictalIctal
0.4290.7661.00
0.325-0.5370.620-0.8770.737-1.00
9.6560.3230.000
V is the meta-analytic derived combined sensitivity across all series (23).T95% CI = 95% confidence intervals for y..*Q is a measure of homogeneity (23).
§df= degrees of freedom.
META-ANALYSISOF SPECT IN EPILEPSY•Devous et al. 289
by on April 26, 2014. For personal use only. jnm.snmjournals.org Downloaded from

Surgical Outcome
Interjetai Series
T 1 1 T 1 1 1 TO 0.43 n
Meta-Analysis95%a
Postictal Series
1330
4430
20130
—1 1 1 1 1 1 1 1 r~
0 0.77 1
Meta-Analysis 95% CI
letal Series
4420
-r—i—i—i—i—i—i—i—i—«0 1.00
Meta-Analysis 95%
FIGURE 2. Individual and meta-analytic (¿j.)sensitivities(sensi) for SPECTdata relative to surgical outcome. Median values are noted by vertical barsand 95% confidence intervals (CI) are noted by horizontal bars.
mentioned, these data did not exclude special populations. Thesecond analysis concerned the sensitivity of SPECT relative todiagnostic evaluation in papers reporting on patients who wererequired to have a normal CT scan. This analysis included datafor any tracer.
Non-VVmTc-HMPAO.Five series were entered into the anal
ysis, giving a total patient count of 69. There was littleheterogeneity in the group (Q = 9, df = 4), and ja = 0.422(0.248-0.597). This sensitivity was not significantly differentfrom that obtained in studies using 99mTc-HMPAO(0.438).
CT Normal. Little heterogeneity was observed in this groupof interictal studies (Q = 3, df = 3) and /a, = 0.426 (0.282-0.569). This sensitivity is similar to that of the major series,although the confidence interval is broader at the lower end.
This value is derived from a relatively small patient pool, andthree of the four series report sensitivities > 0.500.
CONCLUSIONMost literature suggests that the primary role of SPECT
imaging in seizure disorders is the presurgical evaluation ofmedically refractory epileptic patients (18,19). However, thereis no single, large clinical study that definitively supports thisposition. This meta-analytical review of the published literaturecombined the available data to address this issue and otherquestions of clinical interest.
Meta-analysis is a statistical method of combining data fromseveral different studies (20). It allows clinical or scientifichypotheses to be retrospectively addressed through a rigorousmethodological analysis of published work, imparting a degreeof objectivity that is generally lacking in a standard narrativeliterature review. It also requires that all criteria for inclusionand exclusion of data be stated in advance (25,26). It does nothave universal acceptance as a genuine research tool and itslimitations should be well understood (27). One criticismfrequently voiced about data selection for the meta-analyticalprocedure is the inherent bias of using published data only, thusexcluding all studies which were not accepted or submitted forpublication. These studies may well arrive at different conclusions to those available in the literature and theoretically shouldbe available for inclusion (28). However, in reality, medicaldecisions are made based on published experiences and meta-analysis can give a quantitative estimate to the weight of theavailable published evidence. In this respect, it is superior to thenarrative literature review but clearly less desirable than aprospective, well-controlled, randomized large cohort clinicaltrial.
Table 1 illustrates the effect on our patient pool as we appliedfirst our inclusion criteria and then initially excluded fromanalysis all papers that reported patients who were medicallyresponsive or who had been systematically studied as a specialpopulation. Excluding papers that studied medically responsivepatients or those that did not specify whether their patients wererefractory led to a total loss of 153 patients. A second majorreduction in patient numbers occurred when special populationswere excluded.
Relationship of SPECT to Diagnostic EvaluationFour of our questions (Questions 1, 4, 5, 6) concern the role
of SPECT relative to diagnostic evaluation.Question 1. What are the sensitivity and false-positive rate of
interictal. postictal or ictal SPECT relative to diagnosticevaluation in (a) localization and (b) lateralization of a seizurefocus? The sensitivity of 99mTc-HMPAO SPECT in localizing
an epileptic focus increases in the order interictal =>postictal =>ictal. For the 13 series included in the interictal analysis (totalpatient count = 256, of whom 247 were évaluable),a meansensitivity value of 0.44 was obtained. When we examine theaccuracy of SPECT observations for postictal imaging, sensitivity increases to 0.75 and for ictal imaging to 0.96. True ictalscanning is difficult to achieve (due to methodological problems with existing tracers), consequently this aggregate is basedon only three series with a total patient count of 62. It is alsoimportant to keep in mind that 42 of 69 évaluablepostictalpatients and 42 of 51 évaluableictal patients are derived froma single center (Rowe et al.: 13.3; 36.2; 44.2; 44.3).
It can be inferred from these values that with currenttechniques and methodology, an interictal scan alone is not asensitive determinant of the site of an epileptic focus. Incontrast, interictal imaging with a PET tracer such as 18F-FDG
290 THEJOURNALOFNUCLEARMEDICINE•Vol. 39 •No. 2 •February1998
by on April 26, 2014. For personal use only. jnm.snmjournals.org Downloaded from

is reported in the literature by several authors to have localization sensitivities of about 0.70. Our findings suggest that acombination of interjetai imaging with ictal or postictal scanning is more sensitive than an interictal PET study. In fact,many of the reviewed ictal/postictal studies reported resultsonly relative to the interictal state. It is important to combineinterjeta! and either ictal or postictal imaging because an ictal orpostictal image could appear normal if read independently, butmay reflect increased perfusion at the seizure focus relative tointerictal hypoperfusion at the same site.
To determine if a gain in sensitivity is achieved whenlateralized SPECT findings are included with localized findings, we compared sens2 (lateralized) to sensi (localized).These did not differ for postictal or ictal data, likely related tothe common practice of only referring to "change from interictal" when reporting postictal/ictal abnormalities. However, for
interictal data sens2 was somewhat greater than sensi (0.582versus 0.438).
Two false-positive rates were determined. The estimated ratefor falsel was 7.4% for interictal and 1.5% for combined ictaland postictal data. These differences are statistically significant(p = 0.026). Again, the false-positive postictal data are basedon little published information and further studies are needed toconfirm that these rates of error are indeed so low. False2(9.5%) is somewhat greater than falsel only for interictal data.Thus, the increase in sensitivity obtained with sens2 is obtainedat the cost of a modest increase in false-positive findings.
Question 4. What are the sensitivity and false-positive rate of
interictal, postictal or ictal SPECT in pediatrie epilepsy? Fewreviewed papers described pediatrie patients, precluding meta-analysis. Table 1 shows that, for the two papers meeting ourinclusion criteria, there are reports of only 18 children who havehad interictal scans, of whom six have surgical follow-upreports. Four children are reported with postictal scans, ofwhom two have had surgical follow-up. One paper (43.1) thatcontributed to this small sample reports a 53% interictalsensitivity and false-positive rate of 9%. Postictal sensitivity
was 73%.Question 5. Are sensitivity or false-positive measures a
function of technical factors such as instrumentation quality orradiopharmaceutical dose? Camera resolution and administered dose did not significantly affect sensitivity (only évaluablein studies using WmTc-HMPAO). However, there was signifi
cant heterogeneity (p < 0.01) in the interictal data which wasnot present (p > 0.5) when the three papers reporting datacollected with low-resolution systems were removed from theanalysis. Therefore, it appears that findings are likely to bemore variable with low-resolution systems (FWHM > 12 mm).
Question 6. With what frequency is hyperperfusion seen inthe interictal state? We examined the database for the numberof instances that interictal hyperperfusion was reported in the624 patients for whom data were collected. Seven papersreported interictal hyperperfusion in a total of 31 patients(approximately 5%). These reports did not monitor preinjectionEEC. All but one of these observations were made usinglow-resolution cameras. This incidence is similar to earlierreports (18).
Relationship of SPECT to Surgical OutcomeTwo of our questions (Questions 2 and 3) concern the role of
SPECT relative to surgical outcome.Question 2. What are the sensitivity and false-positive rate of
interictal, postictal or ictal SPECT relative to surgical outcomein localization of a seizure focus? There are relatively fewSPECT studies reporting on patients with surgical follow-up of
at least 1 yr. Sensitivity of SPECT relative to surgical outcomeshows a similar trend to that relative to diagnostic evaluation:interictal => postictal => ictal (Table 5). However, all of theictal/surgical outcome data are derived from a single report. Itis encouraging to note that this one paper (44) reports surgicaloutcomes for all three scan conditions and the sensitivityincreases as expected from 0.67 to 0.75 to 1.00.
Misleading results were somewhat less common relative tosurgical outcome than relative to diagnostic evaluation, likelybecause EEG can be falsely localizing. False3 and false4 werenot substantially different. However, postictal and ictal dataincluded only a small number of subjects. Consequently, ourresults should be interpreted cautiously.
Question 3. What is the differential relationship to surgicaloutcome among unifocal, multifocal unilateral and multifocalbilateral SPECT abnormalities? The expanded definition ofsensitivity, in other words unifocal or multifocal SPECT findings ipsilateral to the side of surgery, resulted in a slightlyhigher interictal sensitivity (0.51 versus 0.43 for unifocalSPECT) without an increase in false localization. No differencewas found for the postictal data, but most studies were notpresented in a way that would lead to a report of multifocal "hotspots." That is, such data are primarily interpreted relative to
interictal data with a specific focus on finding regions ofrelative rCBF increase.
Most SPECT findings are compared to interictal or ictalEEG. Neither is an absolute gold standard and, in someinstances, will be nonlocalizing when SPECT is positive. Inorder for SPECT (or PET and MRI) to be validated as a usefulclinical procedure, there is a need for good outcome measuresafter surgery. Poor surgical outcome can be a result of poorsurgical technique or incomplete removal of the focus ratherthan the inaccurate localization of the focus by the diagnosticmodalities. However, if SPECT is to play a clinical role inpresurgical evaluation of patients and complement or replaceinvasive EEG procedures, there must be significant correlationbetween SPECT findings and surgical outcome. In this regard,it was surprising how few investigators reported the surgicaloutcome of their patients. Of the 624 patients reported in allpapers meeting our inclusion criteria, surgical outcome datawere available on 99 with interictal SPECT studies (16%), 51with postictal data (8%) and only 12 with ictal SPECT (2%).
Other QuestionsNon-99r"Tc-HMPAO. There were five non-WmTc-HMPAO
series analyzed. The sensitivity of these series (0.422) was notsignificantly different from that obtained in studies using99mTc-HMPAO (0.438). There were insufficient data to deter
mine if postictal or ictal data from other tracers were comparable to that from 99mTc-HMPAO.
CT Normal. Some investigators excluded patients with CTevidence of structural abnormalities. The combined interictalsensitivity determined from these papers is comparable to thatof the major series, indicating that the presence or absence ofstructural lesions (at least as observed on CT) has little to dowith the likelihood of observing a SPECT abnormality.
Extratemporal Seizures. The majority of évaluable dataconcern patients with seizures of temporal lobe origin. Only onepaper reported a pure population of extratemporal foci (39) andthis report does not include results of surgical outcome. Interictal and ictal sensitivities were 0.400 and 0.667, respectively.However, the patient numbers were small (6/12 évaluable).Four further papers reported data from populations that mixedpatients with temporal and extratemporal seizures. When therespective papers (1, 16, 39, 201) were excluded from the
META-ANALYSISOF SPECT IN EPILF.PSY•Devous et al. 291
by on April 26, 2014. For personal use only. jnm.snmjournals.org Downloaded from

principal analysis, the resulting pure population of temporallobe seizure patients showed reasonable homogeneity (Q =12.9, df = 8), with /i. = 0.46 (sensi), within confidence limitsof 0.36-0.54. This compares to 0.44 for the mixed temporal/extratemporal group. There are insufficient published data todraw any definitive conclusions about SPECT in patients withextratemporal seizures.
In this review, we made no attempt to compare the accuracyof SPECT to CT and MRI. The ability of structural imagingwith CT and MRI to localize/lateralize epileptic foci hassteadily improved. It is likely that sensitivities for detectingstructural lesions reported in the pre-1990 papers would havelittle relationship to the current sensitivity of MRI. However,MRI may identify structural lesions that are not connected tothe epileptic disorder. Therefore, it is possible that sensitivity oflesion identification would increase with evolving MRI technology, while specificity for identifying the epileptic focusmight not. In a retrospective study published in 1991, 78%correct lateralization was achieved using MRI, with a false-positive rate of 5% (29). Prospective comparative studies arerequired to define the relationship between SPECT and MRI.
It became evident in reviewing the literature that there isgreat variability in the methods and standards of reporting ofthese data. As a consequence of our experience, we recommendthat the following information be included in future reports inorder to improve the applicability of reported data to interestedreaders and the eventual implementation of this technique byother institutions:
1. Describe results of EEG, SPECT and CT/MRI (especiallymesial temporal MRI evaluation) on a patient-level basis.
2. Report EEG before, during and after all radiopharmaceu-tical injections.
3. Indicate, on a patient-level basis, the degree of concordance or disagreement between EEG and SPECT for bothictal and interictal studies.
4. Describe criteria used to define ictal, postictal or interictalstates (including determination of seizure onset for ictal/postictal studies, determination of interictal status, andlength of required seizure-free time preceding interictalstudies).
5. Describe EEG morphology and semiology (behavior) atthe time of ictal injections.
6. Describe all criteria used to determine localization on apatient-level basis.
7. Provide status of medications at time of imaging.8. Report image analysis, evaluation or interpretation tech
niques.9. Provide detailed results for patients not referred for
surgery.10. Provide data on the clinical decision-making impact of
SPECT.
Gaps in the current literature also became evident during thisreview. Though not all-inclusive, we identified a need for thefollowing future studies:
1. Studies using SPECT imaging in epilepsy that includeictal (preferably) or postictal scanning in addition tointerictal studies in all patients (though difficult withcurrent tracers, upcoming availability of tracers that arestable in vitro and automated delivery devices should domuch to enhance this opportunity).
2. Studies that report surgery follow-up data, particularly toclarify, in patients with EEG "false localizations" (poor
outcome), the relationship between functional imagingand surgical outcome.
3. Surgical outcome studies that determine whether SPECTcan provide data additional to MRI and EEG, in terms ofoutcome prediction and ability to identify EEG-nonlocal-izing patients who can benefit from surgery.
4. Studies in large cohorts of patient populations withextratemporal seizures, pediatrie epilepsies and new-onset patients.
5. Studies that clarify the relationship between timing ofinjection for ictal/postictal scans and sensitivity andspecificity of localization (perhaps leading to widely-accepted standards regarding the duration of ictal andpostictal stages).
6. Natural history studies of the evolution of rCBF abnormalities in new-onset patients, their relationship to prognosis and their response to medical therapy.
There is little doubt that SPECT imaging can play an importantrole in patient management for problem epilepsy. SPECTuniquely offers the possibility of visualizing rCBF at all stagesof a seizure, which our results suggest leads to an accuracy oflocalization of the focus of approximately 90% in temporal lobeepilepsy. However, the current literature is not conclusive in itssupport behind this claim, primarily due to inadequate ictalSPECT data.
APPENDIX AThe following articles were included in this review. The index
number xx.yz identifies the series within paper xx, where y = 1, 2or 3 for interictal, ictal and postictal, respectively, and z is added todistinguish multiple series from the same paper and observationperiod.
1.1. Baje M, Basic M, Hajnsek S, Ivancevic D. Imaging of hemodynamic changes inpatients with epilepsy using ""Te HM-PAO and SPECT. J Med Imag 1987; 1:319-
324.3.1. Stefan H. KühnenC, Biersack HJ, Reichmann K. Initial experience with
WmTc-hexamethyl-propylene amine oxime (HM-PAO) SPECT in patients with
focal epilepsy. Epilepsy Res 1987;1:134-I38.4.1. Stefan H. Pawlik G. Böcher-Schwarz HG, et al. Functional and morphological
abnormalities in temporal lobe epilepsy: a comparison of interictal and ictal EEG,CT, MRI, SPECT and PET. J Neural 1987;234:377-384.
5.1. Andersen AR, Gram L, KjœrL, et al. SPECT in partial epilepsy: Identifying side ofthe focus. Ada Neural Scand 198(suppl):90-95.
9.1. Ryding E. Rosen I, Elmqvist D. Ingvar DH. SPECT measurements with g9mTc
HM-PAO in focal epilepsy. J Cereb Blood Flow Melab I988;8: S95-SIOO.
13.3. Rowe CC, Berkovic SF, Sia BST, et al. Localization of epileptic foci with postictalSPECT. Ann Neural l989;26:660-668.
14.1. Smith DF, Smith FW, Knight RSG, Roberts RC, Gemmell HG. "Tc-HMPAO
SPECT in partial epilepsy: a preliminary report. Br J Radial 1989;62:970-973.16.1. Cordes M, Christe W, Henkes H, et al. Focal epilepsies: HM-PAO SPECT
compared with CT, MR and EEG. J Camp Assisi Tomogr 1990:14:402-409.
22.1,2.3. Stefan H. Bauer J, Feistel H. et al. Regional cerebral blood flow during focalseizures of temporal and frontocentral onset. Ann Neural 1990:27:162-166.
23.11,1. Vies JSH, Demandi E, Ceulemans B, de Roo M, Casaer PJM. SPECT in seizuredisorders in childhood. Brain Dev 1990;12:385-389.
26.1. Bartenstein P, Ludolph A, Schober O, et al. Benzodiazepine receptors and cerebralblood now in partial epilepsy. Eur J NucÃMed 1991:18:111-118.
28.1. Hajek M, Siegel AM, Haldemann R. von Schulthess GK, Weiser HG. Value ofHM-PAO SPECT in selective temporal lobe surgery for epilepsy. J Epilepsy1991;4:43-51.
29.1,2. Bauer J, Stefan H, Feistel H, et al. Iktuale und interiktuale ""Tc-HMPAO-
SPECT Untersuchungen bei temporallappenepilepsien mit unilateralem EEG-fokus. Der Nervenarzt 1991:62:745-749.
31.1. Kim SE, Choi CW, Lee DS, Chung J, Lee MC, Koh C. Usefulness of"""Tc-HMPAO SPECT in the localization of the epileptic focus in temporal lobeepilepsy: comparison with EEG, MRI, and CT. Kor J NucÃMed 1991; 25:17-26.
33.1. GrünwaldF. Durwen HF, Bockisch A, et al. "Tc-HMPAO brain SPECT in
medically intractable temporal lobe epilepsy: a postoperative evaluation. J NucÃMed 1991:32:388-394.
34.1. Rowe CC, Berkovic SF, Austin MC, et al. Visual and quantitative analysis ofinterictal SPECT with '"'Tc-HMPAO in temporal lobe epilepsy. J NucÃMed
1991:32:1688-1694.35.1. Verhoeff NPLG, Weinstein HC, Aldenkamp AP, Overweg J, Van Royen EA,
Verbeeten B Jr. Focus localization in patients with partial epilepsy with """Te-
292 THE JOURNALOFNUCLEARMEDICINE•Vol. 39 •No. 2 •February 1998
by on April 26, 2014. For personal use only. jnm.snmjournals.org Downloaded from

HMPAO SPECT under continuous surface EEC monitoring. NucÃMed Commun1992:13:127-136.
36.2. Newton MR. Berkovic SF, Austin MC. Reutens DC, McKay WJ, Bladin PK.Dystonia. clinical latéralisationand regional blood How changes in temporal lobeseizures. Neurology 1992:42:371-377.
39.1,2. Marks DA. Katz A, Hoffer P. Spencer SS. Localization of extratemporal epilepticfoci during ictal SPECT. Ann Neural 1992:31:250-255.
40.1. Ryvlin P, Philippen B. Cinotti L. Froment JC. La. Bars D. Mauguiere F. Functionalneuroimaging strategy in temporal lobe epilepsy: a comparative study of "FDG-PAT and """Tc-HMPAO-SPECT. Ann Neural 1992:31:650-656.
43.11.1.2. Adams C, Hwang PA. Gilday DL, Armstrong DC. Becker LE. HoffmanHJ. Comparison of SPECT, EEG, CT. MRI, and pathology in partial epilepsy.Pediat Neural 1992:8:97-103.
44.1,2,3. Newton MR. Berkovic SF. Austin MC, Rowe CC, McKay JW. Bladin PF.Postictal switch in blood flow distribution and temporal be seizures. J NeuralNeurosurg Psychiatr 1992:55:891-894.
47.1. Franceschi M, Messa C. Perini-Strambi L, et al. SPECT imaging of cerebralperfusion in patients with nonrefractory temporal lobe epilepsy. Acta Neural Scand1993:87:268-274.
48.1. Bartenstein P, Ludolph A, Schober O. Lottes G. Böttgerl. Beer HF. Vergleich vonblutflußund benzodia/epin-rezeptor-verteilung bei fokaler epilepsie: vorläufigeergebnisse einer SPECT-studie. Nuklear Medi:in 1989:24:181-186.
101.11,1. Gelfand MJ. Stowens DW. Iodine-123 iofetamine single photon emission
tomography in school age children with difficult to control seizures. Clin NucÃMed 1989:14:675-680.
105.1. Lee Bl. Markand ON. Wellman HN. et al. HIPDM-SPECT in patients withmedically intractable complex partial seizures. Arch Neural 1988:45:397-402.
106.2. Shen W, Lee Bl, Park H, et al. HIPDM-SPECT brain imaging in the presurgicalevaluation of patients with intractable seizures. J NucÃMed 1990:31:1280-1284.
108.1. Dietrich ME, Bergen D, Smith MC, Fanello R. Ali A. Correlation of abnormalities of interjeta! n-isopropyl-p-iodoamphetamine single-emission tomographywith focus of seizures disorders. Epilepsia 1991:32:187-194.
110.1. Jibiki I, Kuboto T, Fujimoto K. et al. High reproducibility of regionalabnormalities of interictal 123I-IMP SPECT brain scans in adults with partial
epilepsy. Ear Arch Psychiatr Clin Neurosci 1990:240:5-8.
201.2,3. Duncan R. Patterson J. Roberts R, Hadley DM. Bone I. Ictal/postictal SPECTin the presurgical localization of complex partial seizures. J Neural NeurosurgPsychiatr 1993:56:141-148.
REFERENCES1. Surgery for Epilepsy-NlH Consensus Conference. JAMA 1990:264:729-733.2. Rougier A. Dartigues J-F. Commenges D. Claverie B. Loiseau P. Cohadon F. A
longitudinal assessment of seizure outcome and overall benefit from 100 cortectomiesfor epilepsy. J Neural Neurosurg Psychiatry 1992:55:762-767.
3. Engel J Jr. Van Ness PC, Rasmussen T. Ojemann LM. Outcome with respect toepileptic seizures. In: Engel J Jr. ed. Surgical treatment of the epilepsies, 2nd ed. NewYork: Raven Press; 1993:609-621.
4. Daly DD. Epilepsy and syncope. In: Daly DD, Pedley TA, eds. Current practice ofclinical clt'i'tnicnct-piutlography. New York: Raven Press; 1990:269-334.
5. Engel J Jr. Driver MV. Falconer M. Electrophysiological correlates of pathology andsurgical results in temporal lobe epilepsy. Brain 1975:98:129-156.
6. Sammaritano M, de Lotbiniere A, Andermann F. et al. False lateralization by surfaceEEG of seizure onset in patients with temporal lobe epilepsy and gross focal cerebrallesions. Ann Neural 1987:21:361 369.
7. Spencer SS, Williamson PD, Bridgers SL. et al. Reliability and accuracy of localization by scalp ictal EEG. Neurology 1985:35:1567-1575.
8. Spencer SS. Depth electroencephalography in selection of refractory epilepsy forsurgery. Ann Neural 1981:9:207-214.
9. French JA, Williamson PD. Thadani VM, et al. Characteristics of medial temporal lobeepilepsy: I. Results of history and physical examination. Ann Neural 1993:34:774-
780.10. Editorial. Lancet 1992:340:343-344.
11. Henry TR. Mazziotta JC, Engel J, et al. Quantifying interictal metabolic activity inhuman temporal lobe epilepsy. J Cereh Blood Flow Melah 1990:10:748-757.
12. Theodore WH. Dorwart R, Holmes M. Porter RJ. DiChiro G. Neuroimaging inrefractory partial seizures. Comparison of PET, CT and MRI. Neurology 1986:36:750-759.
13. Engel J Jr, Henry TR. Risinger MW, et al. Pre-surgical evaluation for partial epilepsy:Relative contributions of chronic depth electrode recordings versus FDG-PET andscalp sphenoidal ictal EEG. Neurology 1990; 40:1670-1677.
14. BontéFJ. Devous MD Sr, Stokely EM. et al. Single-photon tomographic determination
of regional cerebral blood flow in epilepsy: a preliminary report. Arch Neural1983:40:267-271.
15. Lee Bl. Markand ON. Wellman HN. et al. HIPDM-SPECT in patients with medicallyintractable complex partial seizures: ictal study. Arch Neural 1988:45:397-402.
16. Devous MD, Leroy RF. Comparison of interictal and ictal regional cerebral blood flowfindings with scalp and depth electrode seizure focus localization [Abstract]. J CerebBlood Flow Metab 1989;9:S9I.
17. BontéFJ, Devous MD Sr, Stokely EM, et al. Single-photon computed tomographic
determination of regional brain blood flow in the seizure disorders. Am J PhysiolImaging 1988:3:30-31.
18. Devous MD Sr, Leroy RF, Homan RW. Single photon emission computed tomographyin epilepsy. In: Freeman LM. Blaufox MD, cds. Seminars in nuclear medicine.Philadelphia: W.B. Saunders; 1990:325-341.
19. Duncan R. Epilepsy. Cerebral blood flow and cerebral metabolic rate. CerebrovascBrain Metab Rev 1992:4:105-121.
20. Glass GV. Primary, secondary and meta-analysis of research. Educ Res 1976:5:3-9.
21. Leroy RF. SPECT in epilepsy. In: Weber DA, Devous MD Sr, Tikofsky RS, eds.Workshop on brain SPECT perfusion imaging: optimizing image acquisition, processing, display, and interpretation. DOE CONF-9110368. Washington. DC: U.S. Dept. ofEnergy; 1992:91-99.
22. Stewart LA, Parmar MKB. Meta-analysis of the literature or of individual patient data:is there a difference? Lancet 1993:341:418-422.
23. DerSimonian R, Laird N. Meta-analysis in clinical trials. Contr Clin Trials 1986:7:177-188.
24. Brownlee KA. Statistical theory and methodology. New York: Wiley; 1965:148-150.
25. Boisscl JP, Blanchard J. Panak E, Peyrieux JC, Sacks H. Considerations for themeta-analysis of randomised clinical trials. Carttr din Trial* 1989:10:254-281.
26. Sacks HS, Berrier MDJ, Reitman D. Ancona-Berk VA, Chalmers TC. Meta-analysis ofrandomised controlled trials. N EnglJ Med 1987:316:450-455.
27. Buyse M, Piedbois P. Meta-analysis. Use and misuse [Letter]. J Clin Oncol
1993:11:382.28. Thacker SM Meta-analysis. A quantitative approach to research integration. JAMA
1988:259:1685-1689.
29. Kuzniecky R. Suggs S. Gaudier J. Faughl E. Lateralization of epileptic foci bymagnetic resonance imaging in temporal lobe epilepsy. J Neuroimag 1991:1:163-167.
Paradoxical Hippocampus Perfusion in Mild-to-ModerateAlzheimer's Disease
Kazunari Ishii, Masahiro Sasaki, Shigeru Yamaji, Setsu Sakamoto. Hajime Kitagaki and Etsuro MoriDivisions of Neuroimaging Research and Clinical Neitrosciences, Hyogo Institute for Aging Brain and Cognitive Disorders(Hl-ABCD), Himeji; and Department of Radiology, Kobe University School of Medicine, Kobe, Japan
The purpose of this study was to clarify the changes in hippocampalperfusion in mild-to-moderate Alzheimer's disease using PET and15O-labeled water. Methods: Sixteen patients with probable mild-to-moderate Alzheimer's disease (age: 68.1 ± 11.3 yr; MMSE:
21.1 ±4.5) and 10 normal volunteers (age: 65.1 ±8.2 yr) werestudied. Regional cerebral blood flow (CBF) and cerebral bloodvolume (CBV) were measured using 15O-labeled water autoradio-graphie method, C15O-gas inhalation technique and PET. Results:Although the mean CBF in the parietotemporal region was signifi-
Received Nov. 21, 1996; revision accepted Apr. 15, 1997.For correspondence or reprints contact: Kazunari Ishii, Hyogo Institute for Aging Brain
and Cognitive Disorders, 520 Saisno-Ko. Himeji, Hyogo 670-0981, Japan.
cantly lower in the patient group than in the control group, the meanCBF in the hippocampus did not show significant reduction betweenthe two groups, both in absolute and relative values. There was nosignificant regional CBV difference between the two groups. Parietotemporal perfusion correlated well with cognitive scores, both inabsolute and relative values, in Alzheimer's disease, but hippocam
pal perfusion did not correlate well. Conclusion: Hippocampalperfusion was preserved in mild-to-moderate Alzheimer's disease.
Key Words: PET; Alzheimer's disease; Oxygen-15-labeled water;
hippocampus; cerebral blood flow
J NucÃMed 1998;39:293-298
PRESERVEDHIPPOCAMPALPERFUSIONINALZHEIMER'SDISEASE•Ishii et al. 293
by on April 26, 2014. For personal use only. jnm.snmjournals.org Downloaded from