Embed Size (px)
Citation preview
Specific Impairments in Cognitive Development: A Dynamical Systems Approach
Frank D. Baughman ([email protected])
Michael S. C. Thomas ([email protected])
School of Psychology, Birkbeck, University of London, London WC1E 7HX, UK
Abstract
Neuropsychologists have frequently proposed that domain-specific deficits can be observed in developmental disorders (e.g., phonology in dyslexia, theory of mind in autism, gram-mar in specific language impairment, face recognition in pro-sopagnosia, mathematics in dyscalculia). These deficits ap-peal to a modular cognitive architecture. However, specific developmental deficits are at odds with theories that posit a high degree of interactivity between cognitive abilities across development. If there are early deficits, why do these not spread across the cognitive system during development? Or experience compensatory help from other initially intact com-ponents? We address these questions within a dynamical sys-tems framework (van der Maas et al., 2006). We explore the conditions for deficit spread and compensation for a range of possible cognitive architectures, from modular to fully dis-tributed. While preliminary, the results point to the impor-tance of specifying precisely the normal developmental archi-tecture of a system prior to characterizing patterns of impair-ment that might emerge from it.
Introduction Cognitive neuropsychology frequently appeals to the as-sumption that separable, distinct cognitive processes form the basis of the human cognitive system. Much of the evi-dence for this claim comes from studies of adult focal brain damage or disease, in which behaviors are found to disasso-ciate. This so-called ‘fractionation’ of the cognitive system has been exploited to create models of the normal adult cognitive architecture (Shallice, 1988). A point of conten-tion for many theorists lies in the application of such models to developmental disorders (Temple, 1997). At first blush, such an extension would seem to require two assumptions: (1) that the child’s cognitive system is also modular; and (2) that domain-specific deficits can persist without compensa-tion by or spread to other causally linked cognitive abilities that are undergoing processes of development. Both of these assumptions have been questioned (e.g., Karmiloff-Smith, 1998). Nevertheless, uneven cognitive profiles are a robust observation in childhood. Current debates revolve around how such profiles could emerge from cognitive develop-ment, and whether developmental deficits are ever truly specific to a single cognitive domain.
The answers to these questions very much depend on the nature of the cognitive architecture present in children. For example, distributed theories (of the sort inspired by McClelland & Rumelhart, 1988) lead to doubts that any deficit, however domain specific to begin with, could re-main so across development. In such theories, cognitive
abilities are graded and interactive, relying on the contribu-tion of many different processes (and brain regions). Evi-dence from the neurosciences supports the view that the brain is highly interactive and capable of compensation fol-lowing some forms of early damage (Thomas & Karmiloff-Smith, 2002). Between the extremes of fully modular and fully distributed theories lie various positions that propose more limited degrees of cognitive differentiation. E.g., hemispheric specialization may be important even if func-tions are interactive within each hemisphere, as evidenced by the emergence of laterality effects in language after uni-lateral brain damage in the domains of language (Bates & Roe, 2001) and spatial cognition (Styles, 2001). Some ac-counts focus on the importance of a central executive (see e.g., Baddeley, 1996), while others emphasize hierarchical organization in cognition (e.g., Anderson & Lebiere, 1998).
It can be difficult to anticipate the consequences of as-suming a given underlying architecture in children for sub-sequent explanations of developmental deficits, as soon as one moves away from a modular system in which each abil-ity develops in isolation (and so, presumably, can be im-paired in isolation). One response to this difficulty is to ap-peal to formal computational modeling of developmental systems. Downstream effects of early anomalies can be quantitatively charted. Unfortunately, here we find a relative lacuna in the literature. Computational models of develop-ment have in the main focused on the acquisition of specific domains, rather than the development of large scale systems with multiple and heterogeneous interacting components – let alone extending these to consider atypical development.
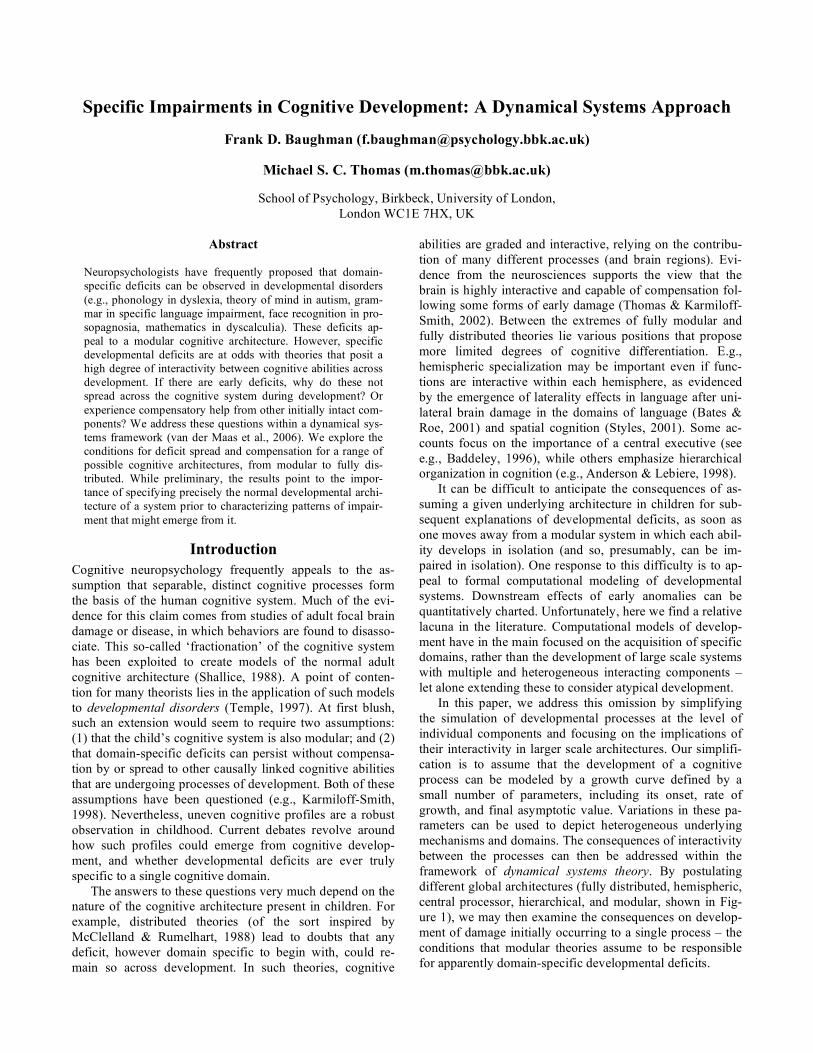
In this paper, we address this omission by simplifying the simulation of developmental processes at the level of individual components and focusing on the implications of their interactivity in larger scale architectures. Our simplifi-cation is to assume that the development of a cognitive process can be modeled by a growth curve defined by a small number of parameters, including its onset, rate of growth, and final asymptotic value. Variations in these pa-rameters can be used to depict heterogeneous underlying mechanisms and domains. The consequences of interactivity between the processes can then be addressed within the framework of dynamical systems theory. By postulating different global architectures (fully distributed, hemispheric, central processor, hierarchical, and modular, shown in Fig-ure 1), we may then examine the consequences on develop-ment of damage initially occurring to a single process – the conditions that modular theories assume to be responsible for apparently domain-specific developmental deficits.
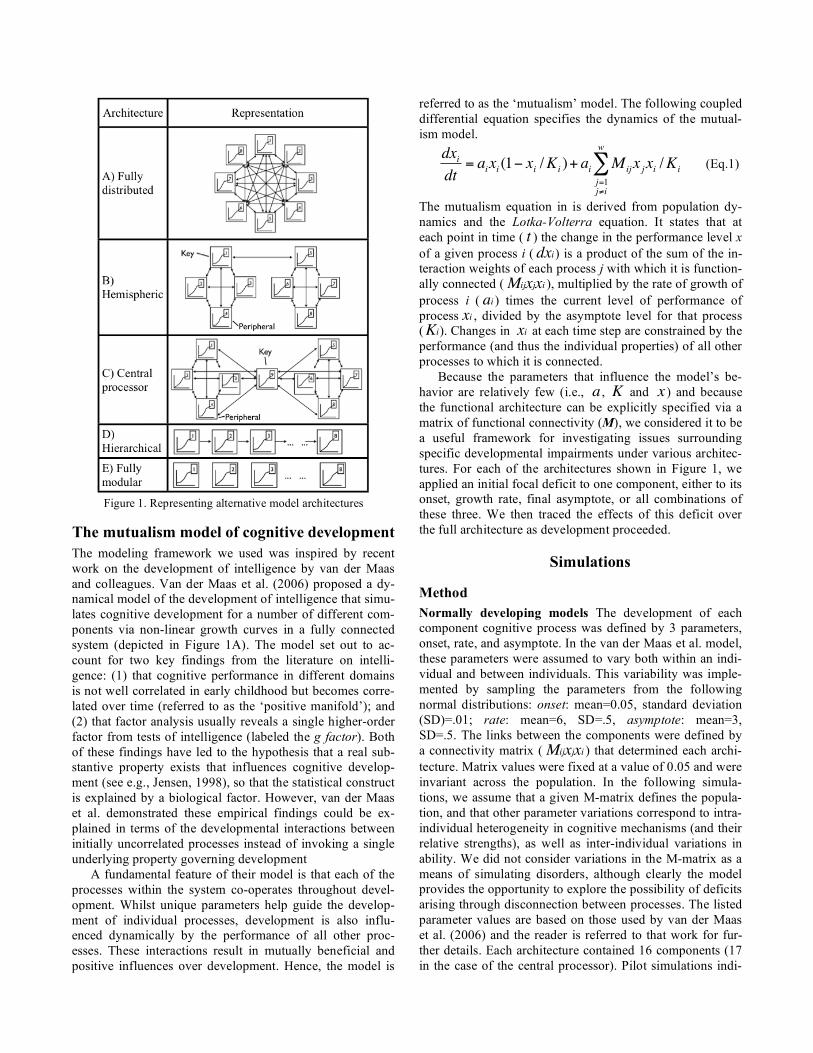
Figure 1. Representing alternative model architectures
The mutualism model of cognitive development The modeling framework we used was inspired by recent work on the development of intelligence by van der Maas and colleagues. Van der Maas et al. (2006) proposed a dy-namical model of the development of intelligence that simu-lates cognitive development for a number of different com-ponents via non-linear growth curves in a fully connected system (depicted in Figure 1A). The model set out to ac-count for two key findings from the literature on intelli-gence: (1) that cognitive performance in different domains is not well correlated in early childhood but becomes corre-lated over time (referred to as the ‘positive manifold’); and (2) that factor analysis usually reveals a single higher-order factor from tests of intelligence (labeled the g factor). Both of these findings have led to the hypothesis that a real sub-stantive property exists that influences cognitive develop-ment (see e.g., Jensen, 1998), so that the statistical construct is explained by a biological factor. However, van der Maas et al. demonstrated these empirical findings could be ex-plained in terms of the developmental interactions between initially uncorrelated processes instead of invoking a single underlying property governing development
A fundamental feature of their model is that each of the processes within the system co-operates throughout devel-opment. Whilst unique parameters help guide the develop-ment of individual processes, development is also influ-enced dynamically by the performance of all other proc-esses. These interactions result in mutually beneficial and positive influences over development. Hence, the model is
referred to as the ‘mutualism’ model. The following coupled differential equation specifies the dynamics of the mutual-ism model.
!
dxi
dt= aixi (1" xi /Ki )+ ai Mijx j xi /Ki
j=1j#i
w
$ (Eq.1)
The mutualism equation in is derived from population dy-namics and the Lotka-Volterra equation. It states that at each point in time (
!
t ) the change in the performance level x of a given process i (
!
dxi) is a product of the sum of the in-teraction weights of each process j with which it is function-ally connected (
!
Mijxjxi ), multiplied by the rate of growth of process i (
!
ai ) times the current level of performance of process
!
xi , divided by the asymptote level for that process (
!
Ki). Changes in
!
xi at each time step are constrained by the performance (and thus the individual properties) of all other processes to which it is connected.
Because the parameters that influence the model’s be-havior are relatively few (i.e.,
!
a ,
!
K and
!
x ) and because the functional architecture can be explicitly specified via a matrix of functional connectivity (M), we considered it to be a useful framework for investigating issues surrounding specific developmental impairments under various architec-tures. For each of the architectures shown in Figure 1, we applied an initial focal deficit to one component, either to its onset, growth rate, final asymptote, or all combinations of these three. We then traced the effects of this deficit over the full architecture as development proceeded.
Simulations
Method Normally developing models The development of each component cognitive process was defined by 3 parameters, onset, rate, and asymptote. In the van der Maas et al. model, these parameters were assumed to vary both within an indi-vidual and between individuals. This variability was imple-mented by sampling the parameters from the following normal distributions: onset: mean=0.05, standard deviation (SD)=.01; rate: mean=6, SD=.5, asymptote: mean=3, SD=.5. The links between the components were defined by a connectivity matrix (
!
Mijxjxi ) that determined each archi-tecture. Matrix values were fixed at a value of 0.05 and were invariant across the population. In the following simula-tions, we assume that a given M-matrix defines the popula-tion, and that other parameter variations correspond to intra-individual heterogeneity in cognitive mechanisms (and their relative strengths), as well as inter-individual variations in ability. We did not consider variations in the M-matrix as a means of simulating disorders, although clearly the model provides the opportunity to explore the possibility of deficits arising through disconnection between processes. The listed parameter values are based on those used by van der Maas et al. (2006) and the reader is referred to that work for fur-ther details. Each architecture contained 16 components (17 in the case of the central processor). Pilot simulations indi-
cated that the results were not especially sensitive to the number of components included, with one exception. Popu-lations of 200 individuals were generated for each condition and mean performance calculated. The development of each individual system was simulated for 300 time steps. For impaired models, systems could be run for more time steps until a stable state was reached. Impaired models The specific deficits to onset, rate, as-ymptote, and combinations of these parameters were applied to the startstate of each architecture. We applied deficits at three levels, reducing the relevant parameter(s) by 25%, 50% and 75% of the normal value. We used several levels of damage to probe for possible non-linearities or threshold effects in the subsequent impairment. However, on the whole, linear changes in initial damage had linear effects on the consequent impairment. For clarity, we therefore present the results and analyses only for the highest level of damage across the different architectures. For fully distributed and modular architectures, only a single condition was run, since all components are equivalent. For hemispheric and central processor models, we distinguished between key processes and peripheral processes. For the hemispheric model, the key processes were those that communicated between hemi-spheres. For central processor, the key process was the cen-tral processor. Peripheral processes constituted the remain-der. For the hierarchical system, we investigated the conse-quences of damaging the hierarchy at the lowest level, and an intermediate level, and at the highest level. These distinc-tions are marked in Figure 1.
Results To assess the effects of damage, it is necessary to quantify the difference between growth curves in normal and dam-aged systems. We present two metrics for this purpose. The first focuses on the endstate performance level reached by each process. Where this is lower after damage, the system has experienced a deficit. The second metric looks at the area under the curve of each process, thereby assessing the trajectory towards the endstate. Where the area is reduced after damage, the system has experienced a delay. Both deficit and delay are possible within the same process. De-lay is possible without final deficit, but a final deficit is not possible without delay.
Our interest lies in the extent to which the overall proc-ess of development that operates within each architecture alters the pattern of impairment, either ameliorating the deficit in the damaged component via compensation from other initially unimpaired components, or spreading the deficit to other processes. To assess compensation and spread, we begin by measuring the normal level of perform-ance in each architecture, both in terms of the mean area under the curve for the growth trajectories of its component processes, and the endstate levels of the component proc-esses. These values are shown in Table 1. The scale of these numbers is to some extent arbitrary. The values merely re-flect the amounts of activation cycling around each type of
system, and the values will be naturally higher in systems with more interactivity. However, the values serve as a baseline for analyzing each kind of architecture and propor-tional changes in the values allow for comparisons between architectures. Table 1. Normal performance for each architecture in terms of the area under the growth curves (representing how long development
takes) and endstate levels (indicating final performance)
Normal
Area Normal Level
Fully distributed 10,883 11.8 Hemispheric (peripheral) 4,277 4.6 Hemispheric (key) 4,488 4.9 Central processor (peripheral) 4,756 5.2 Central processor (key) 6,552 7.1 Hierarchical (beginning) 2,792 3.0 Hierarchical (middle) 3,703 4.0 Hierarchical (end) 3,703 4.0 Fully modular 2,792 3.1
To derive a measure of compensation for a damaged com-ponent, we need to know what level of performance might be expected from it if no compensation from other processes were possible. The modular architecture captures this situa-tion and so generates the predicted impairment for a dam-aged process. The normal system provides information about the performance expected for the process when there is no damage. These two values (predicted normal perform-ance and predicted performance after damage with no com-pensation) give us the lower and upper bounds against which to gauge actual compensation. Formally, we measure the range of predicted damage (the normal performance N minus the predicted damaged performance P) and evaluate what proportion of that range has been closed by the ob-served performance A (derived by subtracting the predicted damaged performance P from the actual performance A). This value is expressed as a percentage.
!
A"P
N "P#100 (Eq.2)
If the observed performance is fully compensated and there-fore appears normal, A=N and Equation 2 yields 100%. If there is no compensation, A=P and Equation 2 yields 0%.
Figure 2 shows the mean amount of compensation that each architecture offered for 75% damage and collapsed across all combinations parameter change (onset, rate, as-ymptote) for area (delay) and final level (deficit) metrics. Unsurprisingly, the fully distributed model offered the greatest degree of compensation to the damaged process on both metrics, with performance around 70% above the level predicted by the damage. Within more differentiated archi-tectures, points of higher connectivity experienced greater compensation than those of lesser, shown in the hemispheric and central processor architecture. Only downstream proc-esses experienced compensation in the hierarchical system, but middle or last position made no difference. By defini-tion, the modular system could experience no compensation.
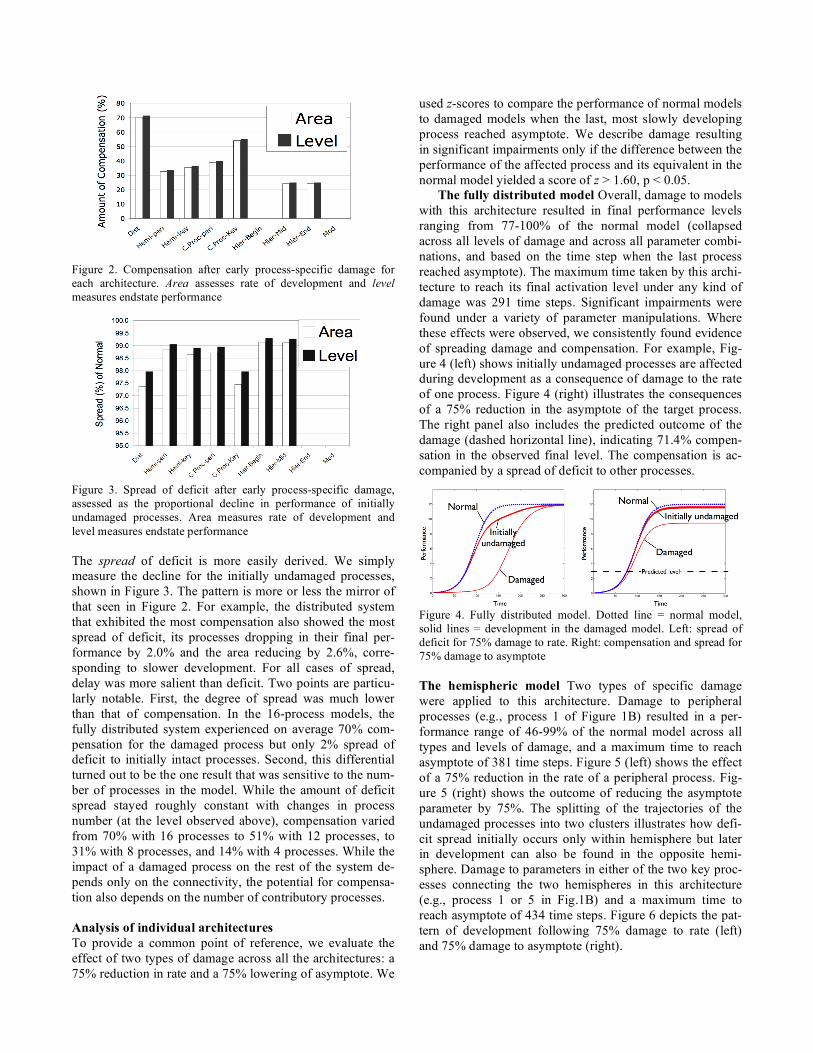
Figure 2. Compensation after early process-specific damage for each architecture. Area assesses rate of development and level measures endstate performance
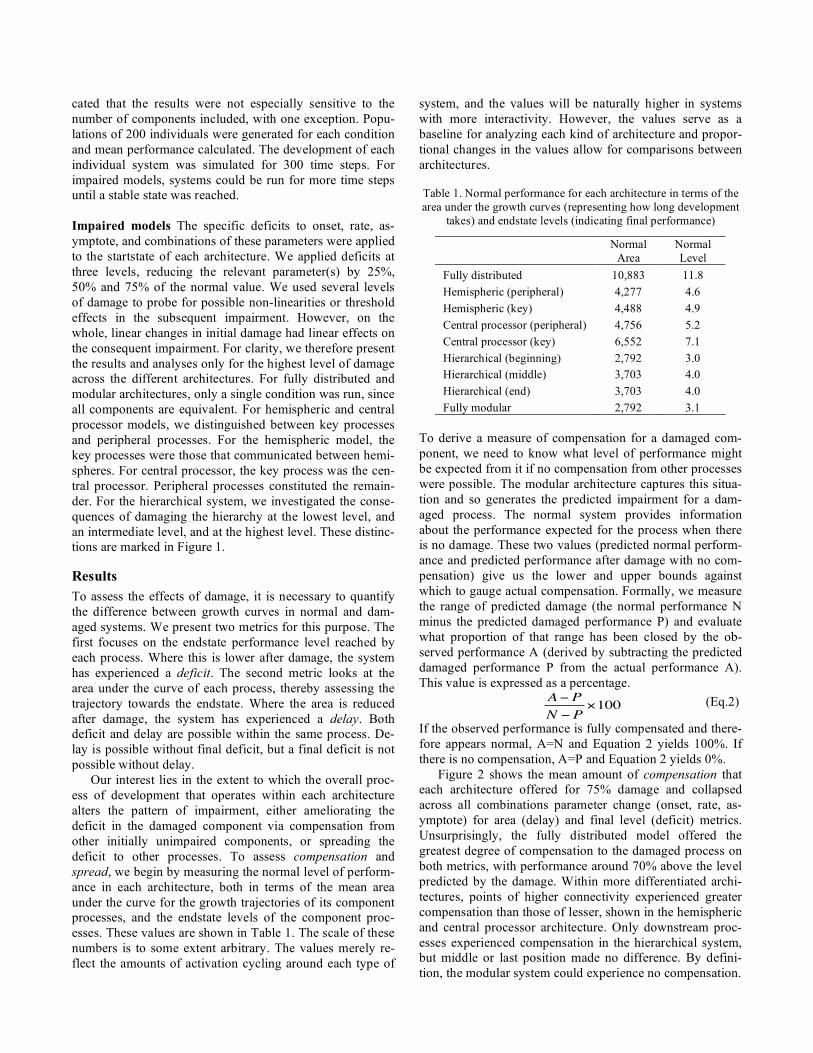
Figure 3. Spread of deficit after early process-specific damage, assessed as the proportional decline in performance of initially undamaged processes. Area measures rate of development and level measures endstate performance The spread of deficit is more easily derived. We simply measure the decline for the initially undamaged processes, shown in Figure 3. The pattern is more or less the mirror of that seen in Figure 2. For example, the distributed system that exhibited the most compensation also showed the most spread of deficit, its processes dropping in their final per-formance by 2.0% and the area reducing by 2.6%, corre-sponding to slower development. For all cases of spread, delay was more salient than deficit. Two points are particu-larly notable. First, the degree of spread was much lower than that of compensation. In the 16-process models, the fully distributed system experienced on average 70% com-pensation for the damaged process but only 2% spread of deficit to initially intact processes. Second, this differential turned out to be the one result that was sensitive to the num-ber of processes in the model. While the amount of deficit spread stayed roughly constant with changes in process number (at the level observed above), compensation varied from 70% with 16 processes to 51% with 12 processes, to 31% with 8 processes, and 14% with 4 processes. While the impact of a damaged process on the rest of the system de-pends only on the connectivity, the potential for compensa-tion also depends on the number of contributory processes. Analysis of individual architectures To provide a common point of reference, we evaluate the effect of two types of damage across all the architectures: a 75% reduction in rate and a 75% lowering of asymptote. We
used z-scores to compare the performance of normal models to damaged models when the last, most slowly developing process reached asymptote. We describe damage resulting in significant impairments only if the difference between the performance of the affected process and its equivalent in the normal model yielded a score of z > 1.60, p < 0.05.
The fully distributed model Overall, damage to models with this architecture resulted in final performance levels ranging from 77-100% of the normal model (collapsed across all levels of damage and across all parameter combi-nations, and based on the time step when the last process reached asymptote). The maximum time taken by this archi-tecture to reach its final activation level under any kind of damage was 291 time steps. Significant impairments were found under a variety of parameter manipulations. Where these effects were observed, we consistently found evidence of spreading damage and compensation. For example, Fig-ure 4 (left) shows initially undamaged processes are affected during development as a consequence of damage to the rate of one process. Figure 4 (right) illustrates the consequences of a 75% reduction in the asymptote of the target process. The right panel also includes the predicted outcome of the damage (dashed horizontal line), indicating 71.4% compen-sation in the observed final level. The compensation is ac-companied by a spread of deficit to other processes.
Figure 4. Fully distributed model. Dotted line = normal model, solid lines = development in the damaged model. Left: spread of deficit for 75% damage to rate. Right: compensation and spread for 75% damage to asymptote The hemispheric model Two types of specific damage were applied to this architecture. Damage to peripheral processes (e.g., process 1 of Figure 1B) resulted in a per-formance range of 46-99% of the normal model across all types and levels of damage, and a maximum time to reach asymptote of 381 time steps. Figure 5 (left) shows the effect of a 75% reduction in the rate of a peripheral process. Fig-ure 5 (right) shows the outcome of reducing the asymptote parameter by 75%. The splitting of the trajectories of the undamaged processes into two clusters illustrates how defi-cit spread initially occurs only within hemisphere but later in development can also be found in the opposite hemi-sphere. Damage to parameters in either of the two key proc-esses connecting the two hemispheres in this architecture (e.g., process 1 or 5 in Fig.1B) and a maximum time to reach asymptote of 434 time steps. Figure 6 depicts the pat-tern of development following 75% damage to rate (left) and 75% damage to asymptote (right).
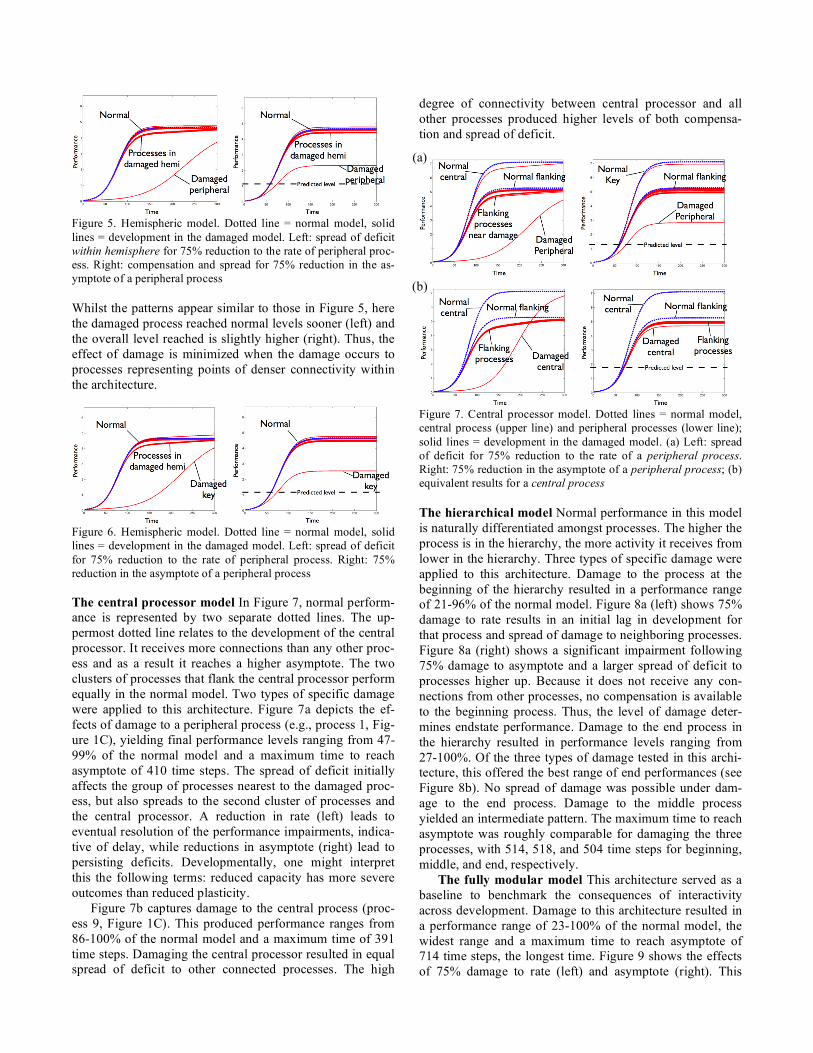
Figure 5. Hemispheric model. Dotted line = normal model, solid lines = development in the damaged model. Left: spread of deficit within hemisphere for 75% reduction to the rate of peripheral proc-ess. Right: compensation and spread for 75% reduction in the as-ymptote of a peripheral process Whilst the patterns appear similar to those in Figure 5, here the damaged process reached normal levels sooner (left) and the overall level reached is slightly higher (right). Thus, the effect of damage is minimized when the damage occurs to processes representing points of denser connectivity within the architecture.
Figure 6. Hemispheric model. Dotted line = normal model, solid lines = development in the damaged model. Left: spread of deficit for 75% reduction to the rate of peripheral process. Right: 75% reduction in the asymptote of a peripheral process The central processor model In Figure 7, normal perform-ance is represented by two separate dotted lines. The up-permost dotted line relates to the development of the central processor. It receives more connections than any other proc-ess and as a result it reaches a higher asymptote. The two clusters of processes that flank the central processor perform equally in the normal model. Two types of specific damage were applied to this architecture. Figure 7a depicts the ef-fects of damage to a peripheral process (e.g., process 1, Fig-ure 1C), yielding final performance levels ranging from 47-99% of the normal model and a maximum time to reach asymptote of 410 time steps. The spread of deficit initially affects the group of processes nearest to the damaged proc-ess, but also spreads to the second cluster of processes and the central processor. A reduction in rate (left) leads to eventual resolution of the performance impairments, indica-tive of delay, while reductions in asymptote (right) lead to persisting deficits. Developmentally, one might interpret this the following terms: reduced capacity has more severe outcomes than reduced plasticity.
Figure 7b captures damage to the central process (proc-ess 9, Figure 1C). This produced performance ranges from 86-100% of the normal model and a maximum time of 391 time steps. Damaging the central processor resulted in equal spread of deficit to other connected processes. The high
degree of connectivity between central processor and all other processes produced higher levels of both compensa-tion and spread of deficit.
Figure 7. Central processor model. Dotted lines = normal model, central process (upper line) and peripheral processes (lower line); solid lines = development in the damaged model. (a) Left: spread of deficit for 75% reduction to the rate of a peripheral process. Right: 75% reduction in the asymptote of a peripheral process; (b) equivalent results for a central process The hierarchical model Normal performance in this model is naturally differentiated amongst processes. The higher the process is in the hierarchy, the more activity it receives from lower in the hierarchy. Three types of specific damage were applied to this architecture. Damage to the process at the beginning of the hierarchy resulted in a performance range of 21-96% of the normal model. Figure 8a (left) shows 75% damage to rate results in an initial lag in development for that process and spread of damage to neighboring processes. Figure 8a (right) shows a significant impairment following 75% damage to asymptote and a larger spread of deficit to processes higher up. Because it does not receive any con-nections from other processes, no compensation is available to the beginning process. Thus, the level of damage deter-mines endstate performance. Damage to the end process in the hierarchy resulted in performance levels ranging from 27-100%. Of the three types of damage tested in this archi-tecture, this offered the best range of end performances (see Figure 8b). No spread of damage was possible under dam-age to the end process. Damage to the middle process yielded an intermediate pattern. The maximum time to reach asymptote was roughly comparable for damaging the three processes, with 514, 518, and 504 time steps for beginning, middle, and end, respectively.
The fully modular model This architecture served as a baseline to benchmark the consequences of interactivity across development. Damage to this architecture resulted in a performance range of 23-100% of the normal model, the widest range and a maximum time to reach asymptote of 714 time steps, the longest time. Figure 9 shows the effects of 75% damage to rate (left) and asymptote (right). This
(a)
(b)

damage can be seen affecting only the development of the damaged process with no spread of deficits to other proc-esses and no compensation to the damaged process.
Figure 8. Hierarchical model. Dotted lines = normal model, begin-ning process (lower), middle process (middle line) and end process (upper line); solid lines = development in the damaged model. (a) Left: spread of deficit for 75% reduction to the rate of the begin-ning process. Right: compensation and spread for 75% reduction in the asymptote; (b) equivalent results for the end process
Figure 9. Modular model. Dotted line = normal model, solid lines = development in the damaged model. Left: 75% reduction to one process. Right: 75% reduction in the asymptote of one process
Discussion Our aim is to reconcile interactivity of brain regions over development with the observation of apparently functionally specific developmental disorders. Two questions arise from the current results. First, what has the modeling work dem-onstrated beyond the obvious, i.e. that interactivity provides scope for deficit spread and compensation across develop-ment? At least three findings emerged: (a) both the density of connectivity at the point of damage and positioning in hierarchical system are influential in determining spread and compensation; (b) the number of processes interacting to generate a behavior affects compensation but not spread; (c) damage to a growth curve’s asymptote (the developmental equivalent of the capacity of a process) is more serious than damage to its rate (equivalent to plasticity).
Second, what lessons can we draw from these results for, say, the best cognitive architecture to explain deficits found in disorders such as autism and dyslexia? The modeling is
as yet too preliminary to relate to particular disorders; in-stead it points to the key factors that influence determine development in such systems, indicating the empirical evi-dence that should be sought to constrain current theories. The next step is to include constraints from particular do-mains and disorders. An example suffices. Temple (1997) contrasted two case studies, AB and Dr. S, both with devel-opmental prosopagnosia. She interpreted the deficits as aris-ing from specific damage to a multiple-component face rec-ognition system (Bruce & Young, 1986). AB was held to have a deficit to person identity nodes. These nodes have a unidirectional connection to name retrieval units, bidirec-tional connections to face recognition units, and bidirec-tional connections to the rest of cognitive system; face rec-ognition units have unidirectional connections from struc-tural encoding of visual information, and bidirectional con-nections to rest of cognitive system, which has a bidirec-tional connection to directed visual processing. The rest of cognitive system receives unidirectional input from facial speech analysis and expression analysis. Dr. S was held to have a deficit in consolidating face units or accessing person units. Given the model, what is the spread or compensation predicted by either of these specific deficits? Such predic-tions are necessary to test the proposed explanations. We argue that such questions must be considered using formal modeling similar to the framework presented here.
Acknowledgments This research was supported by UK MRC grant G0300188 to MT. We would like to thank Han van der Maas for his advice.
References Anderson, J. & Lebiere, C. (1998). The atomic components of
thought. LEA. Baddeley, A. (1996). Exploring the central executive. Quarterly
Journal of Experimental Psychology Section A 49(1), 5-28. Bates, E. & Roe, K. (2001). Language development in children
with unilateral brain injury. In C. Nelson & M. Luciana (Eds.), Handbook of developmental cognitive neuroscience (p. 281-307). Cambridge, Mass: MIT Press.
Bruce, V. & Young, A. (1986). Understanding face recognition. British Journal of Psychology, 77, 305-327.
Jensen, A. (1998). The g factor. Westport, CT: Praeger. Karmiloff-Smith, A. (1998). Development itself is the key to un-
derstanding developmental disorders. TICS, 2(10), 389-398. McClelland, J. & Rumelhart, D. (1988). Explorations in parallel
distributed processing: A handbook of models, programs, and exercises. Cambridge, MA: MIT Press.
Shallice, T. (1988). From neuropsychology to mental structure. New York, NY: CUP.
Styles, J. (2001). Spatial cognitive development. In C. Nelson & M. Luciana (Eds.), Handbook of developmental cognitive neu-roscience (p.399-414). Cambridge, Mass: MIT Press.
Temple, C. (1997). Developmental cognitive neuropsychology. Sussex, UK: Psychology Press.
Thomas, M. S. C. & Karmiloff-Smith, A. (2002). Are developmen-tal disorders like cases of adult brain damage? Behavioral and Brain Sciences, 25(6), 727-788.
van der Maas, H., et al. (2006). A dynamical model of general intelligence. Psychological Review, 113(4), 842-861.
(a)
(b)