Embed Size (px)
Citation preview

Decoupling species richness variation andspatial turnover in beta diversity across afragmented landscapeGuang Hu1, Maxwell C. Wilson2, Jianguo Wu2,3, Jingjing Yu4 andMingjian Yu4
1 School of Civil Engineering and Architecture, Zhejiang Sci-Tech University, Hangzhou, China2 School of Life Sciences, Arizona State University, Tempe, AZ, USA3 School of Sustainability, Arizona State University, Tempe, AZ, USA4 College of Life Sciences, Zhejiang University, Hangzhou, China
ABSTRACTBackground: How habitat fragmentation affects the relationship between localrichness and the variation in community composition across space is important toboth ecology and conservation biology, but this effect remains poorly understood.Methods: Here, we present an empirical study to address this topic in a fragmentedlandscape, the Thousand Island Lake (TIL), an artificial land-bridge island systemwith more than 1,000 islands, which provides an “experimental” fragmentedlandscape with a homogeneous matrix and similar successional history. Wemeasured species composition and plant functional type (PFT) on 29 islands, andtested the effects of island area and isolation on the relationship between a- andβ-diversity. General Linear Models were applied to test the impact of habitatfragmentation. In addition, variation partitioning was used to decouple a-diversitydependent and a-diversity independent spatial turnover in β-diversity of the plantcommunity and across different PFTs.Results: We found habitat fragmentation influences β-diversity of plants primarilyby modifying local a-diversity, not spatial turnover in the TIL system. We also foundarea-dependent environmental filtering and differential plant responses acrossfunctional types were the most likely underlying driving mechanisms.Discussion: These results highlight the importance of hierarchical linkages betweencomponents of biodiversity across scales in fragmented landscapes, and havepractical conservation implications.
Subjects Biodiversity, EcologyKeywords Area effect, Environmental filtering, Isolation, Land-bridge islands, Plant functionaltype, Thousand Island Lake
INTRODUCTIONHabitat loss is one of the most serious threats to biodiversity on a global scale (Pimm &Raven, 2000). One of the real-world consequences of habitat loss often is the breaking up oflarge, contiguous patches into smaller, more numerous, more isolated patches(Collinge, 2009). Studies of these processes, often and controversially given the singlemoniker of “habitat fragmentation,” have been fraught with definitional, conceptual,
How to cite this article Hu G, Wilson MC, Wu J, Yu J, Yu M. 2019. Decoupling species richness variation and spatial turnover in betadiversity across a fragmented landscape. PeerJ 7:e6714 DOI 10.7717/peerj.6714
Submitted 13 June 2018Accepted 5 March 2019Published 10 April 2019
Corresponding authorMingjian Yu, [email protected]
Academic editorPaolo Giordani
Additional Information andDeclarations can be found onpage 13
DOI 10.7717/peerj.6714
Copyright2019 Hu et al.
Distributed underCreative Commons CC-BY 4.0

and methodological challenges (Collinge, 2009; Fahrig, 2003), limiting our ability tomechanistically disentangle the impacts of habitat fragmentation on biologicalcommunities across scales (Didham, Kapos & Ewers, 2012). For example, recent work hasmade great strides in increasing our understanding of how increased area, isolation, andedge effects will impact the biological communities in fragments (Haddad et al., 2015)and how the spatial component of habitat fragmentation alters regional biodiversitypatterns (Fahrig, 2017). However, much of this work is focused on a single spatial scale,and we know relatively little about how communities that are on increasingly smallerpatches in increasingly isolated landscapes will differentiate themselves from one anotheras fragmentation-mediated processes interact across spatial, temporal, and organizationalscales (Wilson et al., 2016).
In considering this question, two divergent possibilities become apparent at thepatch-scale. One possibility is the habitat fragmentation mediates species-specific filtersacross gradients of patch size and isolation, resulting in deterministically derived nestedcommunities wherein community structure is richness dependent (Dennis, Hardy &Dapporto, 2012; Patterson & Atmar, 1986). This process is also called “environmentalfiltering,” which removes species less adapted to abiotic restrictions (Keddy, 1992), such asspace and nutrient reductions, enhanced edge effects, and drought in the fragmentedlandscape (Hu et al., 2011). Another possibility is that individuals will be either equallyimpacted by fragmentation’s effects, as in neutral theory (Chave, 2004; Hubble, 2001),or that species will sort themselves based on local selective pressures that are largelyindependent of fragmentation at the patch-scale (e.g., “species sorting”) (Holyoak et al.,2005), either of which will result in stochastic assemblies at the patch-scale once thespecies-area relationship is accounted for. This dichotomized view of deterministic vs.stochastic patch-level community controls, while perhaps overly simplistic (Holyoak et al.,2005), provides a useful mental model begetting testable predictions for assessing theimportance of fragmentation-mediated selective pressures in metacommunity dynamics.
However, our ability to assess either of these hypotheses has been constrained by thefact that the common metrics used to estimate community similarity across patches(e.g., Sørenson’s or Jaccard’s dissimilarity metrics) are intrinsically richness dependent(Baselga, 2010; Si, Baselga & Ding, 2015; Wu et al., 2017). While recent methodologicaladvancements have greatly eased this problem by partitioning the variation in communitystructure between sites into richness-dependent and independent components(Legendre, 2014), the relative efficacy of these methods remains controversial (Baselga &Leprieur, 2015; Legendre, 2014). By partitioning the richness-dependent and independentcomponents in beta diversity, Bishop et al. (2015) reported that the species turnoverand nestedness of montane ant communities resulted in opposite trends in the variationof community composition with increasing elevation. A meta-analysis found speciesturnover dominated beta diversity of a variety taxa in island systems in 94% of globaldatasets (Wu et al., 2017).
In our initial work in the Thousand Island Lake (TIL) region, we found island areadirectly affected species richness while isolation indirectly affected species composition(Yu et al., 2012). Furthermore, patterns of nestedness generated species-specific responses to
Hu et al. (2019), PeerJ, DOI 10.7717/peerj.6714 2/17

different island attributes (Hu et al., 2011) and higher beta diversity was found on smallerislands due to environmental heterogeneity rather than ecological drift (Liu et al., 2018b).However, these studies did not consider the respective linkages between the ecologicalmechanisms, island attributes, and richness-(in)dependent components in beta diversity.To close this gap, we empirically disentangled the relative importance of richness-independent spatial turnover and richness variation in influencing the variation incommunity composition across patches in a contemporary fragmented landscape (a land-bridge island system). We also wanted to test three hypotheses in the study: (1) therelationship between a- and β-diversity would vary across islands with different attributes; (2)differences in environmental filtering across scales would be the main mechanism shapingthe a- and β-diversity relation; (3) different responses of plant functional types (PFTs) tofragmentation would also play a key role in the relationship between a- and β-diversity.Using both richness-dependent and richness-independent measures of communitysimilarity, along with a suite of biogeographical and ecological attributes, we then exploredthe underlying mechanisms driving the variation in community composition, elucidating therelative importance of richness vs. turn-over in a real world fragmented landscape.
MATERIALS AND METHODSStudy siteThe study was conducted in a land-bridge island system in a man-made reservoir, the TILin East China. The climate is subtropical monsoon with an average annual temperature of17 �C and precipitation of 1,430 mm (Editorial committee of development of Xin’anRiver, Xin’an River Development Corporation, 2009). The inundation following the Xin’anRiver Dam construction for power generation in 1959, resulted in 1,078 fragmented islands(>0.25 ha) when the water reached its highest level (108 m a.s.l.). The areas of mostislands are less than one ha. Currently, most islands are covered with forests (∼90%)dominated by Masson pine (Pinus massoniana) in the canopy and broad-leaved plants inthe sub-canopy and understory. Forests were formed by secondary succession throughregeneration after dam construction (Wilson et al., 2016). The majority of TIL hasbeen protected by government and the vegetation has experienced few humandisturbances over the past several decades. The TIL system may be considered as an“experimental” fragmented landscape with homogeneous matrix and synchronoussuccessional history (Hu et al., 2011; Wilson et al., 2016; Yu et al., 2012).
Data collection
Field work for plant communitiesWe established long-term forest plots on 29 islands (Fig. 1) with little human disturbanceacross different gradients of area and isolation in 2009–2010 (Hu, Feeley & Yu, 2016).To assess whether the 29 studied islands are representative of the larger fragmentedlandscape, Wilson (2018) compared the distributions of island area, distance to mainland(DM) and distance to nearest neighbor island of the 29 studied islands and 510 islands inthe fragmented landscape using the Kolmogorov–Smirnov test. Results showed thereare no significant differences between the distributions of the 29 islands and all islands in
Hu et al. (2019), PeerJ, DOI 10.7717/peerj.6714 3/17

the landscape for island area (D ¼ 0.20, P ¼ 0.22). Plot establishment and data collectionfollowed the protocol for plot censuses established by the Center for Tropical ForestScience—Forest Global Earth Observatory network (Condit, 1998; Condit et al., 1999).The census of plots took one of three shapes: (1) cover the entire island (island area �1 ha);(2) 0.5 ha sampling plot (island area one to five ha) and (3) one ha plot (island area >5 ha) onthese study islands. All woody individuals with diameter at breast height (DBH) >1 cmwere measured in height and DBH , and were identified to species. Rarefaction analysesindicated that sampling protocols were sufficient to capture most woody plant species on theislands (Yu et al., 2012).
In total, 186,781 individuals of 76 woody plant species were recorded on the 29 islands.
Figure 1 The 29 study islands in the Thousand Island Lake, East China. Island and mainlandboundaries were digitalized using SPOT-6 satellite imagery in ArcMap v10.3 (http://desktop.arcgis.com/en/arcmap/). Final map production was completed in QGIS v2.8 (www.qgis.org). Maps of China andZhejiang Province are based on the Natural Earth 1:10,000,000 cultural and physical data sets, which arepart of the public domain and available at http://www.naturalearthdata.com/.
Full-size DOI: 10.7717/peerj.6714/fig-1
Hu et al. (2019), PeerJ, DOI 10.7717/peerj.6714 4/17

Plant functional typesTo test different responses of species to fragmentation, we classified the plant speciesinto PFTs, with PFTs containing the species with similar resource usage strategies anddisturbance tolerance. Different PFTs have showed different performances in thespecies-area relationship (Hu et al., 2012) and community succession (Liu et al., 2018a)in TIL. Eight plant attributes, maximal height, leaf area, special leaf area (SLA),leaf thickness, leaf dry material content, chlorophyll content, twig dry material content,and wood density, which are directly linked to plant defense strategies (Cornelissen et al.,2003; Pérez-Harguindeguy et al., 2013), were measured for each species according tothe general protocols described with Cornelissen et al. (2003) and Pérez-Harguindeguyet al. (2013). The maximal height of each species was recorded from the highestindividual in the plots. Leaf traits were measured with 10 fully expanded current-yearleaves in the sun-exposed conditions from five mature trees distributed in our studysystem. Stem traits were measured using 10 branches from five mature trees afteroven drying to constant mass at 80 �C and divided by fresh volume determined by waterdisplacement.
We classified all woody plant species recorded on 29 islands into PFTs by a clusteringanalysis based k-means partitioning (Cali�nski & Harabasz, 1974) using the eight planttraits. The effectiveness of this classification was tested using Detrended correspondenceanalysis (Appendix S1; Fig. S1). To facilitate the analysis of data and interpretationof results, we classified these species into four plant functional types (Appendix S1;Table S1). Compared with our previous studies about the responses of plant species tofragmentation, PFT1 (evergreen) and PFT2 (deciduous) are common species that are lesssensitive to habitat fragmentation, whereas PFT3 and PFT4 are rare species that are moresensitive to habitat fragmentation (Hu et al., 2012).
Island and landscape attributes
Wilson (2018) identified the landscape attributes of the study islands from high resolutionremote sensing imagery (SPOT-6). Three attributes, island area, distance to nearestisland (DNI) and DM were calculated using a combination of FRAGSTATS (v4.2) andArcGIS (v10.4). These two distances can be contributed to different isolation effects. DNIindicated the spatial assemblage of study islands with others, and DM indicated thedirect connectivity between target island and species pool. There was no significantPearson’s correlation between these two distances.
To test the area and isolation effects on diversity, we classified the study islandsaccording to three different sets of criteria: island area, distance to the nearest neighboringisland, and DM. This produced the following three pairs of classes: (1) large islands(area >1 ha) and small islands (area�1 ha); (2) isolated islands (DNI >50 m) and clumpedislands (DNI �50 m); (3) far islands (DM >2,000 m) and near islands (DM �2,000 m).According to the criteria, we compare and contrast the 29 islands in three ways:11 large islands vs. 18 small islands; 10 isolated islands vs. 19 clumped islands; and 19 farislands vs. 10 near islands. Spearman’s rank correlation analysis showed these categoriesare independent.
Hu et al. (2019), PeerJ, DOI 10.7717/peerj.6714 5/17

Data analysis
α- and β-diversitySpecies richness was used to represent a-diversity of all plants and PFTs oneach island.
To calculate the variation in community composition for each island pair (e.g., β-diversity)within these island groups, we used two indices. First, we calculated classical Jaccard’sdissimilarity index (βJ) to represent β-diversity composed of both richness variationand spatial turnover. Second, we calculated Raup-Crick metric (βRC) as described withChase et al. (2011) to represent the richness-independent component of β-diversity(e.g., species replacement). The advantages of βRC are twofold. First βRC statisticallydisentangles variation in spatial turnover between samples from variation in a-diversity.Second, βRC separates deterministic and stochastic processes on β-diversity (Segre et al.,2014) based on a null-model approach (Chase et al., 2011), while controlling forspecies loss caused by habitat fragmentation. The value of βRC ranges from -1 to 1.Values approaching -1 indicate higher similarity between two communities than expected,suggesting that either deterministic competition or environmental filters shared acrosssamples dominates the system at the scale of analysis. Values approaching 1 indicatethat the two communities have higher dissimilarity than expected, suggesting thatdeterministic environmental filters not shared across samples favor divergent speciescomposition or that there is low dispersal among fragments (dispersal limitation).Values close to 0 indicate that assemblies are highly stochastic and that dispersal isfrequent across fragments.
The null model applied in βRC computation was determined for each island byrandomly sampling species from species pool (all species recorded in our field) undertwo constraints: (1) the simulated species richness of each island was fixed and equaledthe observed richness; and (2) the probability of each species to be sampled wasproportional to its observed abundance (the r1 model described in Wright et al. (1997)).We repeated this simulation 1,000 times to calculate βRC.
Statistical analysisWe fitted generalized linear models (GLM) with a Gaussian link function to predict theβ-diversity of all plants and four PFTs based on the three island attributes. A backwardstepwise regression was then used to identify the best-fit models with variableselection and model evaluation were both based on Akaike information criterion values.The contribution of each island attribute to predicting species diversity was determinedby calculating the proportion of the deviance explained, similar to R2. We then usedvariation partitioning base on redundancy analysis ordination (Borcard, Legendre &Drapeau, 1992) to estimate the independent contributions of species richness variationand βRC (spatial turnover) to the variation in βJ for the whole system, the islands groups,and each PFT.
This analysis was applied to the whole plant community and each PFT. All statisticalanalyses were conducted with R 3.3.2 (R Develpment Core Team, 2015).
Hu et al. (2019), PeerJ, DOI 10.7717/peerj.6714 6/17
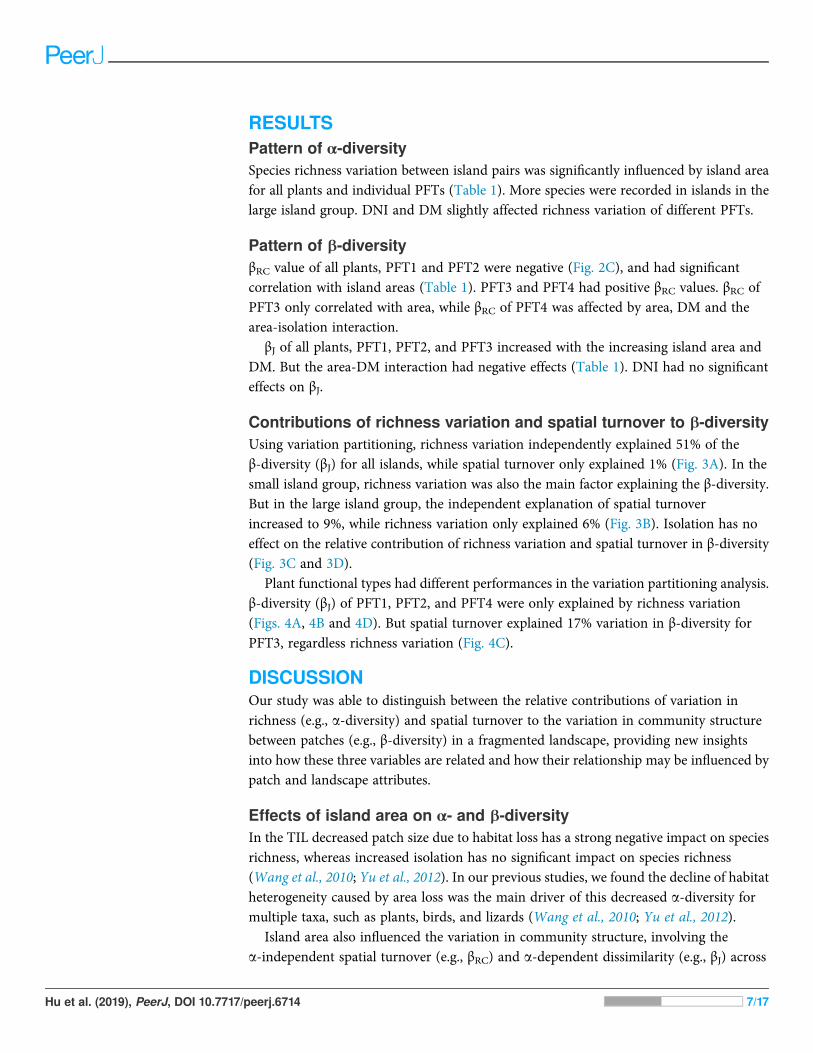
RESULTSPattern of α-diversitySpecies richness variation between island pairs was significantly influenced by island areafor all plants and individual PFTs (Table 1). More species were recorded in islands in thelarge island group. DNI and DM slightly affected richness variation of different PFTs.
Pattern of b-diversityβRC value of all plants, PFT1 and PFT2 were negative (Fig. 2C), and had significantcorrelation with island areas (Table 1). PFT3 and PFT4 had positive βRC values. βRC ofPFT3 only correlated with area, while βRC of PFT4 was affected by area, DM and thearea-isolation interaction.
βJ of all plants, PFT1, PFT2, and PFT3 increased with the increasing island area andDM. But the area-DM interaction had negative effects (Table 1). DNI had no significanteffects on βJ.
Contributions of richness variation and spatial turnover to b-diversityUsing variation partitioning, richness variation independently explained 51% of theβ-diversity (βJ) for all islands, while spatial turnover only explained 1% (Fig. 3A). In thesmall island group, richness variation was also the main factor explaining the β-diversity.But in the large island group, the independent explanation of spatial turnoverincreased to 9%, while richness variation only explained 6% (Fig. 3B). Isolation has noeffect on the relative contribution of richness variation and spatial turnover in β-diversity(Fig. 3C and 3D).
Plant functional types had different performances in the variation partitioning analysis.β-diversity (βJ) of PFT1, PFT2, and PFT4 were only explained by richness variation(Figs. 4A, 4B and 4D). But spatial turnover explained 17% variation in β-diversity forPFT3, regardless richness variation (Fig. 4C).
DISCUSSIONOur study was able to distinguish between the relative contributions of variation inrichness (e.g., a-diversity) and spatial turnover to the variation in community structurebetween patches (e.g., β-diversity) in a fragmented landscape, providing new insightsinto how these three variables are related and how their relationship may be influenced bypatch and landscape attributes.
Effects of island area on α- and b-diversityIn the TIL decreased patch size due to habitat loss has a strong negative impact on speciesrichness, whereas increased isolation has no significant impact on species richness(Wang et al., 2010; Yu et al., 2012). In our previous studies, we found the decline of habitatheterogeneity caused by area loss was the main driver of this decreased a-diversity formultiple taxa, such as plants, birds, and lizards (Wang et al., 2010; Yu et al., 2012).
Island area also influenced the variation in community structure, involving thea-independent spatial turnover (e.g., βRC) and a-dependent dissimilarity (e.g., βJ) across
Hu et al. (2019), PeerJ, DOI 10.7717/peerj.6714 7/17

Table 1 Results from generalized linear models (GLMs) and stepwise regression of island attributesfor predicting the plant diversity in the Thousand Island Lake.
Species diversity Island attributes† Estimate SE P-value Deviationexplained (%)
Richness variation
All plants Area 7.62 � 10-2 6.83 � 10-3 <0.001 42.15
PFT1 Area 6.42 � 10-2 1.22 � 10-2 <0.001 14.28
Area � DM -1.70 � 10-5 8.33 � 10-6 0.043 0.54
PFT2 Area 7.74 � 10-2 7.28 � 10-3 <0.001 40.00
PFT3 Area 8.42 � 10-2 4.69 � 10-3 <0.001 47.58
DM -4.02 � 10-5 1.25 � 10-5 0.001 1.60
PFT4 Area 3.23 � 10-2 1.45 � 10-2 0.027 13.65
Area � DNI 1.24 � 10-3 3.80 � 10-4 0.001 0.33
Area � DNI � DM -5.39 � 10-7 2.06 � 10-7 0.009 1.62
Spatial turnover (βRC)
All plants Area 1.73 � 10-2 5.60 � 10-3 0.002 2.83
DM 3.85 � 10-5 1.45 � 10-5 0.008 1.66
PFT1 Area 4.63 � 10-2 1.44 � 10-2 0.001 4.68
PFT2 Area 4.41 � 10-2 6.05 � 10-3 <0.001 10.75
DM 4.72 � 10-5 1.57 � 10-5 0.003 1.97
PFT3 Area 2.08 � 10-2 5.22 � 10-5 <0.001 3.85
PFT4 Area 6.30 � 10-2 1.32 � 10-2 <0.001 15.12
DM 1.16 � 10-4 3.33 � 10-5 0.001 0.035
Area � DNI 5.42 � 10-4 2.26 � 10-4 0.017 0.45
Area � DM -1.87 � 10-5 8.46 � 10-6 0.033 0.63
DNI � DM -1.94 � 10-6 5.22 � 10-7 <0.001 3.24
β-diversity (βJ)
All plants Area 7.53 � 10-2 9.98 � 10-3 <0.001 16.09
DM 7.22 � 10-5 2.04 � 10-5 <0.001 0.67
Area � DM -2.19 � 10-5 6.86 � 10-6 0.002 2.05
PFT1 Area 6.74 � 10-2 1.08 � 10-2 <0.001 10.54
DM 8.07 � 10-5 2.21 � 10-5 <0.001 1.06
Area � DM -2.17 � 10-5 7.44 � 10-6 0.004 1.82
PFT2 Area 6.76 � 10-2 1.08 � 10-2 <0.001 15.91
DM 5.13 � 10-5 2.18 � 10-5 0.019 0.08
Area � DM -2.02 � 10-5 7.40 � 10-6 0.006 1.54
PFT3 Area 2.26 � 10-2 5.37 � 10-3 <0.001 5.69
DM 3.78 � 10-5 1.43 � 10-5 0.009 1.98
PFT4 Area 2.31 � 10-2 6.46 � 10-3 <0.001 3.35
Notes:Only attributes retained in the best-fit models are shown. Area was log-transformed. Variable selection and modelestimation were based on the Akaike information criterion (AIC).† DNI, Distance to nearest neighbor island.DM, Distance to Mainland.
Hu et al. (2019), PeerJ, DOI 10.7717/peerj.6714 8/17

0.0
0.2
0.4
0.6
0.8
-0.5
0.0
0.5
Plant Functional Types
PFT1 PFT2 PFT3 PFT4 Total
PFT1 PFT2 PFT3 PFT4 Total
Spat
ial
Turn
over
(R
C)
β-D
iver
sity
(β
J)
Ric
hnes
s var
iati
on
0.0
0.1
0.2
0.3
mean
PFT1 PFT2 PFT3 PFT4 Total
Figure 2 Patterns of (A) a-diversity, (B) β-diversity and (C) spatial turnover in all plant and fourPFTs. Bars represented 95% confidence levels. Full-size DOI: 10.7717/peerj.6714/fig-2
Hu et al. (2019), PeerJ, DOI 10.7717/peerj.6714 9/17

islands. Variation partitioning showed that the variation in species richness explainednearly 50% of the variation in β-diversity (Fig 3A). The variance explained by each factorin GLM analysis also supports this finding, with island area explaining more of thedeviation in GLMs predicting β-diversity than other parameters (Table 1). Communitieson the island pairs with greater area variation were more dissimilar, suggesting an areaeffect working on β-diversity across islands. This relationship was also found in smallmammals in Atlantic fragmented forests, which was explained by the higher vulnerabilityof these species and increasing environmental heterogeneity across small fragments(Pardini et al., 2005). We speculate area effect on plant β-diversity was caused by habitatdivergence and following environmental filtering (Myers et al., 2015) on the differentislands. This speculation is informed from our previous studies, which showedenvironmental filtering was the main driver of community assembly in seedling-saplingtransition (Hu, Feeley & Yu, 2016).
However, we also found evidence that environmental filtering drove the speciesassembly at different scales. The large island group had relatively high a-diversity and highvariation explained by spatial turnover. We also found that GLM coefficients associatedwith area were positive when predicting βRC (e.g., as the difference is area between
Richness varia�on
51%
Spa�al turnover
1%
Residuals=45%
3%
All islandsRichness varia�on
6%
Spa�al turnover
9%
Residuals=39%
47%
Large islands
Richness varia�on
40%
Spa�al turnover
0%
Residuals=58%
2%
Small islands
Richness varia�on
46%
Spa�al turnover
0%
Residuals=54%
0%
Isolated islands
Richness varia�on
45%
Spa�al turnover
1%
Residuals=51%
3%
Clumped islands
Richness varia�on
46%
Spa�al turnover
4%
Residuals=51%
0%
Far islands
Richness varia�on
68%
Spa�al turnover
3%
Residuals=32%
-3%
Near islands
a b
c d
Figure 3 Relative contribution of richness variation and spatial turnover in β-diversity of four islandcategories ((A) all islands; (B) large vs. small; (C) isolated vs. clumped; (D) far vs. near) based onvariation partitioning. The independent and combined explanatory powers are shown in parentheses.
Full-size DOI: 10.7717/peerj.6714/fig-3
Hu et al. (2019), PeerJ, DOI 10.7717/peerj.6714 10/17

island pairs becomes larger the island communities become more dissimilar independentof richness variation). Together this suggests that higher habitat heterogeneity within largeislands could be driving community assembly on these islands. In contrast, habitatdiversity is lower within, but higher across the small islands (Liu et al., 2018b).As mentioned above, our GLMs showed that the difference is island area is positivelyrelated to community dissimilarity at the island scale once richness variation waseliminated. Combined with relatively low a-diversity and low variation explained byspatial turnover this suggests that environmental filters shared across small islands play animportant role in driving community structure. Our previous studies have also foundsteeper species-area relationship in the more fragmented landscapes with smaller islands(Hu et al., 2012), which illustrated the severe richness variation occurred in small islandgroups, and drove the β-diversity pattern.
Effects of island isolation on α- and b-diversityIsolation has no or slight effects on species richness in this system, as demonstrated byseveral studies in TIL (Hu et al., 2011; Hu, Feeley & Yu, 2016; Yu et al., 2012). However,isolation, especially the DM, significantly affected the β-diversity including βJ and βRC,albeit with relatively low amounts of deviance explained. That species similarity and
Richness varia�on
45%
Spa�al turnover
0%
Residuals=46%
9%
PFT1a b
c d
Richness varia�on
36%
Spa�al turnover
-1%
Residuals=62%
3%
PFT2
Richness varia�on
0%
Spa�al turnover
17%
Residuals=77%
6%
PFT3
Richness varia�on
11%
Spa�al turnover
0%
Residuals=86%
3%
PFT4
Figure 4 Relative contribution of richness variation and spatial turnover in β-diversity of (A) PFT1,(B) PFT2, (C) PFT3 and (D) PFT4 based on variation partitioning. The independent and combinedexplanatory powers are shown in parentheses. Full-size DOI: 10.7717/peerj.6714/fig-4
Hu et al. (2019), PeerJ, DOI 10.7717/peerj.6714 11/17

spatial turnover were both affected by DM illustrates that most species on islandswere strongly linked with the species pool on the surrounding mainland. Selectiveimmigration of pollinators or seed dispersers could be one explanation for thisβ-diversity pattern (Wang, Chen & Ding, 2011). However, different from oceanic islands,islands far from the mainland in TIL are located in the center of the lake. It caused thedifference of habitat quality between near islands (close to lakeshore) and far islands(distant to lakeshore). The worse habitat quality on near islands was influenced bythe disturbance from surrounding lakeshore. Higher density of beetles founded in thefar islands (Zhou et al., 2017) also support this explanation. In TIL region, we speculatedthat habitat quality is more important than immigration, which caused DMpositively affect the β-diversity.
Responses of PFTsThere was little difference in richness variation and β-diversity between PFTs. The onlysignificant differences in the richness-independent spatial turnover were between commonspecies (PFT1, 2) and rare species (PFT3, 4), illustrating different community assemblyprocesses for each PFT. Lower spatial turnover of common species and high spatialturnover of rare species (Fig. 2C) suggests that deterministic competition exclusion orshared environmental filters across fragments drove the assembly process (Chase et al.,2011) of common species, while specific habitat demands or low dispersal amongfragments (dispersal limitation) drove the assembly of rare species.
Generalized linear models analysis illustrated that PFT4 was impacted by the largestnumber of fragmentation altered parameters. This suggests that plants with high SLAleaves and low tolerance to disturbance could suffer severe impacts from habitatfragmentation. Positive βRC values of PFT3, suggests that the specific habitat requirementsregulated the occurrence of these species. PFT3 also showed a unique relationship betweena-diversity and β-diversity relative to other PFTs, with spatial turnover of PFT3primarily driving β-diversity (Fig. 4C). Specific habitat requirements and dispersallimitation might enhance the spatial turnover of PFT3 among islands. That greater habitatdissimilarity was found to cause higher β-diversity among smaller islands in TIL (Liu et al.,2018b) also supports this point. Similar to the performance of the whole communities,negative βRC values of suggests that spatial turnover of PFT1 and PFT2 was determinedby the shared environmental filtering (Chase et al., 2011) across islands. Thus PFTsdiffer significantly in which drivers of β-diversity control their response to habitatfragmentation in this landscape.
Our finding that β-diversity for plant communities in the TIL system is a-dependentcould be viewed as support for previous work that has shown communities in theTIL to be nested (Hu et al., 2011;Wang et al., 2010). However, similar decompositions ofβ-diversity in the TIL system for bird, lizard, and spider communities have shownthat species-turnover is the dominant component of β-diversity for these taxa(Si, Baselga & Ding, 2015; Wu et al., 2017). Future work should aim to understand whythe variation in community structure varies so widely across taxonomic groups inthis system.
Hu et al. (2019), PeerJ, DOI 10.7717/peerj.6714 12/17
CONCLUSIONSThe effects of habitat fragmentation on biodiversity represent one of the most importanttopics in landscape ecology and conservation biology. However, little is known abouthow a- and β-diversity are related in fragmented landscapes and how patch attributes mayalter this relationship. To fill this gap, our study offers the following important findings:
1. Variation in a-diversity influences β-diversity more strongly than spatial turnover inplant communities across this fragmented landscape. Island area primarily influencesβ-diversity by modifying local a-diversity, not spatial turnover.
2. Environmental filtering drives species assembly at different scales along an areagradient. Higher spatial turnover within large islands is due to higher habitatheterogeneity. In contrast, in the small island groups, habitat heterogeneity is ratherlimited and environmental filtering decreases spatial turnover, thus richness variationbecoming the main driver of β-diversity.
3. Common species suffering less environmental filtering are widely dispersed, anddecrease the contribution of spatial turnover in β-diversity. However, rare species aremore sensitive to environmental filtering, and consequently lead to the highercontribution of spatial turnover in β-diversity.
Our study highlights the importance of the relationship between a- and β-diversityin fragmented landscapes. Our results have broad implications for biological conservation,emphasizing the complex, scale-dependent nature of the relationship between local andregional diversity, and require us to rethink how habitat fragmentation alters biodiversityacross scales. Our results suggest that traditional a-dependent dissimilarity indices mayoverestimate the diversity across sites in some cases because relatively little spatial turnover(βRC) means that most species on small islands are the same. In other words, speciesdissimilarity (βJ) is mostly attributed to species richness variation. Thus, conserving mostlarge fragments and some small fragments with highest local richness should be the mainaim of natural conservationist and local government in the TIL region. Special attentionshould be paid to protecting both special species composition and habitat heterogeneity onlarger islands. Future studies are needed to test the generality of these findings in fragmentedlandscapes and for different taxa across multiple scales and organizational levels.
ACKNOWLEDGEMENTSThe authors thank Prof. Chaozong Zheng for help with species identification. We alsothank Mr. Gaofu Xu, Chun’an Forestry Bureau and Xin’an River DevelopmentCorporation of Chun’an County for support of fieldworks.
ADDITIONAL INFORMATION AND DECLARATIONS
FundingThis work was supported by the National Natural Science Foundation of China(31570524, 31870401, 31611130181, 31210103908 and 31361123001), the National
Hu et al. (2019), PeerJ, DOI 10.7717/peerj.6714 13/17

Science Foundation (DEB-1342751, DEB-1342757), the Natural Science Foundation ofZhejiang Province (LY15C030005), First Class of Disciplines-B of Zhejiang Province(Civil Engineering) and the 521 Talent Project of Zhejiang Sci-Tech University.The funders had no role in study design, data collection and analysis, decision to publish,or preparation of the manuscript.
Grant DisclosuresThe following grant information was disclosed by the authors:National Natural Science Foundation of China: 31570524, 31870401, 31611130181,31210103908 and 31361123001.National Science Foundation: DEB-1342751, DEB-1342757.Natural Science Foundation of Zhejiang Province: LY15C030005.First Class of Disciplines-B of Zhejiang Province (Civil Engineering) and the 521 TalentProject of Zhejiang Sci-Tech University.
Competing InterestsJianguo Wu is an Academic Editor for PeerJ.
Author Contributions� Guang Hu conceived and designed the experiments, performed the experiments,analyzed the data, contributed reagents/materials/analysis tools, preparedfigures and/or tables, authored or reviewed drafts of the paper, approved thefinal draft.
� Maxwell C. Wilson analyzed the data, contributed reagents/materials/analysis tools,prepared figures and/or tables, authored or reviewed drafts of the paper.
� Jianguo Wu analyzed the data, contributed reagents/materials/analysis tools, authoredor reviewed drafts of the paper, approved the final draft.
� Jingjing Yu performed the experiments, contributed reagents/materials/analysistools.
� Mingjian Yu conceived and designed the experiments, performed the experiments,contributed reagents/materials/analysis tools, authored or reviewed drafts of the paper,approved the final draft.
Field Study PermissionsThe following information was supplied relating to field study approvals (i.e., approvingbody and any reference numbers):
Field experiments were approved by the local manager, the Xin’an River DevelopmentCorporation.
Data AvailabilityThe following information was supplied regarding data availability:
The data of plant communities used in this study was drawn from: Hu G, Feeley KJ,Yu M. 2016. Habitat fragmentation drives plant community assembly processes acrosslife stages. PLOS ONE 11(7): e0159572. DOI 10.1371/journal.pone.0159572
Hu et al. (2019), PeerJ, DOI 10.7717/peerj.6714 14/17

Supplemental InformationSupplemental information for this article can be found online at http://dx.doi.org/10.7717/peerj.6714#supplemental-information.
REFERENCESBaselga A. 2010. Partitioning the turnover and nestedness components of beta diversity.
Global Ecology and Biogeography 19(1):134–143 DOI 10.1111/j.1466-8238.2009.00490.x.
Baselga A, Leprieur F. 2015. Comparing methods to separate components of beta diversity.Methods in Ecology and Evolution 6(9):1069–1079 DOI 10.1111/2041-210X.12388.
Bishop TR, Robertson MP, Van Rensburg BJ, Parr CL. 2015. Contrasting species and functionalbeta diversity in montane ant assemblages. Journal of Biogeography 42(9):1776–1786DOI 10.1111/jbi.12537.
Borcard D, Legendre P, Drapeau P. 1992. Partialling out the spatial component of ecologicalvariation. Ecology 73(3):1045–1055 DOI 10.2307/1940179.
Cali�nski T, Harabasz J. 1974. A dendrite method for cluster analysis. Communications in Statistics3(1):1–27 DOI 10.1080/03610927408827101.
Chase JM, Kraft NJB, Smith KG, Vellend M, Inouye BD. 2011. Using null models to disentanglevariation in community dissimilarity from variation in a-diversity. Ecosphere 2(2):1–11DOI 10.1890/ES10-00117.1.
Chave J. 2004. Neutral theory and community ecology. Ecology Letters 7(3):241–253DOI 10.1111/j.1461-0248.2003.00566.x.
Collinge S. 2009. Ecology of fragmented landscapes. Baltimore: John’s Hopkins University Press.
Condit R. 1998. A field guide to large forest censuses in the tropics: the Barro Colorado Island Projectand a network of tropical forest plots. Austin: Landes.
Condit R, Ashton PS, Manokaran N, LaFrankie JV, Hubbell SP, Foster RB. 1999.Dynamics of the forest communities at Pasoh and Barro Colorado: comparing two 50–ha plots.Philosophical Transactions of the Royal Society of London. Series B: Biological Sciences354(1391):1739–1748 DOI 10.1098/rstb.1999.0517.
Cornelissen JHC, Lavorel S, Garnier E, Díaz S, Buchmann N, Gurvich DE, Reich PB, ter Steege H,Morgan HD, Van Der Heijden MGA, Pausas JG, Poorter H. 2003. A handbook ofprotocols for standardised and easy measurement of plant functional traits worldwide.Australian Journal of Botany 51(4):335–380 DOI 10.1071/BT02124.
Dennis RLH, Hardy PB, Dapporto L. 2012. Nestedness in island faunas: novel insightsinto island biogeography through butterfly community profiles of colonization abilityand migration capacity. Journal of Biogeography 39(8):1412–1426DOI 10.1111/j.1365-2699.2012.02698.x.
Didham RK, Kapos V, Ewers RM. 2012. Rethinking the conceptual foundation of habitatfragmentation research. Oikos 121(2):161–170 DOI 10.1111/j.1600-0706.2011.20273.x.
Editorial committee of development of Xin’an River, Xin’an River Development Corporation.2009. Development of Xin’an River. Hangzhou: Zhejiang People’s Publishing House.
Fahrig L. 2003. Effects of habitat fragmentation on biodiversity. Annual Review of Ecology,Evolution, and Systematics 34(1):487–515 DOI 10.1146/annurev.ecolsys.34.011802.132419.
Fahrig L. 2017. Ecological responses to habitat fragmentation per se. Annual Reviews in Ecology,Evolution, and Systematics 48(1):1–23 DOI 10.1146/annurev-ecolsys-110316-022612.
Haddad NM, Brudvig LA, Clobert J, Davies KF, Gonzalez A, Holt RD, Lovejoy TE, Sexton JO,Austin MP, Collins CD, Cook WM, Damschen EI, Ewers RM, Foster BL, Jenkins CN,
Hu et al. (2019), PeerJ, DOI 10.7717/peerj.6714 15/17
King AJ, Laurance WF, Levey DJ, Margules CR, Melbourne BA, Nicholls AO, Orrock JL,Song D-X, Townshend JR. 2015. Habitat fragmentation and its lasting impact on Earth’secosystems. Science Advances 1(2):e1500052 DOI 10.1126/sciadv.1500052.
Holyoak M, Leibold M, Mouquet N, Holt R, Hoopes M. 2005. Metacommunities: a frameworkfor large-scale community ecology. In: Holyoak M, Leibold M, Hold R, eds. Metacommunities:Spatial Dynamics and Ecological Communities. Chicago: University of Chicago Press, 1–31.
Hu G, Feeley KJ, Wu J, Xu G, Yu M. 2011. Determinants of plant species richness and patterns ofnestedness in fragmented landscapes: evidence from land-bridge islands. Landscape Ecology26(10):1405–1417 DOI 10.1007/s10980-011-9662-7.
Hu G, Feeley KJ, Yu M. 2016. Habitat fragmentation drives plant community assembly processesacross life stages. PLOS ONE 11(7):e0159572 DOI 10.1371/journal.pone.0159572.
Hu G, Wu JG, Feeley KJ, Xu GF, Yu MJ. 2012. The effects of landscape variables on thespecies-area relationship during late-stage habitat fragmentation. PLOS ONE 7(8):e43894DOI 10.1371/journal.pone.0043894.
Hubble S. 2001. The unified neutral theory of biodiversity and biogeography. Princeton: PrincetonUniversity Press.
Keddy PA. 1992. Assembly and response rules: two goals for predictive community ecology.Journal of Vegetation Science 3(2):157–164 DOI 10.2307/3235676.
Legendre P. 2014. Interpreting the replacement and richness difference components of betadiversity. Global Ecology and Biogeography 23(11):1324–1334 DOI 10.1111/geb.12207.
Liu J, Coomes DA, Hu G, Liu J, Yu J, Luo Y, Yu M, Bellingham P. 2018a. Larger fragmentshave more late-successional species of woody plants than smaller fragments after 50 years ofsecondary succession. Journal of Ecology 107(2):582–594 DOI 10.1111/1365-2745.13071.
Liu J, Vellend M, Wang Z, Yu M. 2018b. High beta diversity among small islands is due toenvironmental heterogeneity rather than ecological drift. Journal of Biogeography45(10):2252–2261 DOI 10.1111/jbi.13404.
Myers JA, Chase JM, Crandall RM, Jimenez I. 2015. Disturbance alters beta-diversity but not therelative importance of community assembly mechanisms. Journal of Ecology 103(5):1291–1299DOI 10.1111/1365-2745.12436.
Pardini R, De Souza SM, Braga-Neto R, Metzger JP. 2005. The role of forest structure,fragment size and corridors in maintaining small mammal abundance and diversity inan Atlantic forest landscape. Biological Conservation 124(2):253–266DOI 10.1016/j.biocon.2005.01.033.
Patterson B, Atmar W. 1986. Nested subsets and the structure of insular mammalianfaunas and archipelagos. Biological Journal of the Linnean Society 28(1–2):65–82DOI 10.1111/j.1095-8312.1986.tb01749.x.
Pérez-Harguindeguy N, Díaz S, Garnier E, Lavorel S, Poorter H, Jaureguiberry P, Bret-Harte MS,Cornwell WK, Craine JM, Gurvich DE, Urcelay C, Veneklaas EJ, Reich PB, Poorter L,Wright IJ, Ray P, Enrico L, Pausas JG, De Vos AC, Buchmann N, Funes G, Quétier F,Hodgson JG, Thompson K, Morgan HD, ter Steege H, Van Der Heijden MGA, Sack L,Blonder B, Poschlod P, Vaieretti MV, Conti G, Staver AC, Aquino S, Cornelissen JHC. 2013.New handbook for standardised measurement of plant functional traits worldwide.Australian Journal of Botany 61(3):167–234 DOI 10.1071/BT12225.
Pimm S, Raven P. 2000. Biodiversity: extinction by numbers. Nature 403(6772):843–845DOI 10.1038/35002708.
R Develpment Core Team. 2015. R: a language and environment for statistical computing.Vienna: The R Foundation for Statistical Computing. Available at http://www.R-project.org/.
Hu et al. (2019), PeerJ, DOI 10.7717/peerj.6714 16/17

Segre H, Ron R, De Malach N, Henkin Z, Mandel M, Kadmon R. 2014. Competitive exclusion,beta diversity, and deterministic vs. stochastic drivers of community assembly. Ecology Letters17(11):1400–1408 DOI 10.1111/ele.12343.
Si X, Baselga A, Ding P. 2015. Revealing beta-diversity patterns of breeding bird and lizardcommunities on inundated land-bridge Islands by separating the turnover and nestednesscomponents. PLOS ONE 10(5):e0127692 DOI 10.1371/journal.pone.0127692.
Wang Y, Bao Y, Yu M, Xu G, Ding P. 2010. BIODIVERSITY RESEARCH: Nestedness fordifferent reasons: the distributions of birds, lizards and small mammals on islands of aninundated lake. Diversity and Distributions 16(5):862–873DOI 10.1111/j.1472-4642.2010.00682.x.
Wang Y, Chen S, Ding P. 2011. Testing multiple assembly rule models in avian communitieson islands of an inundated lake, Zhejiang Province, China. Journal of Biogeography38(7):1330–1344 DOI 10.1111/j.1365-2699.2011.02502.x.
Wilson M. 2018. Assessing the impacts of habitat fragmentation on biodiversity across scales:the case of Thousand Island Lake China. PhD. Arizona State University.
Wilson MC, Chen X-Y, Corlett RT, Didham RK, Ding P, Holt RD, Holyoak M, Hu G,Hughes AC, Jiang L, Laurance WF, Liu J, Pimm SL, Robinson SK, Russo SE, Si X,Wilcove DS, Wu J, Yu M. 2016. Habitat fragmentation and biodiversity conservation:key findings and future challenges. Landscape Ecology 31(2):219–227DOI 10.1007/s10980-015-0312-3.
Wright DH, Patterson BD, Mikkelson GM, Cutler A, Atmar W. 1997. A comparativeanalysis of nested subset patterns of species composition. Oecologia 113(1):1–20DOI 10.1007/s004420050348.
Wu L, Si X, Didham RK, Ge D, Ding P. 2017. Dispersal modality determines the relativepartitioning of beta diversity in spider assemblages on subtropical land-bridge islands.Journal of Biogeography 44(9):2121–2131 DOI 10.1111/jbi.13007.
Yu M, Hu G, Feeley KJ, Wu J, Ding P. 2012. Richness and composition of plants and birds onland-bridge islands: effects of island attributes and differential responses of species groups.Journal of Biogeography 39(6):1124–1133 DOI 10.1111/j.1365-2699.2011.02676.x.
Zhou W-j, Luo Y-y, Zhong L, Pan L. 2017. Effects of habitat fragmentation on species diversityof ground dwelling beetles in the Thousand Island Lake region, Zhejiang, China. Chinese Journalof Applied Ecology 28(2):509–518 DOI 10.13287/j.1001-9332.201702.037.
Hu et al. (2019), PeerJ, DOI 10.7717/peerj.6714 17/17