Embed Size (px)
Citation preview
Engineering Applications in Permafrost Areas 507
Special thermal design to prevent thaw settlement and liquefaction C.E. HEUER
Exxon Production Research Company, P.O. Box 2189, Houston, Texas 77001, USA
T.G. KRZEWINSKI Dames & Moore Consulranrs, Suite 101,800 Cordova, Anchorage, Alaska 99501, USA
AND
M.C. METZ Atlantic Richfield Co., 14379 West Ellsworth Ave., Golden, Colorado 80401, USA
During construction of the Trans-Alaska Pipeline System (TAPS), a special thermal design was developed to mitigate thaw settlement and liquefaction concerns along two short, buried segments of the pipeline. The design was implemented as a remedial measure after the pipeline was already in the ground. It included thick pipe insulation, a layer of ground surface insulation, an array of free- standing heat pipes, and groundwater drains. Based on measured soil temperatures, the design has per- formed well, except that in one of the segments, the thaw upslope of the pipeline is deeper than expect- ed. The thaw poses no significant risk for the pipeline. The design is a good example of the care taken on TAPS to avoid geotechnical problems, and similar designs may find applications on future projects.
The paper first describes the geotechnical conditions in the special design areas and how the poten- tials for thaw settlement and liquefaction were determined. Then the design alternatives considered are very briefly discussed, and the thermal design selected is presented in detail. Finally, soil tempe- rature data are analyzed to evaluate design performance.
Pendant la construction du pipeline trans-Alaska (TAPS), un systkme thermique special fut mis au point pour allkger les effets du tassement par dkgel et de la liquefaction le long de deux troncons enfouis du pipeline. Ce systkme fut applique comme remkde aprks I’installation du pipeline dans le sol. I1 comprenait un isolant epais pour le pipeline et des egouts pour les e a w souterraines. Sur la base des mesures des temperatures du sol, le systkme a bien fonctionnk, sauf que dans l’un des tronqons, le dtgel en amont du pipeline est plus profond que prevu. Ce dkgel ne presente aucun risque important pour le pipeline. Le systkme est un bon exemple des soins pris lors de la construction du pipeline pour Cviter les problkmes d’ordre gkotechnique, et des conceptions semblables pourraient trouver applica- tion dans de futurs projets.
La communication decrit d’abord Ies conditions geotechniques dans les regions ou le systkme a tte employe, et les mkthodes utilisies pour determiner les potentiels de tassement par degel et de liquefac- tion. Ensuite, les solutions de rechange envisagees font l’objet d’une courte discussion, et le systkme thermique choisi est prbentt en detail. Enfin, des donnkes relatives a la temperature du sol sont analy- sees pour Cvaluer le rendement du systkme. Proc. 4th Can, Permafrost Conf. (1982)
[Ed. note: Data have not been converted to SI units.]
Introduction Normally, in the below-ground portion of TAPS,
the pipeline was buried with no insulation or other measures to prevent thaw, and, during construction, the pipeline ditch was logged by a field engineering staff. The logging was done to help ensure burial in competent soil by verifying that the soil conditions were no worse than those assumed during design. The latter were based on an extensive drilling program. Where unexpected soil conditions were encountered, the pipeline design was changed according to estab- lished procedures (Luscher and Thomas 1979).
After construction was completed but before start- up, all ditch logs were reviewed to validate the as-built condition. As part of this process, a length of pipeline about 3000 feet long was identified as potentially
being buried in ice-rich permafrost and therefore not meeting design criteria. Additional drilling was con- ducted, and it was confirmed that, within this length, two short segments, each ,100 feet, required remedial action to prevent thaw settlement below the pipeline and liquefaction upslope of the pipeline. Several dif- ferent alternatives were considered to do this, and the special thermal design discussed below was selected. The chronology of the work is given in Table 1.
Site Description The two special design areas are located at the
southern end of the Copper River basin at about pipeline milepost 723. This is about 290 miles south of Fairbanks along the Richardson Highway and
508 4TH CAN. PERMAFROSTCONF. (1982)
TABLE 1. Chronology for special thermal design
Event Date
Pipeline constructed As-built review performed Additional drilling conducted
Special thermal design completed
Thermal design constructed Pipeline start-up Soil temperature monitoring
begun
April and May, 1975 July to October, 1976 November and
December, 1976
March, 1977 April to May, 1977 June, 1977
July, 1977
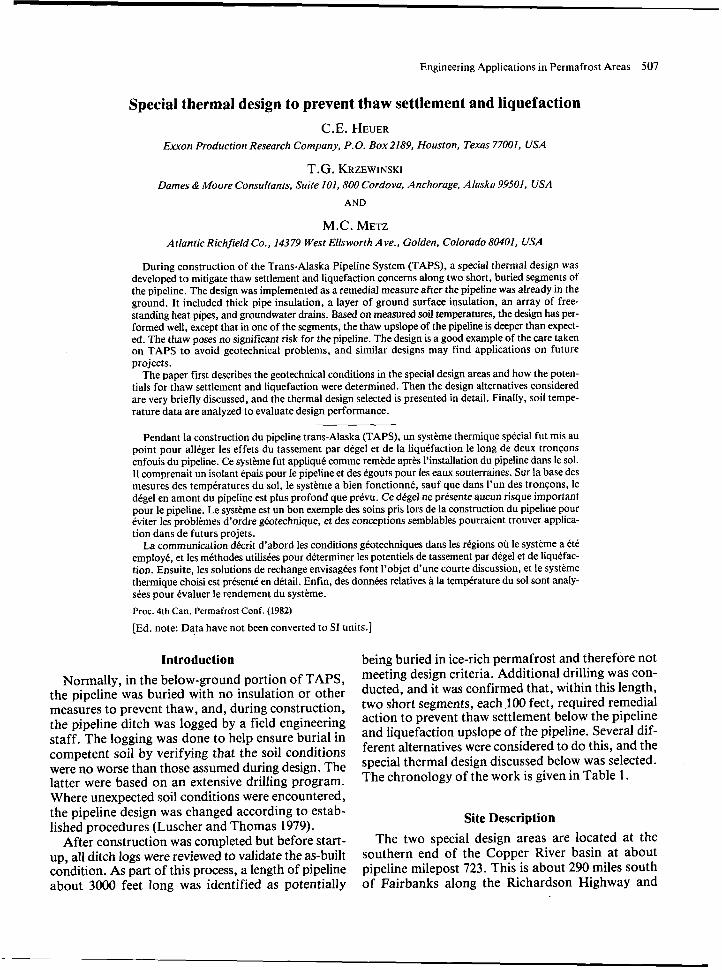
about four miles south. of the Tonsina Lodge (Figure 1).
The pipeline is on a bluff to the west of the Tonsina River. Close to the pipeline, the topography is rela- tively flat, with longitudinal slopes less than five per cent and cross slopes less than ten per cent. The direc- tion of the longitudinal slope varies, but the cross slope dips generally to the east and increases sharply as the edge of the bluff is approached.
Before construction, the area was forested but the
\ . .
vegetation was cleared during construction. Burned stumps indicated a previous fire. The area is covered by an organic layer usually about one foot thick, but in isolated areas, it is several feet thick.
The soil is predominantly a silty sand with some silt and occasional silty gravel. Generally, the dry density ranges from 100 to 130 Ib/ft3, the percentage volume saturation ranges from 70 to 100 per cent, and the percentage by weight passing the no. 200 sieve ranges from 20 to 70 per cent. Permafrost is sporadic, perhaps due to the fire. Where present, the frozen soil is well bonded, but usually there is little visible ice. The visible ice occurs as coatings, lenses, crystals, and random bodies but, except for a few isolated layers, is never more than ten per cent by volume.
While drilling in November and December, the groundwater table was generally observed at depths between two and ten feet. Surface water flow is to the east, and there is a depression containing seasonal flow traversing the middle of the northern special design area. At the beginning of special design con- struction, aufeis about two feet thick was observed at the northern end of the southern design area. During
J
FIGURE 1. Location of special thermal designs on map of Alaska.
Engineering Applications in Permafrost Areas 509
construction, dewatering of the ditches was required but was not a severe problem.
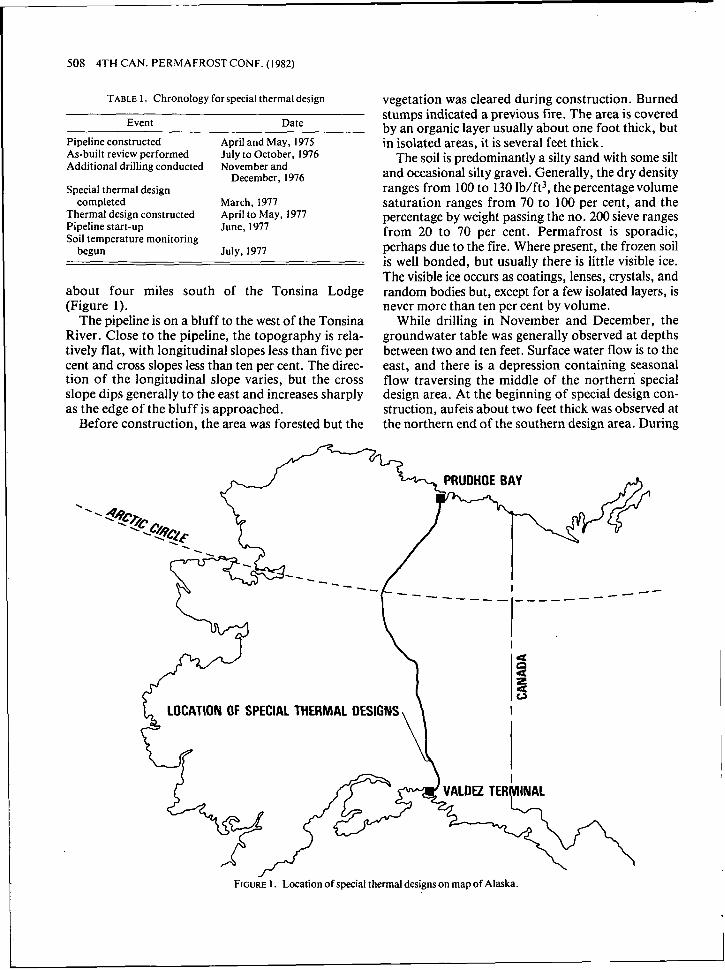
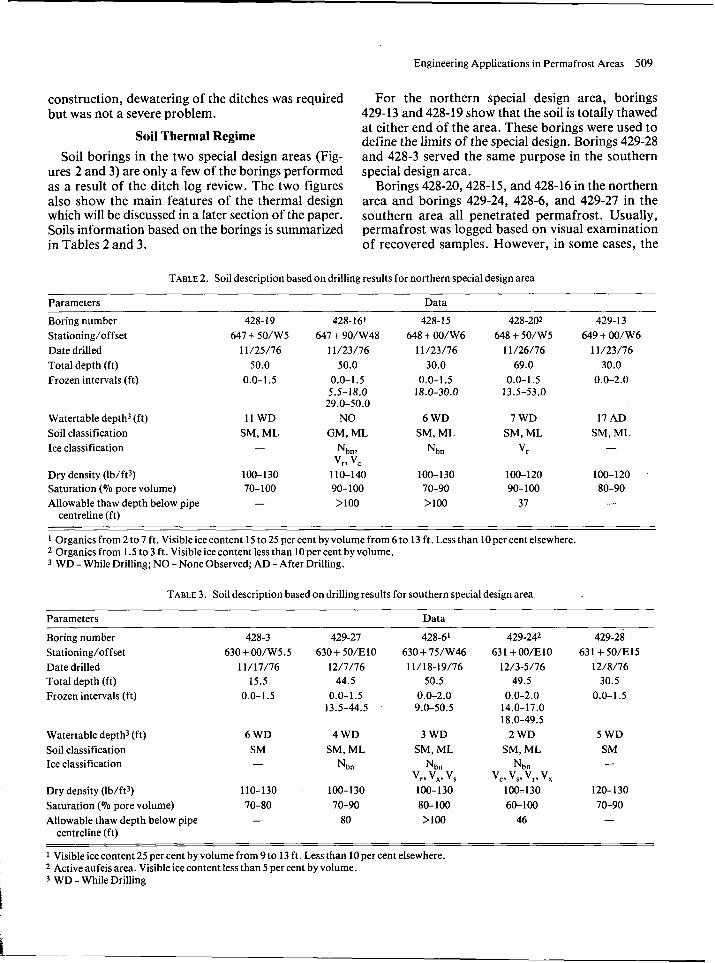
Soil Thermal Regime Soil borings in the two special design areas (Fig-
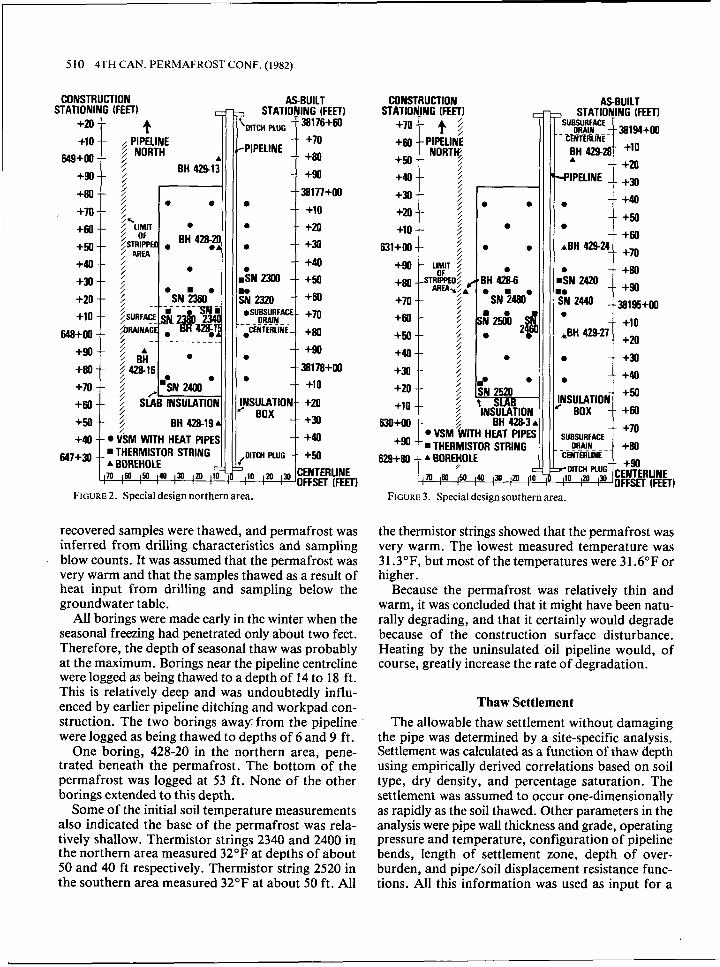
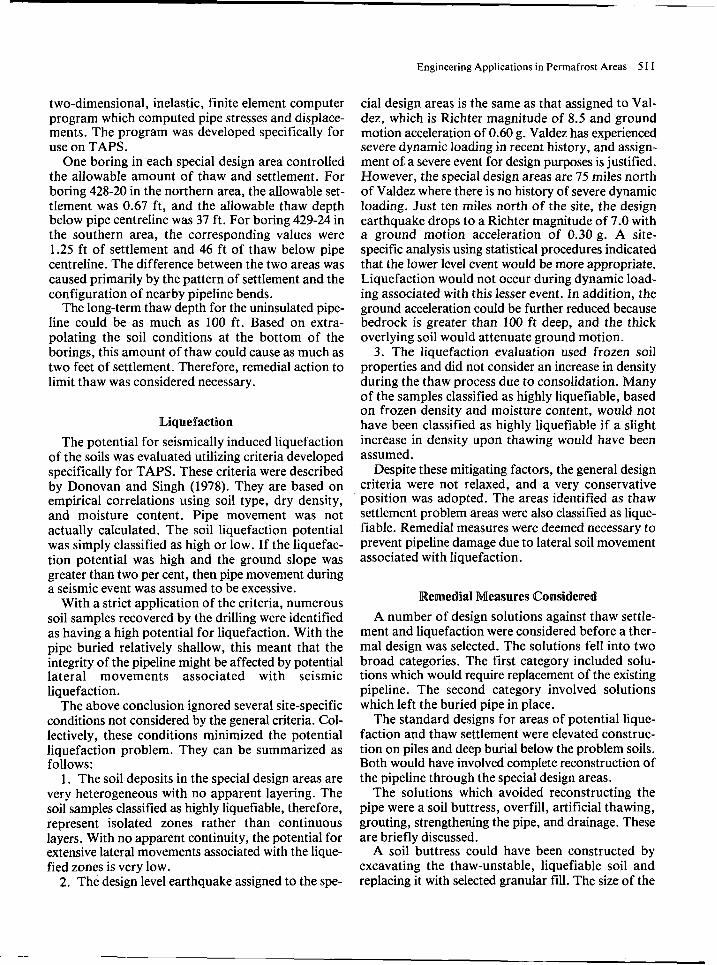
ures 2 and 3) are only a few of the borings performed as a result of the ditch log review. The two figures also show the main features of the thermal design which will be discussed in a later section of the paper. Soils information based on the borings is summarized in Tables 2 and 3.
For the northern special design area, borings 429-13 and 428-19 show that the soil is totally thawed at either end of the area. These borings were used to define the limits of the special design. Borings 429-28 and 428-3 served the same purpose in the southern special design area.
Borings 428-20,428-15, and 428-16 in the northern area and borings 429-24, 428-6, and 429-27 in the southern area all penetrated permafrost. Usually, permafrost was logged based on visual examination of recovered samples. However, in some cases, the
TABLE 2. Soil description based on drilling results for northern special design area
Parameters Data ~
Boring number Stationing/offset Date drilled Total depth (ft) Frozen intervals (ft)
Watertable depth3 (ft) Soil classification Ice classification
Dry density (Ib/ft3) Saturation (To pore volume) Allowable thaw depth below pipe
centreline (ft)
428- 19 647 + 5O/W5
11/25/76 50.0
0.0-1.5
11 WD SM, ML -
100-130 70-100
428-161 647+90/W48
11/23/76 50.0
0.0-1.5 5.5-18.0 29.0-50.0
NO GM, ML
Nbni v,, vc
110-140 90-100 >loo
428-15 648 + 00/W6
11/23/76 30.0
0.0-1.5 18.0-30.0
6 WD SM, ML
Nbn
100-130 70-90 >loo
428-202 648 + 5O/W5
11/26/76 69.0
0.0-1.5 13.5-53.0
7 WD SM, ML
V,
100-120 90-100
37
429-13 649 + OO/W6
11/23/76 30.0
0.0-2.0
17 AD SM, ML
100-120 80-90 -
1 Organics from 2 to 7 ft. Visible ice content 15 to 25 per cent by volume from 6 to 13 ft. Less than 10 per cent elsewhere. 2 Organics from 1.5 to 3 ft. Visible ice content less than 10 per cent by volume. 3 WD - While Drilling; NO - None Observed; AD -After Drilling.
TABLE 3. Soil description based on drilling results for southern special design area
Parameters Data
Boring number Stationingloffset Date drilled Total depth (ft) Frozen intervals (ft)
Watertable depth3 (ft) Soil classification Ice classification
428-3 429-27 428-6' 429-242 429-28 630+00/W5.5 630+50/E10 630+75/W46 631 +00/E10 631 +50/E15
11/17/76 12/7/16 1 1 /18-19/76 12/3-5176 12/8/76 15.5 44.5 50.5 49.5 30.5
0.0-1.5 0.0-1.5 0.0-2.0 0.0-2.0 0.0-1.5 13.5-44.5 ' 9.0-50.5 14.0-17.0
18.0-49.5 6 WD 4 WD 3 WD 2 WD 5 WD
SM SM, ML SM, ML SM, ML SM Nbn
Dry density (Ib/ft3) 110-130 100-130 100-130 100-1 30 120-130
Allowable thaw depth below pipe - 80 >I00 46 Saturation (To pore volume) 70-80 70-90 80-100 60-100 70-90
- centreline (ft)
1 Visible ice content 25 per cent by volume from 9 to 13 ft. Less than 10 per cent elsewhere. 2 Active aufeis area. Visible ice content less than 5 per cent by volume. 3 WD - While Drilling
510 4TH CAN. PERMAFROST CONF. (1982)
CONSTRUCTION AS-BUILT STATIONING (FEET) STATIONING (FEET) +at 4
+90 +80 +m +60 +50 +40
647+30
2400
BH 428-19 4 I
+90
+10 . 4 VSM WITH HEAT PIPES11 1 1 t +a
FIGURE 2. Special design northern area.
recovered samples were thawed, and Permafrost was inferred from drilling characteristics and sampling blow counts. It was assumed that the permafrost was very warm and that the samples thawed as a result of heat input from drilling and sampling below the groundwater table.
All borings were made early in the winter when the seasonal freezing had penetrated only about two feet. Therefore, the depth of seasonal thaw was probably at the maximum. Borings near the pipeline centreline were logged as being thawed to a depth of 14 to 18 ft. This is relatively deep and was undoubtedly influ- enced by earlier pipeline ditching and workpad con- struction. The two borings away from the pipeline were logged as being thawed to depths of 6 and 9 ft.
One boring, 428-20 in the northern area, pene- trated beneath the permafrost. The bottom of the permafrost was logged at 53 ft. None of the other borings extended to this depth.
Some of the initial soil temperature measurements also indicated the base of the permafrost was rela- tively shallow. Thermistor strings 2340 and 2400 in the northern area measured 32°F at depths of about 50 and 40 ft respectively. Thermistor string 2520 in the southern area measured 32°F at about 50 ft. All
CONSTRUCTION STATIONING (FED)
+70+ f $ E
+50
VSM WITH HEAT PIPES . THERMISTOR STRING
FIGURE 3. Special design southern area.
ASBUILT - STATIONING (FEET)
. -- +#I
+70 +80
B. +90 BSN 2420
+10 +a +30 +40
r B H 429-24-_ . --
S " 4 0 --38195+M
aBH an-. --
. --
a --
+50
SUBSURFACE
the thermistor strings showed that the permafrost was very warm. The lowest measured temperature was 31.3"F, but most of the temperatures were 31.6"F or higher.
Because the permafrost was relatively thin and warm, it was concluded that it might have been natu- rally degrading, and that it certainly would degrade because of the construction surface disturbance. Heating by the uninsulated oil pipeline would, of course, greatly increase the rate of degradation.
Thaw Settlement The allowable thaw settlement without damaging
the pipe was determined by a site-specific analysis. Settlement was calculated as a function of thaw depth using empirically derived correlations based on soil type, dry density, and percentage saturation. The settlement was assumed to occur one-dimensionally as rapidly as the soil thawed. Other parameters in the analysis were pipe wall thickness and grade, operating pressure and temperature, configuration of pipeline bends, length of settlement zone, depth of over- burden, and pipe/soil displacement resistance func- tions. All this information was used as input for a
two-dimensional, inelastic, finite element computer program which computed pipe stresses and displace- ments. The program was developed specifically for use on TAPS.
One boring in each special design area controlled the allowable amount of thaw and settlement. For boring 428-20 in the northern area, the allowable set- tlement was 0.67 ft, and the allowable thaw depth below pipe centreline was 37 ft. For boring 429-24 in the southern area, the corresponding values were 1.25 ft of settlement and 46 ft of thaw below pipe centreline. The difference between the two areas was caused primarily by the pattern of settlement and the configuration of nearby pipeline bends.
The long-term thaw depth for the uninsulated pipe- line could be as much as 100 ft. Based on extra- polating the soil conditions at the bottom of the borings, this amount of thaw could cause as much as two feet of settlement. Therefore, remedial action to limit thaw was considered necessary.
ILi~uefacti~n The potential for seismically induced liquefaction
of the soils was evaluated utilizing criteria developed specifically for TAPS. These criteria were described by Donovan and Singh (1978). They are based on empirical correlations using soil type, dry density, and moisture content. Pipe movement was not actually calculated. The soil liquefaction potential was simply classified as high or low. If the liquefac- tion potential was high and the ground slope was greater than two per cent, then pipe movement during a seismic event was assumed to be excessive.
With a strict application of the criteria, numerous soil samples recovered by the drilling were identified as having a high potential for liquefaction. With the pipe buried relatively shallow, this meant that the integrity of the pipeline might be affected by potential lateral movements associated with seismic liquefaction.
The above conclusion ignored several site-specific conditions not considered by the general criteria. Col- lectively, these conditions minimized the potential liquefaction problem. They can be summarized as follows:
1. The soil deposits in the special design areas are very heterogeneous with no apparent layering. The soil samples classified as highly liquefiable, therefore, represent isolated zones rather than continuous layers. With no apparent continuity, the potential for extensive lateral movements associated with the lique- fied zones is very low.
2. The design level earthquake assigned to the spe-
Engineering Applications in Permafrost Areas 51 1
cia1 design areas is the same as that assigned to Val- dez, which is Richter magnitude of 8.5 and ground motion acceleration of 0.60 g. Valdez has experienced severe dynamic loading in recent history, and assign- ment of a severe event for design purposes is justified. However, the special design areas are 75 miles north of Valdez where there is no history of severe dynamic loading. Just ten miles north of the site, the design earthquake drops to a Richter magnitude of 7.0 with a ground motion acceleration of 0.30 g. A site- specific analysis using statistical procedures indicated that the lower level event would be more appropriate. Liquefaction would not occur during dynamic load- ing associated with this lesser event. In addition, the ground acceleration could be further reduced because bedrock is greater than 100 ft deep, and the thick overlying soil would attenuate ground motion.
3. The liquefaction evaluation used frozen soil properties and did not consider an increase in density during the thaw process due to consolidation. Many of the samples classified as highly liquefiable, based on frozen density and moisture content, would not have been classified as highly liquefiable if a slight increase in density upon thawing would have been assumed.
Despite these mitigating factors, the general design criteria were not relaxed, and a very conservative position was adopted. The areas identified as thaw settlement problem areas were also classified as lique- fiable. Remedial measures were deemed necessary to prevent pipeline damage due to lateral soil movement associated with liquefaction.
Remedial Measures Considered A number of design solutions against thaw settle-
ment and liquefaction were considered before a ther- mal design was selected. The solutions fell into two broad categories. The first category included solu- tions which would require replacement of the existing pipeline. The second category involved solutions which left the buried pipe in place.
The standard designs for areas of potential lique- faction and thaw settlement were elevated construc- tion on piles and deep burial below the problem soils. Both would have involved complete reconstruction of the pipeline through the special design areas.
The solutions which avoided reconstructing the pipe were a soil buttress, overfill, artificial thawing, grouting, strengthening the pipe, and drainage. These are briefly discussed.
A soil buttress could have been constructed by excavating the thaw-unstable, liquefiable soil and replacing it with selected granular fill. The size of the
5 12 4TH CAN. PERMAFROST CONF. (1982)
excavation would have been deep enough to reduce thaw settlement to a tolerable level and large enough to resist the movement of the remaining liquefiable soil upslope of the pipe. This would have required a major construction effort complicated by the pres- ence of the pipe.
The liquefaction potential could have been reduced by placing a gravel berm or overfill on the ground surface to increase confinement pressure. The size of the berm would have been difficult to determine, and the additional overburden on the pipeline would have increased the thaw settlement problem.
The permafrost could have been artificially thawed by using warm water injection or some other method, while the pipe was temporarily supported. However, it was not possible to ensure adequate soil consolida- tion after thawing.
Grouting could have been used, along with artifi- cial thawing, to increase soil strength. This would have reduced both liquefaction and thaw settlement, but uniform distribution of the grout in the relatively fine-grained soil could not have been reliably obtained.
The pipe could have been strengthened by some type of below-ground structure to span the settlement areas. This would have been a complicated design and would not have addressed liquefaction.
Finally, the groundwater table could have been lowered to prevent liquefaction, but this would not have reduced thaw settlement.
Combinations of the above solutions, such as pre- thawing and drainage were also considered. How- ever, in addition to technical drawbacks, they were all cumbersome and expensive. The thermal design dis- cussed in the next section was more straightforward and utilized concepts previously developed and imple- mented for other problems. It was based on keeping the existing permafrost frozen. As long as this is done, thaw settlement and liquefaction cannot occur.
Thermal Design Description The special thermal design consisted of four major
features: thick pipe insulation, ground surface insula- tion, an array of free-standing vertical support mem- bers (VSM) with dual heat pipes, and groundwater drains. Except for the drains, the configuration of these features was the same in both the northern and southern areas (see Figures 2 and 3).
The pipe insulation and ground surface insulation were used to reduce heat input into the ground. The heat pipes were used to provide soil cooling below the insulation during the winter. The drains were used to lower the groundwater table.
The objectives of the design were to maintain the thaw depth below the pipe centreline to less than 37 ft and to limit the thaw below the surface insulation to less than five feet. The former would prevent exces- sive settlement. The latter, along with the drains, would prevent liquefaction near the pipeline and would provide a barrier against soil movement caused by liquefaction further upslope. The drains could be easily incorporated into the design and provide an extra measure of protection against liquefaction in addition to that provided by the heat pipes and ground surface insulation.
The design was based on computer simulations of the soil thermal regime conducted earlier in the over- all pipeline design. The computer program and typi- cal results were described by Jahns et al. (1973), Miller (1979), and Wheeler (1978).
In each area, 200 ft of the pipeline was insulated using an insulation box. The insulation was extended longitudinally 30 to 40 ft into thawed ground to pre- vent any thawing due to heat conduction from, or groundwater heated by, the pipeline outside of the permafrost.
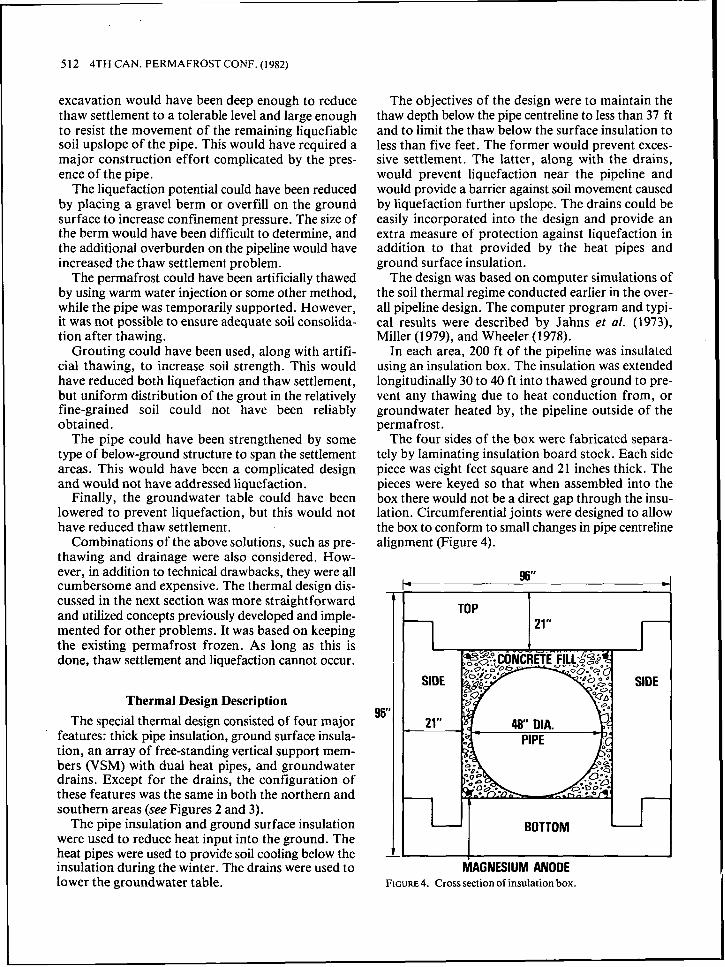
The four sides of the box were fabricated separa- tely by laminating insulation board stock. Each side piece was eight feet square and 21 inches thick. The pieces were keyed so that when assembled into the box there would not be a direct gap through the insu- lation. Circumferential joints were designed to allow the box to conform to small changes in pipe centreline alignment (Figure 4).
t l TOP t
9 6
MAGNESIUM ANODE FIGURE^. Cross section of insulation box.
Engineering Applications in Permafrost Areas 513
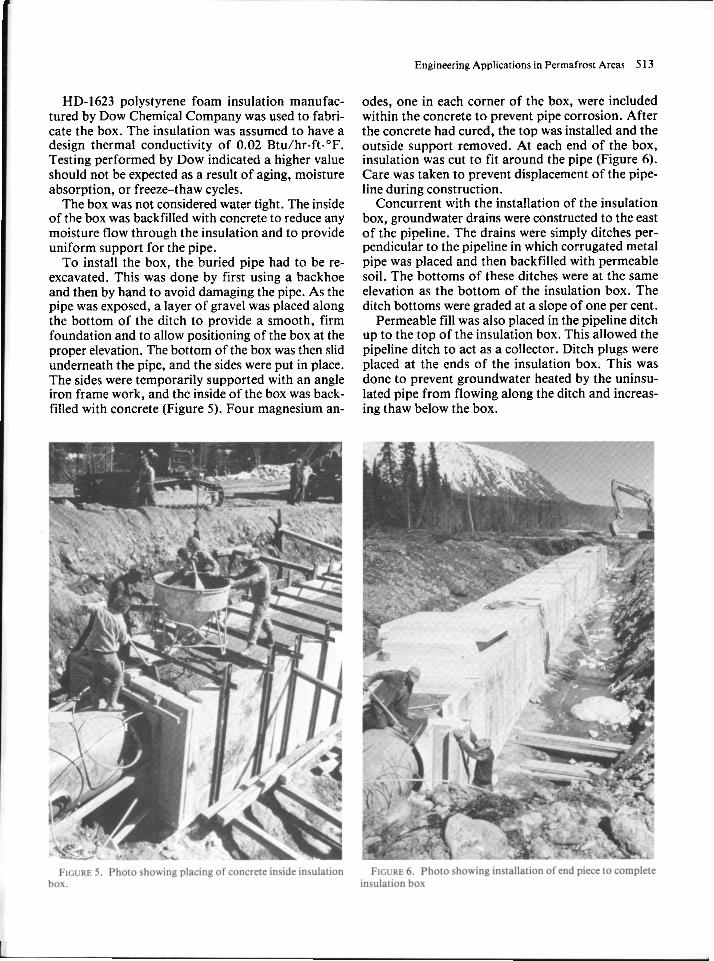
odes, one in each corner of the box, were included within the concrete to prevent pipe corrosion. After the concrete had cured, the top was installed and the outside support removed. At each end of the box, insulation was cut to fit around the pipe (Figure 6) . Care was taken to prevent displacement of the pipe- line during construction.
Concurrent with the installation of the insulation box, groundwater drains were constructed to the east of the pipeline. The drains were simply ditches per- pendicular to the pipeline in which corrugated metal pipe was placed and then backfilled with permeable soil. The bottoms of these ditches were at the same elevation as the bottom of the insulation box. The ditch bottoms were graded at a slope of one per cent.
Permeable fill was also placed in the pipeline ditch up to the top of the insulation box. This allowed the pipeline ditch to act as a collector. Ditch plugs were placed at the ends of the insulation box. This was done to prevent groundwater heated by the uninsu- lated pipe from flowing along the ditch and increas- ing thaw below the box.
HD-1623 polystyrene foam insulation manufac- tured by Dow Chemical Company was used to fabri- cate the box. The insulation was assumed to have a design thermal conductivity of 0.02 Btu/hr.ft."F. Testing performed by Dow indicated a higher value should not be expected as a result of aging, moisture absorption, or freeze-thaw cycles.
The box was not considered water tight. The inside of the box was backfilled with concrete to reduce any moisture flow through the insulation and to provide uniform support for the pipe.
To install the box, the buried pipe had to be re- excavated. This was done by first using a backhoe and then by hand to avoid damaging the pipe. As the pipe was exposed, a layer of gravel was placed along the bottom of the ditch to provide a smooth, firm foundation and to allow positioning of the box at the proper elevation. The bottom of the box was then slid underneath the pipe, and the sides were put in place. The sides were temporarily supported with an angle iron frame work, and the inside of the box was back- filled with concrete (Figure 5 ) . Four magnesium an-
514 4TH CAN. PERMAFROSTCONF, (1982)
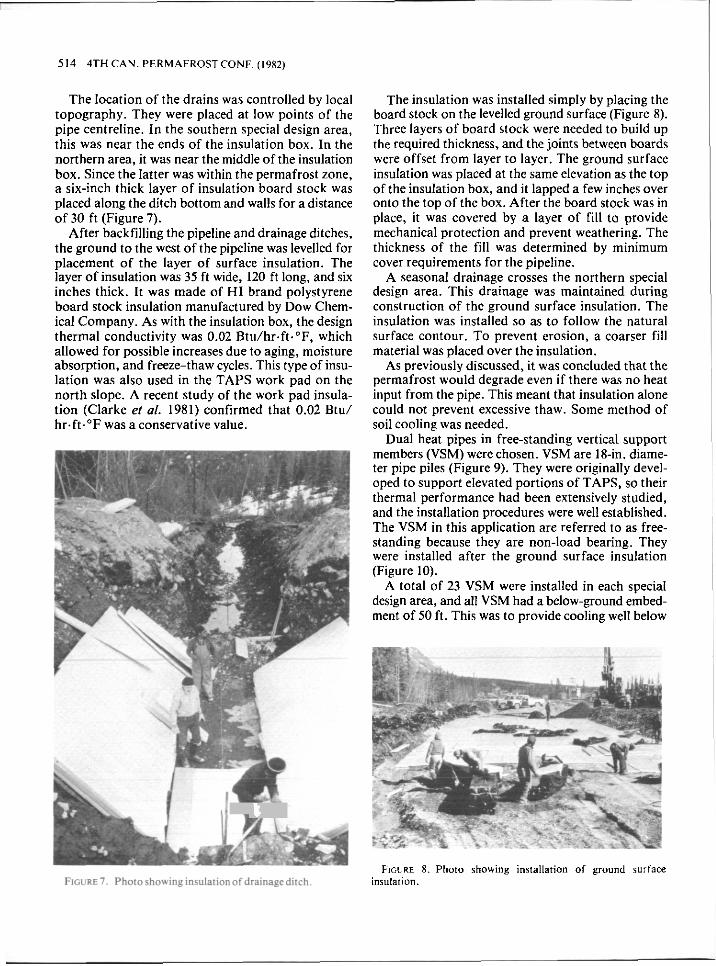
The location of the drains was controlled by local topography. They were placed at low points of the pipe centreline. In the southern special design area, this was near the ends of the insulation box. In the northern area, it was near the middle of the insulation box. Since the latter was within the permafrost zone, a six-inch thick layer of insulation board stock was placed along the ditch bottom and walls for a distance of 30 f t (Figure 7).
After backfilling the pipeline and drainage ditches, the ground to the west of the pipeline was levelled for placement of the layer of surface insulation. The layer of insulation was 35 f t wide, 120 ft long, and six inches thick. It was made of HI brand polystyrene board stock insulation manufactured by Dow Chem- ical Company. As with the insulation box, the design thermal conductivity was 0.02 Btu/hr.ft."F, which allowed for possible increases due to aging, moisture absorption, and freeze-thaw cycles. This type of insu- lation was also used in the TAPS work pad on the north slope. A recent study of the work pad insula- tion (Clarke et 01. 1981) confirmed that 0.02 Btu/ hr.ft."F was a conservative value.
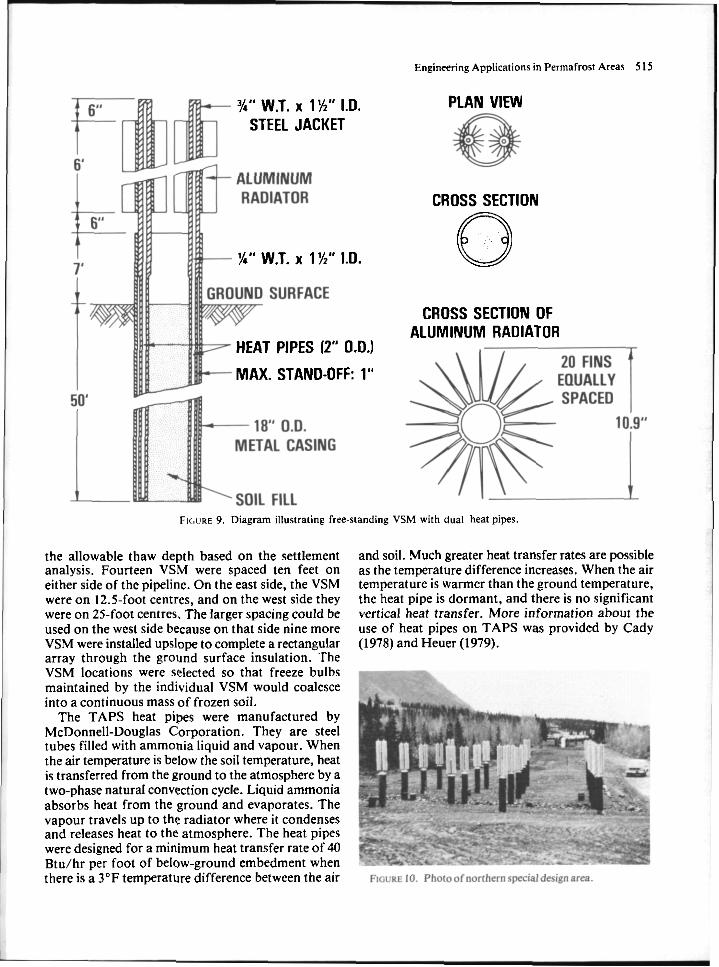
The insulation was installed simply by placing the board stock on the levelled ground surface (Figure 8). Three layers of board stock were needed to build up the required thickness, and the joints between boards were offset from layer to layer. The ground surface insulation was placed at the same elevation as the top of the insulation box, and it lapped a few inches over onto the top of the box. After the board stock was in place, it was covered by a layer of fill to provide mechanical protection and prevent weathering. The thickness of the fill was determined by minimum cover requirements for the pipeline.
A seasonal drainage crosses the northern special design area. This drainage was maintained during construction of the ground surface insulation. The insulation was installed so as to follow the natural surface contour. To prevent erosion, a coarser fill material was placed over the insulation.
As previously discussed, it was concluded that the permafrost would degrade even if there was no heat input from the pipe. This meant that insulation alone could not prevent excessive thaw. Some method of soil cooling was needed.
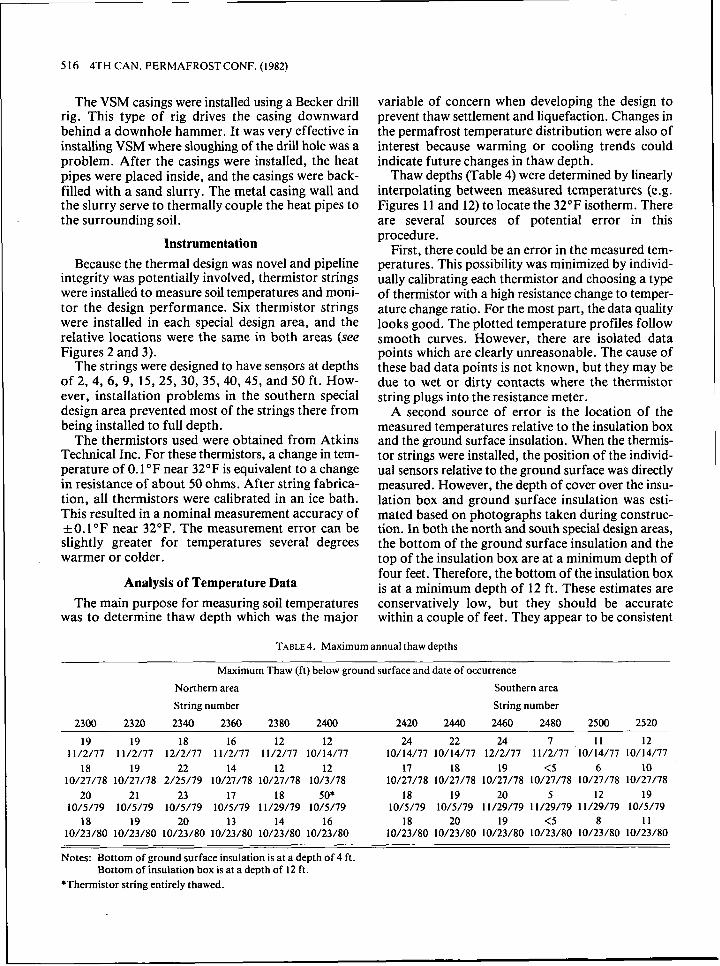
Dual heat pipes in free-standing vertical support members (VSM) were chosen. VSM are 18-in. diame- ter pipe piles (Figure 9). They were originally devel- oped to support elevated portions of TAPS, so their thermal performance had been extensively studied, and the installation procedures were well established. The VSM in this application are referred to as free- standing because they are non-load bearing. They were installed after the ground surface insulation (Figure 10).
A total of 23 VSM were installed in each special design area, and all VSM had a below-ground embed- ment of 50 ft. This was to provide cooling well below
P
FIGURE 8 . Photo showing installation of ground surface insulation.
Engineering Applications in Permafrost Areas 515
%" W.T. x 1%'' 1.0. STEEL JACKET
%" W.T. x 1 %" 1.0.
HEAT PIPES 12" 0.0.)
MAX. STAND-OFF 1"
PLAN VIEW
CROSS SECTION
0 CROSS SECTION OF
ALUMINUM RADIATOR
FIWRE 9. Diagram illuctraling free-standing VSM with dual heat pipes.
the allowable thaw depth based on the settlement analysis. Fourteen VSM were spaced ten feet on either side of the pipeline. On the east side, the VSM were on 12.5-foot centres, and on the west side they were on 25-foot centres, The larger spacing could be used on the west side because on that side nine more VSM were installed upslope to complete a rectangular array through the ground surface insulation. The VSM locations were selected so that freeze bulbs maintained by the individual VSM would coalesce into a continuous mass of frozen soil.
The TAPS heat pipes were manufactured by McDonnell-Douglas Corporation. They are steel tubes filled with ammonia liquid and vapour. When the air temperature is below the soil temperature, heat is transferred from the ground to the atmosphere by a two-phase naturaI convection cycle. Liquid ammonia absorbs heat from the ground and evaporates. The vapour travels up to the radiator where it condenses and releases heat to the atmosphere. The heat pipes were designed for a minimum heat transfer rate of 40 Btu/hr per foot of below-ground embedment when there is a 3°F temperature difference between the air
and soil. Much greater heat transfer rates are possible as the temperature difference increases. When the air temperature is warmer than the ground temperature, the heat pipe is dormant, and there is no significant vertical heat transfer. More information about the use of heat pipes on TAPS was provided by Cady (1978) and Heuer (1979).
516 4TH CAN. PERMAFROSTCONF. (1982)
The VSM casings were installed using a Becker drill rig. This type of rig drives the casing downward behind a downhole hammer. It was very effective in installing VSM where sloughing of the drill hole was a problem. After the casings were installed, the heat pipes were placed inside, and the casings were back- filled with a sand slurry. The metal casing wall and the slurry serve to thermally couple the heat pipes to the surrounding soil.
Instrumentation Because the thermal design was novel and pipeline
integrity was potentially involved, thermistor strings were installed to measure soil temperatures and moni- tor the design performance. Six thermistor strings were installed in each special design area, and the relative locations were the same in both areas (see Figures 2 and 3).
The strings were designed to have sensors at depths of 2, 4, 6, 9, 15, 25, 30, 35,40,45, and 50 ft. How- ever, installation problems in the southern special design area prevented most of the strings there from being installed to full depth.
The thermistors used were obtained from Atkins Technical Inc. For these thermistors, a change in tem- perature of 0.1 "F near 32°F is equivalent to a change in resistance of about 50 ohms. After string fabrica- tion, all thermistors were calibrated in an ice bath. This resulted in a nominal measurement accuracy of -10.I"F near 32°F. The measurement error can be slightly greater for temperatures several degrees warmer or colder.
Analysis of Temperature Data The main purpose for measuring soil temperatures
was to determine thaw depth which was the major
variable of concern when developing the design to prevent thaw settlement and liquefaction. Changes in the permafrost temperature distribution were also of interest because warming or cooling trends could indicate future changes in thaw depth.
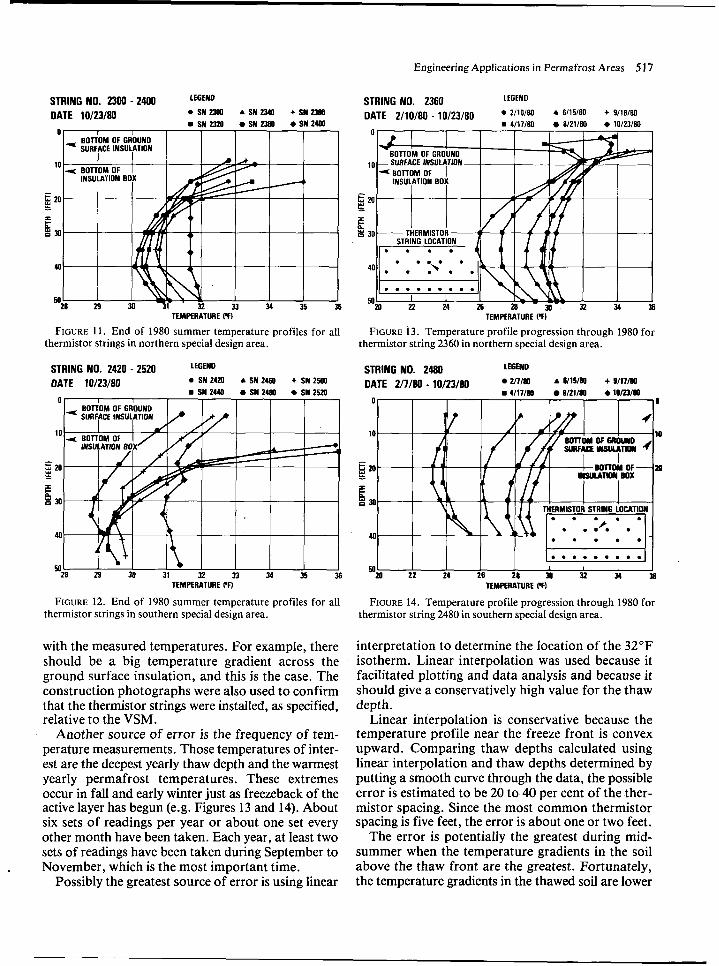
Thaw depths (Table 4) were determined by linearly interpolating between measured temperatures (e.g . Figures 11 and 12) to locate the 32°F isotherm. There are several sources of potential error in this procedure.
First, there could be an error in the measured tem- peratures. This possibility was minimized by individ- ually calibrating each thermistor and choosing a type of thermistor with a high resistance change to temper- ature change ratio. For the most part, the data quality looks good. The plotted temperature profiles follow smooth curves. However, there are isolated data points which are clearly unreasonable. The cause of these bad data points is not known, but they may be due to wet or dirty contacts where the thermistor string plugs into the resistance meter.
A second source of error is the location of the measured temperatures relative to the insulation box and the ground surface insulation. When the thermis- tor strings were installed, the position of the individ- ual sensors relative to the ground surface was directly measured. However, the depth of cover over the insu- lation box and ground surface insulation was esti- mated based on photographs taken during construc- tion. In both the north and south special design areas, the bottom of the ground surface insulation and the top of the insulation box are at a minimum depth of four feet. Therefore, the bottom of the insulation box is at a minimum depth of 12 ft. These estimates are conservatively low, but they should be accurate within a couple of feet. They appear to be consistent
TABLE^. Maximum annual thaw depths
Maximum Thaw (ft) below ground surface and date of occurrence
Northern area Southern area
String number String number
2300 2320 2340 2360 2380 2400 2420 2440 2460 2480 2500 2520
19 19 18 16 12 12 24 22 24 7 11 12 11/2/77 11/2/77 12/2/17 11/2/17 11/2/77 10/14/77 10/14/77 10/14/77 12/2/77 11/2/77 10/14/77 10/14/77
18 19 22 14 12 12 17 18 19 <5 6 10 10/27/18 10/27/78 2/25/79 10/27/78 10/27/78 10/3/78 10/27/78 10/27/78 10/27/78 10/27/78 10127178 10127178
20 21 23 17 18 50* 18 19 20 5 12 19 10/5/79 10/5/79 10/5/19 10/5/79 11/29/19 10/5/79 10/5/79 10/5/79 11/29/79 11/29/79 11/29/79 1015179
18 19 20 13 14 16 18 20 19 <5 8 11 10/23/80 10/23/80 10/23/80 10/23/80 10/23/80 10/23/80 10/23/80 10/23/80 10/23/80 10/23/80 10/23/80 10/23/80
Notes: Bottom of ground surface insulation is at a depth of 4 ft.
*Thermistor string entirely thawed. Bottom of insulation box is at a depth of 12 ft.
Engineering Applications in Permafrost Areas 51 7
BOTTOM OF GROUND * SURFACE INSULATION
STRING NO. 2300 - 2400 OATE 10/23/80
LEGflYD
OSW2300 A S N U U I +SW2388 mSNZf2O OSN2360 eSN2400
....... 0 .
TEMPERATURE PF)
FIGURE 11. End of 1980 summer temperature profiles for all thermistor strings in northern special design area.
LEGEND
0 SNZkZO A SN2160 + SN2500 mSN24&l o S N 2 4 S l *SNZ!iZO
STRING NO. 2420 - 2520 DATE 10/23/80
TEMPERATURE PF)
FIGURE 12. End of 1980 summer temperature profiles for all thermistor strings in southern special design area.
with the measured temperatures. For example, there should be a big temperature gradient across the ground surface insulation, and this is the case. The construction photographs were also used to confirm that the thermistor strings were installed, as specified, relative to the VSM.
Another source of error is the frequency of tem- perature measurements. Those temperatures of inter- est are the deepest yearly thaw depth and the warmest yearly permafrost temperatures. These extremes occur in fall and early winter just as freezeback of the active layer has begun (e.g. Figures 13 and 14). About six sets of readings per year or about one set every other month have been taken. Each year, at least two sets of readings have been taken during September to November, which is the most important time.
Possibly the greatest source of error is using linear ~
TEMPERATURE lW FIGURE 13. Temperature profile progression through 1980 for
thermistor string 2360 in northern special design area.
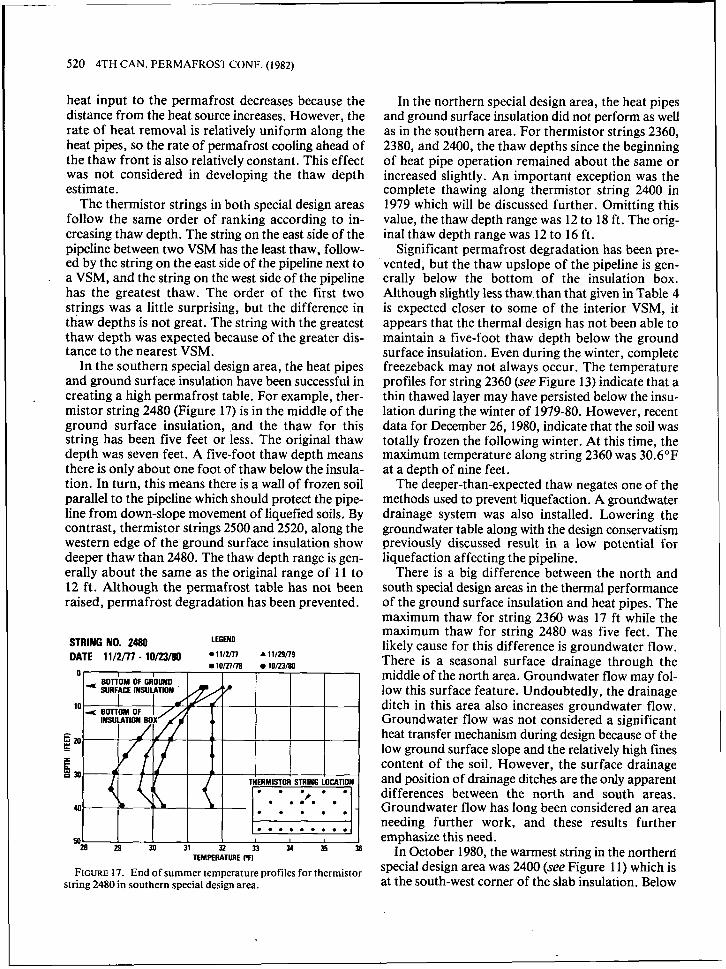
STRING NO. 2480 LEGEND
DATE m/m 1 0 / ~ / ~ znim A ~ 1 5 1 8 0 + W17m rn 11i71m 8 1 2 1 1 ~ + ioizlim
O [ 1 I I I 1 I I
FIGURE 14. Temperature profile progression through 1980 for thermistor string 2480 in southern special design area.
interpretation to determine the location of the 32°F isotherm. Linear interpolation was used because it facilitated plotting and data analysis and because it should give a conservatively high value for the thaw depth.
Linear interpolation is conservative because the temperature profile near the freeze front is convex upward. Comparing thaw depths calculated using linear interpolation and thaw depths determined by putting a smooth curve through the data, the possible error is estimated to be 20 to 40 per cent of the ther- mistor spacing. Since the most common thermistor spacing is five feet, the error is about one or two feet.
The error is potentially the greatest during mid- summer when the temperature gradients in the soil above the thaw front are the greatest. Fortunately, the temperature gradients in the thawed soil are lower
518 4TH CAN. PERMAFROSTCONF. (1982)
during fall and early winter when the maximum thaw depth occurs and the greatest accuracy is desired.
Based on this discussion, the maximum overall error in the thaw depth is probably no more than three feet. This is acceptable considering other uncer- tainties in the thaw settlement and liquefaction anal- yses. Further, an effort was made to bias the thaw depth estimates conservatively toward higher values.
The maximum annual thaw depths (see Table 4) are neither monotonically increasing nor decreasing with time, For both special design areas, the thaw depths in 1979 are generally greater than in 1978 or 1980.
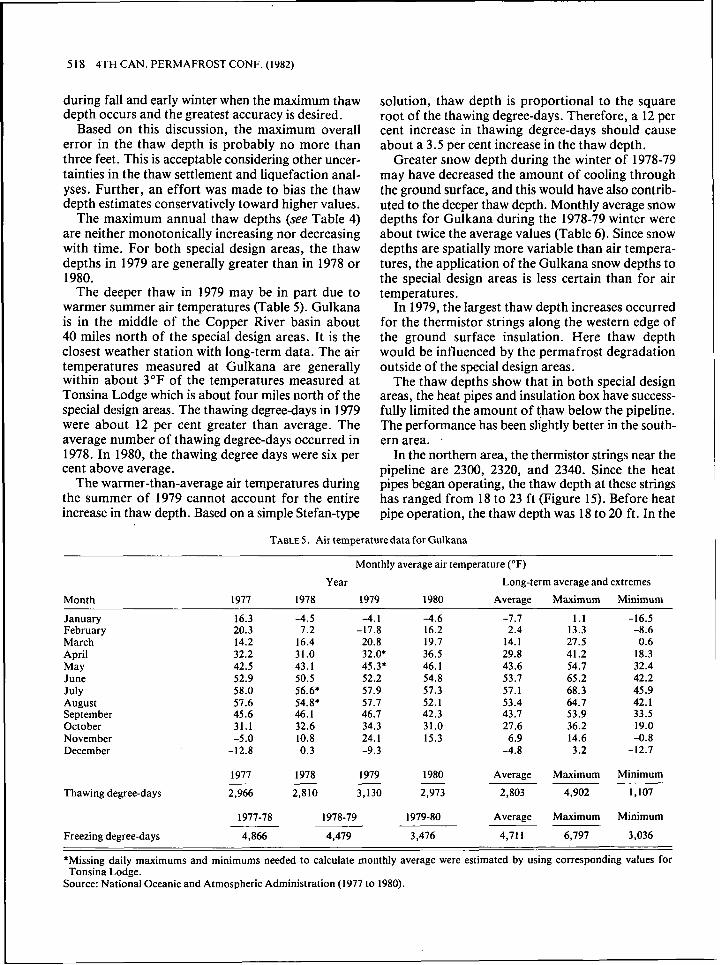
The deeper thaw in 1979 may be in part due to warmer summer air temperatures (Table 5) . Gulkana is in the middle of the Copper River basin about 40 miles north of the special design areas. It is the closest weather station with long-term data. The air temperatures measured at Gulkana are generally within about 3°F of the temperatures measured at Tonsina Lodge which is about four miles north of the special design areas. The thawing degreedays in 1979 were about 12 per cent greater than average. The average number of thawing degree-days occurred in 1978. In 1980, the thawing degree days were six per cent above average.
The warmer-than-average air temperatures during the summer of 1979 cannot account for the entire increase in thaw depth. Based on a simple Stefan-type
solution, thaw depth is proportional to the square root of the thawing degree-days. Therefore, a 12 per cent increase in thawing degree-days should cause about a 3.5 per cent increase in the thaw depth.
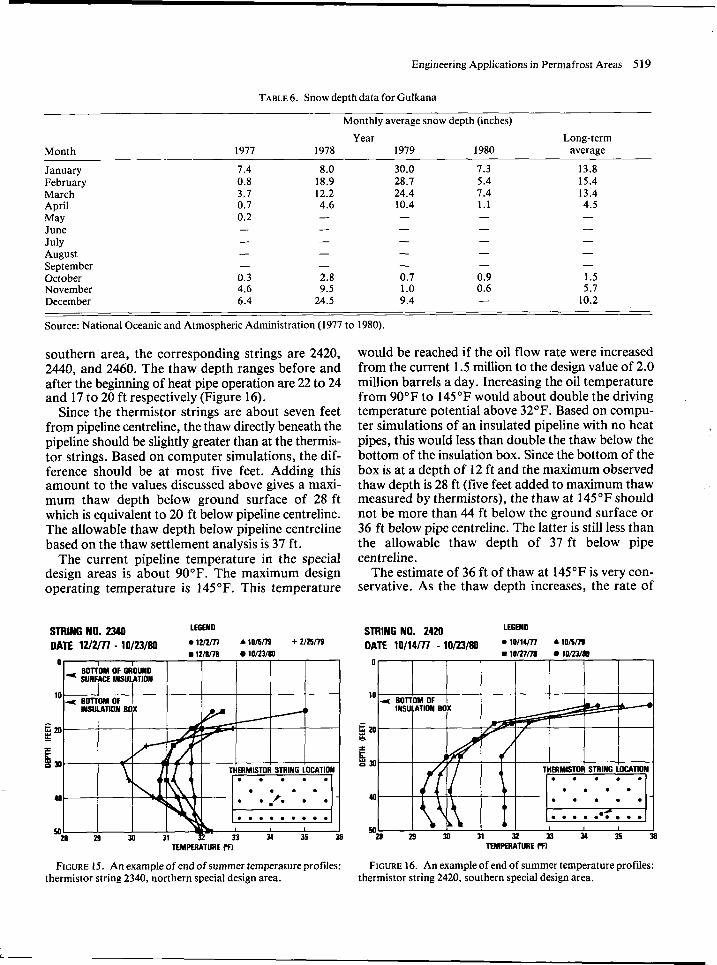
Greater snow depth during the winter of 1978-79 may have decreased the amount of cooling through the ground surface, and this would have also contrib- uted to the deeper thaw depth. Monthly average snow depths for Gulkana during the 1978-79 winter were about twice the average values (Table 6). Since snow depths are spatially more variable than air tempera- tures, the application of the Gulkana snow depths to the special design areas is less certain than for air temperatures.
In 1979, the largest thaw depth increases occurred for the thermistor strings along the western edge of the ground surface insulation. Here thaw depth would be influenced by the permafrost degradation outside of the special design areas.
The thaw depths show that in both special design areas, the heat pipes and insulation box have success- fully limited the amount of thaw below the pipeline. The performance has been slightly better in the south- ern area. .
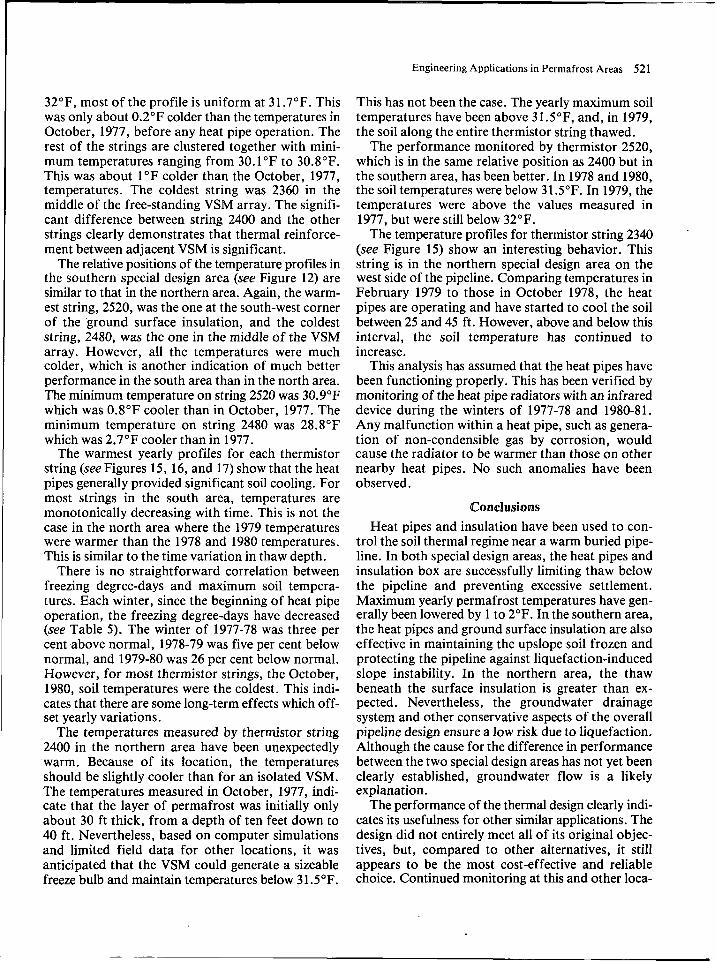
In the northern area, the thermistor strings near the pipeline are 2300, 2320, and 2340. Since the heat pipes began operating, the thaw depth at these strings has ranged from 18 to 23 ft (Figure 15). Before heat pipe operation, the thaw depth was 18 to 20 ft. In the
TABLE 5 . Air temperaturedata for Gulkana
Month
January February March April May June July August September October November December
Thawing degree-days
Freezing degree-days
1977
16.3 20.3 14.2 32.2 42.5 52.9 58.0 57.6 45.6 31.1 -5.0
-12.8
1978
Monthly average air temperature ( O F )
Year Long-term average and extremes
1979
-4.5 7.2
16.4 31.0 43.1 50.5 56.6; 54.8; 46.1 32.6 10.8 0.3
-4.1 -17.8 20.8 32.0; 45.3* 52.2 57.9 57.7 46.7 34.3 24.1 -9.3
1980
-4.6 16.2 19.7 36.5 46.1 54.8 57.3 52.1 42.3 31.0 15.3
Average
-7.7 2.4
14.1 29.8 43.6 53.7 57.1 53.4 43.7 27.6 6.9
-4.8
Maximum
1 . 1 13.3 27.5 41.2 54.7 65.2 68.3 64.7 53.9 36.2 14.6 3.2
Minimum
-16.5 -8.6 0.6
18.3 32.4 42.2 45.9 42.1 33.5 19.0 -0.8
-12.7
1977 1978 1979 1980 Average Maximum Minimum
2,966 2,810 3,130 2,973 2,803 4,902 1,107 - - - ~
1977-78 1978-79 1979-80 Average Maximum Minimum
4,866 4,479 3,476 4,711 6,791 3,036
*Missing daily maximums and minimums needed to calculate monthly average were estimated by using corresponding values for
Source: National Oceanic and Atmospheric Administration (1977 to 1980). Tonsina Lodge.
Engineering Applications in Permafrost Areas 51 9
TABLE6. Snow depth data for Gulkana
Monthly average snow depth (inches)
Month Year Long-term
1977 1978 1979 1980 average
January February March April
June July August September October November December
May
7.4 0.8 3.7 0.7 0.2 - - - - 0.3 4.6 6.4
8.0 18.9 12.2 4.6 - - - - - 2.8 9.5
24.5
30.0 28.7 24.4 10.4 - - - - - 0.7 1 .o 9.4
7.3 5.4 7.4 1.1 - - - - - 0.9 0.6 -
13.8 15.4 13.4 4.5 - - - - - 1.5 5.7
10.2 ~~ ~
Source: National Oceanic and Atmospheric Administration (1977 to 1980).
southern area, the corresponding strings are 2420, 2440, and 2460. The thaw depth ranges before and after the beginning of heat pipe operation are 22 to 24 and 17 to 20 ft respectively (Figure 16).
Since the thermistor strings are about seven feet from pipeline centreline, the thaw directly beneath the pipeline should be slightly greater than at the thermis- tor strings. Based on computer simulations, the dif- ference should be at most five feet. Adding this amount to the values discussed above gives a maxi- mum thaw depth below ground surface of 28 ft which is equivalent to 20 ft below pipeline centreline. The allowable thaw depth below pipeline centreline based on the thaw settlement analysis is 37 ft.
The current pipeline temperature in the special design areas is about 90°F. The maximum design operating temperature is 145°F. This temperature
TEMPERATURE f f I
FIGURE 15. An examole of end of summer temperature profiles:
would be reached if the oil flow rate were increased from the current 1.5 million to the design value of 2.0 million barrels a day. Increasing the oil temperature from 90°F to 145°F would about double the driving temperature potential above 32°F. Based on compu- ter simulations of an insulated pipeline with no heat pipes, this would less than double the thaw below the bottom of the insulation box. Since the bottom of the box is at a depth of 12 ft and the maximum observed thaw depth is 28 ft (five feet added to maximum thaw measured by thermistors), the thaw at 145°F should not be more than 44 ft below the ground surface or 36 ft below pipe centreline. The latter is still less than the allowable thaw depth of 37 ft below pipe centreline.
The estimate of 36 ft of thaw at 145°F is very con- servative. As the thaw depth increases, the rate of
LEGEND STRING NO. 2420
TEMPWANRE I’Fl
FIGURE 16. An example of end of summer temperature Drofiles: thermistor string 2340, northern special design area. thermistor string 2420, southern special design Gea.
.
520 4TH CAN. PERMAFROST CONF. (1982)
.........
heat input to the permafrost decreases because the distance from the heat source increases. However, the rate of heat removal is relatively uniform along the heat pipes, so the rate of permafrost cooling ahead of the thaw front is also relatively constant. This effect was not considered in developing the thaw depth estimate.
The thermistor strings in both special design areas follow the same order of ranking according to in- creasing thaw depth. The string on the east side of the pipeline between two VSM has the least thaw, follow- ed by the string on the east side of the pipeline next to a VSM, and the string on the west side of the pipeline has the greatest thaw. The order of the first two strings was a little surprising, but the difference in thaw depths is not great. The string with the greatest thaw depth was expected because of the greater dis- tance to the nearest VSM.
In the southern special design area, the heat pipes and ground surface insulation have been successful in creating a high permafrost table. For example, ther- mistor string 2480 (Figure 17) is in the middle of the ground surface insulation, ,and the thaw for this string has been five feet or less. The original thaw depth was seven feet. A five-foot thaw depth means there is only about one foot of thaw below the insula- tion. In turn, this means there is a wall of frozen soil parallel to the pipeline which should protect the pipe- line from down-slope movement of liquefied soils. By contrast, thermistor strings 2500 and 2520, along the western edge of the ground surface insulation show deeper thaw than 2480. The thaw depth range is gen- erally about the same as the original range of 1 1 to 12 ft. Although the permafrost table has not been raised, permafrost degradation has been prevented.
In the northern special design area, the heat pipes and ground surface insulation did not perform as well as in the southern area. For thermistor strings 2360, 2380, and 2400, the thaw depths since the beginning of heat pipe operation remained about the same or increased slightly. An important exception was the complete thawing along thermistor string 2400 in 1979 which will be discussed further. Omitting this value, the thaw depth range was 12 to 18 ft. The orig- inal thaw depth range was 12 to 16 ft.
Significant permafrost degradation has been pre- vented, but the thaw upslope of the pipeline is gen- erally below the bottom of the insulation box. Although slightly less thaw than that given in Table 4 is expected closer to some of the interior VSM, it appears that the thermal design has not been able to maintain a five-foot thaw depth below the ground surface insulation. Even during the winter, complete freezeback may not always occur. The temperature profiles for string 2360 (see Figure 13) indicate that a thin thawed layer may have persisted below the insu- lation during the winter of 1979-80. However, recent data for December 26, 1980, indicate that the soil was totally frozen the following winter. At this time, the maximum temperature along string 2360 was 30.6"F at a depth of nine feet,
The deeper-than-expected thaw negates one of the methods used to prevent liquefaction. A groundwater drainage system was also installed. Lowering the groundwater table along with the design conservatism previously discussed result in a low potential for liquefaction affecting the pipeline.
There is a big difference between the north and south special design areas in the thermal performance of the ground surface insulation and heat pipes. The maximum thaw for string 2360 was 17 ft while the maximum thaw for string 2480 was five feet. The likely cause for this difference is groundwater flow. There is a seasonal surface drainage through the middle of the north area. Groundwater flow may fol- low this surface feature. Undoubtedly, the drainage ditch in this area also increases groundwater flow. Groundwater flow was not considered a significant heat transfer mechanism during design because of the low ground surface slope and the relatively high fines content of the soil. However, the surface drainage and position of drainage ditches are the only apparent differences between the north and south areas. Groundwater flow has long been considered an area needing further work, and these results further emphasize this need.
In October 1980, the warmest string in the northern special design area was 2400 (see Figure 11) which is at the south-west comer of the slab insulation. Below
Engineering Applications in Permafrost Areas 521
32"F, most of the profile is uniform at 31.7"F. This was only about 0.2"F colder than the temperatures in October, 1977, before any heat pipe operation. The rest of the strings are clustered together with mini- mum temperatures ranging from 30.1 "F to 30.8"F. This was about 1°F colder than the October, 1977, temperatures. The coldest string was 2360 in the middle of the free-standing VSM array. The signifi- cant difference between string 2400 and the other strings clearly demonstrates that thermal reinforce- ment between adjacent VSM is significant.
The relative positions of the temperature profiles in the southern special design area (see Figure 12) are similar to that in the northern area. Again, the warm- est string, 2520, was the one at the south-west corner of the ground surface insulation, and the coldest string, 2480, was the one in the middle of the VSM array. However, all the temperatures were much colder, which is another indication of much better performance in the south area than in the north area. The minimum temperature on string 2520 was 30.9"F which was 0.8"F cooler than in October, 1977. The minimum temperature on string 2480 was 28.8"F which was 2.7"F cooler than in 1977.
The warmest yearly profiles for each thermistor string (see Figures 15, 16, and 17) show that the heat pipes generally provided significant soil cooling. For most strings in the south area, temperatures are monotonically decreasing with time. This is not the case in the north area where the 1979 temperatures were warmer than the 1978 and 1980 temperatures. This is similar to the time variation in thaw depth.
There is no straightforward correlation between freezing degree-days and maximum soil tempera- tures. Each winter, since the beginning of heat pipe operation, the freezing degree-days have decreased (see Table 5 ) . The winter of 1977-78 was three per cent above normal, 1978-79 was five per cent below normal, and 1979-80 was 26 per cent below normal. However, for most thermistor strings, the October, 1980, soil temperatures were the coldest. This indi- cates that there are some long-term effects which off- set yearly variations.
The temperatures measured by thermistor string 2400 in the northern area have been unexpectedly warm. Because of its location, the temperatures should be slightly cooler than for an isolated VSM. The temperatures measured in October, 1977, indi- cate that the layer of permafrost was initially only about 30 ft thick, from a depth of ten feet down to 40 ft. Nevertheless, based on computer simulations and limited field data for other locations, it was anticipated that the VSM could generate a sizeable freeze bulb and maintain temperatures below 31.5"F.
This has not been the case. The yearly maximum soil temperatures have been above 31.5"F, and, in 1979, the soil along the entire thermistor string thawed.
The performance monitored by thermistor 2520, which is in the same relative position as 2400 but in the southern area, has been better. In 1978 and 1980, the soil temperatures were below 31.5"F. In 1979, the temperatures were above the values measured in 1977, but were still below 32°F.
The temperature profiles for thermistor string 2340 (see Figure 15) show an interesting behavior. This string is in the northern special design area on the west side of the pipeline. Comparing temperatures in February 1979 to those in October 1978, the heat pipes are operating and have started to cool the soil between 25 and 45 ft. However, above and below this interval, the soil temperature has continued to increase.
This analysis has assumed that the heat pipes have been functioning properly. This has been verified by monitoring of the heat pipe radiators with an infrared device during the winters of 1977-78 and 1980-81. Any malfunction within a heat pipe, such as genera- tion of non-condensible gas by corrosion, would cause the radiator to be warmer than those on other nearby heat pipes. No such anomalies have been observed.
.
Heat pipes and insulation have been used to con- trol the soil thermal regime near a warm buried pipe- line. In both special design areas, the heat pipes and insulation box are successfully limiting thaw below the pipeline and preventing excessive settlement. Maximum yearly permafrost temperatures have gen- erally been lowered by 1 to 2°F. In the southern area, the heat pipes and ground surface insulation are also effective in maintaining the upslope soil frozen and protecting the pipeline against liquefaction-induced slope instability. In the northern area, the thaw beneath the surface insulation is greater than ex- pected. Nevertheless, the groundwater drainage system and other conservative aspects of the overall pipeline design ensure a low risk due to liquefaction. Although the cause for the difference in performance between the two special design areas has not yet been clearly established, groundwater flow is a likely explanation.
The performance of the thermal design clearly indi- cates its usefulness for other similar applications. The design did not entirely meet all of its original objec- tives, but, compared to other alternatives, it still appears to be the most cost-effective and reliable choice. Continued monitoring at this and other loca-
522 4TH CAN. PERMAFROST CONF. (1982)
tions along the pipeline will provide data useful for design optimization for other applications.
Acknowledgements The authors wish to express their appreciation to
Alyeska Pipeline Service Company, the operator of the Trans-Alaska Pipeline System, for providing the resources which made this paper possible. Other engi- neers who have made contributions to design devel- opment and data analysis are A.B. Christopherson, R.G. Hochschild, S.S. Shere, and J.M. Stanley.
References CADY, E.C. 1978. Cryo-Anchor proven performance for Arctic
foundation stabilization. Joint US-USSR Sem. Build. under Cold Climates and on Permafrost, Leningrad, USSR.
CLARKE, E.S., KRZEWINSKI, T.G., ANDMETZ, M.C. 1981. Trans- Alaska Pipeline System synthetically insulated workpad - an evaluation of present conditions. ASME Energy-Sources Tech- nol. Conf. and Exhib., Houston, Texas. pp. 1-16.
DONOVAN, N.G. AND SINGH, SUKHMANDER. 1978. Liquefaction cri- teria for Trans-Alaska Pipeline. J. Geotech. Eng. Div., ASCE,
HEUER, C.E. 1979. The application of heat pipes on the Trans- Alaska Pipeline. CRREL Special Rep. 79-26, pp. 1-27.
JAHNS, H.O., MILLER, T.W., POWER, L.D. RICKEY, W.P., TAYLOR, T.P., AND WHEELER, J.A. 1973. Permafrost protection for pipelines. In: North Amer. Contrib., Proc. 2nd Int. Conf. Permafrost, Natl. Acad. Sci., Washington, pp. 673-684.
LUSCHER, ULRICH AND THOMAS, H.P. 1979. Geotechnical issues and answers during construction of the Trans-Alaska Pipeline. J. Energy Resour. Technol. vol. 101(2), June, pp. 128-133.
MILLER, T.W. 1979. The surface heat balance in simulations of permafrost behaviour. J. Energy Resour. Technol. vol. lOl(4) December, pp. 240-250.
1980. Local climatological data for Gulkana, Alaska. Environ. Data Serv., Natl. Climatic Center, Asheville, N. Carolina.
WHEELER, J.A. 1978. Permafrost thermal design for the Trans- Alaska Pipeline. In: Moving boundary problems. eds. D.G. Wilson, A.D. Solomon, and P.T. Boggs. Academic Press.
pp. 262-278.
pp. 447-462.
NATIONAL OCEANIC AND ATMOSPHERIC ADMINISTRATION. 1977 to
pp. 267-284.