Embed Size (px)
Citation preview
SPECIAL COMMENT
GLOBAL CORPORATE FINANCE JULY 11, 2011
Table of Contents:
OVERVIEW 1 RED FLAGS AN INTERESTING SCREEN 2 FRAMEWORK FOCUSES ON FIVE KEY CATEGORIES 2 APPENDIX 1: FIVE CATEGORIES OF WARNING SIGNS 8 APPENDIX 2: A FEW QUANTITATIVE ADJUSTMENTS FOR PROPERTY DEVELOPERS 13 APPENDIX 3: NUMBER OF RED FLAGS TRIGGERED BY EACH CHINESE ISSUER 14 APPENDIX 4: CHINESE ISSUERS AND RED FLAGS TRIPPED FOR EACH 16 MOODY’S RELATED RESEARCH 24
Analyst Contacts:
HONG KONG 852.3551.3077
Elizabeth Allen 852.3758.1353 Vice President – Senior Credit Officer [email protected]
Gary Lau 852.3758.1377
Managing Director – Corporate Finance [email protected]
Clara Lau 852.3758.1333
Senior Vice President [email protected]
SYDNEY 612.9270.8100
Brian Cahill 612.9270.8105 Managing Director – Asia Pacific Corporate and Finance Institute [email protected]
Red Flags for Emerging-Market Companies: A Focus on China
Overview
Red flags as a screen. In rapidly developing emerging markets, the use of frameworks to assess elements of credit risk provides consistency in identifying relative strengths and weaknesses across a growing pool of rated issuers. In this report, we look at 20 red flags, grouped into five categories, that highlight issues meriting scrutiny to identify possible governance or accounting risks for non-financial corporate issuers in emerging markets. These categories are as follows: (1) possible weaknesses in corporate governance, (2) riskier or more opaque business models, (3) fast-growing-business strategies (4) poorer quality of earnings or cash flow, and (5) concerns over auditors and quality of financial statements.
Application of screen to China. In this inaugural report, we apply the framework to Chinese, non-financial rated companies that have recently received a great deal of attention from regulators and investors. We use the screen on 61 rated Chinese entities and outline the results by rating category, by industry segment, and by individual issuer.
Limited correlation in China between lower ratings and larger numbers of red flags. In China, property companies with lower ratings do not tend to have a greater number of red flags. However, a degree of correlation exists for non-property firms, where, on average, investment-grade issuers of Baa and above trip 6 red flags, while high-yield Ba issuers trip 7, B issuers trip 8, and Caa issuers 12. These findings show that screens for governance or accounting risks can help identify areas to investigate but cannot serve as mechanisms to rank order credit risk.
More red flags among Chinese non-property than property-related issuers. No property developer triggered more than 7 flags; whereas five non-property firms set off from 9 to 12. High-yield (HY) developers averaged 6 red flags versus 8 for HY non-property firms.
Framework an interesting screen. Our ratings already factor in the inherent challenges of analyzing young, fast growing Chinese companies with few peers, concentrated family ownership, and sometimes poor transparency. As an illustration, although we rate China’s sovereign credit at Aa3 with a positive outlook, 80% of rated companies with predominantly Chinese operations fall below investment grade. In fact, we rate 76% of non-financial HY issuers at Ba3 and below. The red flags provide further clarity and detail, but do not represent a change in our rating methodologies.

GLOBAL CORPORATE FINANCE
2 JULY 11, 2011
SPECIAL COMMENT: RED FLAGS FOR EMERGING-MARKET COMPANIES: A FOCUS ON CHINA
Focus on negative outliers. West China Cement (Ba3 stable) triggered 12 red flags, Winsway Coking Coal (Ba3 stable) had 11, China Lumena New Materials (B2 negative) set off 10, and Hidili Industry International (B1 stable) and LDK Solar (B1 stable) had 9 each. We examine the reasons for the relatively high number of red flags for these issuers.
Approach appropriate across emerging markets . We initially look only at mainly high-yield and a few investment-grade issuers in China, but the framework is also applicable to the rest of Asia and other developing markets.
Red Flags An Interesting Screen
In recent weeks, a variety of participants in the market, including the U.S. Securities and Exchange Commission (SEC), are looking into potential problems with the quality of financial reporting from publicly listed Chinese companies. To address investors’ concerns and provide transparency on our approach to ratings, this report identifies warning signs—so-called “red flags”—for our rated, high-yield (HY), non-financial Chinese companies.
The identified issues that we flag do not represent a change to our analytical approach. Our ratings already account for the inherent challenges in assessing these Chinese companies: their short history of operations, their diverse industries with limited peers for comparison, their concentrated family ownership structures, and their high-growth environments. As an illustration, although we rate China’s sovereign credit at Aa3 with a positive outlook, 80% of rated companies with predominantly Chinese operations fall below investment grade. In fact, we rate 76% of non-financial HY issuers at Ba3 and below. We use these flags as an interesting screen to identify potential areas of concern for follow up and closer scrutiny.
The methods we use and present here are applicable to all HY companies in developing markets , not just China. Although we summarize our findings for China, we plan to follow up soon with a report for other HY issuers in the Asian region. We will also include a sub-section on Chinese companies in our monthly publication and commentary, “Asian Liquidity Stress Index”.
Framework Focuses on Five Key Categories
We use 20 red flags, grouped into the following five categories:
1. Weaknesses in corporate governance
2.
: short track record of operations and listing history, murky shareholders’ background, large and frequent related-party transactions;
Riskier or more opaque business models
3.
: unusually high margins compared to peers, concentration of customers, complicated business structures;
Fast-growing-business strategies
4.
: very rapid expansion, big capital investments resulting in large negative free cash flow and intangible assets;
Poorer quality of earnings or cash flow: discrepancy between cash flows and accounting profits, disjointed relationship between growth in assets and revenues, large swings in working capital, insufficient tax paid compared to reported profits;

GLOBAL CORPORATE FINANCE
3 JULY 11, 2011
SPECIAL COMMENT: RED FLAGS FOR EMERGING-MARKET COMPANIES: A FOCUS ON CHINA
5. Concerns over auditors and quality of financial statements
Appendix 1 discusses each of these five categories, provides details on the red flags used in each, and shows the number of times by company type and rating category that Chinese non-financial issuers triggered each flag. Because of rapid growth, nearly all Chinese HY issuers tripped certain red flags related to aggressive business and financial strategies and quality of earnings. Moreover, because of the prevalence of strong founding families in these companies, many of them tripped the red flag for concentration of family ownership, a situation less common in developed markets. Other flags, which we deem important, such as those pertaining to auditors, surfaced much more infrequently.
: a switch in auditing firm or legal jurisdiction of auditor’s office, delay in reporting, or adverse comment from auditors.
The number of flags triggered acts as a first screen, with each flag receiving equal weighting. As we examine companies’ flags more closely, some may be of particular concern. For example a frequent change in auditors appears more serious than having swings in working capital or material negative free cash flow that the company’s stage of development can explain.
In addition to the five categories of red flags, we also monitor market indicators that may provide more timely alerts to impending difficulties for an issuer. Such indicators include a sharp drop in an issuer’s share price, the build-up of a large position of investors shorting the company’s stock, and an upward spike in the cost of buying credit-default swaps to insure against the company’s default.
We use the same set of qualitative red flags for property developers and for other corporate Chinese issuers but have made adjustments to three quantitative measures under quality of earnings for property developers to take account of their business model. Appendix 2 provides details on these adjustments.
Chinese issuers’ mainly HY ratings already reflect many of the risks highlighted by the red flags
Of 61 Chinese non-financial issuers, we rate 49 as high yield, and 29, or nearly half of the total group, are property developers. All of the developers, except three, have HY issuer ratings.
As shown below, we rate three quarters of the 49 high-yield Chinese issuers at Ba3 and below, a percentage in line with the broader Asian (ex Japan) portfolio. Ratings for Chinese property developers tend to rank lower than non-property firms in the country.
FIGURE 1
Breakdown of our rated HY non-financial corporate issuers by rating category
Rating category Chinese Non-Property Chinese Property All Chinese HY All HY in Emerging Market Asia
Ba 61% 42% 51% 50%
B 35% 58% 47% 44%
Caa 4% 0% 2% 6%
Total High Yield 100% 100% 100% 100%
Ba3 and below 65% 88% 78% 76%

GLOBAL CORPORATE FINANCE
4 JULY 11, 2011
SPECIAL COMMENT: RED FLAGS FOR EMERGING-MARKET COMPANIES: A FOCUS ON CHINA
Findings: Limited Correlation Between Red Flags and Ratings
Across the portfolio, we found only limited correlation between lower ratings and larger numbers of red flags. A lack of correlation characterized our 29 rated property developers – all except 1 tripped from 4 to 7 flags. However, a degree of correlation between number of red flags and rating category exists for the 23 non-property HY firms, where, on average, investment-grade issuers of Baa and above trip 6 red flags, while high-yield Ba issuers trip 7, B issuers trip 8, and Caa issuers 12.
FIGURE 2
No. of red flags tripped by rating category
Non-property issuers Property issuers
Rating Category No. of Issuer Average no. of red flags tripped No. of Issuer Average no. of red flags tripped
Investment Grade 9 5.9 3 4.0
Ba 14 7.0 11 5.2
B 8 7.9 15 6.3
Caa 1 12.0 0 0.0
High Yield - Total 23 7.5 26 5.8
Total China 32 7.1 29 5.7
As a group, the HY property firms had fewer red flags on average—at 5.8—versus 7.5 for the 23 HY non-property issuers. The business model of property firms partly explains the lower number because the broad, retail client base of developers ensures that almost all of these firms do not raise concerns over undue concentration of customers. Only one developer tripped this red flag. Other possible reasons for fewer red flags among developers include: (1) the high visibility of the industry in terms of land costs, project values, and number of construction sites; (2) the large number of issuers make peer comparisons easier for investors and lenders; and (3) rated firms tend to be the strongest among a huge number of developers in the country and their activities thus attract a good deal of public attention and scrutiny. Appendix 3 provides more detail on rated property and non-property Chinese companies and numbers of red-flags tripped by each, while Appendix 4 names, in similar groupings, the companies that set off each form of red flag.
Negative Outliers Attract Greater Scrutiny
The framework shows the following five companies as having the highest number of red flags in the portfolio: West China Cement (Ba3 stable) with 12, Winsway Coking Coal (Ba3 stable) with 11, China Lumena New Materials (B2 negative) with 10, and Hidili Industry International (B1 stable) and LDK Solar (B1 stable) with 9 each. Three of these firms, Winsway, Lumena, and Hidili, mine coal or other minerals, which tend to attract scrutiny because it is often hard to value these assets and reserves in terms of size, value, or ownership rights. One property developer, Longfor Properties (Ba2 stable), had 7 red flags, the highest in the property group for the level of its rating.
An issuer’s tripping of many red flags does not represent an immediate rating concern because our ratings already reflect many of the issues highlighted by the relevant red flags, and the ratings also incorporate more than just the potential concerns that the flags capture. Moreover, as indicated, there is only limited correlation between lower ratings and a higher number of red flags tripped. Nevertheless, we provide some comments below on the red flags tripped by the negative outliers, and what risks these flags are highlighting.

GLOBAL CORPORATE FINANCE
5 JULY 11, 2011
SPECIAL COMMENT: RED FLAGS FOR EMERGING-MARKET COMPANIES: A FOCUS ON CHINA
West China Cement (Ba stable) – 12 red flags
As the second largest producer of cement in China’s province of Shaanxi, West China Cement (WCC) has a risk profile that triggered the most red flags of our Chinese issuers. Two key individuals, WCC’s chairman and his daughter, dominate the company with 44% of its stock; the firm’s auditors have changed twice; and WCC has had inadequate compliance with International Financial Reporting Standards (IFRS) and insufficient policies for internal control and procedures before its listing in Hong Kong in August 2010.
In previous years, WCC’s accounting-control systems had struggled to keep up with growth in the business. In response to this weaknesses, WCC implemented remedial actions and had two follow-up and favorable reviews by an independent advisor on internal controls before listing on Hong Kong’s stock exchange. WCC subsequently retained the independent advisor to review its internal controls for the current year. A year before listing, WCC had changed from a small U.K.-based accountancy to PwC, a big-four firm. It then changed to Deloitte, another big-four firm, after only two years, to take advantage of lower fees.
In 2011, a change in chief executive officer (CEO) and chief financial officer (CFO) occurred, but we view the CEO’s change as positive because it split the role of chairman and CEO, while the CFO remains as an executive director of the company’s board.
WCC explains its high profitability, with EBITDA margins over 40%, as resulting from a favorable geographic location that poses barriers to competitors’ entry in servicing nearby infrastructure projects of China’s Western Development Plan. In general, the cement business is transparent in pricing and market shares, which investors can verify at public domains such as Digital Cement (http://www.dcement.com). WCC conducts a lot of business on a cash-upfront basis with its customers and, thus, shows a low level of trade receivables.
Winsway Coking Coal (Ba3 stable) – 11 red flags
Our ratings for Winsway, a coking-coal logistics business, take into account the company’s short track record and plan for rapid expansion. By quintupling its procurement of Mongolian coal from 1.3 million tons (MT) in 2008 to 6.5MT in 2010, the company triggered several red flags in its build-out of needed infrastructure, which put pressure on working capital and resulted in negative free cash flow, along with a fast rise in revenue.
The ratings also reflect a red flag for related-party transactions because the company’s chairman has both majority ownership of Winsway and external, commodities-trading businesses, which facilitated the debut and growth of Winsway’s operations. Nevertheless, reported related-party transactions have been immaterial, and the chairman has a non-compete agreement with Winsway.
China Lumena New Materials (B2 negative) – 10 red flags
Lumena, a miner of thenardite, triggered red flags for its rapid growth, short listing history, high concentration of customers and ownership, and poorer quality of earnings and cash flow. The firm more than quintupled its revenue in three years and enjoyed strong operating profits, which we attribute to Lumena’s high-grade thenardite reserves, the company’s status as the only commercial-scale, specialty-thenardite producer, and its exclusive license in China to produce a valued commodity, medical thenardite.

GLOBAL CORPORATE FINANCE
6 JULY 11, 2011
SPECIAL COMMENT: RED FLAGS FOR EMERGING-MARKET COMPANIES: A FOCUS ON CHINA
However, in the last four years, Lumena has incurred much larger capital expenditure than operating cash flow, and in the past year, growth in cash flows has lagged earnings due to a material worsening in collections of trade receivables. In particular, Lumena has granted longer credit terms to its customers of specialty thenardite and medical thenardite. So far, the company has not considered provisioning for accounts receivable aged under one year based on its previous experience with these customers. Nevertheless, we are monitoring the quality of Lumena’s cash flow, which we view as one of the major drivers for the firm’s rating. Moreover, Lumena’s chairman has a 40% stake in the company, and our rating also accounts for a need for greater transparency and consistency in the firm’s long-term strategy.
Hidili Industry International (B1 stable) - 9 red flags
Our assessment of Hidili already factors in the company’s appetite for expansion, concentration of customers, and slow accounts-receivable cycle and inventory turnover—all of which pop up as red flags. Hidili has grown into its current size by aggressively acquiring small coal mines and then consolidating them. Most of the acquired mines are still under applications for legal title from Chinese local governments. This lack of governmental approval creates a degree of legal uncertainty over the value of such assets. In addition, only slightly more than half of the coal reserves were assessed according to the international standards code set by the Australasian Joint Ore Reserves Committee, with the rest assessed by Chinese standards.
The following factors mitigate other potential concerns: (1) the company’s revenues involve few related-party transactions, (2) market information for coking-coal prices is transparent, (3) Hidili’s customers are less concentrated than a year ago, and (4) Hidili’s major clients are mainly large steel plants in China.
LDK Solar (B1 stable) – 9 red flags
The high number of red flags for solar-panel-wafer manufacturer, LDK Solar, reflects the past few years’ volatility in the solar-power industry’s prices for polysilicon raw materials and profitability. Polysilicon prices dropped nearly 90%, from more than US$450 per ton in 2Q08 to about US$50 per ton in 2009 during the global financial crisis but rebounded in 2010. This whipsaw in a key input’s cost affected LDK’s revenue growth, inventory days, and bargaining power with customers which in turn affected profitability, cash flow, and days for accounts receivable.
In 2010, LDK’s rapid growth in revenues and assets stemmed from fast expansion in capacity to capitalize on improved market conditions. In addition, LDK’s short history mirrors the solar industry’s robust growth over the last few years from a low base. We consider LDK’s volatility as being in line with the industry’s recent trends and, thus, not a cause for concern. Although a single individual has a nearly 50% stake in the company, the level of related-party transactions between LDK and the shareholder’s other firms have remained limited.
Longfor (Ba2 stable) – 7 red flags
Longfor has the highest rating at Ba2 among property developers with the most red flags—7, slightly above the property group’s Ba-average of 5. The red flags hit are: 1) aggressive growth, 2) short listing history, 3) ownership concentration, 4) change in CFO, 5) Large negative free cash flow, 6) sales generation on capital employed, and 7) low tax payment. Longfor’s fast growth is in line with the overall sector and similar to that of peers such as Agile, Country Garden, and Shimao. Like other developers, Longfor has a short listing history and concentrated ownership. Longfor’s large negative

GLOBAL CORPORATE FINANCE
7 JULY 11, 2011
SPECIAL COMMENT: RED FLAGS FOR EMERGING-MARKET COMPANIES: A FOCUS ON CHINA
free cash flow is also a common characteristic of rapidly growing Chinese developers trying to gain market share in a fragmented industry. In the past year, Longfor changed its CFO once in what we view as a normal reshuffle of personnel. The company’s chairman and CEO is the largest shareholder within the group.
Longfor’s ability to generate sales is low compared to peers due to its having a larger-than-average share of its portfolio in investment properties, which lock up more capital than properties for development and sale. Longfor’s tax paid was also low relative to its accounting profit and taxes paid by many of its peers. This characteristic reflects Longfor’s relatively low cost for land and larger portfolio of investment properties. Low land cost led to higher profitability, but such profit was subject to China’s land appreciation tax, part of which is deferrable. At the same time, Longfor’s investment properties have reported revaluation gains, which are taxable but non-payable.

GLOBAL CORPORATE FINANCE
8 JULY 11, 2011
SPECIAL COMMENT: RED FLAGS FOR EMERGING-MARKET COMPANIES: A FOCUS ON CHINA
Appendix 1: Five Categories of Warning Signs
1. Weaknesses in Corporate Governance
Issue: Weak corporate governance may lead to decision-making processes that favor the interests of some or all shareholders at the expense of bondholders and other creditors. It is difficult to determine the effectiveness of a company’s corporate governance when the firm has a limited operating record and short listing history as a public company. The predominantly family-controlled nature of Chinese HY companies makes a clear view of its governance practices even more problematic. Such firms may not yet have established a track record for investors to make informed judgments about managerial behavior.
The existence and extent of related businesses are also hard to ascertain, and if they exist, raise concerns over potential diversion of funds. Moreover, the companies’ management may report related-party transactions as arms-length, which obscures their transparency when the related party’s identity remains undisclosed.
The table below shows the red flags that fall into this category and the number of times, by company type and rating category, that Chinese non-financial issuers triggered the flags:
FIGURE 3
Number of Red Flags Tripped – Corporate Governance
Non-Property HY Issuers Property HY Issuers
Rating Category / (No. of Issuers) Ba (14) B (8) Caa (1) Total Ba (11) B (15) Total
1 Short track record: Under 7 years of operating history 1 1 1 3 0 0 0
2 Short listing history: Under 3 years or private 3 4 1 8 3 7 10
3 Concentration of family ownership: Major shareholding family control >30% stake
10 7 1 18 11 14 25
4 Change of senior management: Change of CEO/CFO 2 0 1 3 3 7 10
5 Significant related-party transactions 1 1 0 2 0 1 1
a) >10% of sales or 10% of cost of goods sold, or 1 1 0 2 0 1 1
b) Receivables due > 10% of total assets 0 0 0 0 0 0 0
6 Major shareholder's private business: Existence of material business outside of issuer
4 3 0 7 3 3 6
Note: Tests applied to last 3 years, unless specified
Our Approach: We factor an issuer’s corporate governance into both our initially assigned ratings and our ongoing monitoring process. In addition to the points noted above, we use a qualitative approach based on discussions with the company’s management as well as an understanding of internal corporate controls and risk appetite. We also look at the degree of ongoing disclosure that the company provides—both to the public and to us.
We note that listing requirements mean most, if not all, listed companies, meet certain international standards of best practice such as having a board with at least some independent directors who comprise and chair an audit committee. It is difficult to determine the true independence of board members and their influence over the company but more straightforward to evaluate the directors’ credentials to ensure that they are financially literate and versed in the business.

GLOBAL CORPORATE FINANCE
9 JULY 11, 2011
SPECIAL COMMENT: RED FLAGS FOR EMERGING-MARKET COMPANIES: A FOCUS ON CHINA
2. Riskier or More Opaque Business Model
Issue: We look for business models that have unusual or possibly risky characteristics. Certain industries are harder to analyze or value due to a low level of market transparency or a lack of standardized valuation techniques.
Relative to its peers, a company may have abnormally high margins that the structure of its industry may not adequately explain. The company’s revenue may also come from only a few customers, making it prone to sudden shortfalls if it loses an account or leaving it susceptible to undue influence from its key clients. Moreover, the information about these major customers could be limited and raise concerns about hidden arrangements. The company may also have a complicated business structure – particularly if involving non-consolidated joint ventures - that makes difficult the verification of sources and uses of its funds, as well as valuation of assets on its balance sheet.
The table below shows the red flags that fall into this category and the number of times, by company type and rating category, that Chinese non-financial issuers triggered the flags:
FIGURE 4
Number of Red Flags Tripped – Business Model Non Property HY Issuers Property HY Issuers
Rating Category / (No. of Issuers) Ba (14) B (8) Caa (1) Total Ba (11) B (15) Total
7 Extraordinary high profit margin: Reported EBITDA margin >40%
4 3 1 8 4 7 11
8 High customer concentration: Top 5 customers > 30% of revenue
4 5 1 10 1 0 1
9 Complicated group structure : 2 2 0 4 1 2 3
a) Investment in JV/Associate to Total Assets, 0 0 0 0 0 0 0
b) Dividends from JV/Associate/ (FFO + dividends from JV/Associate) , or
2 0 0 2 1 0 1
c) Share of profit from JV/Asso to net profit > 30% 1 2 0 3 1 2 3
Note: Tests applied to last 3 years, unless specified
Our Approach: As a screen, we look at companies with an EBITDA margin greater than 40%. Since a company’s business model and competitive positioning may justify such high margins, we then assess the margins’ veracity and sustainability by looking at rated or unrated peers. We also evaluate the relationship with, and performance of, group companies such as joint ventures and associated companies whose financial results the firm does not consolidate due to a lack of controlling stakes.
3. Fast-Growing-Business Strategies
Issue: Companies in rapidly growing emerging markets like China often have ambitious plans for expansion, which result in aggressive financial and operational strategies. A fast-growing company faces challenges such as stretched managerial attention and over-extended infrastructure, systems, and financial resources.
Moreover, such firms make big capital investments unsupported by cash flows from operations, which result in large, negative free cash flow (FCF), funded by debt or equity. These companies may face funding challenges if market participants suddenly lose confidence in them. Such a crisis of confidence
GLOBAL CORPORATE FINANCE
10 JULY 11, 2011
SPECIAL COMMENT: RED FLAGS FOR EMERGING-MARKET COMPANIES: A FOCUS ON CHINA
can lead to shortfalls in balance-sheet liquidity, to a longer-term inability to execute the company’s business strategy, or to both.
If the firms also make large acquisitions, the purchases result in a high percentage of intangible assets from acquired goodwill—the difference between purchase price and book value. Companies might also adjust their financial results via such accounting because they can assign values to purchased assets and liabilities. The value of intangibles for a company that has grown quickly via acquisitions or mergers may also no longer be accurate over time and could result in an over-statement of the company’s true worth and profitability.
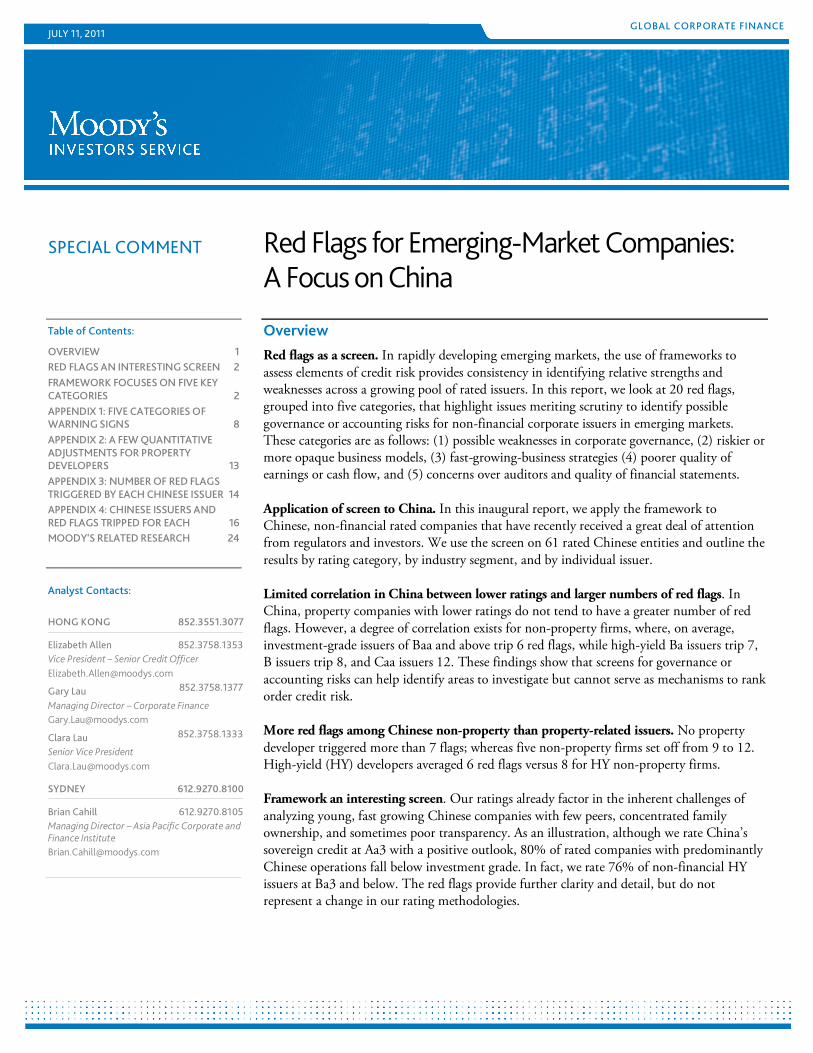
The table below shows the red flags that fall into this category and the number of times, by company type and rating category, that Chinese non-financial issuers triggered the flags:
FIGURE 5
Number of Red Flags Tripped – Growth Strategy
Non Property HY Issuers Property HY Issuers
Rating Category / (No. of Issuers) Ba (14) B (8) Caa (1) Total Ba (11) B (15) Total
10 Aggressive growth 9 7 1 17 11 13 24
a) Total assets double over 3 years 7 7 1 15 9 10 19
b) Revenue double over 3 years 9 6 1 16 9 7 16
11 Large negative FCF: Negative FCF > 50% of OCF 11 6 0 17 11 15 26
12 Large proportion of intangible assets: Intangibles/total assets > 25%
0 0 0 0 0 0 0
Note: Tests applied to last 3 years, unless specified
Our Approach: We classify a company as having a fast-growing-business strategy when it doubles its revenue or asset base in three years. A pattern of past growth offers insight into management’s future risk appetite. As a company expands via acquisition, it incurs large expenses. We also look at companies with negative free cash flow greater than 50% of operating cash flow as well as serial acquirers of subsidiaries and flag firms when the stated value of intangibles represent more than 25% of total assets. These factors are common among Chinese corporate issuers, and have historically been a key reason for our assignment of high-yield rather than investment-grade ratings.
4. Poorer Quality of Earnings or Cash Flow
Issue: In assessing a company’s strategy for growth, it is useful to look at relevant financial statements to determine whether the generation of cash flow matches reported profits. The generation of cash flow, not accounting profit, is crucial for repaying debt and funding future growth. Moreover, as large sums frequently go into capital expenditure (capex) and investment, these are other areas to look at to see whether such investments are generating cash flows. Although generation of cash flows may lag investments and result in a prolonged period of imbalance, such a situation may also suggest a deterioration of asset quality, a weakened ability to generate cash flow, or diversion of funds from revenue-generating assets.
The two tables below show the red flags that fall into this category and the number of times, by company type and rating category, that Chinese non-financial issuers triggered the flags:

GLOBAL CORPORATE FINANCE
11 JULY 11, 2011
SPECIAL COMMENT: RED FLAGS FOR EMERGING-MARKET COMPANIES: A FOCUS ON CHINA
FIGURE 6
Number of Red Flags Tripped - Quality of Earnings & Cashflows Non Property HY Issuers
Rating Category / (No. of Issuers) Ba (14) B (8) Caa (1) Total
13 Quality of cash flow generation 13 7 1 21
a) OCF/ net income <1 12 6 1 19
b) OCF before interest & tax / EBITDA <1 10 6 0 16
14 Deviation in working capital 13 8 0 21
a) Change in accounts receivable days > 20% 10 8 0 18
b) Change in accounts payable days > 20% 9 7 0 16
c) Change in inventory days >20% 11 8 0 19
15 Low tax paid relative to accounting profit: Tax paid in cash/profit before tax <10%
9 2 1 12
16 Inadequate revenue generation from assets: Change of PPE/Revenue ratio > 20% from prior year
9 6 1 16
Note: Tests applied to last 3 years, unless specified
FIGURE 7
Number Of Red Flags Tripped - Quality Of Earnings & Cashflows Chinese HY Property Issuers
Rating Category / (No. of Issuers) Ba (11) B (15) Total (26)
13 Quality of cash flow generation: (Cash + Restricted cash + Land – Increase in total debt) / [(Advance from customers Yr2 - Yr1) + Sales Yr2] < 25%
2 5 7
14 Sales generation on capital employed: Sales / Total assets < 15% 4 8 12
15 Sales completion ability: Book sales Yr2 / Contracted sales Yr1 < 70% 0 6 6
16 Low tax paid relative to accounting profit: Tax paid in cash/profit before tax <10%
2 4 6
Note: Tests applied to last 3 years, unless specified
Our Approach: We look at the relationship between operating cash flow (OCF) and accounting profits, with OCF measured after deducting requirements for working capital, the fluctuation of which could affect generation of OCF. The discrepancy between cash flows and accounting profits may warrant further scrutiny. Generally, OCF should be much higher than net income, which includes depreciation and amortization; whereas OCF does not. Moreover, a firm’s OCF before interest and tax as a percentage of EBITDA should be fairly consistent, unless a business is growing rapidly, as are most issuers in China.
A growing company also needs to fund its rising need for working capital, which weakens OCF. Since a few Chinese issuers reported negative OCF, we look at individual deviations in working-capital cycles, including accounts receivable, accounts payable, and inventory days. Sometimes, the evolution of the company’s business model explains the deviation, but we still need to understand the factors behind it.
GLOBAL CORPORATE FINANCE
12 JULY 11, 2011
SPECIAL COMMENT: RED FLAGS FOR EMERGING-MARKET COMPANIES: A FOCUS ON CHINA
We also look at tax paid in cash to see if accounting profits match those reported for tax purposes. For example, we investigate if a company reports large accounting profits but does not pay tax. Sometimes, however, material tax holidays or other waivers explain the discrepancy.
In addition we look at the relationship between the company’s revenue and the value of its plant, property and machinery (PPE). As a company spends to expand, we want to be sure that amounts reported as capex go into productive assets and that capex is, indeed, capex and not operating expenditure (opex). As shown ten years ago by fraud uncovered at Worldcom, the reporting of opex as capex is one of the most difficult sleights of hand to spot, yet one of the easiest ways for dishonest managers to fraudulently dress up reported financial numbers.
Please refer to Appendix 2 for a discussion on adjustments that we make in the quantitative metrics for property developers.
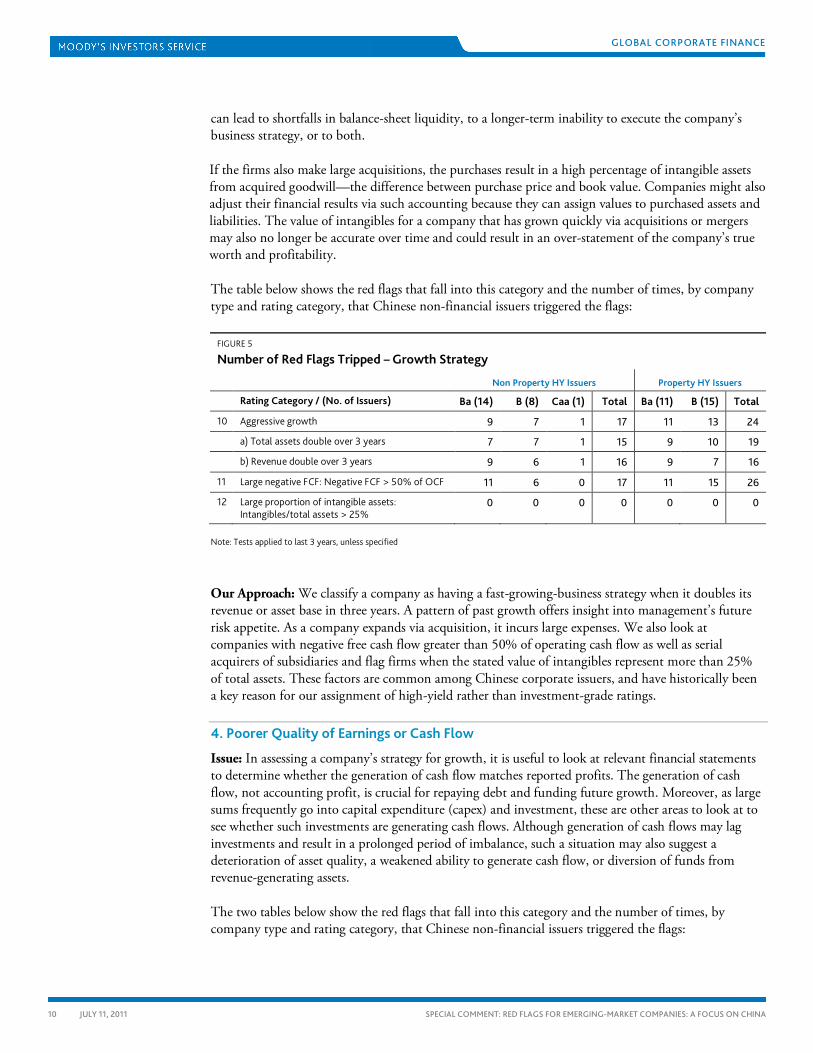
5. Concerns over Auditors
Issue: A company’s change of auditor is often an important red flag as it may indicate concerns with the accuracy of the company’s accounts or other possible problems. A firm that relies on an auditor lacking a physical presence in China or Hong Kong raises concern as to whether the auditor has sufficient understanding of local market practices and has sufficient resources to do an effective audit. More obvious potential shortcomings include delays in financial reporting and accounts qualified by auditors.
The table below shows the red flags that fall into this category and the number of times, by company type and rating category, that Chinese non-financial issuers triggered the flags:
FIGURE 8
Number Of Red Flags Tripped – Concerns Over Auditors/Financial Statements
Non Property HY Issuers Property HY Issuers
Rating Category / (No. of Issuers) Ba (14) B (8) Caa (1) Total Ba (11) B (15) Total
17 Change in auditors 1 0 0 1 0 3 3
18 Signing auditor located in a different country to key business operations
2 1 0 3 1 0 1
19 Delay in result announcement or filing audited statements in past 3 years
0 0 1 1 0 0 0
20 Qualified accounts (incl. internal control weakness)
0 0 1 1 0 0 0
Note: Tests applied to last 3 years, unless specified
Our Approach: During the past three financial years, we note any changes in auditors and the location of the auditor’s offices. We also examine any delays in reporting of results or filing of audited statements, and any adverse opinions from the auditors. However, by the time such delays or opinions surface, as in the case of China Forestry (Caa2 negative), problems at the company may have already escalated to a serious stage.

GLOBAL CORPORATE FINANCE
13 JULY 11, 2011
SPECIAL COMMENT: RED FLAGS FOR EMERGING-MARKET COMPANIES: A FOCUS ON CHINA
Appendix 2: A Few Quantitative Adjustments for Property Developers
Although we use the same qualitative red flags for property developers and for other corporate Chinese issuers, we have adjusted three quantitative measures, grouped under quality of earnings for developers, to take account of their business model.
China’s property developers may sell their product before completion of construction, which results in a material time gap between their recognition of revenues upon the properties’ delivery and cash generation from pre-sales that constitute developers’ main cash inflow. We look at developers’ ability to collect cash from pre-sales and deliver the pre-sold properties within a reasonable timeframe.
Moreover, developers’ use of working-capital and operating activities for certain long-term investments such as payments for land for later development makes operating cash flow from accounting statements an unreliable measure of cash-flow generation. Thus, we use these three factors to measure quality of earnings:
1. [Cash holding + land payments – increase/(decrease) in borrowings]/[Change in advance from customers between Y2 and Y1 + sales revenues for Y2].
2.
Since pre-sales are neither audited nor reported in the financial statements, we use the denominator as a proxy for cash or contracted property sales for year two (Y2). This ratio tests developers’ abilities to collect cash by measuring whether the cash holding (after stripping out investment activities such as payment for land and cash flow from financing activities) is consistent with the companies’ cash-based or contracted sales figures.
Sales/Total assets
3.
: This ratio compares developers’ ability to generate sales versus their assets. Any material difference from the industry norm would merit more scrutiny.
Accounting revenues for Y2/Contract sales for Y1
: This ratio compares developers’ ability in turning contracted sales into accounting revenues within a certain timeframe. Any material difference from the industry norm would call for further examination.
GLOBAL CORPORATE FINANCE
14 JULY 11, 2011
SPECIAL COMMENT: RED FLAGS FOR EMERGING-MARKET COMPANIES: A FOCUS ON CHINA
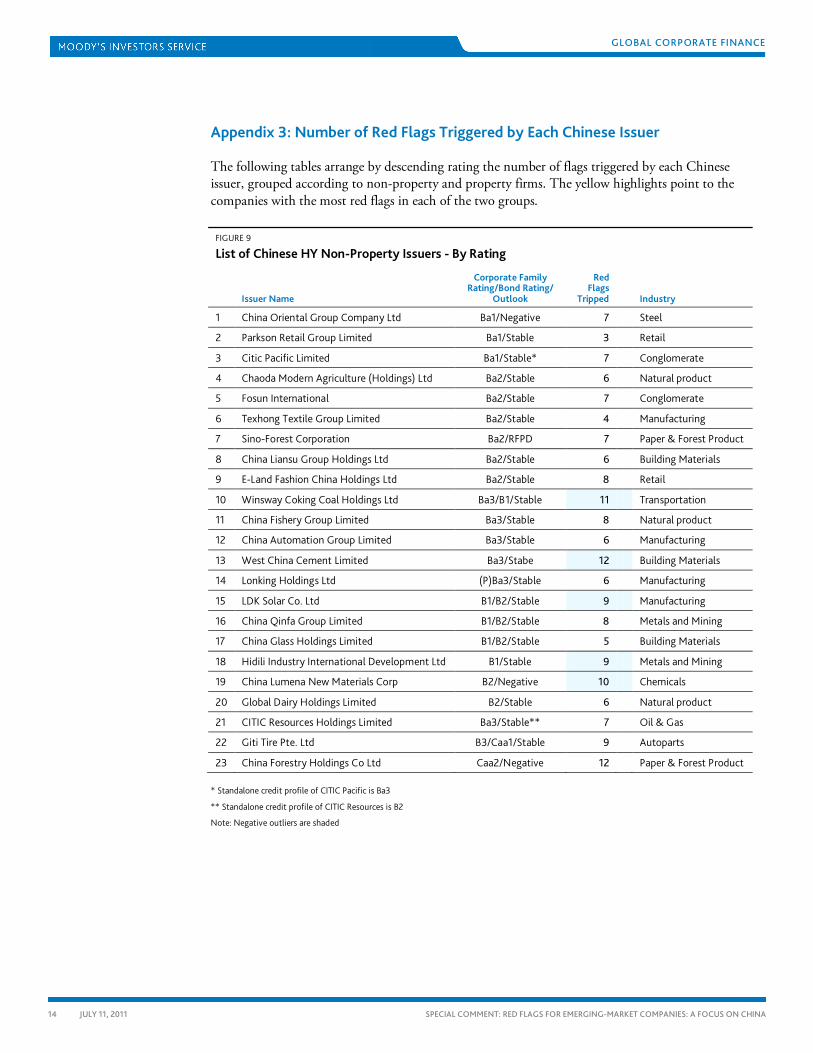
Appendix 3: Number of Red Flags Triggered by Each Chinese Issuer
The following tables arrange by descending rating the number of flags triggered by each Chinese issuer, grouped according to non-property and property firms. The yellow highlights point to the companies with the most red flags in each of the two groups.
FIGURE 9
List of Chinese HY Non-Property Issuers - By Rating
Issuer Name
Corporate Family Rating/Bond Rating/
Outlook
Red Flags
Tripped Industry
1 China Oriental Group Company Ltd Ba1/Negative 7 Steel
2 Parkson Retail Group Limited Ba1/Stable 3 Retail
3 Citic Pacific Limited Ba1/Stable* 7 Conglomerate
4 Chaoda Modern Agriculture (Holdings) Ltd Ba2/Stable 6 Natural product
5 Fosun International Ba2/Stable 7 Conglomerate
6 Texhong Textile Group Limited Ba2/Stable 4 Manufacturing
7 Sino-Forest Corporation Ba2/RFPD 7 Paper & Forest Product
8 China Liansu Group Holdings Ltd Ba2/Stable 6 Building Materials
9 E-Land Fashion China Holdings Ltd Ba2/Stable 8 Retail
10 Winsway Coking Coal Holdings Ltd Ba3/B1/Stable 11 Transportation
11 China Fishery Group Limited Ba3/Stable 8 Natural product
12 China Automation Group Limited Ba3/Stable 6 Manufacturing
13 West China Cement Limited Ba3/Stabe 12 Building Materials
14 Lonking Holdings Ltd (P)Ba3/Stable 6 Manufacturing
15 LDK Solar Co. Ltd B1/B2/Stable 9 Manufacturing
16 China Qinfa Group Limited B1/B2/Stable 8 Metals and Mining
17 China Glass Holdings Limited B1/B2/Stable 5 Building Materials
18 Hidili Industry International Development Ltd B1/Stable 9 Metals and Mining
19 China Lumena New Materials Corp B2/Negative 10 Chemicals
20 Global Dairy Holdings Limited B2/Stable 6 Natural product
21 CITIC Resources Holdings Limited Ba3/Stable** 7 Oil & Gas
22 Giti Tire Pte. Ltd B3/Caa1/Stable 9 Autoparts
23 China Forestry Holdings Co Ltd Caa2/Negative 12 Paper & Forest Product
* Standalone credit profile of CITIC Pacific is Ba3
** Standalone credit profile of CITIC Resources is B2
Note: Negative outliers are shaded

GLOBAL CORPORATE FINANCE
15 JULY 11, 2011
SPECIAL COMMENT: RED FLAGS FOR EMERGING-MARKET COMPANIES: A FOCUS ON CHINA
FIGURE 10
List of Chinese HY Property Issuers - By Rating
Issuer Name Corporate Family Rating/
Bond Rating/ Outlook Red Flags Tripped
1 Longfor Properties Co. Ltd. Ba2/Ba3/Stable 7
2 Agile Property Holdings Limited Ba2/Stable 6
3 Yanlord Land Group Limited Ba2/Stable 5
4 Powerlong Real Estate Holdings Limited Ba3/B1/Negative 6
5 KWG Property Holding Ltd Ba3/B1/Stable 4
6 SPG Land (Holdings) Ltd Ba3/B1/Stable 5
7 Central China Properties Ba3/B1/Stable 4
8 Renhe Commercial Holdings Ltd Ba3/Stable 7
9 Country Garden Holdings Company Limited Ba3/Stable 4
10 Road King Infrastructure Limited Ba3/Stable 4
11 Shimao Property Holdings Limited Ba3/Stable 5
12 Fantasia Holdings Group Ltd B1/B2/Stable 4
13 Evergrande Real Estate Group Ltd B1/B2/Negative 7
14 Kaisa Group Holdings Ltd B1/B2/Negative 7
15 Zhong An Real Estate Limited B1/Stable 6
16 Hopson Development Holdings Limited B1/B2/Stable 7
17 Yuzhou Properties Company Limited B1/B2/Stable 7
18 China South City Holdings Limited B1/B2/RFD 7
19 China SCE Property Holdings Ltd B1/B2/Positive 7
20 Lai Fung Holdings Limited B1/Stable 5
21 Glorious Property Holdings Ltd B2/B3/Stable 7
22 Shanghai Industrial Urban Development Group Limited B2/RFU 7
23 Greentown China Holdings Limited B3/Caa1/Negative 7
24 Shanghai Zendai Property Limited B3/Caa1/RFD 7
25 SRE Group Limited B3/Caa1/Stable 7
26 Coastal Greenland Limited B3/Caa1/Stable 3
Note: Negative outliers are shaded

GLOBAL CORPORATE FINANCE
16 JULY 11, 2011
SPECIAL COMMENT: RED FLAGS FOR EMERGING-MARKET COMPANIES: A FOCUS ON CHINA
Appendix 4: Chinese Issuers and Red Flags Tripped for Each
The following two sets of tables summarize the extent to which HY non-property and property issuers in China triggered particular red-flag categories. The first set covers our 23 HY non-property firms; the second does the same for our 26 HY property developers.
FIGURE 11
Red Flags for Chinese HY Non-Property Issuers (1)
China Oriental
Parkson Retail
CITIC Pacific Chaoda Fosun
Texhong Textile
Sino-Forest
Rating Ba1 Ba1 Ba1 Ba2 Ba2 Ba2 Ba2
Outlook Negative Stable Stable Stable Stable Stable RFPD
Number of Red Flags Tripped 7 3 7 6 7 4 7
Corporate Governance
1 Short track record: Under 7 years of operating history
2 Short listing history: Under 3 years or private
3 Concentration of family ownership: Major shareholding family control >30% stake
x x x x
4 Change of senior management: Change of CEO/CFO x
5 Significant related party transactions: > 10% of sales, cost of goods sold; or receivables > 10% of total assets
x
6 Major shareholder's private business: Existence of material business outside of issuer
x
Business Model
7 Extraordinary high profit margin: Reported EBITDA margin >40% x x
8 High customer concentration: Top 5 customers > 30% of revenue x
9 Complicated group structure : Investment in JV/asso to total assets > 30%, Dividends from JV/asso/(FFO + dividends from JV/Asso), or Share of profit from JV/asso to net profit > 30%
x x
Growth Strategy
10 Aggressive growth: Total asset or revenue doubled over 3 years x x
11 Large negative Free Cash Flow: Negative FCF > 50% of OCF x x x x
12 Large proportion of intangible assets: Intangibles/total assets > 25%
Quality of Earnings & Cashflows
13 Quality of cash flow generation: OCF/net income or OCF before interest & tax/EBITDA < 1
x x x x x x
14 Deviation in working capital: Year-on-year change in accounts receivable days, accounts payable days , or inventory days > 20%
x x x x x x
15 Low tax paid relative to accounting profit: Tax paid in cash/profit before tax <10%
x x x x x x
16 Inadequate revenue generation from assets: Change of PPE/Revenue ratio > 20% from prior year
x x x x
Concerns over Auditors/Financial Statements
17 Change in auditors
18 Signing auditor located in a different country to key business operations
x
19 Delay in result announcement or filing audited statements in past 3 years
20 Qualified accounts (incl. internal control weakness)
Note: Tests generally applied to last 3 years

GLOBAL CORPORATE FINANCE
17 JULY 11, 2011
SPECIAL COMMENT: RED FLAGS FOR EMERGING-MARKET COMPANIES: A FOCUS ON CHINA
FIGURE 12
Red Flags for Chinese HY Non-Property Issuers (2)
China Liansu
E-Land Fashion Winsway
China Fishery
China Automatio
n
West China
Cement Lonking
Rating Ba2 Ba2 Ba3 Ba3 Ba3 Ba3 (P)Ba3
Outlook Stable Stable Stable Stable Stable Stable Stable
Number of Red Flags Tripped 6 8 11 8 6 12 6
Corporate Governance
1 Short track record: Under 7 years of operating history x
2 Short listing history: Under 3 years or private x x x
3 Concentration of family ownership: Major shareholding family control >30% stake
x x x x x x
4 Change of senior management: Change of CEO/CFO x
5 Significant related party transactions: > 10% of sales, cost of goods sold; or receivables > 10% of total assets
6 Major shareholder's private business: Existence of material business outside of issuer
x x x
Business Model
7 Extraordinary high profit margin: Reported EBITDA margin >40%
x x
8 High customer concentration: Top 5 customers > 30% of revenue
x x x
9 Complicated group structure: Investment in JV/asso to total assets > 30%, Dividends from JV/asso/(FFO + dividends from JV/Asso), or Share of profit from JV/asso to net profit > 30%
Growth Strategy
10 Aggressive growth: Total asset or revenue doubled over 3 years x x x x x x x
11 Large negative Free Cash Flow: Negative FCF > 50% of OCF x x x x x x x
12 Large proportion of intangible assets: Intangibles/total assets > 25%
Quality of Earnings & Cashflows
13 Quality of cash flow generation: OCF/net income or OCF before interest & tax/EBITDA < 1
x x x x x x x
14 Deviation in working capital: Year-on-year change in accounts receivable days, accounts payable days , or inventory days > 20%
x x x x x x x
15 Low tax paid relative to accounting profit: Tax paid in cash/profit before tax <10%
x x x
16 Inadequate revenue generation from assets: Change of PPE/Revenue ratio > 20% from prior year
x x x x x
Concerns over Auditors/Financial Statements
17 Change in auditors x
18 Signing auditor located in a different country to key business operations
x
19 Delay in result announcement or filing audited statements in past 3 years
20 Qualified accounts (incl. internal control weakness)
Note: Tests generally applied to last 3 years

GLOBAL CORPORATE FINANCE
18 JULY 11, 2011
SPECIAL COMMENT: RED FLAGS FOR EMERGING-MARKET COMPANIES: A FOCUS ON CHINA
FIGURE 13
Red Flags for Chinese HY Non-Property Issuers (3)
LDK Solar
China Qinfa
China Glass Hidili
China Lumena
Global Dairy
CITIC Resources
Rating B1 B1 B1 B1 B2 B2 Ba3
Outlook Stable Stable Stable Stable Negative Stable Stable
Number of Red Flags Tripped 9 8 5 9 10 6 7
Corporate Governance
1 Short track record: Under 7 years of operating history x
2 Short listing history: Under 3 years or private x x x
3 Concentration of family ownership: Major shareholding family control >30% stake
x x x x x x
4 Change of senior management: Change of CEO/CFO
5 Significant related party transactions: > 10% of sales, cost of goods sold; or receivables > 10% of total assets
x
6 Major shareholder's private business: Existence of material business outside of issuer
x x
Business Model
7 Extraordinary high profit margin: Reported EBITDA margin >40% x x x
8 High customer concentration: Top 5 customers > 30% of revenue x x x x x
9 Complicated group structure: Investment in JV/asso to total assets > 30%, Dividends from JV/asso/(FFO + dividends from JV/Asso), or Share of profit from JV/asso to net profit > 30%
x
Growth Strategy
10 Aggressive growth: Total asset or revenue doubled over 3 years x x x x x x x
11 Large negative Free Cash Flow: Negative FCF > 50% of OCF x x x x x
12 Large proportion of intangible assets: Intangibles/total assets > 25%
Quality of Earnings & Cashflows
13 Quality of cash flow generation: OCF/net income or OCF before interest & tax/EBITDA < 1
x x x x x x
14 Deviation in working capital: Year-on-year change in accounts receivable days, accounts payable days, or inventory days > 20%
x x x x x x x
15 Low tax paid relative to accounting profit: Tax paid in cash/profit before tax <10%
x x
16 Inadequate revenue generation from assets: Change of PPE/Revenue ratio > 20% from prior year
x x x x x
Concerns over Auditors/Financial Statements
17 Change in auditors
18 Signing auditor located in a different country to key business operations
19 Delay in result announcement or filing audited statements in past 3 years
20 Qualified accounts (incl. internal control weakness)
Note: Tests generally applied to last 3 years

GLOBAL CORPORATE FINANCE
19 JULY 11, 2011
SPECIAL COMMENT: RED FLAGS FOR EMERGING-MARKET COMPANIES: A FOCUS ON CHINA
FIGURE 14
Red Flags for Chinese HY Non-Property Issuers (4) Giti Tire China Forestry
Rating B3 Caa2
Outlook Stable Negative
Number of Red Flags Tripped 9 12
Corporate Governance
1 Short track record: Under 7 years of operating history x
2 Short listing history: Under 3 years or private x x
3 Concentration of family ownership: Major shareholding family control >30% stake x x
4 Change of senior management: Change of CEO/CFO x
5 Significant related party transactions: > 10% of sales, cost of goods sold; or receivables > 10% of total assets
6 Major shareholder's private business: Existence of material business outside of issuer x
Business Model
7 Extraordinary high profit margin: Reported EBITDA margin >40% x
8 High customer concentration: Top 5 customers > 30% of revenue x
9 Complicated group structure: Investment in JV/asso to total assets > 30%, Dividends from JV/asso/(FFO + dividends from JV/Asso), or Share of profit from JV/asso to net profit > 30%
x
Growth Strategy
10 Aggressive growth: Total asset or revenue doubled over 3 years x
11 Large negative Free Cash Flow: Negative FCF > 50% of OCF x
12 Large proportion of intangible assets: Intangibles/total assets > 25%
Quality of Earnings & Cashflows
13 Quality of cash flow generation: OCF/net income or OCF before interest & tax/EBITDA < 1 x x
14 Deviation in working capital: Year-on-year change in accounts receivable days, accounts payable days , or inventory days > 20%
x
15 Low tax paid relative to accounting profit: Tax paid in cash/profit before tax <10% x
16 Inadequate revenue generation from assets: Change of PPE/Revenue ratio > 20% from prior year x x
Concerns over Auditors/Financial Statements
17 Change in auditors
18 Signing auditor located in a different country to key business operations x
19 Delay in result announcement or filing audited statements in past 3 years x
20 Qualified accounts (incl. internal control weakness) x
Note: Tests generally applied to last 3 years

GLOBAL CORPORATE FINANCE
20 JULY 11, 2011
SPECIAL COMMENT: RED FLAGS FOR EMERGING-MARKET COMPANIES: A FOCUS ON CHINA
The next set of tables summarize the extent to which our 26 rated HY Chinese property developers triggered particular red-flag categories:
FIGURE 15 Red Flags for Chinese HY Property Issuers (1)
Longfor Agile Yanlord Powerlong KWG SPG Land Central China
Rating Ba2 Ba2 Ba2 Ba3 Ba3 Ba3 Ba3
Outlook Stable Stable Stable Negative Stable Stable Stable
Number of Red Flags Triggered 7 6 5 6 4 5 4
Corporate Governance
1 Short track record: Under 7 years of operating history
2 Short listing history : Under 3 years or private x x
3 Concentration of family ownership: Major shareholder family control >30% stake
x x x x x x x
4 Change of senior management: Change of CEO/CFO x x x
5 Significant related party transactions: > 10% of sales, cost of goods sold; or receivables > 10% of total assets
6 Major shareholder's private business: Existence of material business outside of issuer
x
Business Model
7 Extraordinary high profit margin: Reported EBITDA margin >40% x x x
8 High customer concentration: Top 5 customers > 30% of revenue
9 Complicated group structure: Investment in JV/asso to total assets > 30%, Dividends from JV/asso/(FFO + dividends from JV/Asso), or Share of profit from JV/asso to net profit > 30%
Growth Strategy
10 Aggressive growth: Total asset or revenue doubled over 3 years x x x x x x x
11 Large negative Free Cash Flow: Negative FCF > 50% of OCF x x x x x x x
12 Large proportion of intangible assets: Intangibles/total assets > 25%
Quality of Earnings & Cashflows
13 Quality of cash flow generation: (Cash + Restricted cash + Land – Increase in total debt) / [(Advance from customers Yr2 - Yr1) + Sales Yr2] < 25%
x
14 Sales generation on capital employed: Sales / Total assets < 15% x x x
15 Sales completion ability: Book sales Yr2 / Contracted sales Yr1 < 70%
16 Low tax paid relative to accounting profit: Tax paid in cash/profit before tax <10%
x x
Concerns over Auditors / Financial Statements
17 Change in auditors
18 Signing auditor located in a different country to key business operations x
19 Delay in result announcement or filing audited statements in past 3 years
20 Qualified accounts (incl. internal control weakness)
Note: Tests generally applied to last 3 years

GLOBAL CORPORATE FINANCE
21 JULY 11, 2011
SPECIAL COMMENT: RED FLAGS FOR EMERGING-MARKET COMPANIES: A FOCUS ON CHINA
FIGURE 16
Red Flags for Chinese HY Property Issuers (2)
Renhe Country Garden
Road King Shimao Fantasia Evergrande Kaisa
Rating Ba3 Ba3 Ba3 Ba3 B1 B1 B1
Outlook Stable Stable Stable Stable Stable Negative Negative
Number of Red Flags Triggered 7 4 4 5 4 7 7
Corporate Governance
1 Short track record: Under 7 years of operating history
2 Short listing history : Under 3 years or private x x x x
3 Concentration of family ownership: Major shareholder family control >30% stake
x x x x x x x
4 Change of senior management: Change of CEO/CFO x x
5 Significant related party transactions: > 10% of sales, cost of goods sold; or receivables > 10% of total assets
6 Major shareholder's private business: Existence of material business outside of issuer
x x x
Business Model
7 Extraordinary high profit margin: Reported EBITDA margin >40%
x
8 High customer concentration: Top 5 customers > 30% of revenue
x
9 Complicated group structure: Investment in JV/asso to total assets > 30%, Dividends from JV/asso/(FFO + dividends from JV/Asso), or Share of profit from JV/asso to net profit > 30%
x
Growth Strategy
10 Aggressive growth: Total asset or revenue doubled over 3 years
x x x x x x x
11 Large negative Free Cash Flow: Negative FCF > 50% of OCF x x x x x x x
12 Large proportion of intangible assets: Intangibles/total assets > 25%
Quality of Earnings & Cashflows
13 Quality of cash flow generation: (Cash + Restricted cash + Land – Increase in total debt) / [(Advance from customers Yr2 - Yr1) + Sales Yr2] < 25%
x
14 Sales generation on capital employed: Sales / Total assets < 15%
x x
15 Sales completion ability: Book sales Yr2 / Contracted sales Yr1 < 70%
16 Low tax paid relative to accounting profit: Tax paid in cash/profit before tax <10%
x
Concerns over Auditors / Financial Statements
17 Change in auditors x
18 Signing auditor located in a different country to key business operations
19 Delay in result announcement or filing audited statements in past 3 years
20 Qualified accounts (incl. internal control weakness)
Note: Tests generally applied to last 3 years

GLOBAL CORPORATE FINANCE
22 JULY 11, 2011
SPECIAL COMMENT: RED FLAGS FOR EMERGING-MARKET COMPANIES: A FOCUS ON CHINA
FIGURE 17
Red Flags for Chinese HY Property Issuers (3)
Zhong An Hopson Yuzhou
China South City China SCE Lai Fung
Rating B1 B1 B1 B1 B1 B1
Outlook Stable Stable Stable Stable Positive Stable
Number of Red Flags Triggered 6 7 7 7 7 5
Corporate Governance
1 Short track record: Under 7 years of operating history
2 Short listing history : Under 3 years or private x x x
3 Concentration of family ownership: Major shareholder family control >30% stake
x x x x x x
4 Change of senior management: Change of CEO/CFO x x x
5 Significant related party transactions: > 10% of sales, cost of goods sold; or receivables > 10% of total assets
x
6 Major shareholder's private business: Existence of material business outside of issuer
x
Business Model
7 Extraordinary high profit margin: Reported EBITDA margin >40% x x x x
8 High customer concentration: Top 5 customers > 30% of revenue
9 Complicated group structure: Investment in JV/asso to total assets > 30%, Dividends from JV/asso/(FFO + dividends from JV/Asso), or Share of profit from JV/asso to net profit > 30%
Growth Strategy
10 Aggressive growth: Total asset or revenue doubled over 3 years x x x x x
11 Large negative Free Cash Flow: Negative FCF > 50% of OCF x x x x x x
12 Large proportion of intangible assets: Intangibles/total assets > 25%
Quality of Earnings & Cashflows
13 Quality of cash flow generation: (Cash + Restricted cash + Land – Increase in total debt) / [(Advance from customers Yr2 - Yr1) + Sales Yr2] < 25%
x x
14 Sales generation on capital employed: Sales / Total assets < 15% x x x x
15 Sales completion ability: Book sales Yr2 / Contracted sales Yr1 < 70% x
16 Low tax paid relative to accounting profit: Tax paid in cash/profit before tax <10%
x x
Concerns over Auditors / Financial Statements
17 Change in auditors x
18 Signing auditor located in a different country to key business operations
19 Delay in result announcement or filing audited statements in past 3 years
20 Qualified accounts (incl. internal control weakness)
Note: Tests generally applied to last 3 years

GLOBAL CORPORATE FINANCE
23 JULY 11, 2011
SPECIAL COMMENT: RED FLAGS FOR EMERGING-MARKET COMPANIES: A FOCUS ON CHINA
FIGURE 18
Red Flags for Chinese HY Property Issuers (4)
Glorious
Shanghai Ind.
Urban Devp Greentown Shanghai
Zendai SRE
Group Costal
Greeland
Rating B2 B2 B3 B3 B3 B3
Outlook Stable RFPU Negative RFPD Stable Stable
Number of Red Flags Triggered 7 7 7 7 7 3
Corporate Governance
1 Short track record: Under 7 years of operating history
2 Short listing history : Under 3 years or private x
3 Concentration of family ownership: Major shareholder family control >30% stake
x x x x x
4 Change of senior management: Change of CEO/CFO x x
5 Significant related party transactions: > 10% of sales, cost of goods sold; or receivables > 10% of total assets
6 Major shareholder's private business: Existence of material business outside of issuer
x
Business Model
7 Extraordinary high profit margin: Reported EBITDA margin >40% x x x
8 High customer concentration: Top 5 customers > 30% of revenue
9 Complicated group structure: Investment in JV/asso to total assets > 30%, Dividends from JV/asso/(FFO + dividends from JV/Asso), or Share of profit from JV/asso to net profit > 30%
x x
Growth Strategy
10 Aggressive growth: Total asset or revenue doubled over 3 years x x x x x
11 Large negative Free Cash Flow: Negative FCF > 50% of OCF x x x x x x
12 Large proportion of intangible assets: Intangibles/total assets > 25%
Quality of Earnings & Cashflows
13 Quality of cash flow generation: (Cash + Restricted cash + Land – Increase in total debt) / [(Advance from customers Yr2 - Yr1) + Sales Yr2] < 25%
x x x
14 Sales generation on capital employed: Sales / Total assets < 15% x x x
15 Sales completion ability: Book sales Yr2 / Contracted sales Yr1 < 70% x x x x x
16 Low tax paid relative to accounting profit: Tax paid in cash/profit before tax <10%
x
Concerns over Auditors / Financial Statements
17 Change in auditors x
18 Signing auditor located in a different country to key business operations
19 Delay in result announcement or filing audited statements in past 3 years
20 Qualified accounts (incl. internal control weakness)
Note: Tests generally applied to last 3 years

GLOBAL CORPORATE FINANCE
24 JULY 11, 2011
SPECIAL COMMENT: RED FLAGS FOR EMERGING-MARKET COMPANIES: A FOCUS ON CHINA
Moody’s Related Research
Special Comments:
» Corporate Governance in Latin America: Our Top Ten Considerations for Non-Financial Family-Controlled Corporates, 29June 2011 (133487)
» Small CIS Companies: Moody’s Explains Its Approach to Added Risks for Small Non-Financial Companies in the CIS, June 2011 (133143)
» Corporate Governance in the Credit Crisis: Key Considerations for Investors, November 2008 (112847)
» Assessing Corporate Governance In Family-Controlled Companies From A Debt Holder Perspective, January 2008 (106287)
» Lessons Learned in Moody’s Experience in Evaluating Corporate Governance at Major North American Issuers, April 2006 (97104)
To access any of these reports, click on the entry above. Note that these references are current as of the date of publication of this report and that more recent reports may be available. All research may not be available to all clients.
GLOBAL CORPORATE FINANCE
25 JULY 11, 2011
SPECIAL COMMENT: RED FLAGS FOR EMERGING-MARKET COMPANIES: A FOCUS ON CHINA
Report Number: 134306
Author Elizabeth Allen
Financial Writer Paul Ulrich
Senior Production Associates Wing Chan Sarah Warburton Judy Torre
© 2011 Moody’s Investors Service, Inc. and/or its licensors and affiliates (collectively, “MOODY’S”). All rights reserved.
CREDIT RATINGS ARE MOODY'S INVESTORS SERVICE, INC.'S (“MIS”) CURRENT OPINIONS OF THE RELATIVE FUTURE CREDIT RISK OF ENTITIES, CREDIT COMMITMENTS, OR DEBT OR DEBT-LIKE SECURITIES. MIS DEFINES CREDIT RISK AS THE RISK THAT AN ENTITY MAY NOT MEET ITS CONTRACTUAL, FINANCIAL OBLIGATIONS AS THEY COME DUE AND ANY ESTIMATED FINANCIAL LOSS IN THE EVENT OF DEFAULT. CREDIT RATINGS DO NOT ADDRESS ANY OTHER RISK, INCLUDING BUT NOT LIMITED TO: LIQUIDITY RISK, MARKET VALUE RISK, OR PRICE VOLATILITY. CREDIT RATINGS ARE NOT STATEMENTS OF CURRENT OR HISTORICAL FACT. CREDIT RATINGS DO NOT CONSTITUTE INVESTMENT OR FINANCIAL ADVICE, AND CREDIT RATINGS ARE NOT RECOMMENDATIONS TO PURCHASE, SELL, OR HOLD PARTICULAR SECURITIES. CREDIT RATINGS DO NOT COMMENT ON THE SUITABILITY OF AN INVESTMENT FOR ANY PARTICULAR INVESTOR. MIS ISSUES ITS CREDIT RATINGS WITH THE EXPECTATION AND UNDERSTANDING THAT EACH INVESTOR WILL MAKE ITS OWN STUDY AND EVALUATION OF EACH SECURITY THAT IS UNDER CONSIDERATION FOR PURCHASE, HOLDING, OR SALE.
ALL INFORMATION CONTAINED HEREIN IS PROTECTED BY LAW, INCLUDING BUT NOT LIMITED TO, COPYRIGHT LAW, AND NONE OF SUCH INFORMATION MAY BE COPIED OR OTHERWISE REPRODUCED, REPACKAGED, FURTHER TRANSMITTED, TRANSFERRED, DISSEMINATED, REDISTRIBUTED OR RESOLD, OR STORED FOR SUBSEQUENT USE FOR ANY SUCH PURPOSE, IN WHOLE OR IN PART, IN ANY FORM OR MANNER OR BY ANY MEANS WHATSOEVER, BY ANY PERSON WITHOUT MOODY’S PRIOR WRITTEN CONSENT. All information contained herein is obtained by MOODY’S from sources believed by it to be accurate and reliable. Because of the possibility of human or mechanical error as well as other factors, however, all information contained herein is provided “AS IS” without warranty of any kind. MOODY'S adopts all necessary measures so that the information it uses in assigning a credit rating is of sufficient quality and from sources MOODY'S considers to be reliable including, when appropriate, independent third-party sources. However, MOODY’S is not an auditor and cannot in every instance independently verify or validate information received in the rating process. Under no circumstances shall MOODY’S have any liability to any person or entity for (a) any loss or damage in whole or in part caused by, resulting from, or relating to, any error (negligent or otherwise) or other circumstance or contingency within or outside the control of MOODY’S or any of its directors, officers, employees or agents in connection with the procurement, collection, compilation, analysis, interpretation, communication, publication or delivery of any such information, or (b) any direct, indirect, special, consequential, compensatory or incidental damages whatsoever (including without limitation, lost profits), even if MOODY’S is advised in advance of the possibility of such damages, resulting from the use of or inability to use, any such information. The ratings, financial reporting analysis, projections, and other observations, if any, constituting part of the information contained herein are, and must be construed solely as, statements of opinion and not statements of fact or recommendations to purchase, sell or hold any securities. Each user of the information contained herein must make its own study and evaluation of each security it may consider purchasing, holding or selling. NO WARRANTY, EXPRESS OR IMPLIED, AS TO THE ACCURACY, TIMELINESS, COMPLETENESS, MERCHANTABILITY OR FITNESS FOR ANY PARTICULAR PURPOSE OF ANY SUCH RATING OR OTHER OPINION OR INFORMATION IS GIVEN OR MADE BY MOODY’S IN ANY FORM OR MANNER WHATSOEVER.
MIS, a wholly-owned credit rating agency subsidiary of Moody’s Corporation (“MCO”), hereby discloses that most issuers of debt securities (including corporate and municipal bonds, debentures, notes and commercial paper) and preferred stock rated by MIS have, prior to assignment of any rating, agreed to pay to MIS for appraisal and rating services rendered by it fees ranging from $1,500 to approximately $2,500,000. MCO and MIS also maintain policies and procedures to address the independence of MIS’s ratings and rating processes. Information regarding certain affiliations that may exist between directors of MCO and rated entities, and between entities who hold ratings from MIS and have also publicly reported to the SEC an ownership interest in MCO of more than 5%, is posted annually at www.moodys.com under the heading “Shareholder Relations — Corporate Governance — Director and Shareholder Affiliation Policy.”
Any publication into Australia of this document is by MOODY’S affiliate, Moody’s Investors Service Pty Limited ABN 61 003 399 657, which holds Australian Financial Services License no. 336969. This document is intended to be provided only to “wholesale clients” within the meaning of section 761G of the Corporations Act 2001. By continuing to access this document from within Australia, you represent to MOODY’S that you are, or are accessing the document as a representative of, a “wholesale client” and that neither you nor the entity you represent will directly or indirectly disseminate this document or its contents to “retail clients” within the meaning of section 761G of the Corporations Act 2001.
Notwithstanding the foregoing, credit ratings assigned on and after October 1, 2010 by Moody’s Japan K.K. (“MJKK”) are MJKK’s current opinions of the relative future credit risk of entities, credit commitments, or debt or debt-like securities. In such a case, “MIS” in the foregoing statements shall be deemed to be replaced with “MJKK”.
MJKK is a wholly-owned credit rating agency subsidiary of Moody's Group Japan G.K., which is wholly owned by Moody’s Overseas Holdings Inc., a wholly-owned subsidiary of MCO.
This credit rating is an opinion as to the creditworthiness or a debt obligation of the issuer, not on the equity securities of the issuer or any form of security that is available to retail investors. It would be dangerous for retail investors to make any investment decision based on this credit rating. If in doubt you should contact your financial or other professional adviser.