Embed Size (px)
Citation preview

Special Climate Statement 65—persistent summer-like heat sets many April records
Updated 3 May 2018
Special Climate Statement 65—persistent summer-like heat sets many April records
2
Version number/type Date of issue 1.0 13 April 2018
2.0 16 April 2018
3.0 3 May 2018
Unless otherwise noted, all images in this document are licensed under the Creative Commons Attribution Australia Licence.
© Commonwealth of Australia 2018
Published by the Bureau of Meteorology
Cover image: Dry conditions near Violet Town, Victoria, 9 April 2018 (Photo: Lynette Bettio).
Special Climate Statement 65—persistent summer-like heat sets many April records
3
Table of contents Introduction .................................................................................................................................................................. 5
1.1 Evolution of the heatwave ........................................................................................................................... 5 1.2.1. State and national records ................................................................................................................... 7 1.2.2. Area-averaged records ......................................................................................................................... 7 1.2.3. Location records ................................................................................................................................... 8
1.3. Persistence of extreme heat .................................................................................................................... 10
1.4. Comparison with previous events ............................................................................................................ 12
1.5. Monthly records for April .......................................................................................................................... 14 1.5.1. Area-averaged records ....................................................................................................................... 14 1.5.2. Station records for monthly temperatures .......................................................................................... 14 1.5.3. Number of warm days for April 2018 .................................................................................................. 15
Tables .............................................................................................................................................................. 16
References and further information ........................................................................................................................... 34
Special Climate Statement 65—persistent summer-like heat sets many April records
5
Introduction
Abnormally warm conditions persisted through large parts of Australia in the first half of April 2018. The heat, which was more characteristic of mid-summer than mid-autumn, was unprecedented in many areas in April for its intensity, its persistence or both. The spatial extent of the heat was also exceptional, with above-average maximum temperatures extending almost nationwide on each day during the first 10 days of the month. Whilst temperatures were not quite as high in the second half of April, they were still widely above average until the last few days in the month, and abnormal warmth continued into early May with some records set in southern New South Wales and eastern Victoria (particularly the Riverina and Gippsland) on the 3rd.
The spatial extent of the heat was reflected in nationally, area-averaged maximum temperatures. In area-averaged terms, 9 April was Australia's hottest April day on record, with the 8th of the month also exceeding the previous record. Record-high temperatures for April were initially focused mostly on northwestern Australia during the first week of the month, before moving southwards from the 9th onwards. April records were set between 9 and 11 April over a region extending from the Nullarbor to the east coast, with a particular focus on inland southeastern Australia on the 10th and 11th. The heat then shifted to the east coast from the 12th to the 14th. Sydney, Adelaide and many other locations had their hottest or equal-hottest April days on record. During this period, the highest April temperatures on record occurred for the States of South Australia, Victoria and New South Wales.
The heat was also notable for its persistence across inland eastern Australia. Numerous locations throughout inland New South Wales exceeded 30 °C on each of the first 13 days of the month. Many records were set for consecutive days above 30 °C and above 35 °C in April, and for the total number of days above those thresholds for the month. Whilst overnight temperatures were less extreme than those during the day, some records were also set for the number of warm nights during the month, especially in coastal areas.
The persistence of the heat resulted in many new April monthly records, especially for maximum temperature. The Australian area-averaged mean maximum temperature was the highest on record for April, with records also set for South Australia and New South Wales. South Australia and New South Wales also had their highest mean monthly temperature on record for April, with the national value ranking second behind 2005.
1.1 Evolution of the heatwave
Abnormally warm conditions initially developed in the north of Western Australia during the second half of March. Temperatures in the Pilbara were consistently above average from mid-month onwards—Roebourne had 18 consecutive days of 40 °C or above from 13 to 30 March. This heat peaked in the final week of the month, when a number of locations had temperatures above 45 °C, the first time this has occurred anywhere in Australia on any date after the autumn equinox (see section 1.2.1 for further details).
Meanwhile, after a strong cold outbreak from 25 to 27 March, which brought some record-low March minimum temperatures to southeastern Australia, a ridge of high pressure became established across southern Australian latitudes, with only brief interruptions. The first major movement of significant heat southeast occurred on 1 April, in a northwest flow ahead of an approaching cold front, bringing record or near-record April temperatures to some parts of inland New South Wales.
After the passage of the front, whose main effect was on Tasmania and southern Victoria, on the 1st, temperatures returned to only slightly above average in southern coastal areas, and also cooled slightly (whilst still being well above average) further north. The warm conditions in the southern inland persisted through the first week of April. After a brief, slight cooling over the weekend 31 March – 1 April, temperatures in much of the north of Western Australia rebounded to record or near-record levels for April from the 2nd onwards.
The hottest part of the air mass moved south again from the 8th, as a front crossed the southwest of Western Australia and high pressure over southeastern Australia and the western Tasman Sea took a more north-south orientation. These systems combined to direct northwesterly flow over much of the southern continent, drawing hot air initially into the Nullarbor and outback South Australia on the 8th, then more broadly through southern Australia on the 9th. The 9th was a particularly hot day in parts of coastal New South Wales as offshore flow drew heat out to the coast. In the inland southeast, the heat peaked on the 10th and 11th. (Meanwhile, on the eastern side of the high-pressure system, a major early-season cold outbreak affected New Zealand on the 10th, with snow to low levels). There was further significant heat in coastal areas of New South Wales and eastern Victoria on the 12th
Special Climate Statement 65—persistent summer-like heat sets many April records
6
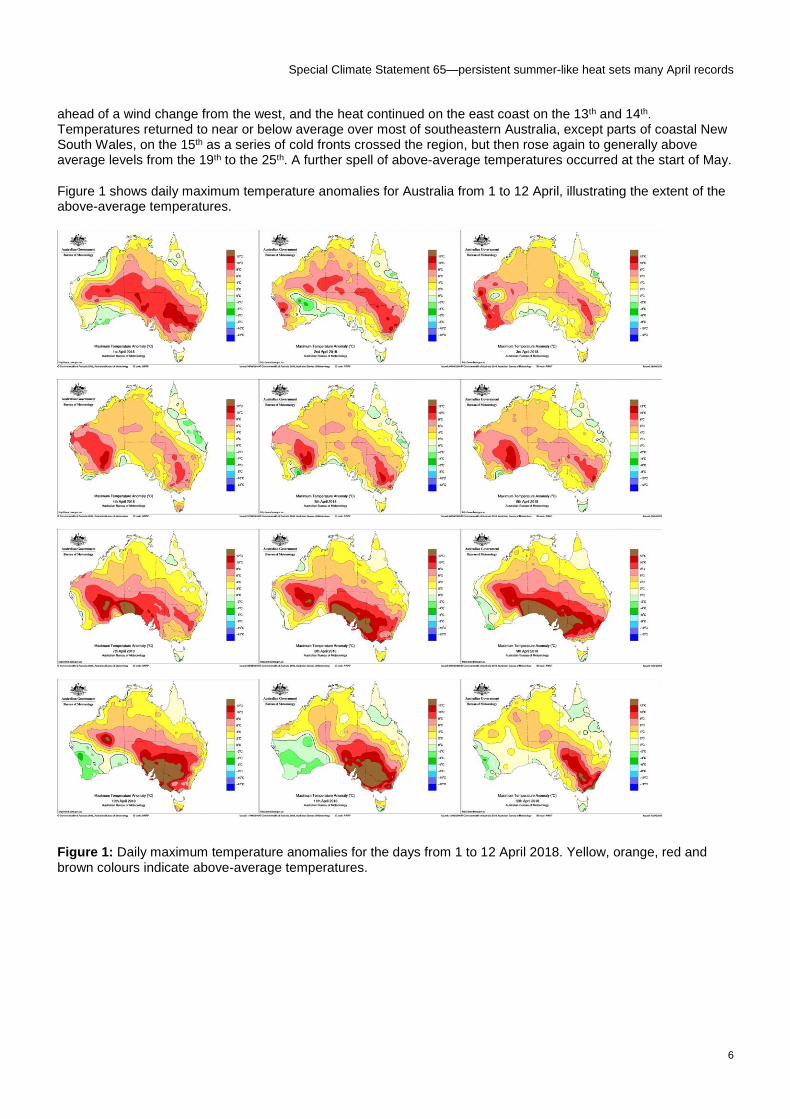
ahead of a wind change from the west, and the heat continued on the east coast on the 13th and 14th. Temperatures returned to near or below average over most of southeastern Australia, except parts of coastal New South Wales, on the 15th as a series of cold fronts crossed the region, but then rose again to generally above average levels from the 19th to the 25th. A further spell of above-average temperatures occurred at the start of May.
Figure 1 shows daily maximum temperature anomalies for Australia from 1 to 12 April, illustrating the extent of the above-average temperatures.
Figure 1: Daily maximum temperature anomalies for the days from 1 to 12 April 2018. Yellow, orange, red and brown colours indicate above-average temperatures.
Special Climate Statement 65—persistent summer-like heat sets many April records
7
1.2. Daily high temperature records set during the event
1.2.1. State and national records
During the first stage of the event, in late March in Western Australia, a number of locations exceeded the previous record-high temperature in Australia so late into autumn. Prior to 2018, there was no instance of a temperature higher than 45 °C at any Australian site on any autumn date after 21 March. 1 This value was surpassed on four occasions during the final week of March 2018. Mardie reached 45.9 °C on 29 March and 45.4 °C on the 28th, Roebourne 45.9 °C on the 28th, and Port Hedland 45.3 °C on the 28th. The Mardie temperature also becomes a new late-season record for Australia.
The Pilbara heat in April did not surpass the existing Australian April record (45.0 °C at Marble Bar in 1928 and Port Hedland in 1948), but the 43.7 °C at Roebourne on the 3rd was the highest April temperature observed in Australia since 1986.
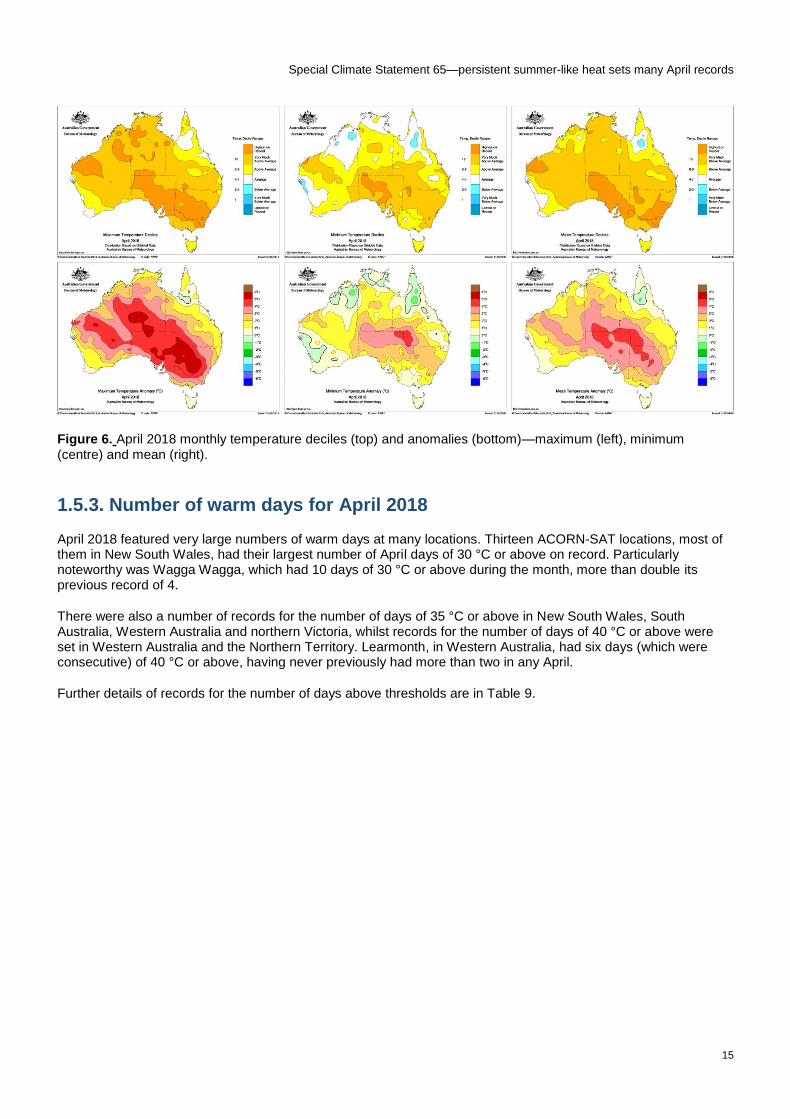
During the second phase of the event, a number of southern State records were set. The temperature of 42.2 °C at Nullarbor on the 9th was a new State record for South Australia (Table 1), breaking the 42.1 °C at Oodnadatta on 2 April 2005. The next day, the Victorian April record was broken when Mildura reached 39.3 °C, well above the 37.8 °C observed, also at Mildura, on 4 April 1986. In New South Wales, 40.5 °C at Pooncarie surpassed the 40.0 °C at Collarenebri on 1 April 1922.
On the 11th, the Victorian record set the previous day was equalled when it reached 39.3 °C at Hopetoun. In total, the 13 highest April temperatures on record for Victoria have been set during this event.
Some further late-season records were set in the second half of the month. These included a Western Australian (and Australian) late-season record of 41.7 °C on the 24th, and a Victorian late-season record of 34.2 °C at Ouyen on the 23rd. The latter is the highest temperature observed in Victoria in the last 10 days of April.
1.2.2. Area-averaged records
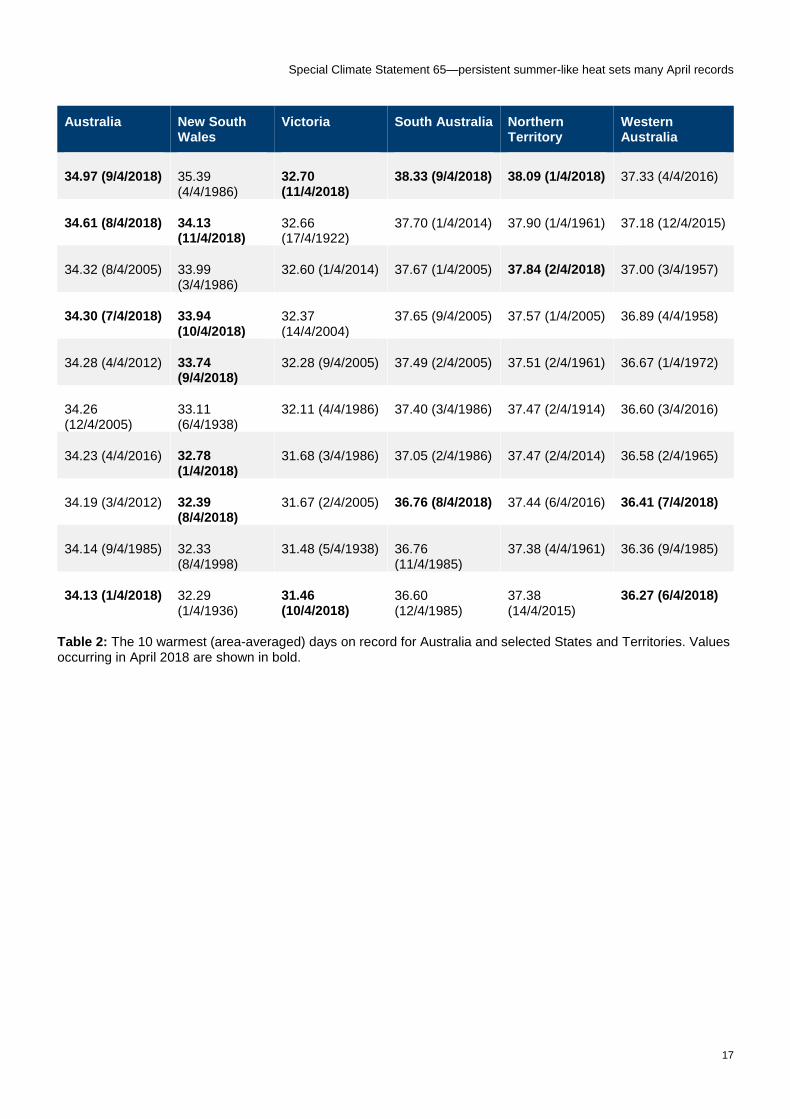
One of the most significant aspects of the event was its areal extent, with maximum temperatures above average over almost the entire continent on most of the first 10 days of April. This was reflected in numerous records for the hottest April day averaged over Australia or over States and Territories.
Australia's hottest day on record in area-averaged terms was 9 April, with a national average of 34.97 °C—0.65 °C above the previous record of 34.32 °C set on 8 April 2005. The 8th of April 2018 (34.61 °C) also broke the previous record, whilst the 7th (34.30 °C) and the 1st (34.13 °C) all rank in the top ten (Table 2). The heat was particularly widespread on the 8th (which was a record at the time before being broken the next day). No individual site with more than 30 years of data set a record that day, but maximum temperatures were above average over 98.9% of Australia, with slightly below-average temperatures being confined to a few isolated pockets on the coasts of Western Australia, Queensland and the Northern Territory.
Area-average records were also set for a number of States and Territories. The Northern Territory set a record on 1 April with 38.09 °C, with South Australia following on the 9th with 38.33 °C, whilst Victoria had its hottest area-averaged April day on record on the 11th with 32.70 °C. Whilst New South Wales did not surpass its 1986 record,
1 There have been a number of instances of 45.0 °C on later dates, up to and including 2 April.
Special Climate Statement 65—persistent summer-like heat sets many April records
8
the 2018 event saw the State have three of its five hottest April days on record, and five of the top ten. In total New South Wales had five consecutive days with an average maximum above 32 °C from 8 to 12 April; the State had never previously had more than two days with an average maximum above 32 °C in any April.
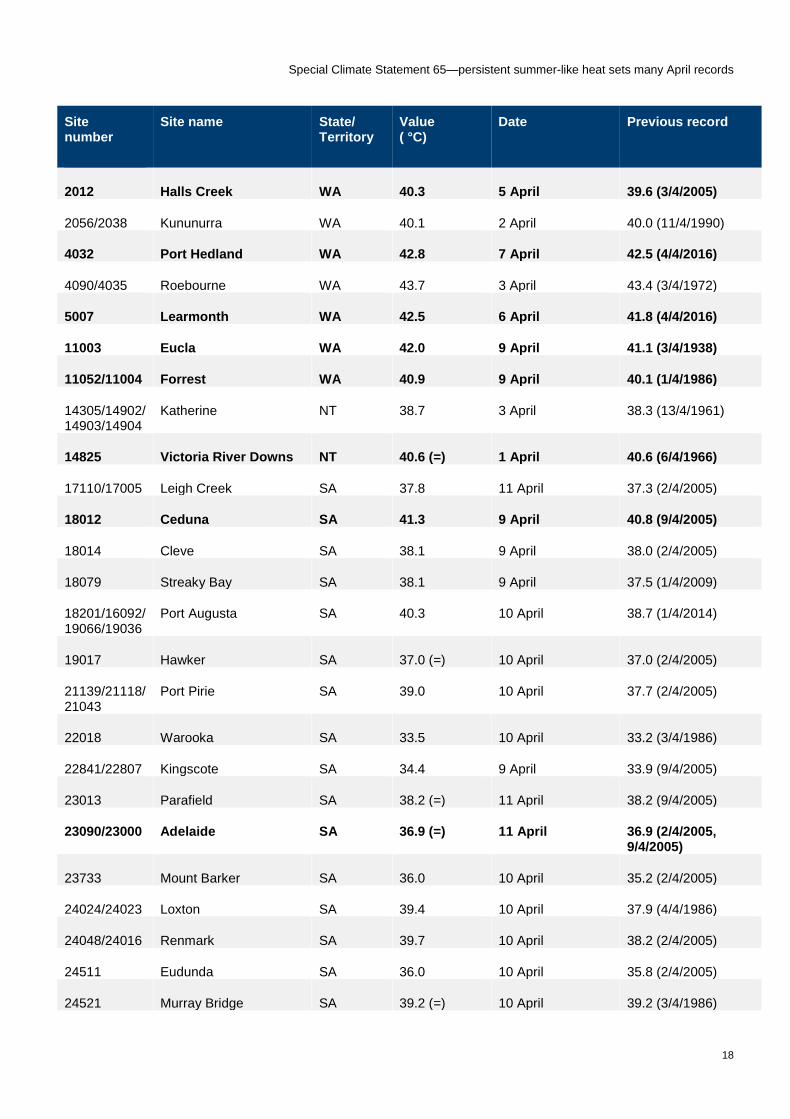
1.2.3. Location records
The first location monthly records set during the event were on 1 April (Table 3). On this day, the most abnormal heat was focused on two areas, the interior northwest of Australia, and inland New South Wales. The only long-term site in northwestern Australia to set a record on this day was Victoria River Downs, in the western Northern Territory. In New South Wales a number of records were set, the most significant being at Cobar, although most of these records were subsequently broken on 10 or 11 April.
Records continued to be set in northwestern Australia during the first week of April, with both the Kimberley and Pilbara featuring. Locations to set April records included Halls Creek (5 April), Learmonth (6 April) and Port Hedland Airport (7 April). During this period, temperatures in southern Australia, although mostly above average, were well short of record levels.
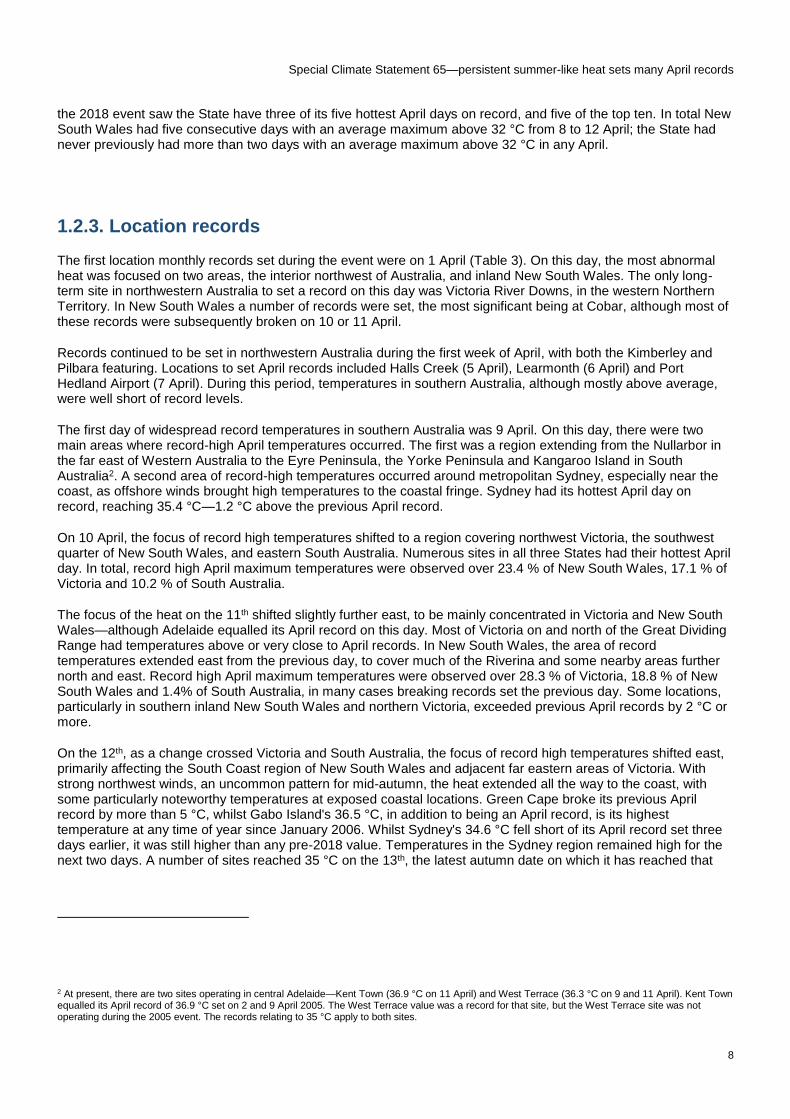
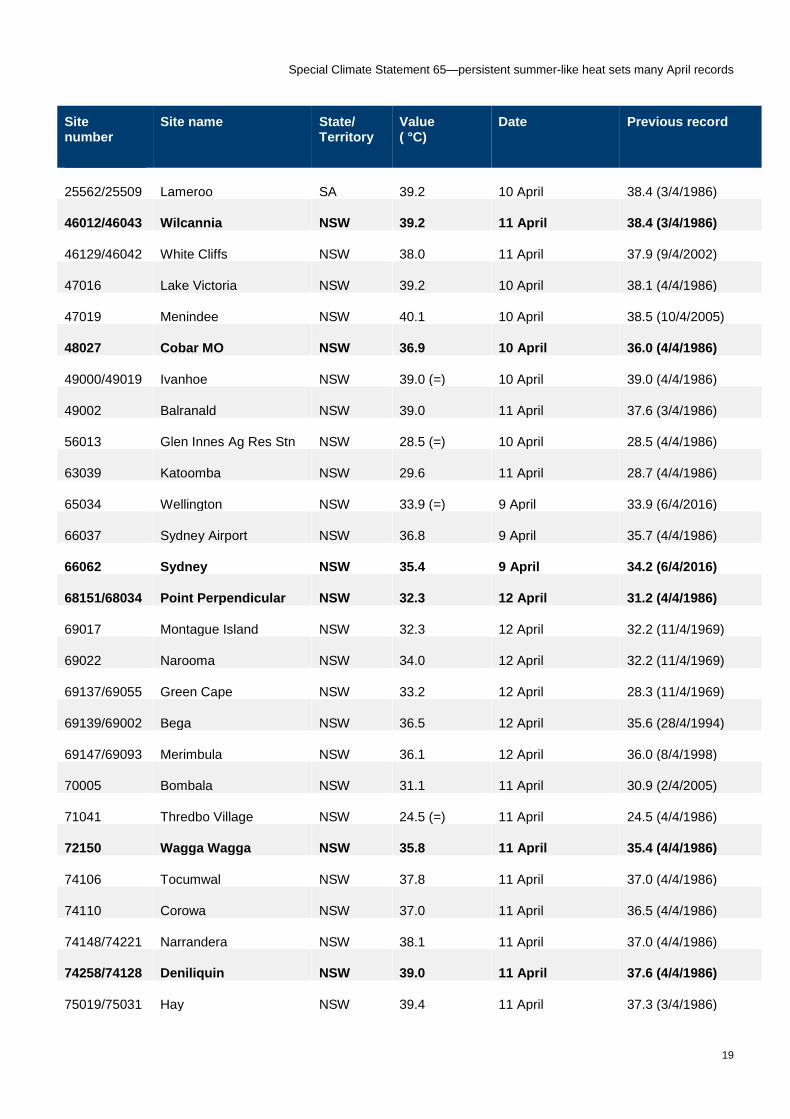
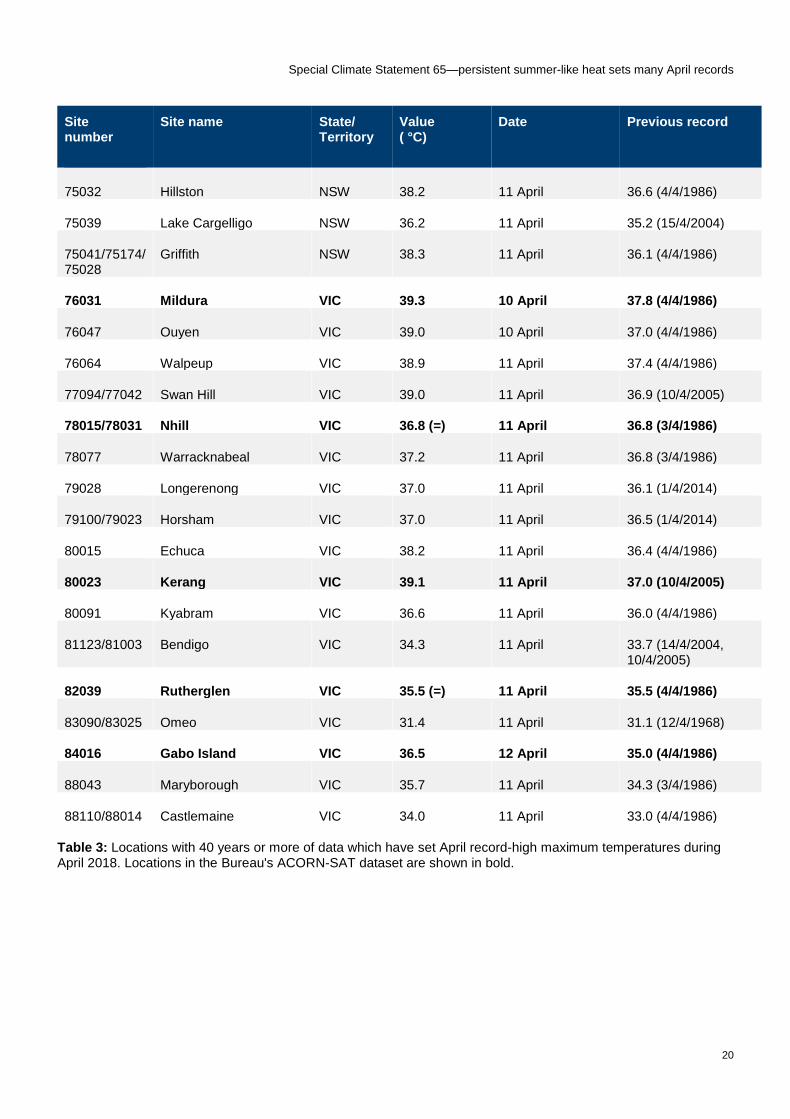
The first day of widespread record temperatures in southern Australia was 9 April. On this day, there were two main areas where record-high April temperatures occurred. The first was a region extending from the Nullarbor in the far east of Western Australia to the Eyre Peninsula, the Yorke Peninsula and Kangaroo Island in South Australia2. A second area of record-high temperatures occurred around metropolitan Sydney, especially near the coast, as offshore winds brought high temperatures to the coastal fringe. Sydney had its hottest April day on record, reaching 35.4 °C—1.2 °C above the previous April record.
On 10 April, the focus of record high temperatures shifted to a region covering northwest Victoria, the southwest quarter of New South Wales, and eastern South Australia. Numerous sites in all three States had their hottest April day. In total, record high April maximum temperatures were observed over 23.4 % of New South Wales, 17.1 % of Victoria and 10.2 % of South Australia.
The focus of the heat on the 11th shifted slightly further east, to be mainly concentrated in Victoria and New South Wales—although Adelaide equalled its April record on this day. Most of Victoria on and north of the Great Dividing Range had temperatures above or very close to April records. In New South Wales, the area of record temperatures extended east from the previous day, to cover much of the Riverina and some nearby areas further north and east. Record high April maximum temperatures were observed over 28.3 % of Victoria, 18.8 % of New South Wales and 1.4% of South Australia, in many cases breaking records set the previous day. Some locations, particularly in southern inland New South Wales and northern Victoria, exceeded previous April records by 2 °C or more.
On the 12th, as a change crossed Victoria and South Australia, the focus of record high temperatures shifted east, primarily affecting the South Coast region of New South Wales and adjacent far eastern areas of Victoria. With strong northwest winds, an uncommon pattern for mid-autumn, the heat extended all the way to the coast, with some particularly noteworthy temperatures at exposed coastal locations. Green Cape broke its previous April record by more than 5 °C, whilst Gabo Island's 36.5 °C, in addition to being an April record, is its highest temperature at any time of year since January 2006. Whilst Sydney's 34.6 °C fell short of its April record set three days earlier, it was still higher than any pre-2018 value. Temperatures in the Sydney region remained high for the next two days. A number of sites reached 35 °C on the 13th, the latest autumn date on which it has reached that
2 At present, there are two sites operating in central Adelaide—Kent Town (36.9 °C on 11 April) and West Terrace (36.3 °C on 9 and 11 April). Kent Town equalled its April record of 36.9 °C set on 2 and 9 April 2005. The West Terrace value was a record for that site, but the West Terrace site was not operating during the 2005 event. The records relating to 35 °C apply to both sites.
Special Climate Statement 65—persistent summer-like heat sets many April records
9
level in metropolitan Sydney, and Sydney's three consecutive days of 30 °C or above was the third time this has occurred in April.
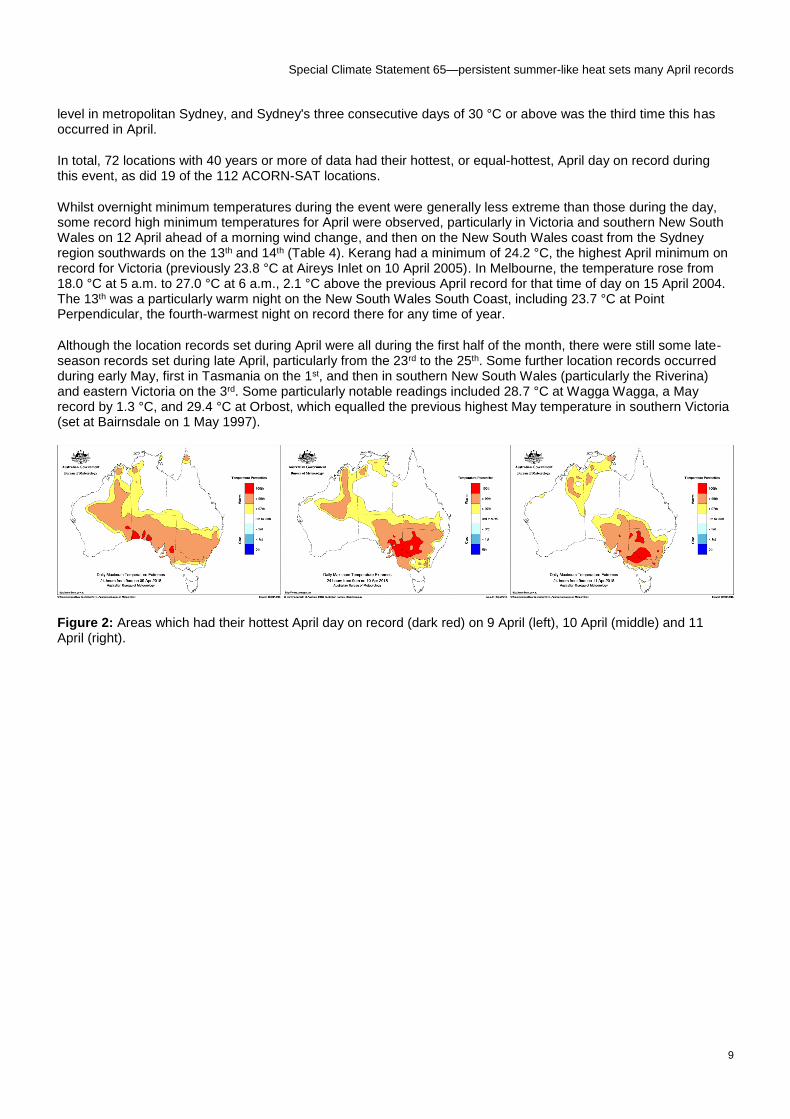
In total, 72 locations with 40 years or more of data had their hottest, or equal-hottest, April day on record during this event, as did 19 of the 112 ACORN-SAT locations.
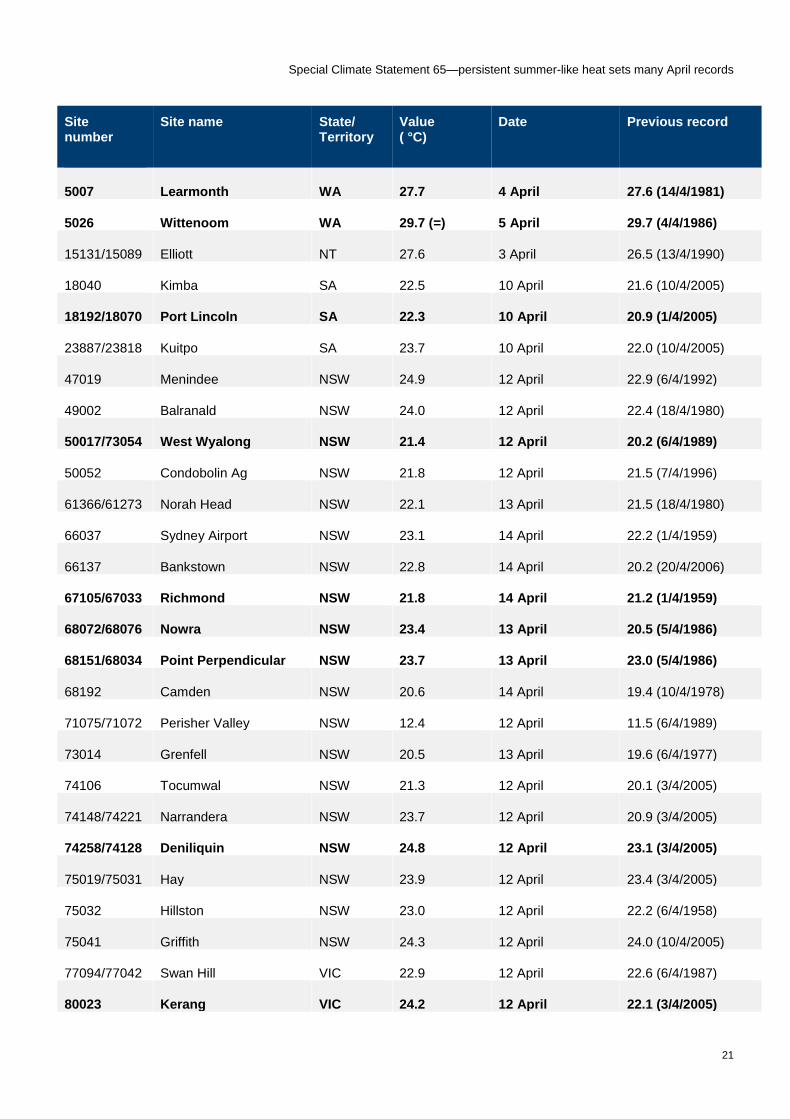
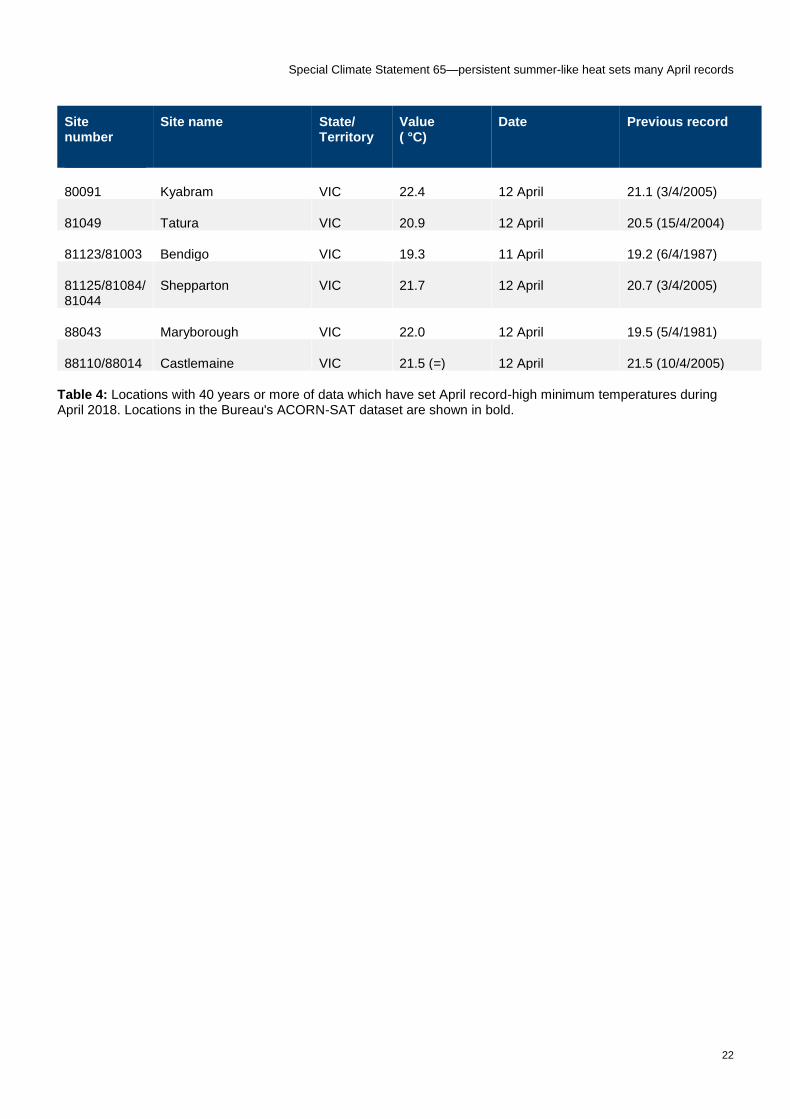
Whilst overnight minimum temperatures during the event were generally less extreme than those during the day, some record high minimum temperatures for April were observed, particularly in Victoria and southern New South Wales on 12 April ahead of a morning wind change, and then on the New South Wales coast from the Sydney region southwards on the 13th and 14th (Table 4). Kerang had a minimum of 24.2 °C, the highest April minimum on record for Victoria (previously 23.8 °C at Aireys Inlet on 10 April 2005). In Melbourne, the temperature rose from 18.0 °C at 5 a.m. to 27.0 °C at 6 a.m., 2.1 °C above the previous April record for that time of day on 15 April 2004. The 13th was a particularly warm night on the New South Wales South Coast, including 23.7 °C at Point Perpendicular, the fourth-warmest night on record there for any time of year.
Although the location records set during April were all during the first half of the month, there were still some late-season records set during late April, particularly from the 23rd to the 25th. Some further location records occurred during early May, first in Tasmania on the 1st, and then in southern New South Wales (particularly the Riverina) and eastern Victoria on the 3rd. Some particularly notable readings included 28.7 °C at Wagga Wagga, a May record by 1.3 °C, and 29.4 °C at Orbost, which equalled the previous highest May temperature in southern Victoria (set at Bairnsdale on 1 May 1997).
Figure 2: Areas which had their hottest April day on record (dark red) on 9 April (left), 10 April (middle) and 11 April (right).
Special Climate Statement 65—persistent summer-like heat sets many April records
10
Figure 3: Locations with 40 years or more of data which had their hottest April day on record in the period from 1 to 11 April 2018.
1.3. Persistence of extreme heat
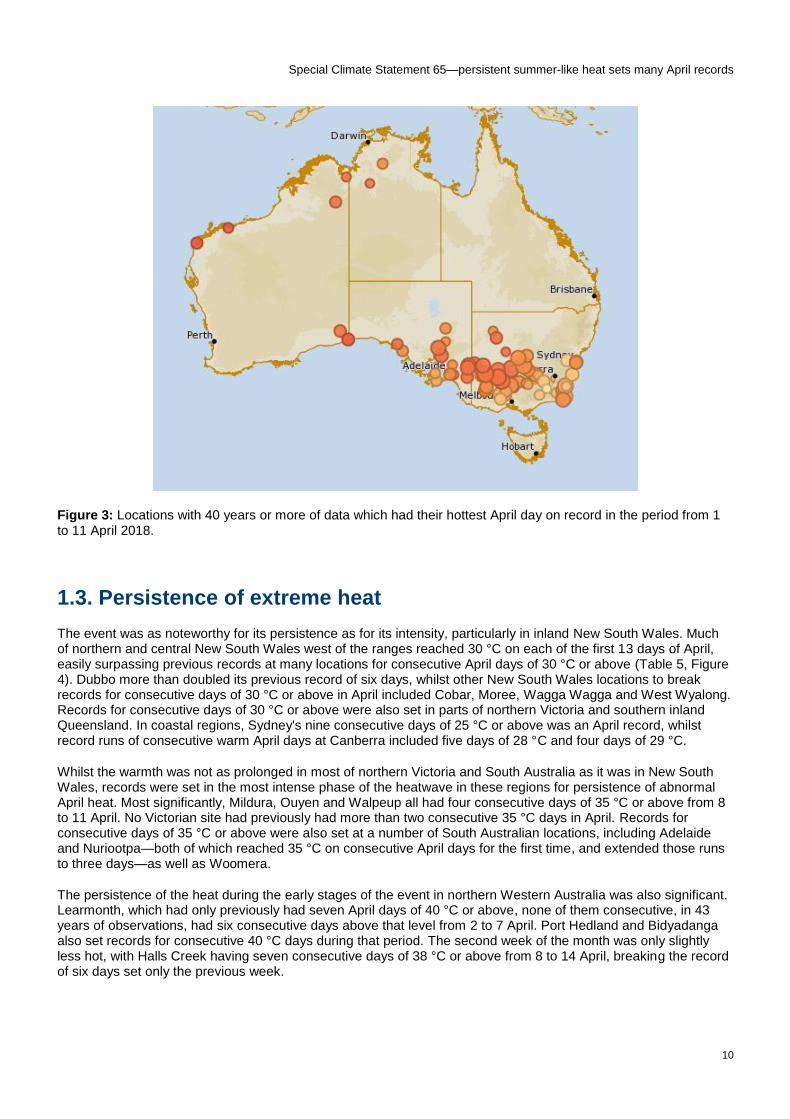
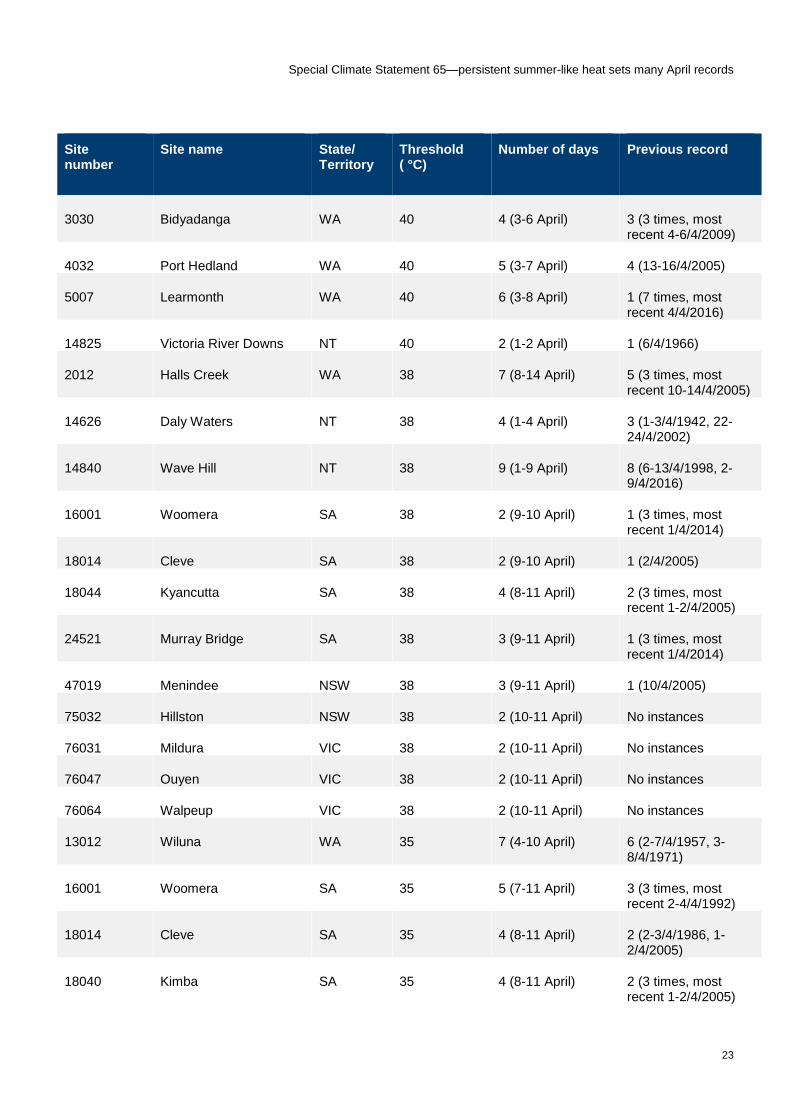
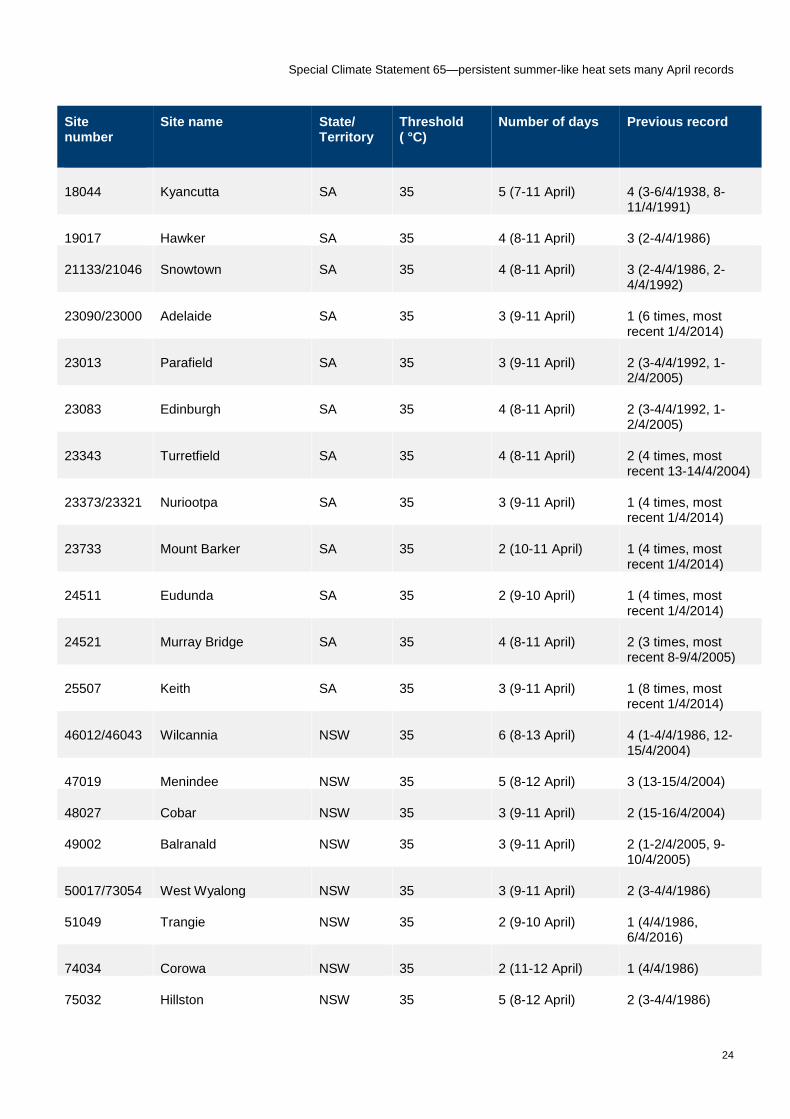
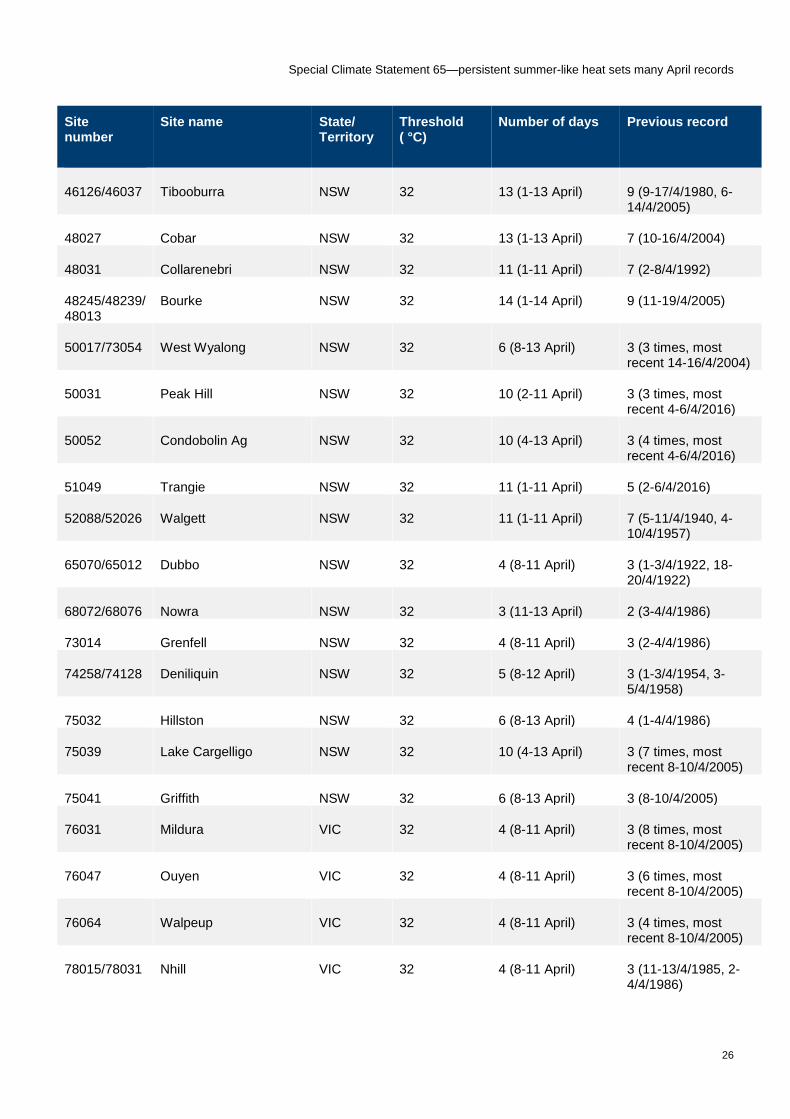
The event was as noteworthy for its persistence as for its intensity, particularly in inland New South Wales. Much of northern and central New South Wales west of the ranges reached 30 °C on each of the first 13 days of April, easily surpassing previous records at many locations for consecutive April days of 30 °C or above (Table 5, Figure 4). Dubbo more than doubled its previous record of six days, whilst other New South Wales locations to break records for consecutive days of 30 °C or above in April included Cobar, Moree, Wagga Wagga and West Wyalong. Records for consecutive days of 30 °C or above were also set in parts of northern Victoria and southern inland Queensland. In coastal regions, Sydney's nine consecutive days of 25 °C or above was an April record, whilst record runs of consecutive warm April days at Canberra included five days of 28 °C and four days of 29 °C.
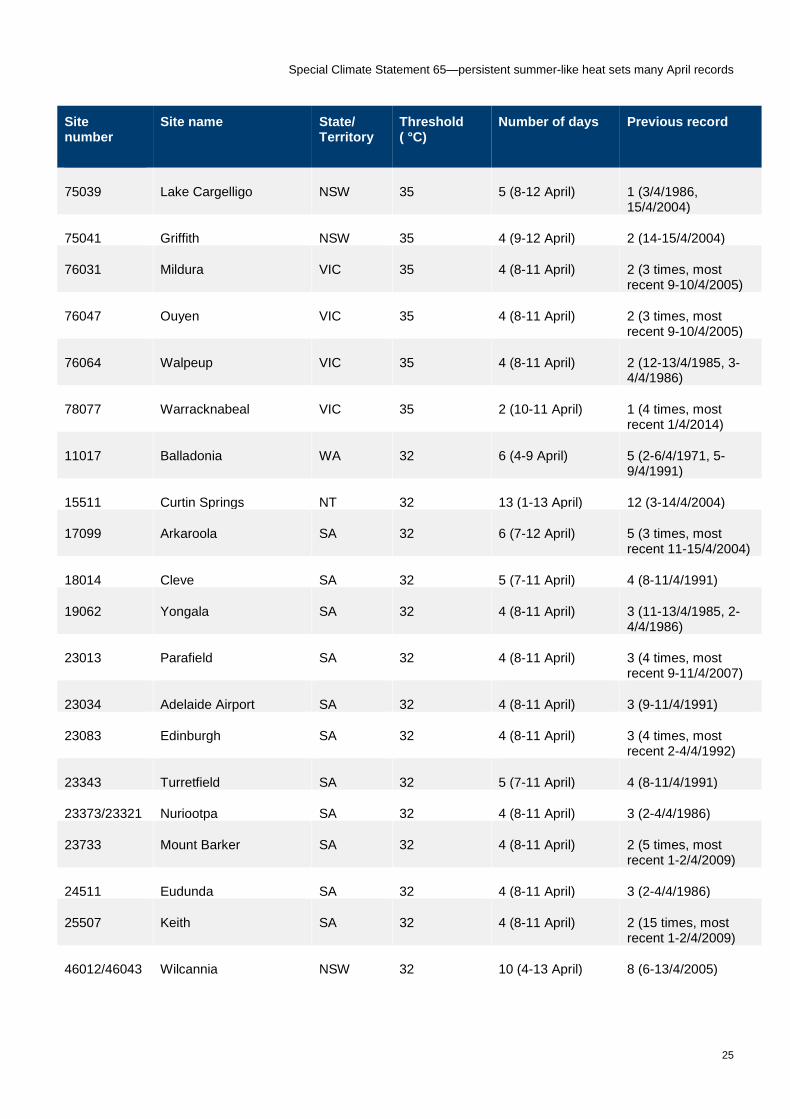
Whilst the warmth was not as prolonged in most of northern Victoria and South Australia as it was in New South Wales, records were set in the most intense phase of the heatwave in these regions for persistence of abnormal April heat. Most significantly, Mildura, Ouyen and Walpeup all had four consecutive days of 35 °C or above from 8 to 11 April. No Victorian site had previously had more than two consecutive 35 °C days in April. Records for consecutive days of 35 °C or above were also set at a number of South Australian locations, including Adelaide and Nuriootpa—both of which reached 35 °C on consecutive April days for the first time, and extended those runs to three days—as well as Woomera.
The persistence of the heat during the early stages of the event in northern Western Australia was also significant. Learmonth, which had only previously had seven April days of 40 °C or above, none of them consecutive, in 43 years of observations, had six consecutive days above that level from 2 to 7 April. Port Hedland and Bidyadanga also set records for consecutive 40 °C days during that period. The second week of the month was only slightly less hot, with Halls Creek having seven consecutive days of 38 °C or above from 8 to 14 April, breaking the record of six days set only the previous week.
Special Climate Statement 65—persistent summer-like heat sets many April records
11
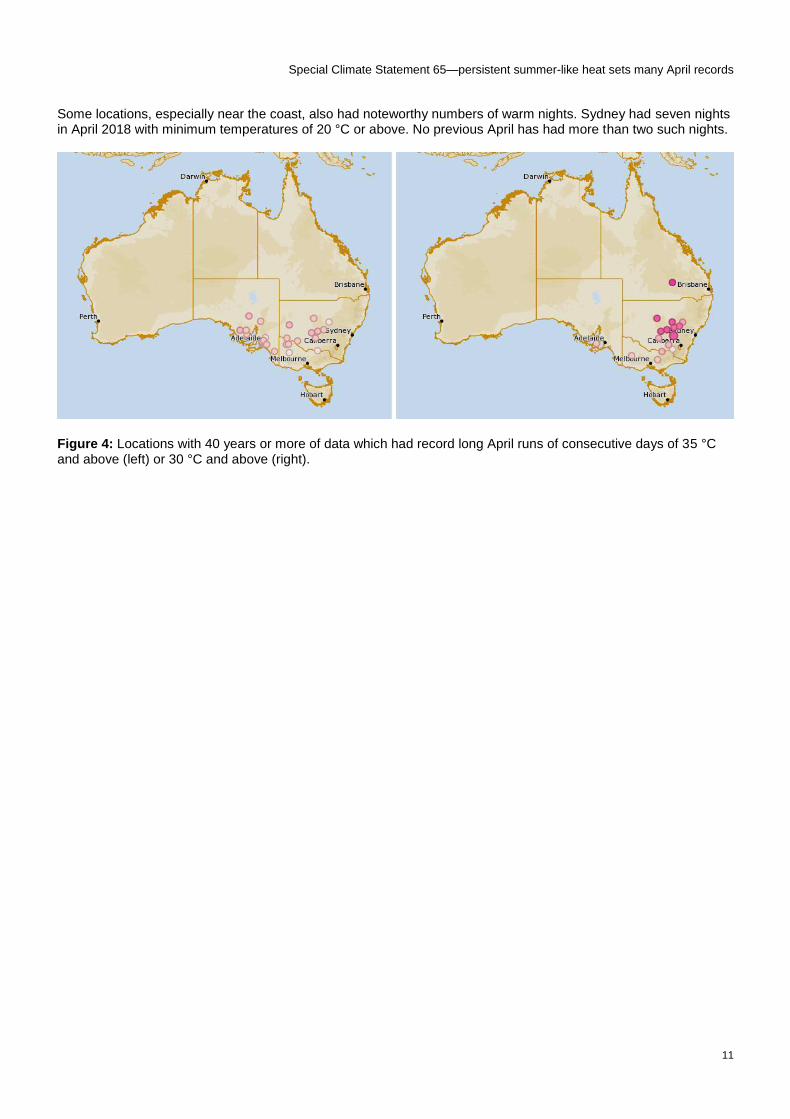
Some locations, especially near the coast, also had noteworthy numbers of warm nights. Sydney had seven nights in April 2018 with minimum temperatures of 20 °C or above. No previous April has had more than two such nights.
Figure 4: Locations with 40 years or more of data which had record long April runs of consecutive days of 35 °C and above (left) or 30 °C and above (right).

Special Climate Statement 65—persistent summer-like heat sets many April records
12
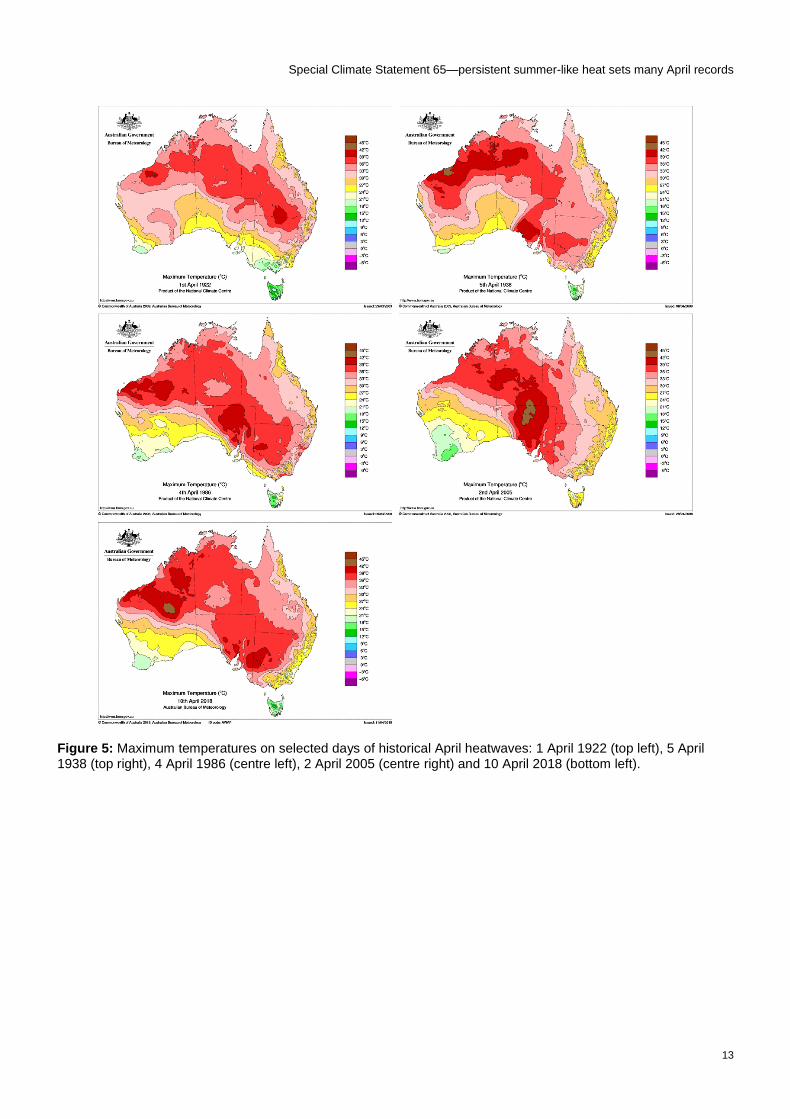
1.4. Comparison with previous events
Previous notable April heatwaves in southeastern Australia include those of 1922, 1938, 1986 and 2005.
The 1922 event primarily affected New South Wales. It was an extension of an event which began in late March, and only extended into the first three days of April. The highest temperatures occurred in northern inland New South Wales, including 40.0 °C at Collarenebri, the only instance of a 40 °C temperature in April in the State prior to this current event in 2018. It remains the most significant April heatwave in parts of northern New South Wales.
The 1938 event had some parallels to the current event, primarily covering South Australia, Victoria and southern New South Wales, but was generally less intense and prolonged. It extended further to the southern Victorian coastline than in 2018, resulting in a Melbourne April record (34.9 °C) which still stands.
The 1986 event was particularly focused on New South Wales and northern and eastern Victoria. The 4th of April 1986 was a particularly hot day over much of New South Wales and was the State's hottest April day on record in area-averaged terms. Compared with the 2018 event, it was generally slightly less hot west of the ranges but warmer in most tableland and coastal areas (except at Sydney). There were also exceptionally high temperatures in Gippsland. The 1986 event was relatively short-lived with temperatures falling sharply after 5 April. Records set in the 1986 event which remain include 38.5 °C at Camden (the highest April temperature in metropolitan Sydney), 37.5 °C at Bairnsdale (the highest April temperature in southern Victoria) and 32.6 °C at Canberra.
April 2005 was a month marked by exceptionally persistent and widespread warmth, with some locations in inland southeastern Australia having above-average maximum temperatures on every day of the month. It is currently the warmest April on record for Australia and for South Australia, New South Wales and Victoria, and at the time had the largest mean temperature anomaly on record for any month for Australia (since surpassed in September 2013 and October 2015). Individual extremes were less prominent during this month, with the most significant heat occurring in South Australia, although a few Victorian locations also set records.
Maps of maximum temperatures on key days in each of these events are shown in Figure 5.
Special Climate Statement 65—persistent summer-like heat sets many April records
13
Figure 5: Maximum temperatures on selected days of historical April heatwaves: 1 April 1922 (top left), 5 April 1938 (top right), 4 April 1986 (centre left), 2 April 2005 (centre right) and 10 April 2018 (bottom left).
Special Climate Statement 65—persistent summer-like heat sets many April records
14
1.5. Monthly records for April
1.5.1. Area-averaged records
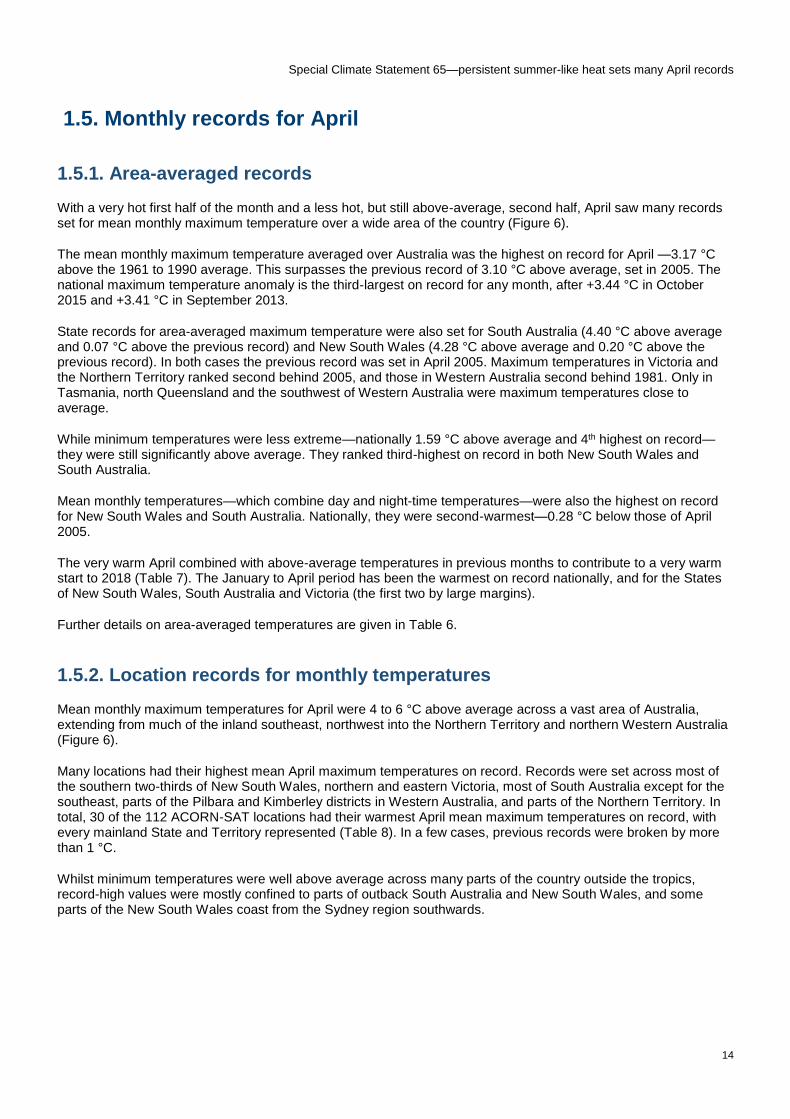
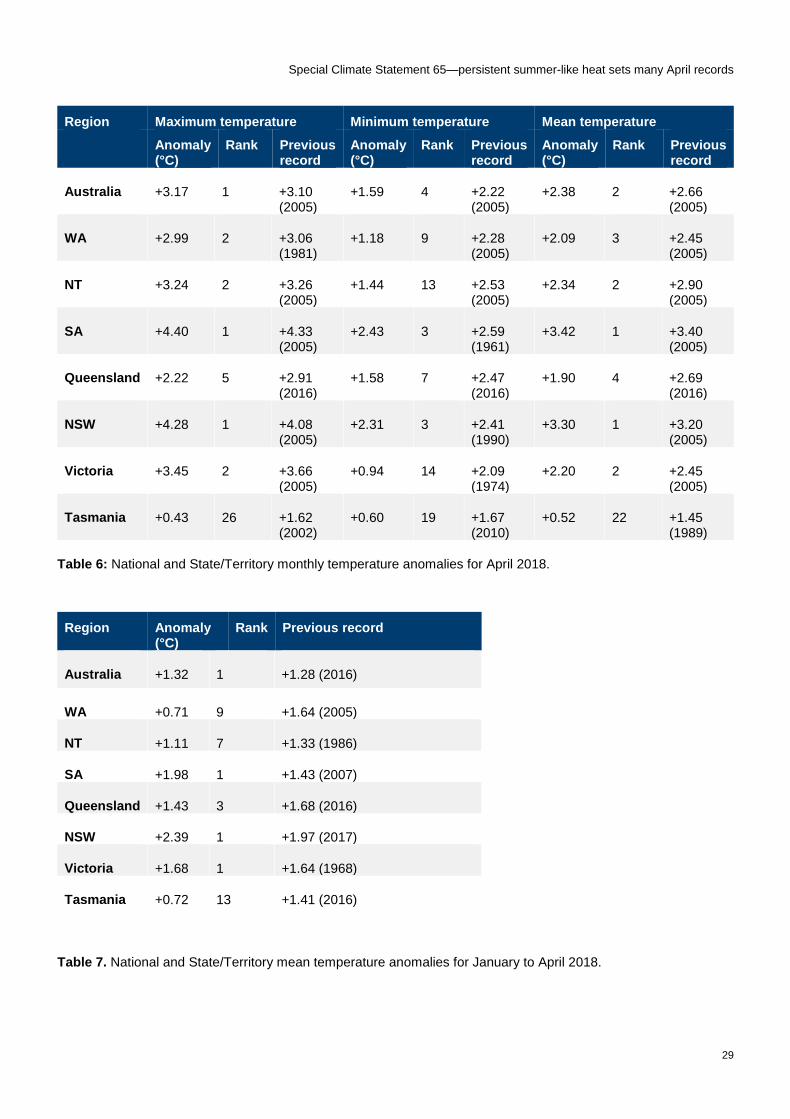
With a very hot first half of the month and a less hot, but still above-average, second half, April saw many records set for mean monthly maximum temperature over a wide area of the country (Figure 6).
The mean monthly maximum temperature averaged over Australia was the highest on record for April —3.17 °C above the 1961 to 1990 average. This surpasses the previous record of 3.10 °C above average, set in 2005. The national maximum temperature anomaly is the third-largest on record for any month, after +3.44 °C in October 2015 and +3.41 °C in September 2013.
State records for area-averaged maximum temperature were also set for South Australia (4.40 °C above average and 0.07 °C above the previous record) and New South Wales (4.28 °C above average and 0.20 °C above the previous record). In both cases the previous record was set in April 2005. Maximum temperatures in Victoria and the Northern Territory ranked second behind 2005, and those in Western Australia second behind 1981. Only in Tasmania, north Queensland and the southwest of Western Australia were maximum temperatures close to average.
While minimum temperatures were less extreme—nationally 1.59 °C above average and 4th highest on record—they were still significantly above average. They ranked third-highest on record in both New South Wales and South Australia.
Mean monthly temperatures—which combine day and night-time temperatures—were also the highest on record for New South Wales and South Australia. Nationally, they were second-warmest—0.28 °C below those of April 2005.
The very warm April combined with above-average temperatures in previous months to contribute to a very warm start to 2018 (Table 7). The January to April period has been the warmest on record nationally, and for the States of New South Wales, South Australia and Victoria (the first two by large margins).
Further details on area-averaged temperatures are given in Table 6.
1.5.2. Location records for monthly temperatures
Mean monthly maximum temperatures for April were 4 to 6 °C above average across a vast area of Australia, extending from much of the inland southeast, northwest into the Northern Territory and northern Western Australia (Figure 6).
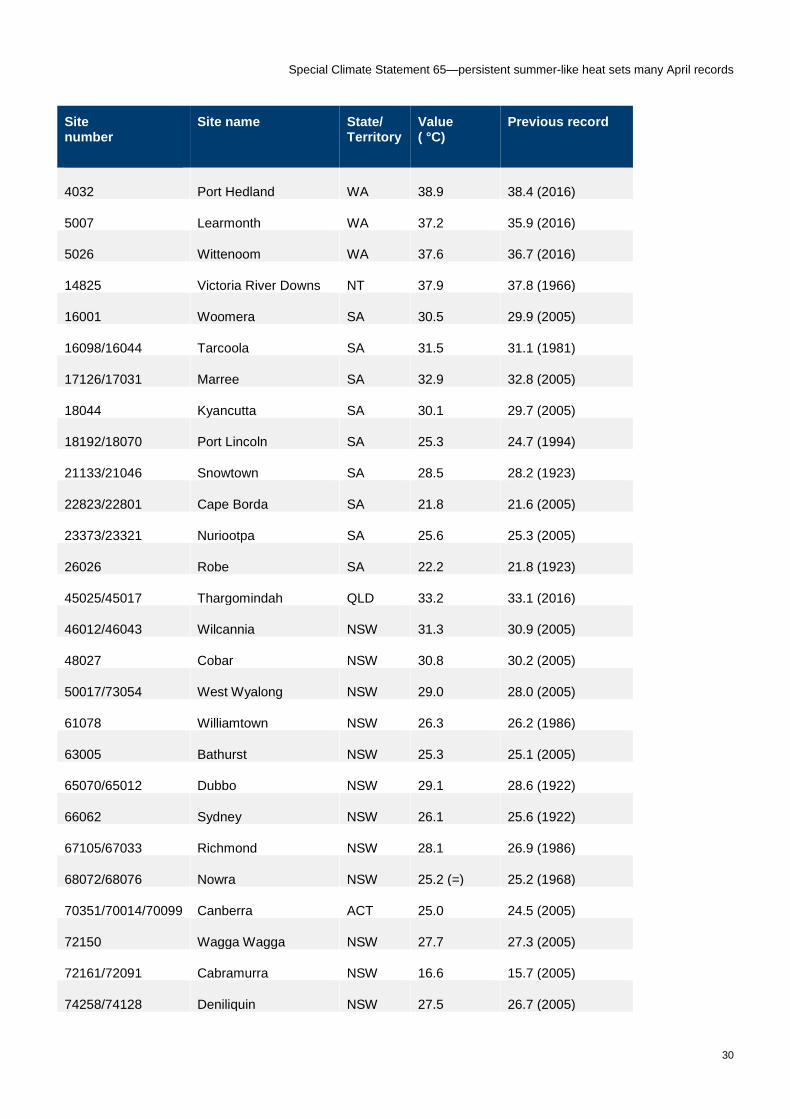
Many locations had their highest mean April maximum temperatures on record. Records were set across most of the southern two-thirds of New South Wales, northern and eastern Victoria, most of South Australia except for the southeast, parts of the Pilbara and Kimberley districts in Western Australia, and parts of the Northern Territory. In total, 30 of the 112 ACORN-SAT locations had their warmest April mean maximum temperatures on record, with every mainland State and Territory represented (Table 8). In a few cases, previous records were broken by more than 1 °C.
Whilst minimum temperatures were well above average across many parts of the country outside the tropics, record-high values were mostly confined to parts of outback South Australia and New South Wales, and some parts of the New South Wales coast from the Sydney region southwards.
Special Climate Statement 65—persistent summer-like heat sets many April records
15
Figure 6. April 2018 monthly temperature deciles (top) and anomalies (bottom)—maximum (left), minimum (centre) and mean (right).
1.5.3. Number of warm days for April 2018
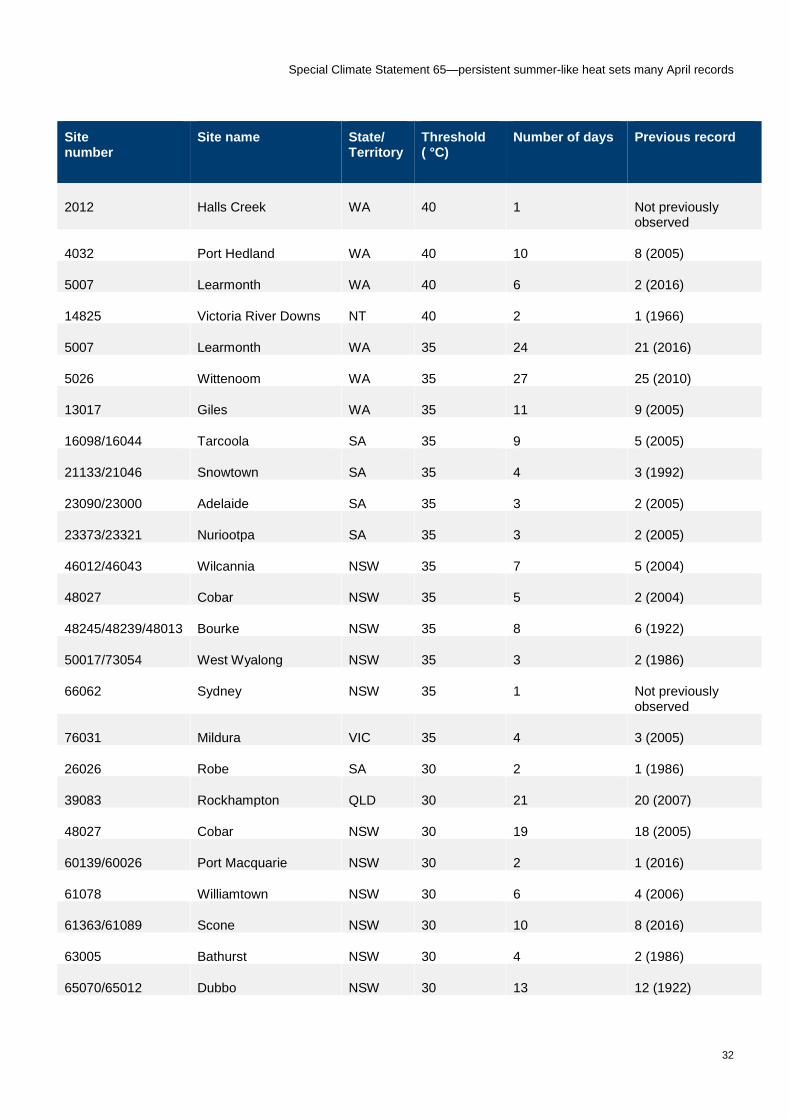
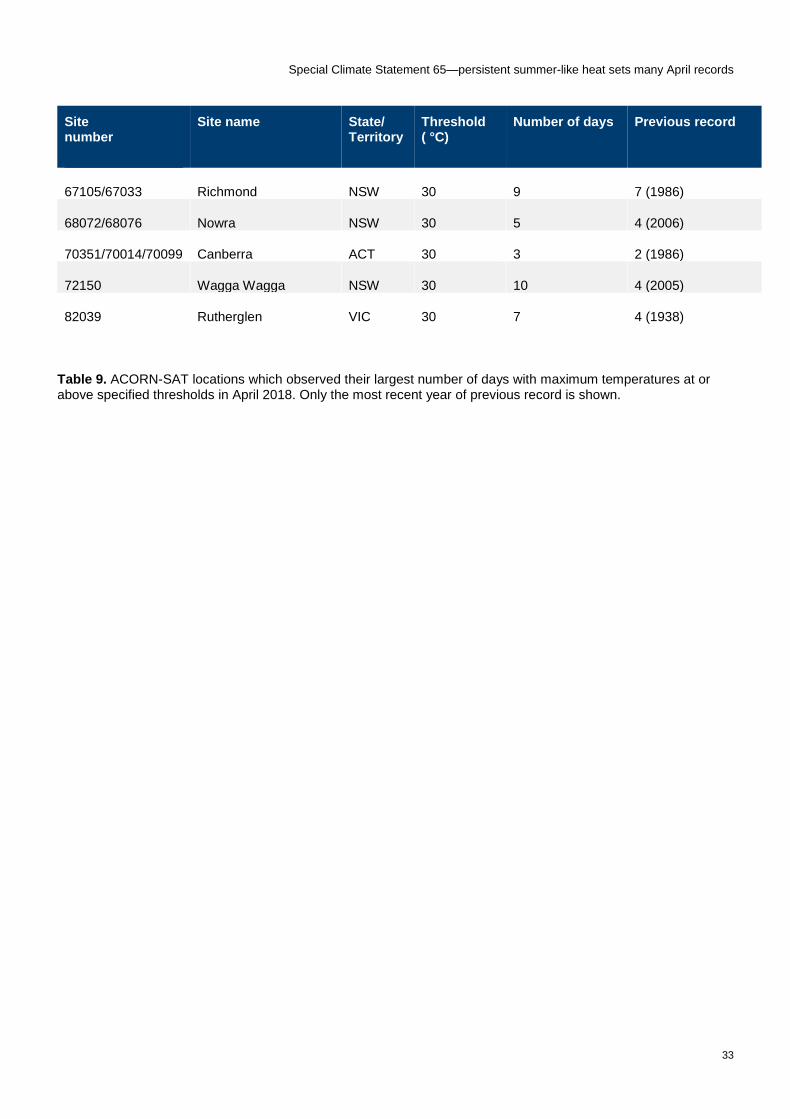
April 2018 featured very large numbers of warm days at many locations. Thirteen ACORN-SAT locations, most of them in New South Wales, had their largest number of April days of 30 °C or above on record. Particularly noteworthy was Wagga Wagga, which had 10 days of 30 °C or above during the month, more than double its previous record of 4.
There were also a number of records for the number of days of 35 °C or above in New South Wales, South Australia, Western Australia and northern Victoria, whilst records for the number of days of 40 °C or above were set in Western Australia and the Northern Territory. Learmonth, in Western Australia, had six days (which were consecutive) of 40 °C or above, having never previously had more than two in any April.
Further details of records for the number of days above thresholds are in Table 9.
Special Climate Statement 65—persistent summer-like heat sets many April records
16
Tables
New South Wales Victoria South Australia
Value (°C)
Location and date Value (°C)
Location and date Value (°C)
Location and date
40.5 Pooncarie (10/4/2018) 39.3 Mildura (10/4/2018) 42.2 Nullarbor (9/4/2018)
40.1 Menindee (10/4/2018) 39.3 Hopetoun (11/4/2018) 42.1 Oodnadatta (2/4/2005)
40.0 Collarenebri (1/4/1922) 39.1 Kerang (11/4/2018) 41.8 Nullarbor (1/4/2005)
39.7 Menindee (11/4/2018) 39.0 Ouyen (10/4/2018) 41.8 Oodnadatta (3/4/1953)
39.4 Bourke (6/4/1919) 39.0 Swan Hill (11/4/2018) 41.5 Coober Pedy (2/4/2005)
39.4 Bourke (1/4/1922) 38.9 Hopetoun (10/4/2018) 41.3 Marla (2/4/2005)
39.4 Hay (11/4/2018) 38.9 Ouyen (11/4/2018) 41.3 Ceduna (9/4/2018)
39.2 Lake Victoria (10/4/2018)
38.9 Walpeup (11/4/2018) 41.2 Oodnadatta (12/4/1956)
39.2 Wilcannia (11/4/2018) 38.9 Charlton (11/4/2018) 41.1 Cook (1/4/1966)
39.0 Ivanhoe (4/4/1986) 38.8 Walpeup (10/4/2018) 41.1 Kyancutta (5/4/1938)
Table 1: 10 highest April temperatures on record in New South Wales, Victoria and South Australia. Values occurring in April 2018 are shown in bold.
Special Climate Statement 65—persistent summer-like heat sets many April records
17
Australia
New South Wales
Victoria South Australia Northern Territory
Western Australia
34.97 (9/4/2018) 35.39 (4/4/1986)
32.70 (11/4/2018)
38.33 (9/4/2018) 38.09 (1/4/2018) 37.33 (4/4/2016)
34.61 (8/4/2018) 34.13 (11/4/2018)
32.66 (17/4/1922)
37.70 (1/4/2014) 37.90 (1/4/1961) 37.18 (12/4/2015)
34.32 (8/4/2005) 33.99 (3/4/1986)
32.60 (1/4/2014) 37.67 (1/4/2005) 37.84 (2/4/2018) 37.00 (3/4/1957)
34.30 (7/4/2018) 33.94 (10/4/2018)
32.37 (14/4/2004)
37.65 (9/4/2005) 37.57 (1/4/2005) 36.89 (4/4/1958)
34.28 (4/4/2012) 33.74 (9/4/2018)
32.28 (9/4/2005) 37.49 (2/4/2005) 37.51 (2/4/1961) 36.67 (1/4/1972)
34.26 (12/4/2005)
33.11 (6/4/1938)
32.11 (4/4/1986) 37.40 (3/4/1986) 37.47 (2/4/1914) 36.60 (3/4/2016)
34.23 (4/4/2016) 32.78 (1/4/2018)
31.68 (3/4/1986) 37.05 (2/4/1986) 37.47 (2/4/2014) 36.58 (2/4/1965)
34.19 (3/4/2012) 32.39 (8/4/2018)
31.67 (2/4/2005) 36.76 (8/4/2018) 37.44 (6/4/2016) 36.41 (7/4/2018)
34.14 (9/4/1985) 32.33 (8/4/1998)
31.48 (5/4/1938) 36.76 (11/4/1985)
37.38 (4/4/1961) 36.36 (9/4/1985)
34.13 (1/4/2018) 32.29 (1/4/1936)
31.46 (10/4/2018)
36.60 (12/4/1985)
37.38 (14/4/2015)
36.27 (6/4/2018)
Table 2: The 10 warmest (area-averaged) days on record for Australia and selected States and Territories. Values occurring in April 2018 are shown in bold.
Special Climate Statement 65—persistent summer-like heat sets many April records
18
Site number
Site name State/ Territory
Value ( °C)
Date Previous record
2012 Halls Creek WA 40.3 5 April 39.6 (3/4/2005)
2056/2038 Kununurra WA 40.1 2 April 40.0 (11/4/1990)
4032 Port Hedland WA 42.8 7 April 42.5 (4/4/2016)
4090/4035 Roebourne WA 43.7 3 April 43.4 (3/4/1972)
5007 Learmonth WA 42.5 6 April 41.8 (4/4/2016)
11003 Eucla WA 42.0 9 April 41.1 (3/4/1938)
11052/11004 Forrest WA 40.9 9 April 40.1 (1/4/1986)
14305/14902/ 14903/14904
Katherine NT 38.7 3 April 38.3 (13/4/1961)
14825 Victoria River Downs NT 40.6 (=) 1 April 40.6 (6/4/1966)
17110/17005 Leigh Creek SA 37.8 11 April 37.3 (2/4/2005)
18012 Ceduna SA 41.3 9 April 40.8 (9/4/2005)
18014 Cleve SA 38.1 9 April 38.0 (2/4/2005)
18079 Streaky Bay SA 38.1 9 April 37.5 (1/4/2009)
18201/16092/ 19066/19036
Port Augusta SA 40.3 10 April 38.7 (1/4/2014)
19017 Hawker SA 37.0 (=) 10 April 37.0 (2/4/2005)
21139/21118/ 21043
Port Pirie SA 39.0 10 April 37.7 (2/4/2005)
22018 Warooka SA 33.5 10 April 33.2 (3/4/1986)
22841/22807 Kingscote SA 34.4 9 April 33.9 (9/4/2005)
23013 Parafield SA 38.2 (=) 11 April 38.2 (9/4/2005)
23090/23000 Adelaide SA 36.9 (=) 11 April 36.9 (2/4/2005, 9/4/2005)
23733 Mount Barker SA 36.0 10 April 35.2 (2/4/2005)
24024/24023 Loxton SA 39.4 10 April 37.9 (4/4/1986)
24048/24016 Renmark SA 39.7 10 April 38.2 (2/4/2005)
24511 Eudunda SA 36.0 10 April 35.8 (2/4/2005)
24521 Murray Bridge SA 39.2 (=) 10 April 39.2 (3/4/1986)
Special Climate Statement 65—persistent summer-like heat sets many April records
19
Site number
Site name State/ Territory
Value ( °C)
Date Previous record
25562/25509 Lameroo SA 39.2 10 April 38.4 (3/4/1986)
46012/46043 Wilcannia NSW 39.2 11 April 38.4 (3/4/1986)
46129/46042 White Cliffs NSW 38.0 11 April 37.9 (9/4/2002)
47016 Lake Victoria NSW 39.2 10 April 38.1 (4/4/1986)
47019 Menindee NSW 40.1 10 April 38.5 (10/4/2005)
48027 Cobar MO NSW 36.9 10 April 36.0 (4/4/1986)
49000/49019 Ivanhoe NSW 39.0 (=) 10 April 39.0 (4/4/1986)
49002 Balranald NSW 39.0 11 April 37.6 (3/4/1986)
56013 Glen Innes Ag Res Stn NSW 28.5 (=) 10 April 28.5 (4/4/1986)
63039 Katoomba NSW 29.6 11 April 28.7 (4/4/1986)
65034 Wellington NSW 33.9 (=) 9 April 33.9 (6/4/2016)
66037 Sydney Airport NSW 36.8 9 April 35.7 (4/4/1986)
66062 Sydney NSW 35.4 9 April 34.2 (6/4/2016)
68151/68034 Point Perpendicular NSW 32.3 12 April 31.2 (4/4/1986)
69017 Montague Island NSW 32.3 12 April 32.2 (11/4/1969)
69022 Narooma NSW 34.0 12 April 32.2 (11/4/1969)
69137/69055 Green Cape NSW 33.2 12 April 28.3 (11/4/1969)
69139/69002 Bega NSW 36.5 12 April 35.6 (28/4/1994)
69147/69093 Merimbula NSW 36.1 12 April 36.0 (8/4/1998)
70005 Bombala NSW 31.1 11 April 30.9 (2/4/2005)
71041 Thredbo Village NSW 24.5 (=) 11 April 24.5 (4/4/1986)
72150 Wagga Wagga NSW 35.8 11 April 35.4 (4/4/1986)
74106 Tocumwal NSW 37.8 11 April 37.0 (4/4/1986)
74110 Corowa NSW 37.0 11 April 36.5 (4/4/1986)
74148/74221 Narrandera NSW 38.1 11 April 37.0 (4/4/1986)
74258/74128 Deniliquin NSW 39.0 11 April 37.6 (4/4/1986)
75019/75031 Hay NSW 39.4 11 April 37.3 (3/4/1986)
Special Climate Statement 65—persistent summer-like heat sets many April records
20
Site number
Site name State/ Territory
Value ( °C)
Date Previous record
75032 Hillston NSW 38.2 11 April 36.6 (4/4/1986)
75039 Lake Cargelligo NSW 36.2 11 April 35.2 (15/4/2004)
75041/75174/ 75028
Griffith NSW 38.3 11 April 36.1 (4/4/1986)
76031 Mildura VIC 39.3 10 April 37.8 (4/4/1986)
76047 Ouyen VIC 39.0 10 April 37.0 (4/4/1986)
76064 Walpeup VIC 38.9 11 April 37.4 (4/4/1986)
77094/77042 Swan Hill VIC 39.0 11 April 36.9 (10/4/2005)
78015/78031 Nhill VIC 36.8 (=) 11 April 36.8 (3/4/1986)
78077 Warracknabeal VIC 37.2 11 April 36.8 (3/4/1986)
79028 Longerenong VIC 37.0 11 April 36.1 (1/4/2014)
79100/79023 Horsham VIC 37.0 11 April 36.5 (1/4/2014)
80015 Echuca VIC 38.2 11 April 36.4 (4/4/1986)
80023 Kerang VIC 39.1 11 April 37.0 (10/4/2005)
80091 Kyabram VIC 36.6 11 April 36.0 (4/4/1986)
81123/81003 Bendigo VIC 34.3 11 April 33.7 (14/4/2004, 10/4/2005)
82039 Rutherglen VIC 35.5 (=) 11 April 35.5 (4/4/1986)
83090/83025 Omeo VIC 31.4 11 April 31.1 (12/4/1968)
84016 Gabo Island VIC 36.5 12 April 35.0 (4/4/1986)
88043 Maryborough VIC 35.7 11 April 34.3 (3/4/1986)
88110/88014 Castlemaine VIC 34.0 11 April 33.0 (4/4/1986)
Table 3: Locations with 40 years or more of data which have set April record-high maximum temperatures during April 2018. Locations in the Bureau's ACORN-SAT dataset are shown in bold.
Special Climate Statement 65—persistent summer-like heat sets many April records
21
Site number
Site name State/ Territory
Value ( °C)
Date Previous record
5007 Learmonth WA 27.7 4 April 27.6 (14/4/1981)
5026 Wittenoom WA 29.7 (=) 5 April 29.7 (4/4/1986)
15131/15089 Elliott NT 27.6 3 April 26.5 (13/4/1990)
18040 Kimba SA 22.5 10 April 21.6 (10/4/2005)
18192/18070 Port Lincoln SA 22.3 10 April 20.9 (1/4/2005)
23887/23818 Kuitpo SA 23.7 10 April 22.0 (10/4/2005)
47019 Menindee NSW 24.9 12 April 22.9 (6/4/1992)
49002 Balranald NSW 24.0 12 April 22.4 (18/4/1980)
50017/73054 West Wyalong NSW 21.4 12 April 20.2 (6/4/1989)
50052 Condobolin Ag NSW 21.8 12 April 21.5 (7/4/1996)
61366/61273 Norah Head NSW 22.1 13 April 21.5 (18/4/1980)
66037 Sydney Airport NSW 23.1 14 April 22.2 (1/4/1959)
66137 Bankstown NSW 22.8 14 April 20.2 (20/4/2006)
67105/67033 Richmond NSW 21.8 14 April 21.2 (1/4/1959)
68072/68076 Nowra NSW 23.4 13 April 20.5 (5/4/1986)
68151/68034 Point Perpendicular NSW 23.7 13 April 23.0 (5/4/1986)
68192 Camden NSW 20.6 14 April 19.4 (10/4/1978)
71075/71072 Perisher Valley NSW 12.4 12 April 11.5 (6/4/1989)
73014 Grenfell NSW 20.5 13 April 19.6 (6/4/1977)
74106 Tocumwal NSW 21.3 12 April 20.1 (3/4/2005)
74148/74221 Narrandera NSW 23.7 12 April 20.9 (3/4/2005)
74258/74128 Deniliquin NSW 24.8 12 April 23.1 (3/4/2005)
75019/75031 Hay NSW 23.9 12 April 23.4 (3/4/2005)
75032 Hillston NSW 23.0 12 April 22.2 (6/4/1958)
75041 Griffith NSW 24.3 12 April 24.0 (10/4/2005)
77094/77042 Swan Hill VIC 22.9 12 April 22.6 (6/4/1987)
80023 Kerang VIC 24.2 12 April 22.1 (3/4/2005)
Special Climate Statement 65—persistent summer-like heat sets many April records
22
Site number
Site name State/ Territory
Value ( °C)
Date Previous record
80091 Kyabram VIC 22.4 12 April 21.1 (3/4/2005)
81049 Tatura VIC 20.9 12 April 20.5 (15/4/2004)
81123/81003 Bendigo VIC 19.3 11 April 19.2 (6/4/1987)
81125/81084/ 81044
Shepparton VIC 21.7 12 April 20.7 (3/4/2005)
88043 Maryborough VIC 22.0 12 April 19.5 (5/4/1981)
88110/88014 Castlemaine VIC 21.5 (=) 12 April 21.5 (10/4/2005)
Table 4: Locations with 40 years or more of data which have set April record-high minimum temperatures during April 2018. Locations in the Bureau's ACORN-SAT dataset are shown in bold.
Special Climate Statement 65—persistent summer-like heat sets many April records
23
Site number
Site name State/ Territory
Threshold ( °C)
Number of days Previous record
3030 Bidyadanga WA 40 4 (3-6 April) 3 (3 times, most recent 4-6/4/2009)
4032 Port Hedland WA 40 5 (3-7 April) 4 (13-16/4/2005)
5007 Learmonth WA 40 6 (3-8 April) 1 (7 times, most recent 4/4/2016)
14825 Victoria River Downs NT 40 2 (1-2 April) 1 (6/4/1966)
2012 Halls Creek WA 38 7 (8-14 April) 5 (3 times, most recent 10-14/4/2005)
14626 Daly Waters NT 38 4 (1-4 April) 3 (1-3/4/1942, 22-24/4/2002)
14840 Wave Hill NT 38 9 (1-9 April) 8 (6-13/4/1998, 2-9/4/2016)
16001 Woomera SA 38 2 (9-10 April) 1 (3 times, most recent 1/4/2014)
18014 Cleve SA 38 2 (9-10 April) 1 (2/4/2005)
18044 Kyancutta SA 38 4 (8-11 April) 2 (3 times, most recent 1-2/4/2005)
24521 Murray Bridge SA 38 3 (9-11 April) 1 (3 times, most recent 1/4/2014)
47019 Menindee NSW 38 3 (9-11 April) 1 (10/4/2005)
75032 Hillston NSW 38 2 (10-11 April) No instances
76031 Mildura VIC 38 2 (10-11 April) No instances
76047 Ouyen VIC 38 2 (10-11 April) No instances
76064 Walpeup VIC 38 2 (10-11 April) No instances
13012 Wiluna WA 35 7 (4-10 April) 6 (2-7/4/1957, 3-8/4/1971)
16001 Woomera SA 35 5 (7-11 April) 3 (3 times, most recent 2-4/4/1992)
18014 Cleve SA 35 4 (8-11 April) 2 (2-3/4/1986, 1-2/4/2005)
18040 Kimba SA 35 4 (8-11 April) 2 (3 times, most recent 1-2/4/2005)
Special Climate Statement 65—persistent summer-like heat sets many April records
24
Site number
Site name State/ Territory
Threshold ( °C)
Number of days Previous record
18044 Kyancutta SA 35 5 (7-11 April) 4 (3-6/4/1938, 8-11/4/1991)
19017 Hawker SA 35 4 (8-11 April) 3 (2-4/4/1986)
21133/21046 Snowtown SA 35 4 (8-11 April) 3 (2-4/4/1986, 2-4/4/1992)
23090/23000 Adelaide SA 35 3 (9-11 April) 1 (6 times, most recent 1/4/2014)
23013 Parafield SA 35 3 (9-11 April) 2 (3-4/4/1992, 1-2/4/2005)
23083 Edinburgh SA 35 4 (8-11 April) 2 (3-4/4/1992, 1-2/4/2005)
23343 Turretfield SA 35 4 (8-11 April) 2 (4 times, most recent 13-14/4/2004)
23373/23321 Nuriootpa SA 35 3 (9-11 April) 1 (4 times, most recent 1/4/2014)
23733 Mount Barker SA 35 2 (10-11 April) 1 (4 times, most recent 1/4/2014)
24511 Eudunda SA 35 2 (9-10 April) 1 (4 times, most recent 1/4/2014)
24521 Murray Bridge SA 35 4 (8-11 April) 2 (3 times, most recent 8-9/4/2005)
25507 Keith SA 35 3 (9-11 April) 1 (8 times, most recent 1/4/2014)
46012/46043 Wilcannia NSW 35 6 (8-13 April) 4 (1-4/4/1986, 12-15/4/2004)
47019 Menindee NSW 35 5 (8-12 April) 3 (13-15/4/2004)
48027 Cobar NSW 35 3 (9-11 April) 2 (15-16/4/2004)
49002 Balranald NSW 35 3 (9-11 April) 2 (1-2/4/2005, 9-10/4/2005)
50017/73054 West Wyalong NSW 35 3 (9-11 April) 2 (3-4/4/1986)
51049 Trangie NSW 35 2 (9-10 April) 1 (4/4/1986, 6/4/2016)
74034 Corowa NSW 35 2 (11-12 April) 1 (4/4/1986)
75032 Hillston NSW 35 5 (8-12 April) 2 (3-4/4/1986)
Special Climate Statement 65—persistent summer-like heat sets many April records
25
Site number
Site name State/ Territory
Threshold ( °C)
Number of days Previous record
75039 Lake Cargelligo NSW 35 5 (8-12 April) 1 (3/4/1986, 15/4/2004)
75041 Griffith NSW 35 4 (9-12 April) 2 (14-15/4/2004)
76031 Mildura VIC 35 4 (8-11 April) 2 (3 times, most recent 9-10/4/2005)
76047 Ouyen VIC 35 4 (8-11 April) 2 (3 times, most recent 9-10/4/2005)
76064 Walpeup VIC 35 4 (8-11 April) 2 (12-13/4/1985, 3-4/4/1986)
78077 Warracknabeal VIC 35 2 (10-11 April) 1 (4 times, most recent 1/4/2014)
11017 Balladonia WA 32 6 (4-9 April) 5 (2-6/4/1971, 5-9/4/1991)
15511 Curtin Springs NT 32 13 (1-13 April) 12 (3-14/4/2004)
17099 Arkaroola SA 32 6 (7-12 April) 5 (3 times, most recent 11-15/4/2004)
18014 Cleve SA 32 5 (7-11 April) 4 (8-11/4/1991)
19062 Yongala SA 32 4 (8-11 April) 3 (11-13/4/1985, 2-4/4/1986)
23013 Parafield SA 32 4 (8-11 April) 3 (4 times, most recent 9-11/4/2007)
23034 Adelaide Airport SA 32 4 (8-11 April) 3 (9-11/4/1991)
23083 Edinburgh SA 32 4 (8-11 April) 3 (4 times, most recent 2-4/4/1992)
23343 Turretfield SA 32 5 (7-11 April) 4 (8-11/4/1991)
23373/23321 Nuriootpa SA 32 4 (8-11 April) 3 (2-4/4/1986)
23733 Mount Barker SA 32 4 (8-11 April) 2 (5 times, most recent 1-2/4/2009)
24511 Eudunda SA 32 4 (8-11 April) 3 (2-4/4/1986)
25507 Keith SA 32 4 (8-11 April) 2 (15 times, most recent 1-2/4/2009)
46012/46043 Wilcannia NSW 32 10 (4-13 April) 8 (6-13/4/2005)
Special Climate Statement 65—persistent summer-like heat sets many April records
26
Site number
Site name State/ Territory
Threshold ( °C)
Number of days Previous record
46126/46037 Tibooburra NSW 32 13 (1-13 April) 9 (9-17/4/1980, 6-14/4/2005)
48027 Cobar NSW 32 13 (1-13 April) 7 (10-16/4/2004)
48031 Collarenebri NSW 32 11 (1-11 April) 7 (2-8/4/1992)
48245/48239/ 48013
Bourke NSW 32 14 (1-14 April) 9 (11-19/4/2005)
50017/73054 West Wyalong NSW 32 6 (8-13 April) 3 (3 times, most recent 14-16/4/2004)
50031 Peak Hill NSW 32 10 (2-11 April) 3 (3 times, most recent 4-6/4/2016)
50052 Condobolin Ag NSW 32 10 (4-13 April) 3 (4 times, most recent 4-6/4/2016)
51049 Trangie NSW 32 11 (1-11 April) 5 (2-6/4/2016)
52088/52026 Walgett NSW 32 11 (1-11 April) 7 (5-11/4/1940, 4-10/4/1957)
65070/65012 Dubbo NSW 32 4 (8-11 April) 3 (1-3/4/1922, 18-20/4/1922)
68072/68076 Nowra NSW 32 3 (11-13 April) 2 (3-4/4/1986)
73014 Grenfell NSW 32 4 (8-11 April) 3 (2-4/4/1986)
74258/74128 Deniliquin NSW 32 5 (8-12 April) 3 (1-3/4/1954, 3-5/4/1958)
75032 Hillston NSW 32 6 (8-13 April) 4 (1-4/4/1986)
75039 Lake Cargelligo NSW 32 10 (4-13 April) 3 (7 times, most recent 8-10/4/2005)
75041 Griffith NSW 32 6 (8-13 April) 3 (8-10/4/2005)
76031 Mildura VIC 32 4 (8-11 April) 3 (8 times, most recent 8-10/4/2005)
76047 Ouyen VIC 32 4 (8-11 April) 3 (6 times, most recent 8-10/4/2005)
76064 Walpeup VIC 32 4 (8-11 April) 3 (4 times, most recent 8-10/4/2005)
78015/78031 Nhill VIC 32 4 (8-11 April) 3 (11-13/4/1985, 2-4/4/1986)
Special Climate Statement 65—persistent summer-like heat sets many April records
27
Site number
Site name State/ Territory
Threshold ( °C)
Number of days Previous record
78077 Warracknabeal VIC 32 4 (8-11 April) 3 (3 times, most recent 8-10/4/2005)
79028 Longerenong VIC 32 4 (8-11 April) 3 (11-13/4/1985)
80023 Kerang VIC 32 4 (8-11 April) 3 (11-13/4/1985)
22018 Warooka SA 30 4 (8-11 April) 3 (2-4/4/1992, 10-12/4/2007)
23373/23321 Nuriootpa SA 30 4 (8-11 April) 3 (7 times, most recent 9-11/4/1991)
24511 Eudunda SA 30 4 (8-11 April) 4 (10-13/4/1985)
43020 Mitchell QLD 30 15 (1-15 April) 13 (12-24/4/2004, 15-27/4/2007)
48027 Cobar NSW 30 13 (1-13 April) 9 (6-14/4/2005)
50017/73054 West Wyalong NSW 30 10 (4-13 April) 7 (7-13/4/2005)
50031 Peak Hill NSW 30 12 (2-13 April) 7 (10-16/4/2004)
50052 Condobolin Ag NSW 30 13 (1-13 April) 8 (7-14/4/2004)
51049 Trangie NSW 30 13 (1-13 April) 7 (10-16/4/2004)
53115/53048 /53027
Moree NSW 30 11 (1-11 April) 10 (3-12/4/2005, 1-10/4/2016)
64009 Dunedoo NSW 30 8 (6-13 April) 5 (4-8/4/1998, 3-7/4/2016)
65034 Wellington NSW 30 11 (1-11 April) 6 (1-6/4/1984, 2-7/4/2016)
65070/65012 Dubbo NSW 30 13 (1-13 April) 6 (16-21/4/1922)
72043 Tumbarumba NSW 30 2 (11-12 April) 1 (6/4/1986)
72150 Wagga Wagga NSW 30 6 (8-13 April) 4 (1-4/4/1986)
73014 Grenfell NSW 30 13 (1-13 April) 4 (1-4/4/1986)
75039 Lake Cargelligo NSW 30 13 (1-13 April) 8 (7-14/4/2005)
79028 Longerenong VIC 30 4 (8-11 April) 3 (4 times, most recent 8-10/4/2005)
82039 Rutherglen VIC 30 5 (9-13 April) 3 (3 times, most recent 13-15/4/1980)

Special Climate Statement 65—persistent summer-like heat sets many April records
28
Site number
Site name State/ Territory
Threshold ( °C)
Number of days Previous record
88023 Lake Eildon VIC 30 3 (10-12 April) 2 (4 times, most recent 1-2/4/2009)
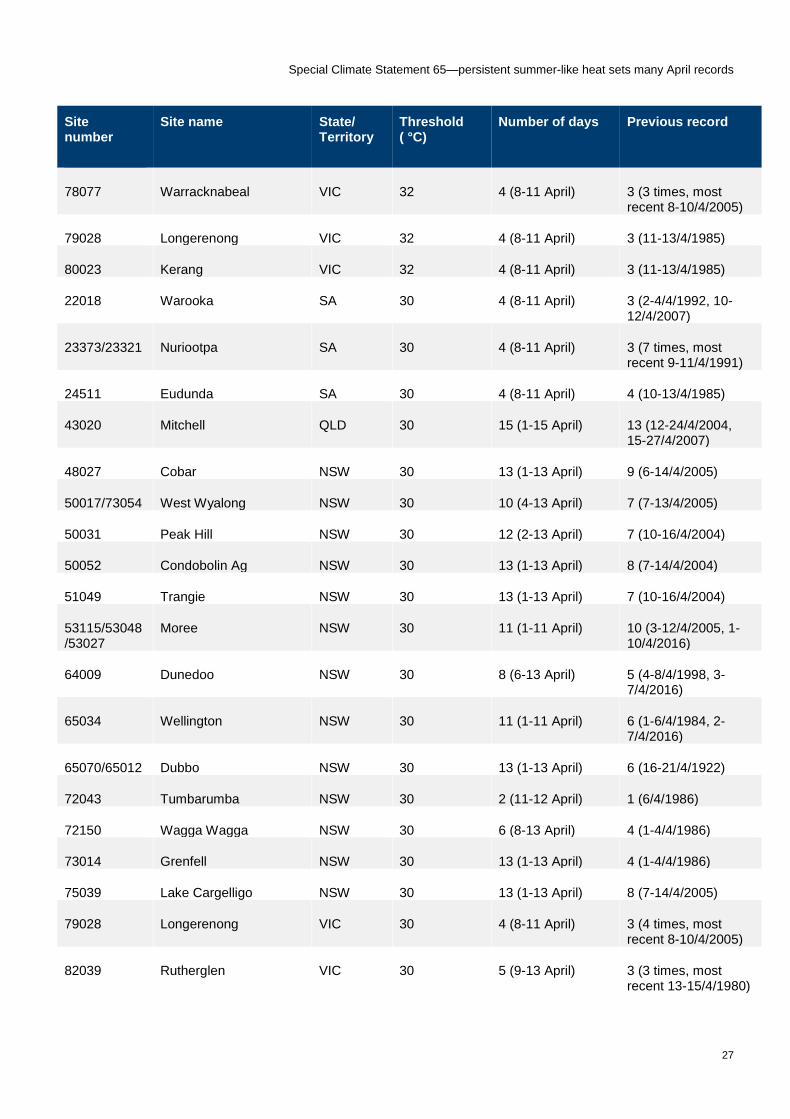
Table 5: Selected locations with records for the greatest number of consecutive April days with maximum temperatures above specified thresholds. Single days at locations which had not previously exceeded that threshold are not shown.
Special Climate Statement 65—persistent summer-like heat sets many April records
29
Region Maximum temperature Minimum temperature Mean temperature
Anomaly (°C)
Rank Previous record
Anomaly (°C)
Rank Previous record
Anomaly (°C)
Rank Previous record
Australia +3.17 1 +3.10 (2005)
+1.59 4 +2.22 (2005)
+2.38 2 +2.66 (2005)
WA +2.99 2 +3.06 (1981)
+1.18 9 +2.28 (2005)
+2.09 3 +2.45 (2005)
NT +3.24 2 +3.26 (2005)
+1.44 13 +2.53 (2005)
+2.34 2 +2.90 (2005)
SA +4.40 1 +4.33 (2005)
+2.43 3 +2.59 (1961)
+3.42 1 +3.40 (2005)
Queensland +2.22 5 +2.91 (2016)
+1.58 7 +2.47 (2016)
+1.90 4 +2.69 (2016)
NSW +4.28 1 +4.08 (2005)
+2.31 3 +2.41 (1990)
+3.30 1 +3.20 (2005)
Victoria +3.45 2 +3.66 (2005)
+0.94 14 +2.09 (1974)
+2.20 2 +2.45 (2005)
Tasmania +0.43 26 +1.62 (2002)
+0.60 19 +1.67 (2010)
+0.52 22 +1.45 (1989)
Table 6: National and State/Territory monthly temperature anomalies for April 2018.
Region Anomaly (°C)
Rank Previous record
Australia +1.32 1 +1.28 (2016)
WA +0.71 9 +1.64 (2005)
NT +1.11 7 +1.33 (1986)
SA +1.98 1 +1.43 (2007)
Queensland +1.43 3 +1.68 (2016)
NSW +2.39 1 +1.97 (2017)
Victoria +1.68 1 +1.64 (1968)
Tasmania +0.72 13 +1.41 (2016)
Table 7. National and State/Territory mean temperature anomalies for January to April 2018.
Special Climate Statement 65—persistent summer-like heat sets many April records
30
Site number
Site name State/ Territory
Value ( °C)
Previous record
4032 Port Hedland WA 38.9 38.4 (2016)
5007 Learmonth WA 37.2 35.9 (2016)
5026 Wittenoom WA 37.6 36.7 (2016)
14825 Victoria River Downs NT 37.9 37.8 (1966)
16001 Woomera SA 30.5 29.9 (2005)
16098/16044 Tarcoola SA 31.5 31.1 (1981)
17126/17031 Marree SA 32.9 32.8 (2005)
18044 Kyancutta SA 30.1 29.7 (2005)
18192/18070 Port Lincoln SA 25.3 24.7 (1994)
21133/21046 Snowtown SA 28.5 28.2 (1923)
22823/22801 Cape Borda SA 21.8 21.6 (2005)
23373/23321 Nuriootpa SA 25.6 25.3 (2005)
26026 Robe SA 22.2 21.8 (1923)
45025/45017 Thargomindah QLD 33.2 33.1 (2016)
46012/46043 Wilcannia NSW 31.3 30.9 (2005)
48027 Cobar NSW 30.8 30.2 (2005)
50017/73054 West Wyalong NSW 29.0 28.0 (2005)
61078 Williamtown NSW 26.3 26.2 (1986)
63005 Bathurst NSW 25.3 25.1 (2005)
65070/65012 Dubbo NSW 29.1 28.6 (1922)
66062 Sydney NSW 26.1 25.6 (1922)
67105/67033 Richmond NSW 28.1 26.9 (1986)
68072/68076 Nowra NSW 25.2 (=) 25.2 (1968)
70351/70014/70099 Canberra ACT 25.0 24.5 (2005)
72150 Wagga Wagga NSW 27.7 27.3 (2005)
72161/72091 Cabramurra NSW 16.6 15.7 (2005)
74258/74128 Deniliquin NSW 27.5 26.7 (2005)

Special Climate Statement 65—persistent summer-like heat sets many April records
31
Site number
Site name State/ Territory
Value ( °C)
Previous record
76031 Mildura VIC 28.1 27.5 (2005)
82039 Rutherglen VIC 26.9 26.3 (2005)
84145/84030 Orbost VIC 23.8 23.6 (1980)
Table 8: ACORN-SAT locations which had their highest April mean monthly maximum temperature on record in April 2018. Only the most recent year of previous records is shown.
Special Climate Statement 65—persistent summer-like heat sets many April records
32
Site number
Site name State/ Territory
Threshold ( °C)
Number of days Previous record
2012 Halls Creek WA 40 1 Not previously observed
4032 Port Hedland WA 40 10 8 (2005)
5007 Learmonth WA 40 6 2 (2016)
14825 Victoria River Downs NT 40 2 1 (1966)
5007 Learmonth WA 35 24 21 (2016)
5026 Wittenoom WA 35 27 25 (2010)
13017 Giles WA 35 11 9 (2005)
16098/16044 Tarcoola SA 35 9 5 (2005)
21133/21046 Snowtown SA 35 4 3 (1992)
23090/23000 Adelaide SA 35 3 2 (2005)
23373/23321 Nuriootpa SA 35 3 2 (2005)
46012/46043 Wilcannia NSW 35 7 5 (2004)
48027 Cobar NSW 35 5 2 (2004)
48245/48239/48013 Bourke NSW 35 8 6 (1922)
50017/73054 West Wyalong NSW 35 3 2 (1986)
66062 Sydney NSW 35 1 Not previously observed
76031 Mildura VIC 35 4 3 (2005)
26026 Robe SA 30 2 1 (1986)
39083 Rockhampton QLD 30 21 20 (2007)
48027 Cobar NSW 30 19 18 (2005)
60139/60026 Port Macquarie NSW 30 2 1 (2016)
61078 Williamtown NSW 30 6 4 (2006)
61363/61089 Scone NSW 30 10 8 (2016)
63005 Bathurst NSW 30 4 2 (1986)
65070/65012 Dubbo NSW 30 13 12 (1922)
Special Climate Statement 65—persistent summer-like heat sets many April records
33
Site number
Site name State/ Territory
Threshold ( °C)
Number of days Previous record
67105/67033 Richmond NSW 30 9 7 (1986)
68072/68076 Nowra NSW 30 5 4 (2006)
70351/70014/70099 Canberra ACT 30 3 2 (1986)
72150 Wagga Wagga NSW 30 10 4 (2005)
82039 Rutherglen VIC 30 7 4 (1938)
Table 9. ACORN-SAT locations which observed their largest number of days with maximum temperatures at or above specified thresholds in April 2018. Only the most recent year of previous record is shown.
Special Climate Statement 65—persistent summer-like heat sets many April records
34
References and further information
Data used in this statement is current as of 9 a.m. on 2 May 2018 and is subject to the Bureau's routine quality control processes. Maximum temperature observations prior to 1910 have not been used unless it is known that they were measured using standard equipment comparable to post-1910 standards.
Further information is available from: http://www.bom.gov.au/climate