Embed Size (px)
Citation preview
SPECIAL CLIMATE STATEMENT 24
Frequent heavy rain events in late 2010/early 2011 lead to widespread flooding across eastern
Australia.
First Issued 7th
January 2011
Updated 25th
January 2011
National Climate Centre
Bureau of Meteorology
Cite: National Climate Centre, Bureau of Meteorology 2011. Frequent heavy rain events in late
2010/early 2011 lead to widespread flooding across eastern Australia. Special Climate Statement
24.
This statement is based on preliminary data available as of 23 January 2011, which may be subject
to change as a result of standard quality control procedures.
2
3
Frequent heavy rain events in late 2010/early 2011 lead to widespread flooding across eastern
Australia
The period from late November 2010 to mid January 2011 was extremely wet through much of
eastern Australia. Six major rain events affected large parts of the eastern states during this period,
resulting in widespread flooding on many rivers, culminating in severe flooding (including river
and flash flooding) in Brisbane and nearby areas of south-east Queensland and northern New South
Wales during the second week of January. Other significant floods affected the Fitzroy, Burnett and
Condamine-Balonne catchments in Queensland in late December and early January, the
Murrumbidgee, Lachlan and Castlereagh catchments in inland New South Wales in early
December, and large parts of northern and western Victoria and northern Tasmania in mid-January.
The flooding, in terms of extent, impact and severity, was amongst the most significant in
Australia’s recorded history.
It was the wettest December on record for Queensland and for eastern Australia as a whole, the
second-wettest for the Murray-Darling Basin, the sixth-wettest for Victoria and the eighth-wettest
for New South Wales. For Australia as a whole it was the third-wettest December on record. This
followed an extremely wet spring, the wettest on record for Queensland, New South Wales, eastern
Australia and the Murray-Darling Basin, meaning many catchments were already wet before the
flooding rain. It was Australia’s wettest July to December on record. The continued rains in the first
half of January have resulted in Victoria already exceeding its January monthly record.
The rains of late 2010 have taken place during a strong La Niña event in the Pacific Ocean. The
December Southern Oscillation Index (SOI) was +27.1, the highest December value on record and
the highest monthly value since 1973, whilst other indicators of La Niña also indicate the strongest
event since at least the mid-1970s, and one of the four strongest events of the last century. Previous
strong La Niña events, such as those of 1973/74 and 1955, have also been associated with
widespread and severe flooding in eastern Australia. Sea surface temperatures off the northern
Australian coast in recent months have also been at or near record levels.
Major rain events of the period
There were six major rain events during late November to mid January, concentrated on the periods
28 November to 4 December, 7 to 13 December, 19 to 20 December, 23 to 28 December, 10 to 12
January (in southeast Queensland) and 12 to 15 January (in Victoria, South Australia and
Tasmania).
28 November to 4 December. A trough remained over eastern Australia through this period, with
the southeast predominantly in a humid northerly airstream for the bulk of the period. Total rainfall
for the period (Figure 1a) was widely in the 100-300 mm range on the ranges and western slopes of
southern and central New South Wales, as well as in central Queensland in a band extending from
Mackay southwards to the Emerald area. Falls exceeded 50 mm over most of the eastern two-thirds
of New South Wales and the eastern half of Queensland (except the southeast corner), as well as
large parts of central and northern Victoria. Notable daily falls during this period included 118.6
mm at Young on 29 November, 143.6 mm at Mackay and 100.8 mm at Mudgee on 1 December,
and 228.0 mm at Mount Charlton (near Mackay) on 3 December.
7 to 13 December. A cold front crossed southeastern Australia at the start of the period, initially
reaching South Australia late on the 7th
and then continuing eastwards over the next two days. A
trough developed associated with the front and moved slowly across northern New South Wales
and the southern half of Queensland over the following days, eventually moving off the Queensland
coast on the 13th
. Falls for the period 8 to 13 December (Figure 1b) widely exceeded 50 mm in a
4
number of areas, including eastern South Australia and western Victoria, the upland areas of
northeast Victoria and southeast New South Wales, northwestern Tasmania, much of the
Queensland coast and an inland area in Queensland’s central west. Some falls were locally much
higher, especially as a result of severe thunderstorms in South Australia on the afternoon of the 7th
,
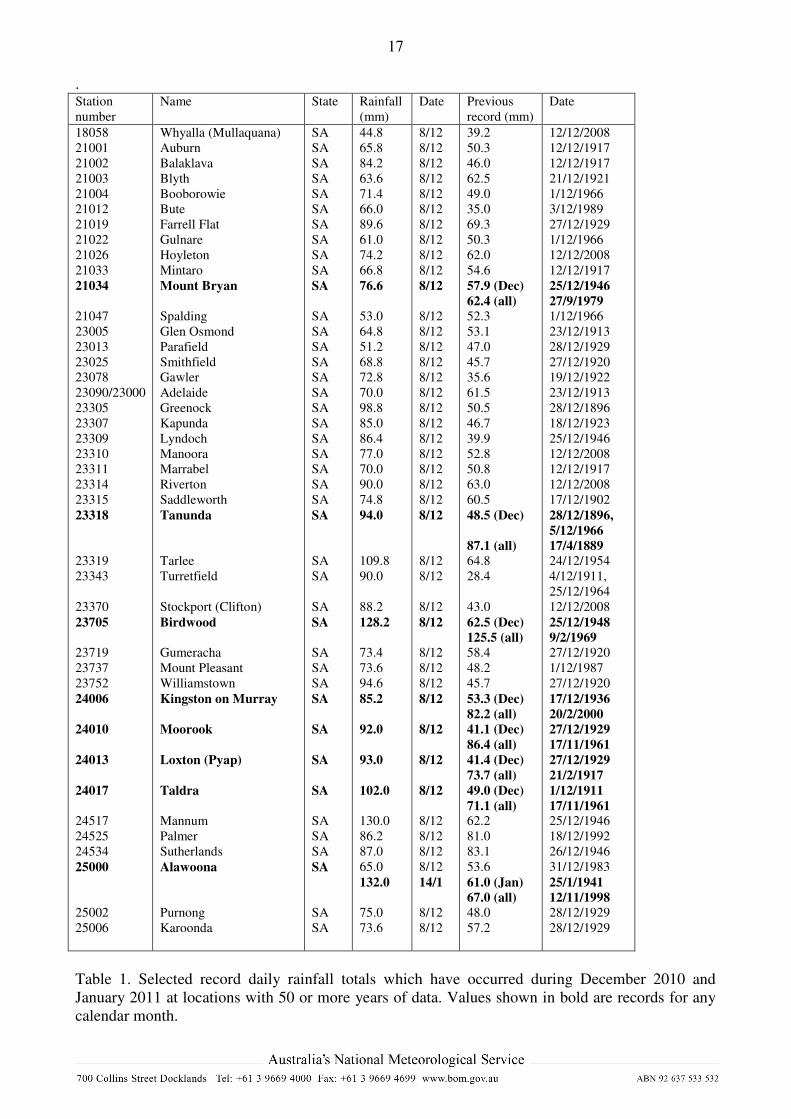
with all-time daily records at some sites and December records at many others (Table 1). Mannum
received 130.0 mm and Birdwood 128.2 mm for the 24 hours to 9 a.m. on the 8th
, while other
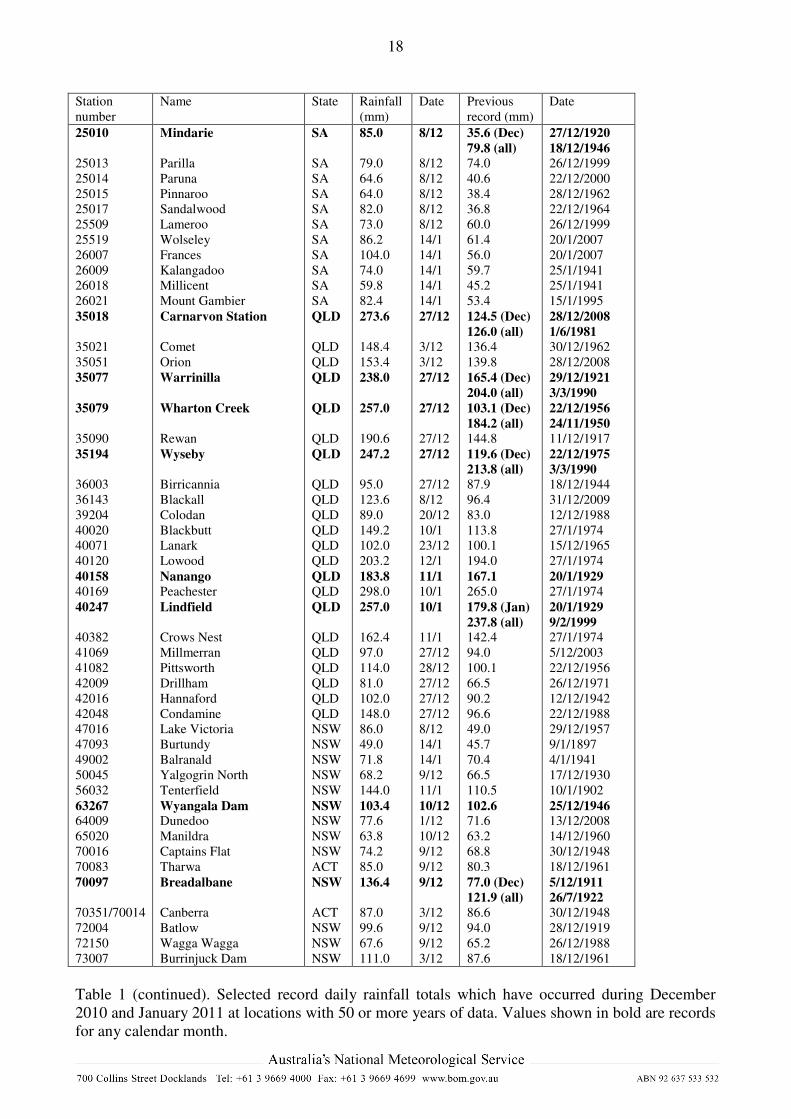
notable daily falls during the period included 127.8 mm at Blackall (Queensland) on the 8th
, 182.0
mm at Rocky Valley (Victoria) on the 9th
, 106.1 mm at Cowra (NSW) on the 10th
and 128.0 mm at
Miriam Vale (Queensland) on the 12th
.
19 to 20 December. A trough moved north over Queensland on 19 and 20 December, associated
with an intense low east of Tasmania (which also brought snow to relatively low levels in Victoria
and southern New South Wales). Whilst no exceptional daily totals occurred, much of southern and
central Queensland received a further 50 to 100 mm for the period (Figure 1c).
23 to 28 December. A moist easterly flow covered much of Queensland for the period 23 to 28
December. Further moisture was brought into the region by the circulation associated with Tropical
Cyclone Tasha, which made landfall south of Cairns on the morning of 25 December. A trough
moved northeast across New South Wales and Queensland from the 26th
, eventually clearing most
of the rain seawards on the 28th
. Rainfall totals for the period (Figure 1d) exceeded 200 mm over a
large area of central eastern Queensland, roughly bounded by Rockhampton, Carnarvon Gorge and
Hervey Bay, with falls exceeding 400 mm in places. Similar falls extended northwards along the
Queensland coast as far north as Cairns, as well as near the Gold Coast and far northern New South
Wales. Much of the eastern half of Queensland received at least 100 mm. The most widespread
intense rainfall was on the 27th
, where a number of stations in the Carnarvon Range area set all-time
daily records with daily totals in excess of 200 mm, peaking at 273.6 mm at Carnarvon Station.
Other very high totals (including 304 mm at Corsis and 294 mm at Babinda) occurred on the north
tropical coast on the 25th
near the landfall of Tasha, while other notable daily totals included 140.2
mm at Rockhampton on the 26th
, 148.0 mm at Condamine on the 27th
and 165.4 mm at Bundaberg
on the 28th
. Further south, falls of 50-100 mm in the NSW Central Tablelands on the 26th
exacerbated flooding in that region.
10 to 12 January. An upper-level low combined with a humid easterly flow to bring very heavy rain
to southeast Queensland and northeast New South Wales. The heaviest falls were in the areas north
and west of Brisbane (Figure 1e). Three-day totals exceeded 200 mm over most of the area bounded
by Brisbane, Gympie and Toowoomba, including the majority of the Brisbane River Catchment.
Further south, totals exceeding 100 mm extended to the coast and adjacent ranges of New South
Wales north of Coffs Harbour, locally approaching 200 mm on parts of the Northern Tablelands,
and also extended into inland southern Queensland as far west as Dalby. The heavy rain covered a
smaller area than was the case in the late December event. The highest daily totals observed in the
Bureau’s regular network were 298.0 mm at Peachester and 282.6 mm at Maleny on 10 January,
while the highest three-day totals were 648.4 mm at Mount Glorious and 617.5 mm at Peachester.
Intense short-period falls also occurred during the event, with one-hour falls in excess of 60 mm
occurring on both 10 and 11 January at numerous stations in various locations north and west of
Brisbane. It is possible that higher short-period falls occurred in areas between observing sites.
12 to 15 January. Tropical air was drawn into a trough near the eastern border of South Australia,
placing much of Victoria, Tasmania and western New South Wales in an extremely moist air mass.
A low formed on the trough on 12 January near Mount Gambier, moving southwest and then
southeast before passing south of Tasmania on the 14th
. The heaviest period of general rain in
Victoria was on the 13th
and the morning of the 14th
, but there was also heavy rain in western border
areas of Victoria on the 12th
. In Tasmania, very heavy rain affected the northern parts of the east
5
coast, and parts of the northwest, on the 13th
, whilst more extensive but less extreme rainfall
extended across large parts of the state’s north on the 14th
. Total rainfalls for the four-day period
exceeded 100 mm in most parts of Victoria north and west of Melbourne, most of New South
Wales west of Wilcannia, and much of northwestern and northeastern Tasmania, where 200 mm
was locally exceeded. In Victoria the highest falls, generally between 150 and 200 mm, were in
upland areas between Ballarat and Horsham, including the Grampians. The most extreme daily falls
during the event were in Tasmania (see below). In Victoria, the highest four-day total was 270.8
mm at Mount William in the Grampians, including daily totals of 134.6 mm on the 12th
and 132.8
mm on the 14th
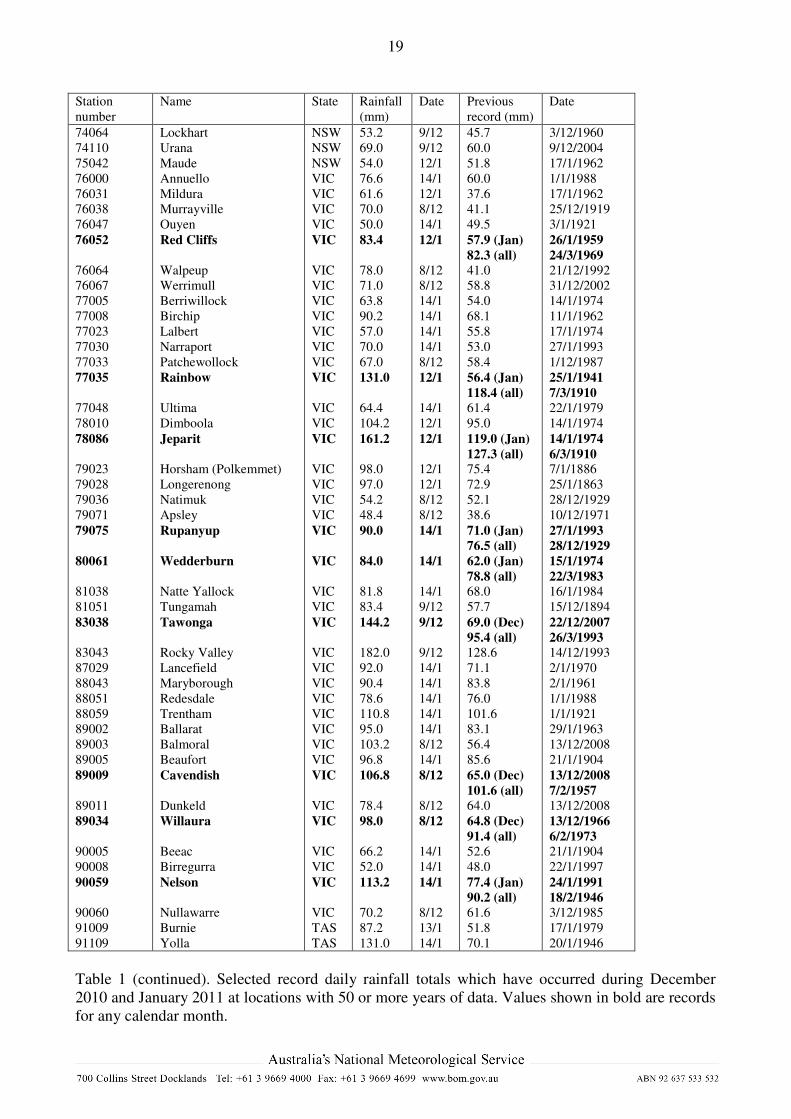
, whilst the highest daily total was 161.2 mm at Jeparit, in the Wimmera, on the 12th
.
A noteworthy feature of this event was the exceptionally high moisture content of the atmosphere
for such a southern location. The total precipitable water in the atmosphere1 at Melbourne on the
13th
was 65.0 mm, well in excess of the previous record of 54.5 mm on 5 February 1973 and a value
more typical of tropical locations such as Darwin. Melbourne’s peak dewpoint2 was 23.7°C at 1800
on the 13th
, falling just short of the city’s record of 24.0°C set on 24 January 1982. The dewpoint
remained above 21°C continuously for 30 hours and above 22°C for 9 hours, both of which rank
second behind an event on 12-14 February 1955.
Extreme daily rainfall totals during the period
Selected daily rainfall records set during December 2010 and January 2011 are listed in Table 1.
The Queensland events were more notable for their extent, particularly the extent of heavy falls
inland from the coast, and duration than for the daily intensity, and only a relatively modest number
of daily records was set during the month.
The greatest concentration of daily rainfall records during the period was in South Australia and
western Victoria on 8 December, mostly as a result of severe thunderstorms on the afternoon and
evening of the 7th
. December is normally a relatively dry month in this region and many stations
exceeded their monthly average in one day. Many daily rainfall records were also set in
southeastern Australia between 12 and 14 January. The greatest number of records occurred in
Victoria, but the highest daily falls were on the east coast of Tasmania on 13 January, where totals
of 282.0 mm at Falmouth, 278.0 mm at Scamander and 250.0 mm at St. Helens (Kellraine)3 all
exceeded the previous Tasmanian January record of 246.9 mm at The Springs (near Mount
Wellington) on 30 January 1916.
Averaged over Queensland, the wettest day of the period was 27 December, with a state-wide
average of 22.0 mm. This was the second-highest on record for the month of December (after 30.7
mm on 22 December 1956) but fell well short of the all-months record of 31.6 mm set on 2 March
2010 (see Special Climate Statement 20). Whilst no individual day approached record levels in the
Murray-Darling Basin, the Basin-wide average daily total exceeded 10 mm on five days during the
period (peaking at 13.7 mm on 28 November) and 5 mm on 14 days (this compares with the
average daily total of about 1.5 mm).
In Victoria, state-wide daily totals were 40.5 mm on 14 January and 33.2 mm on 12 January, with a
three-day total of 85.2 mm from 12-14 January. These daily totals are the two highest on record for
Victoria for January and rank third and seventh respectively for any month, while the three-day
total is a record for any month, breaking the mark of 76.5 mm set from 4-6 February 1973.
1 This is a measure of moisture content through the full depth of the atmosphere. Upper-air observations are currently
taken at Melbourne Airport; in 1973 they were being taken at Laverton. 2 Only 3-hourly data are used to allow consistent comparisons with the available historical data.
3 These sites all have fewer than 50 years of observations and are hence not included in Table 1.
6
Total rainfalls for the period
For the period from 28 November to 17 January (Figure 2), total rainfall exceeded 300 mm over
most of the eastern half of Queensland, except for inland southern border areas. Totals in the 400 to
600 mm range were widespread along most of the Queensland east coast and the NSW coast north
of Coffs Harbour, extending inland to cover many areas in the Central Highlands and adjacent
areas, as well as most of Cape York Peninsula. The inland penetration of the heaviest falls can be
compared with the 1918 event, which led to Rockhampton’s record flood peak; that event,
associated with a tropical cyclone, was concentrated quite close to the coast. Some stations in the
Mackay area and north of Brisbane exceeded 1200 mm, and totals in excess of 800 mm occurred
along several parts of the coast, especially around Mackay, between Cairns and Townsville, and in
coastal and near-coastal areas from Gladstone southwards to Brisbane.
Totals for the period were less extreme in the southeastern states, but were still between 200 and
400 mm over most of Victoria (except Gippsland), the far west of New South Wales, and most of
that state’s eastern half except for coastal areas between Sydney and Port Macquarie. Similar totals
also occurred in northern and western Tasmania. The only parts of the four eastern states not to
receive at least 100 mm for the period were parts of the Channel Country in Queensland and a small
area west of Cunnamulla.
December 2010 was the wettest December on record over most of southeastern Queensland, as well
as some areas further north (Figure 3). It was also the wettest December on record in a band through
central New South Wales between Canberra and Dubbo, and in a broad region on both sides of the
South Australia-Victoria border. All of these regions generally received between three and six times
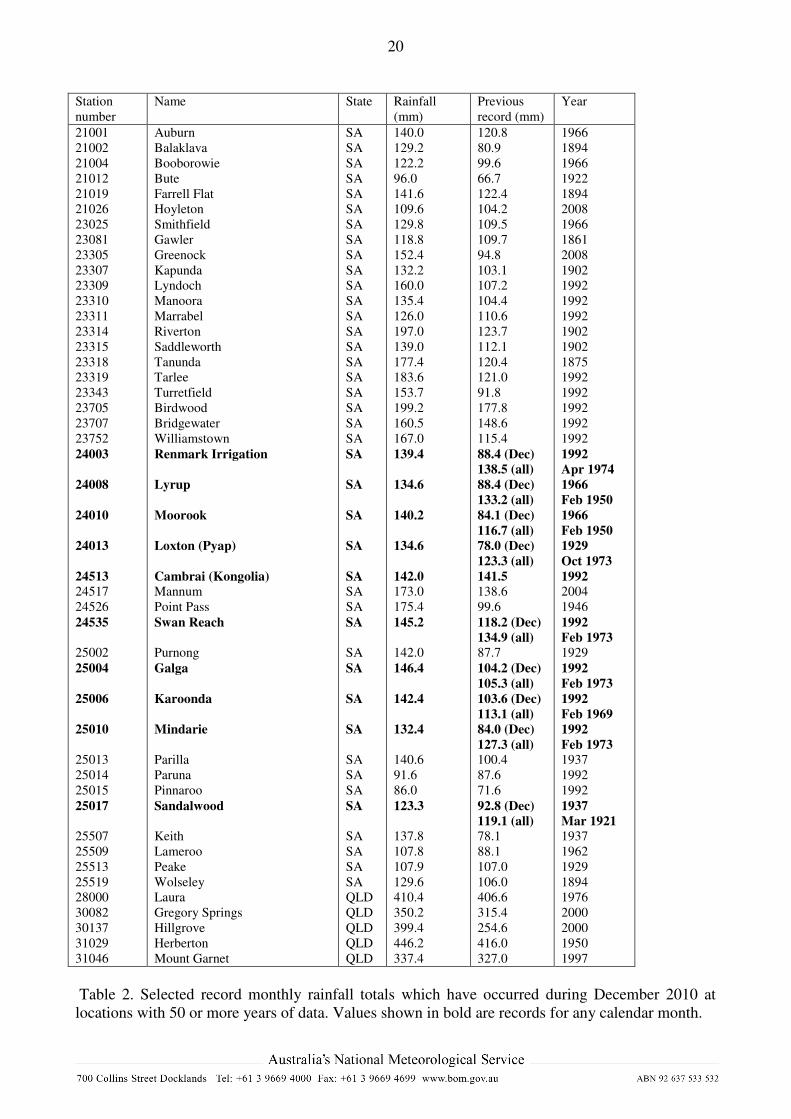
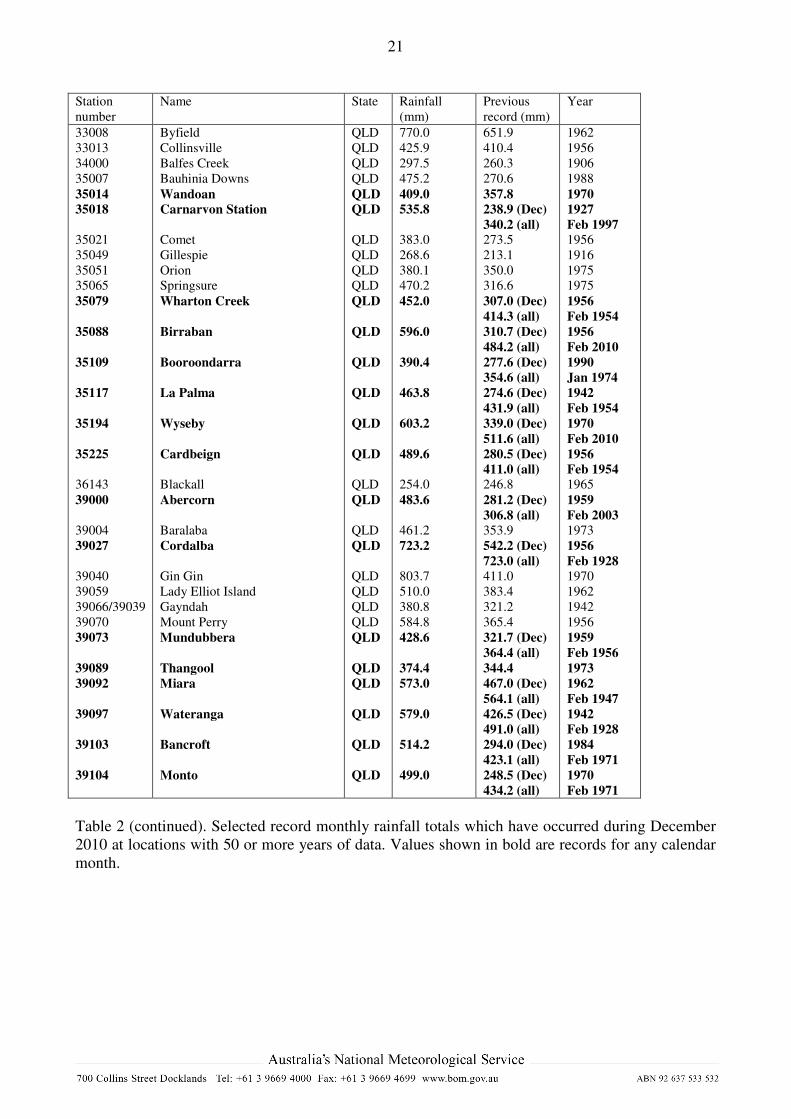
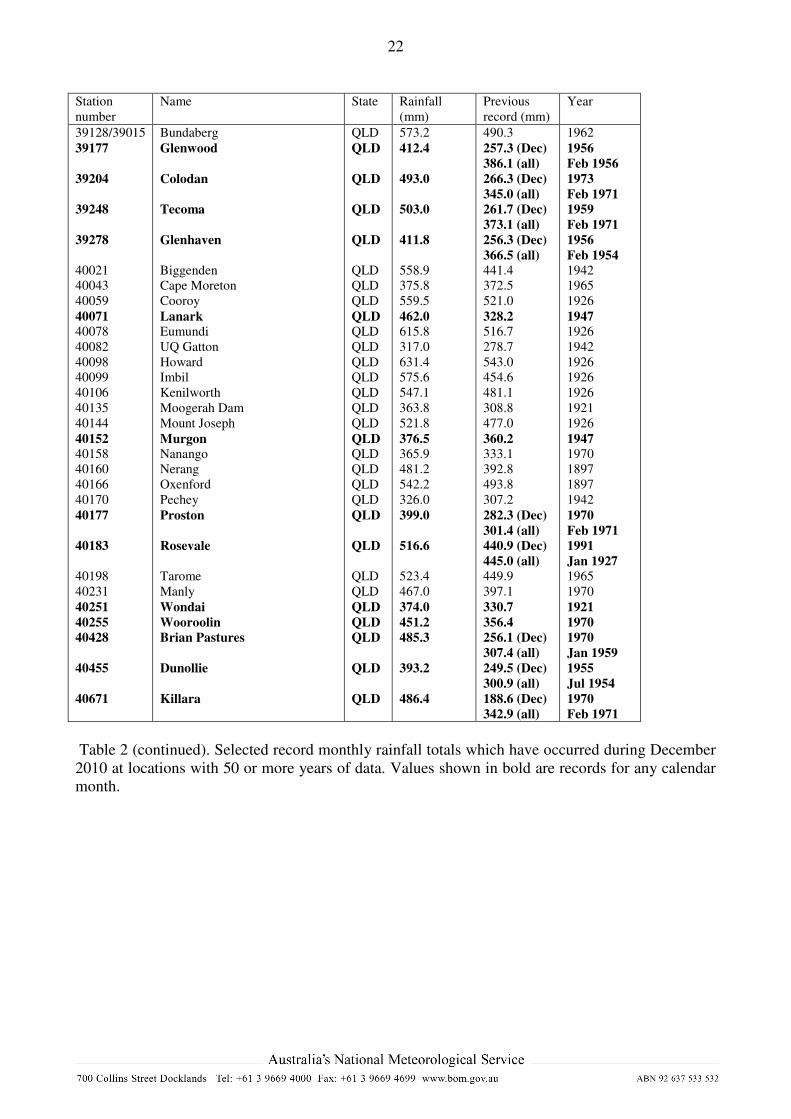
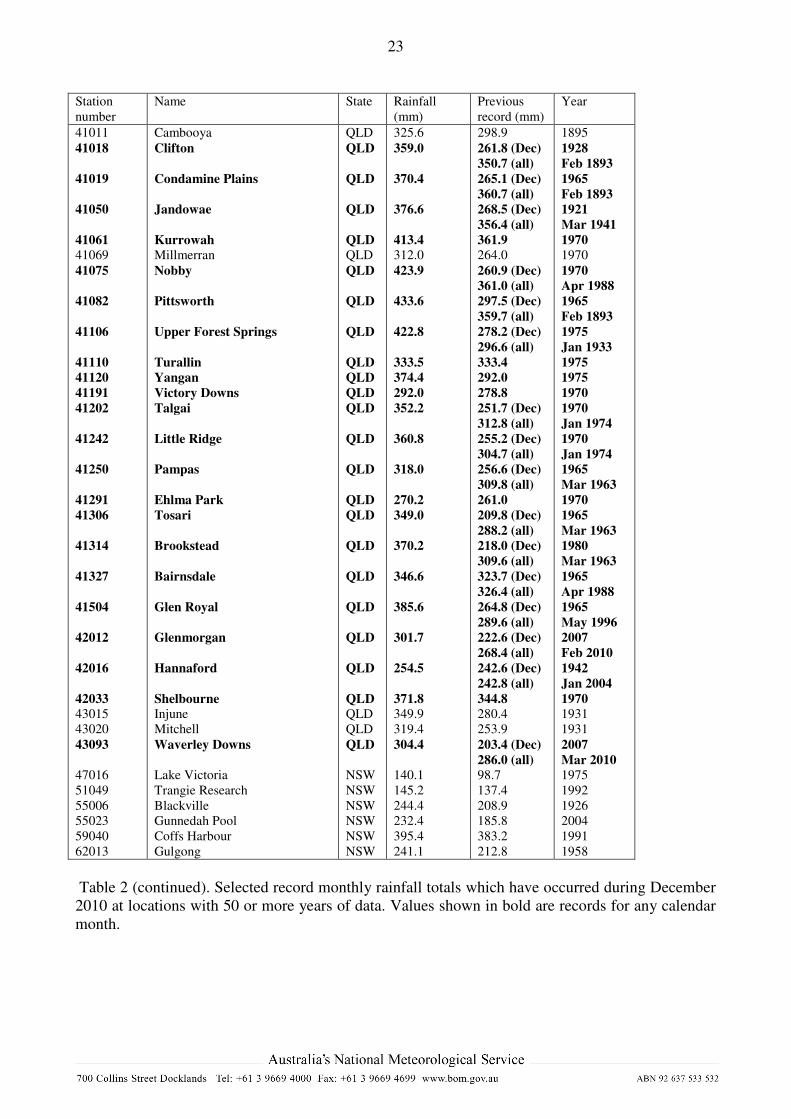
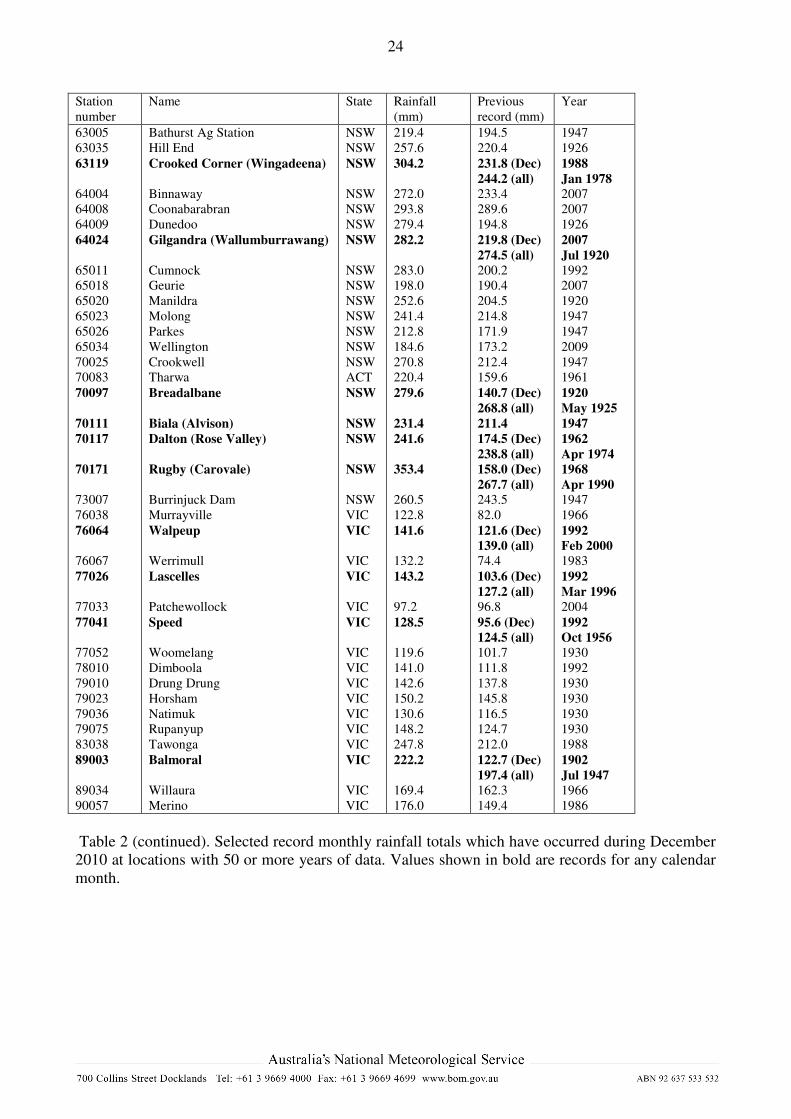
their average December rainfall (Figure 4). At some stations, particularly in Queensland (Table 2),
it was the wettest month (i.e., compared against all calendar months) on record.
On an area-average basis, it was the wettest December on record for eastern Australia4, with the
total of 167.2 mm (132% above normal) surpassing the 154.8 mm set in 1975. Queensland (209.5
mm, 154% above normal) also set a record for the month of December (previously 200.1 mm in
1975), while the figure for the Murray-Darling Basin (107.0 mm, 119% above normal) ranked
second behind the record set in 1992. The December rainfall totals for Victoria (103.9 mm, 118%
above normal) ranked fifth, and for New South Wales (98.9 mm, 83% above normal) ranked eighth.
In some parts of the inland southeast the heaviest rain was split between the months of November
and December and its extreme nature was thus not fully reflected in monthly totals. The New South
Wales township of Young received 346.4 mm in the 13 days from 28 November to 10 December,
more than half its annual mean (662 mm), and more than the 262.4 mm they received in all of 2006,
and well in excess of their wettest calendar month on record (298.9 mm in March 1950). Whilst
such statistics are not extraordinary in the more arid parts of Australia – where a number of stations
in recent years have received their average annual rainfall in a single day – they are highly unusual
for a location in southeastern Australia. Over the same 13-day period, Burrinjuck Dam received
332.0 mm and Canberra 225.0 mm.
In January to date the most exceptional area-averaged totals have been in southeastern Australia,
especially in Victoria. The Victorian state-wide average for the period 1-23 January was 112.1 mm,
which has already exceeded the existing January monthly record of 109.3 mm, set in 1941.
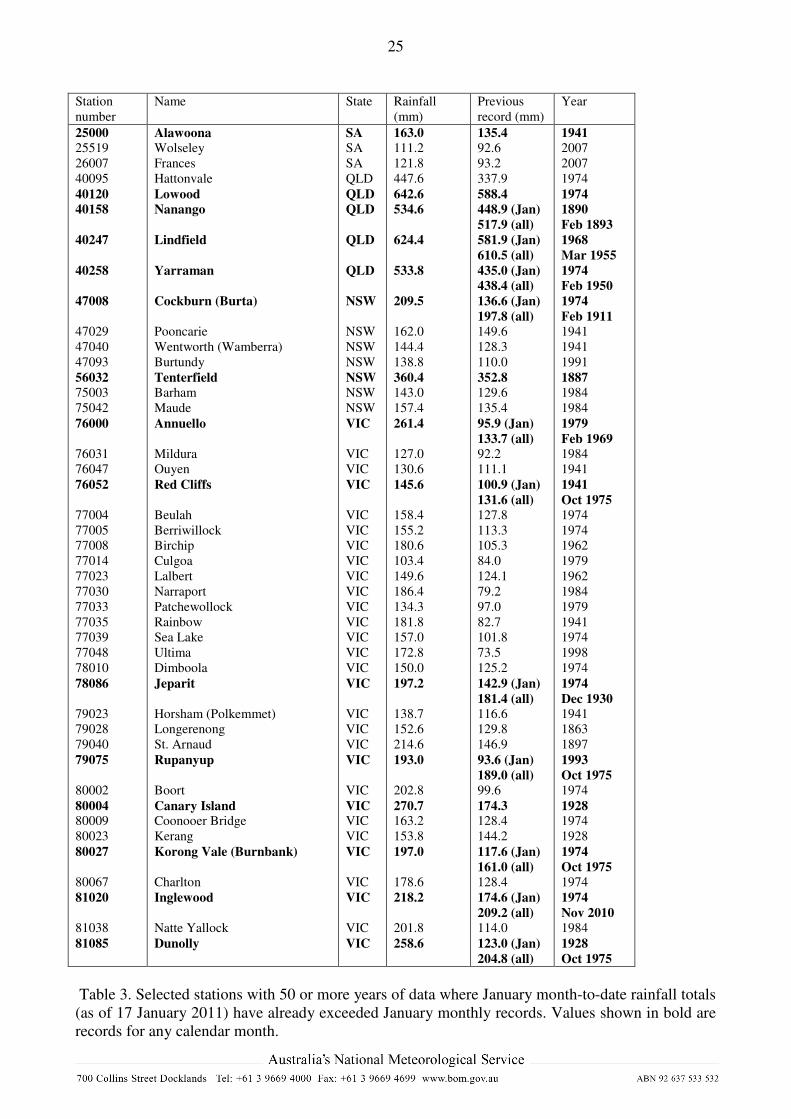
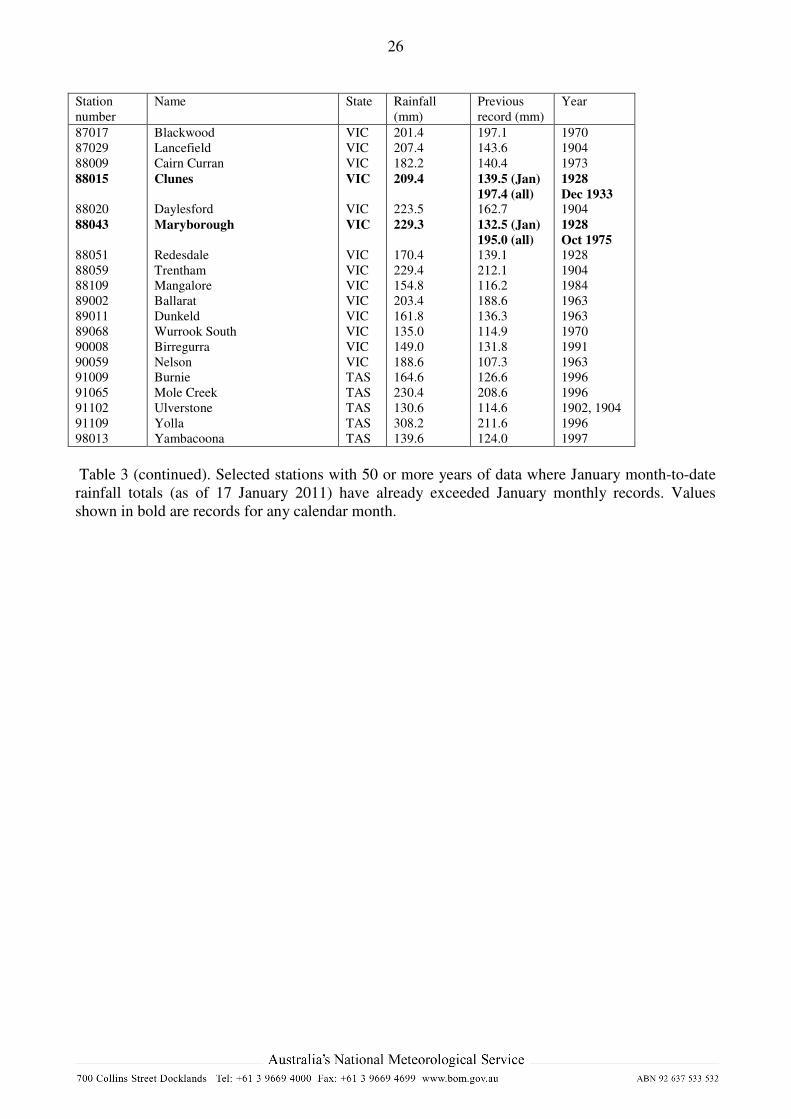
Numerous stations have already exceeded their January monthly records (Table 3), and some have
already experienced their wettest month on record for any calendar month. New South Wales,
Tasmania and the Murray-Darling Basin have already exceeded their January monthly average. In
4 In this context eastern Australia is defined as Queensland, NSW, Victoria, Tasmania and the ACT.
7
Queensland high rainfalls in January have been confined to the southeast and parts of the far west,
with most other parts of the state near or below normal for the month so far.
A comparison of the 2011 southeast Queensland rainfall with previous events
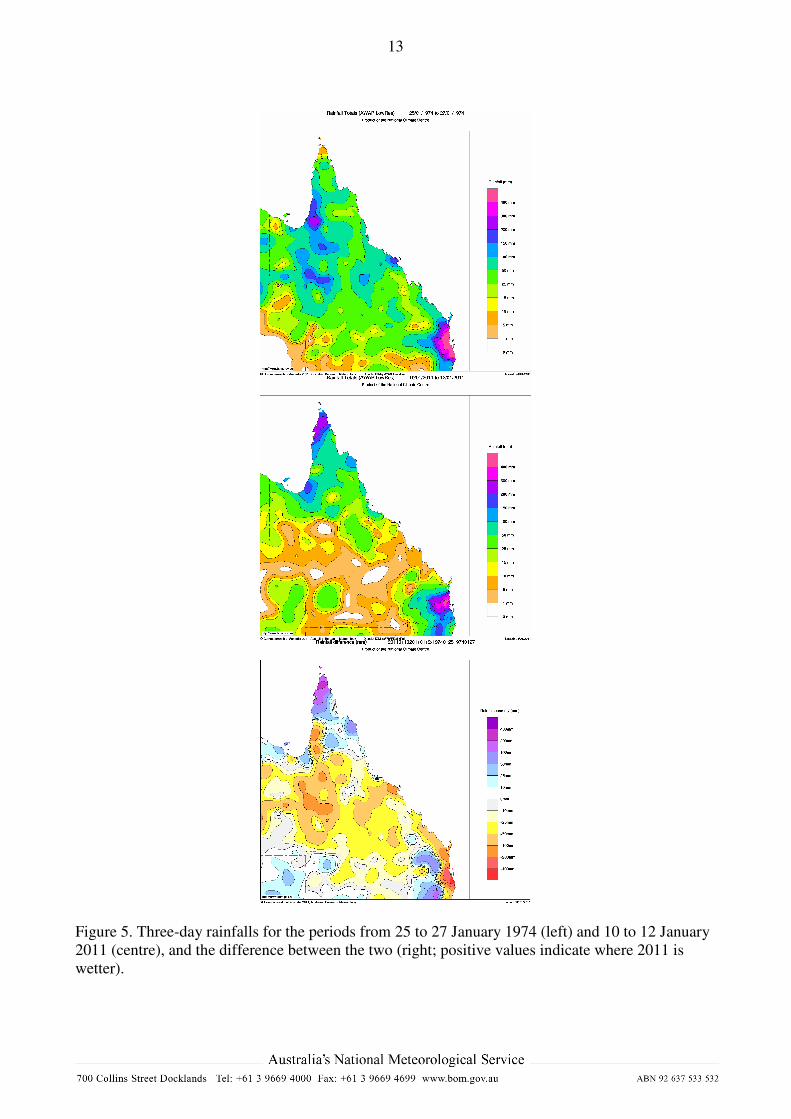
While all of the data is yet to be compiled, a preliminary comparison can be made between the
three-day rainfall totals from the 10-12 January 2011 event with those of 25-27 January 1974 is
shown in Figure 5.
Peak rainfalls from the 1974 event were substantially heavier than those in 2011. A number of
stations had three-day totals from 25-27 January 1974 in excess of 1000 mm, the highest being
1215.0 mm at Mount Tamborine, compared with the 2011 event peak of 648.4 mm. Many stations
in the 1974 event experienced daily totals which exceeded 400 mm; the highest were 563.2 mm at
Mount Tamborine and 561.5 mm at Wundurra, in the Gold Coast hinterland, while in the Brisbane
area 475.8 mm fell on 26 January at Enoggera Reservoir. 1974 also saw much heavier rainfall in
metropolitan Brisbane than 2011, with Brisbane’s three-day and peak one-day totals of 600.4 mm
and 314.0 mm in 1974 comparing with 166.2 mm and 110.8 mm in 2011. However, in 1974 the
heaviest rains were close to the coast, whereas in 2011 heavy falls spread further inland, and on the
western fringe of the Brisbane River catchment and on the Great Dividing Range 2011 was the
wetter of the two events (Figure 5, right). The weeks prior to the 1974 event, whilst wetter than
normal, were also less wet than the equivalent weeks prior to the 2011 event. Over the Brisbane
River catchment as a whole, average three-day rainfall in the 1974 event was 348.5 mm, compared
with 286.4 mm in 2011, and all four major sub-catchments were also wetter in 1974 than in 2011,
although by small margins in the cases of the Bremer (1974 442.1 mm; 2011 417.1 mm) and
Lockyer (1974 331.3 mm; 2011 292.0 mm) sub-catchments.
Insufficient rainfall data exist for a comprehensive assessment of the 1893 event. However, the
available station data indicate that peak rainfalls in the region during the 1893 event were much
heavier than those during either the 1974 or 2011 events. Crohamhurst, in the Glasshouse
Mountains inland from the Sunshine Coast, received 907.0 mm on 3 February 1893, which remains
an Australian daily record, whilst three-day totals included 1715.0 mm at Mooloolah and 1680.3
mm at Crohamhurst.
Floods resulting from the rainfall
The most destructive floods during the period occurred during the second week of January in the
southeast corner of Queensland and adjacent border areas of New South Wales. There was major
flooding through most of the Brisbane River catchment, most severely in the Lockyer and Bremer
catchments where numerous flood height records were set (Table 4), along with the Toowoomba
area just outside the Brisbane catchment. In Brisbane it was the second-highest flood of the last 100
years, after January 1974. The flooding caused substantial loss of life, and thousands of properties
were inundated in metropolitan Brisbane and elsewhere. Major flooding with inundation of
properties also extended inland to the upper Condamine-Balonne catchment, with Chinchilla and
Dalby being severely affected for the second time in less than a month. Other rivers which
experienced major flooding during the period included the Mary River around and upstream of
Maryborough and Gympie, the Macintyre River around Tenterfield and Goondiwindi, and the
Clarence around and downstream of Grafton.
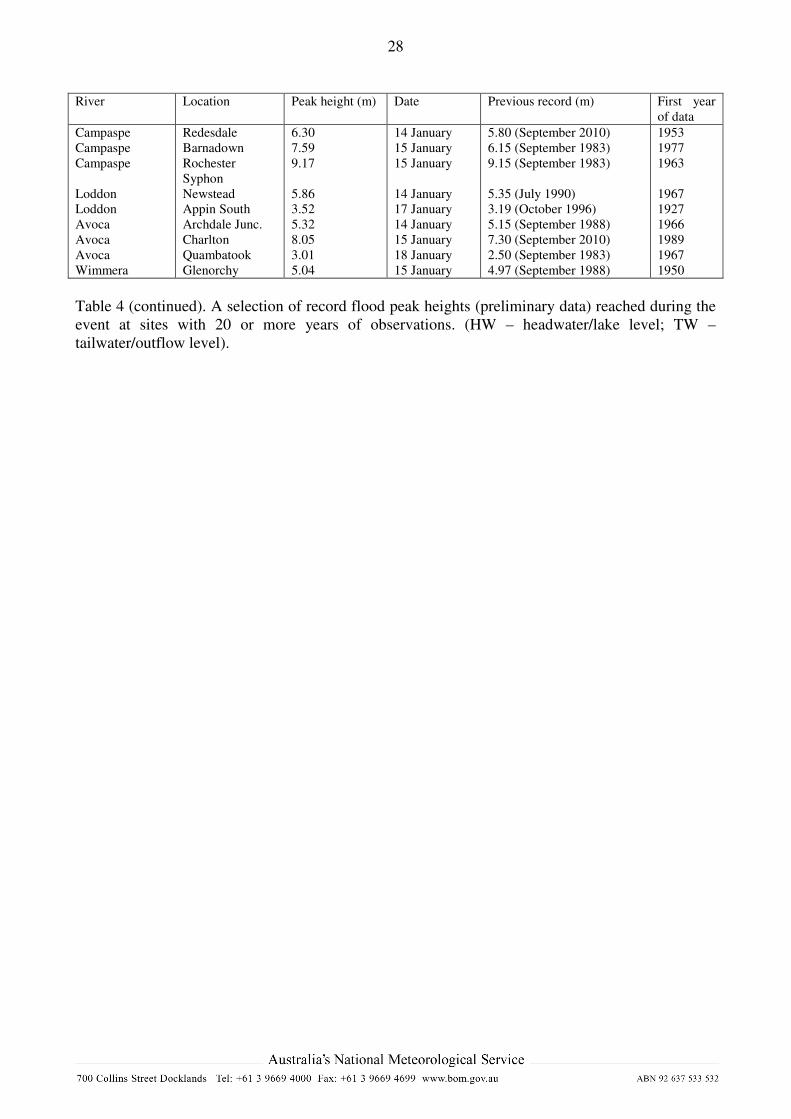
Major flooding also occurred in Victoria as a result of the heavy rains from 12 to 15 January.
Initially localised flash flooding occurred in parts of western Victoria following the first significant
rainfall on 12 January; this was followed by much more extensive river flooding from the 14th
onwards. Most Victorian catchments outside Gippsland experienced at least minor flooding but the
8
most serious flooding occured in the state’s north and west in the Wimmera, Avoca, Loddon and
Campaspe catchments. Record flood peaks were observed in all four catchments (Table 4). The
records are all the more remarkable because the associated catchments are seasonally dry in
summer . Towns to experience inundation across large parts of their urban areas included Charlton,
Bridgewater, Carisbrook and Rochester, whilst significant flooding also occurred in the larger
centres of Horsham, which had its highest flood on record, and Echuca. In Tasmania, there was
significant flash flooding on the east coast around St. Helens and Scamander, and river flooding on
several northern rivers with some major flooding.
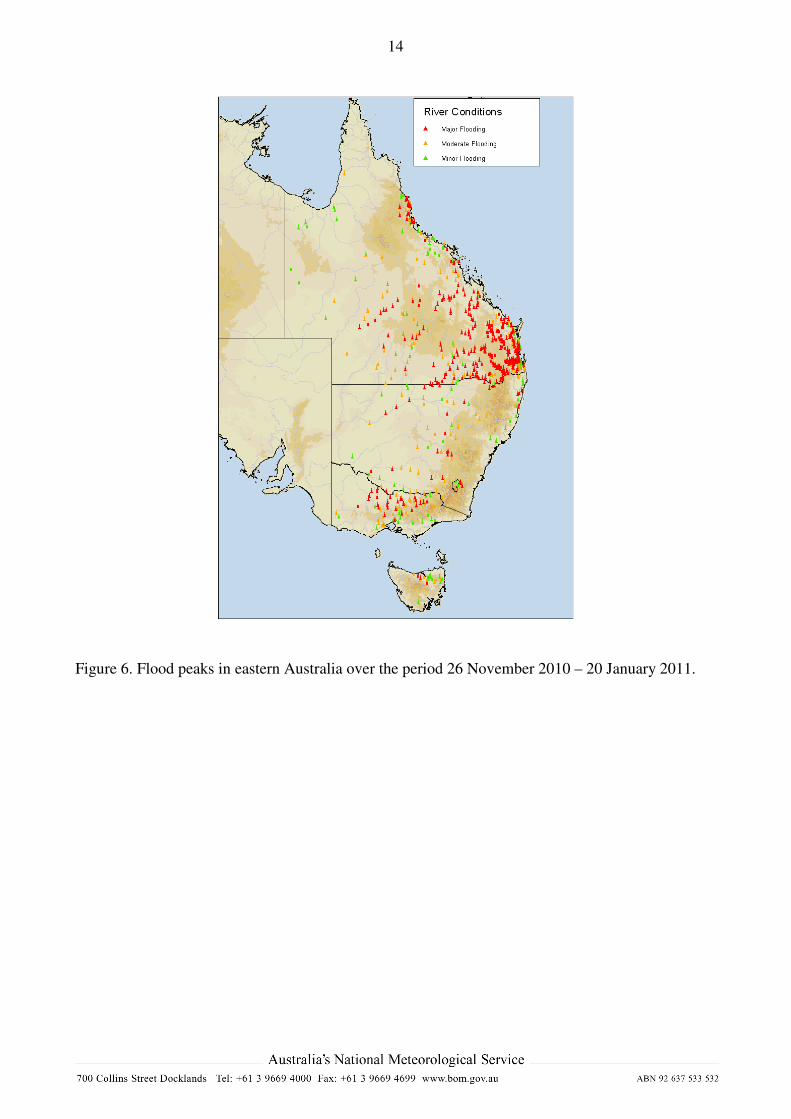
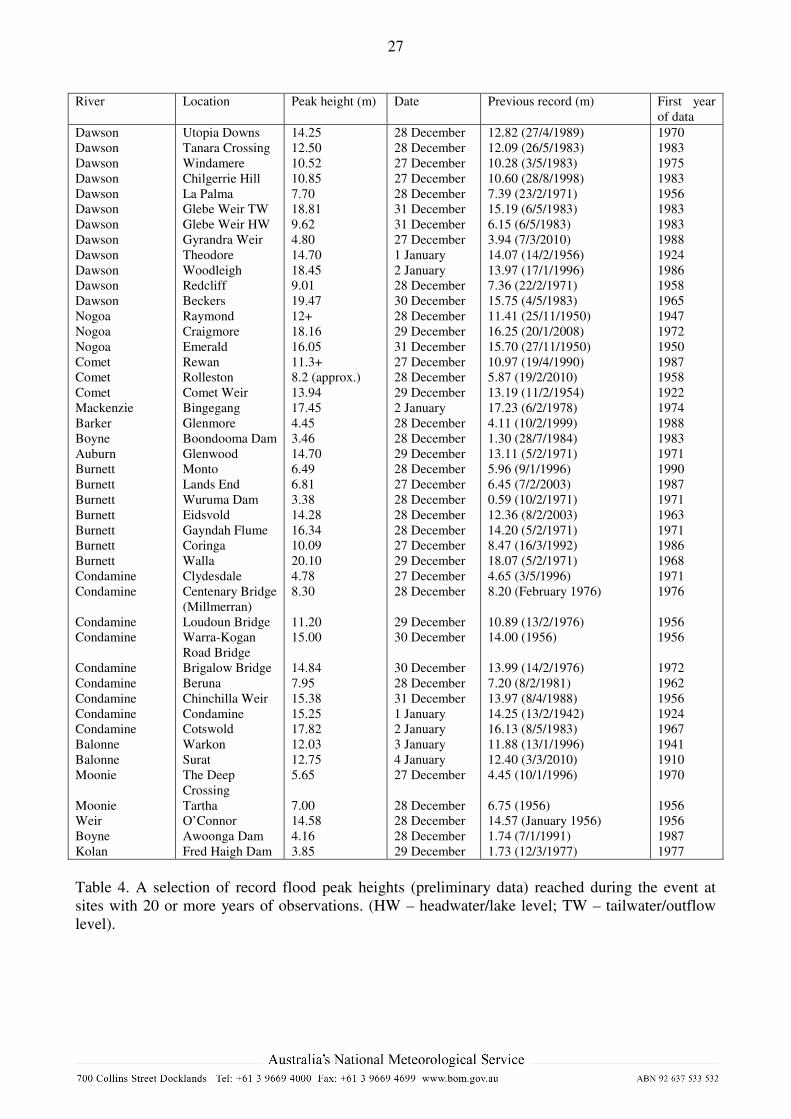
The rains from 23 to 28 December resulted in exceptional flooding in many parts of central and
southern Queensland with many rivers reaching record levels (Table 4). By 23 December, many
rivers were already at or near flood level as a result of the rains in the preceding weeks (with some,
notably the Dawson, experiencing major flooding). The rains during the following few days, on top
of the pre-existing wet conditions, resulted in major flooding over a vast region. Except for the
southeast coastal fringe south of Maryborough, almost every river in Queensland that is south of the
Tropic of Capricorn and east of Charleville and Longreach reached major flood level at some stage
during the period from 26 November to 7 January, mostly between 23 December and 4 January
(Figure 6). Properties were inundated in at least 17 towns in Queensland and adjacent border areas
of New South Wales, with the largest impacts in the towns of Theodore, Dalby, Chinchilla,
Emerald, Bundaberg and Rockhampton.
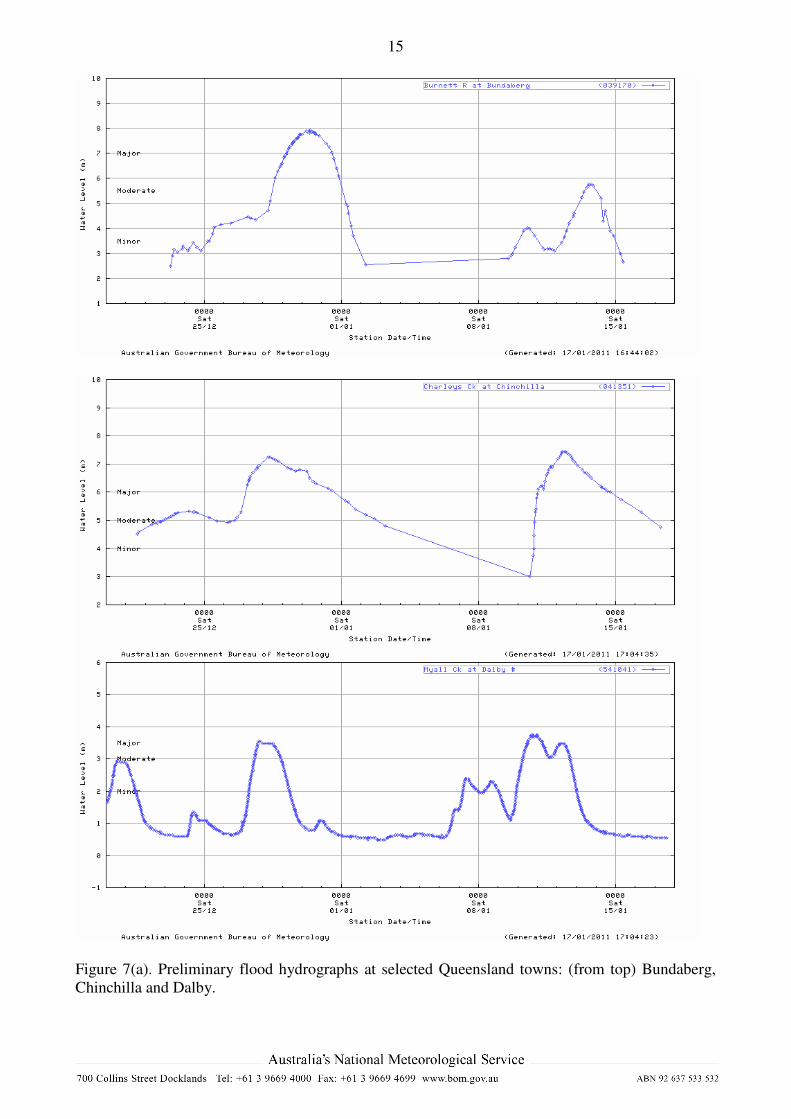
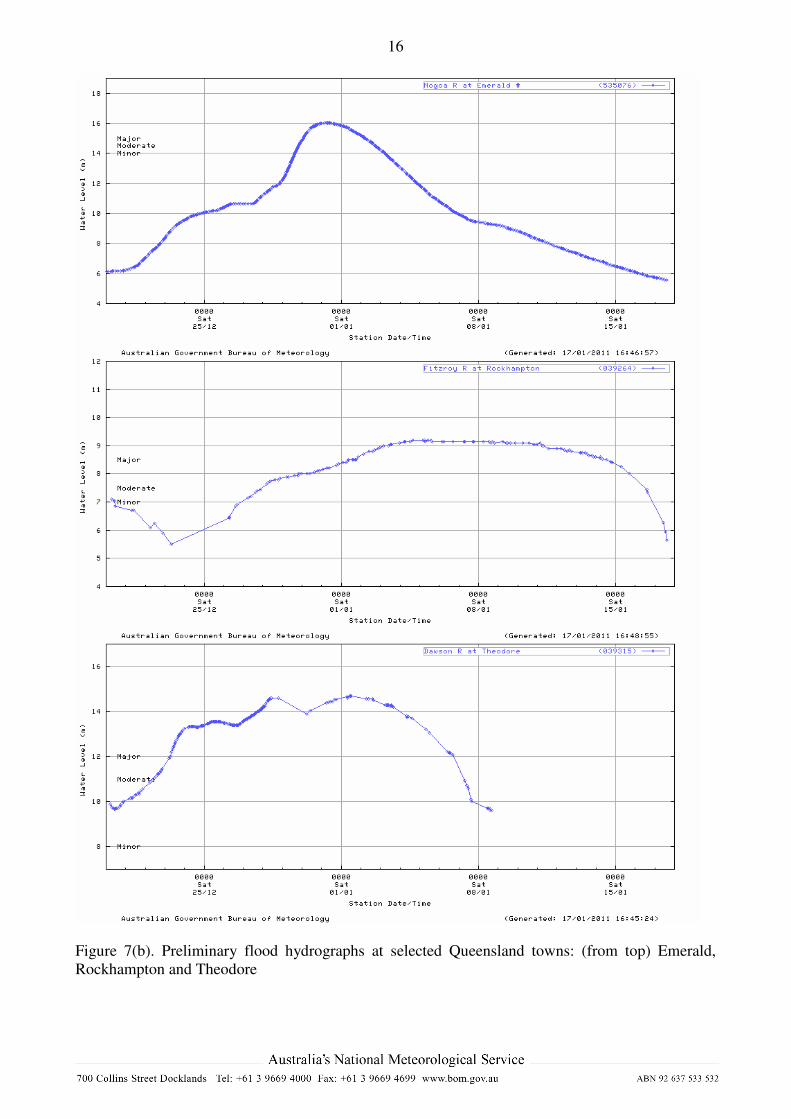
The most extreme flooding in the late December event occurred in the Fitzroy and Condamine-
Balonne catchments. Record flood levels occurred at a number of locations in these catchments
(Table 3), including the Dawson River at Theodore, the Nogoa at Emerald, the Comet at Rolleston
and Comet Weir, and in the Condamine-Balonne system at Tummaville, Millmerran, Condamine
Township and Surat. In some cases these flood peaks broke records which had only just been set
during the February-March 2010 event. The Fitzroy at Rockhampton reached its fifth highest level
of the last 100 years, and the Burnett at Bundaberg its highest since 1942. The flooding was
prolonged in many areas, with the Dawson at Theodore remaining above major flood level for more
than two weeks. Flood hydrographs for selected Queensland towns are shown in Figure 7.
Whilst not reaching the severity of Queensland or Victoria, there was also widespread flooding in
various parts of New South Wales, most significantly in the Murrumbidgee, Lachlan and
Castlereagh catchments. Eugowra was flooded three times during the month on December 4, 10 and
27. Wagga Wagga experienced its worst flooding since 1974 when the Murrumbidgee peaked at 9.7
metres on 6 December, while major flooding (the highest since 1976) inundated properties in
Queanbeyan on 9 December. This caused a secondary peak further down the Murrumbidgee, where
floods extended downstream over the following weeks, reaching Hay at the end of December. Total
River Murray inflows for December were the highest on record, and in conjunction with floods
earlier in the spring in southern inland New South Wales and northern Victoria, these are expected
to produce the strongest flows5 since at least 1992 in the South Australian portion of the Murray
during the remainder of January and February. The January rains in Victoria and Queensland are
not expected to result in increased peak flows in South Australia but are expected to prolong the
period of high flows in that state.
Further information
This statement is based on information available as of 23 January 2011. An update is expected to be
issued in early February after downstream flood peaks have occurred and final January data are
available.
5 From the 14 January 2011 River Murray Flow Advice, SA Government Department for Water
(http://www.waterforgood.sa.gov.au/wp-content/uploads/2011/01/flows-advisory-14-jan-2011.pdf).
9
Separate, more detailed state-based Special Climate Statements are available for the Tasmanian and
Victorian aspects of the event and may be obtained at
http://www.bom.gov.au/climate/current/special-statements.shtml. The Gascoyne River flooding in
Western Australia is not covered in this statement. A separate report on that event is available at
http://www.bom.gov.au/announcements/sevwx/.
Separate reports are also expected to be issued in due course on detailed hydrological aspects of the
flooding in Queensland, and on flooding in the Murray River system.
The information in this statement is based on preliminary data, and may change as further data are
obtained and quality assurance is undertaken.
Further information can be obtained from the following contacts:
For general enquiries on this statement
National – Blair Trewin (03-9669 4623), David Jones (03-9669 4085)
Queensland – Climate Services Centre (07-3239 8700), Flood Warning Services (07-3239 8768)
NSW – Climate Services Centre (02-9296 1555), Flood Warning Services (02-9296 1511)
SA – Climate Services Centre (08-8366 2600), Flood Warning Services (08-8366 2669)
Victoria – Climate Services Centre (03-9669 4956), Flood Warning Services (03-9669 4945)
Tasmania – Climate Services Centre (03-6221 2043), Flood Warning Services (03-6221 2061)
10
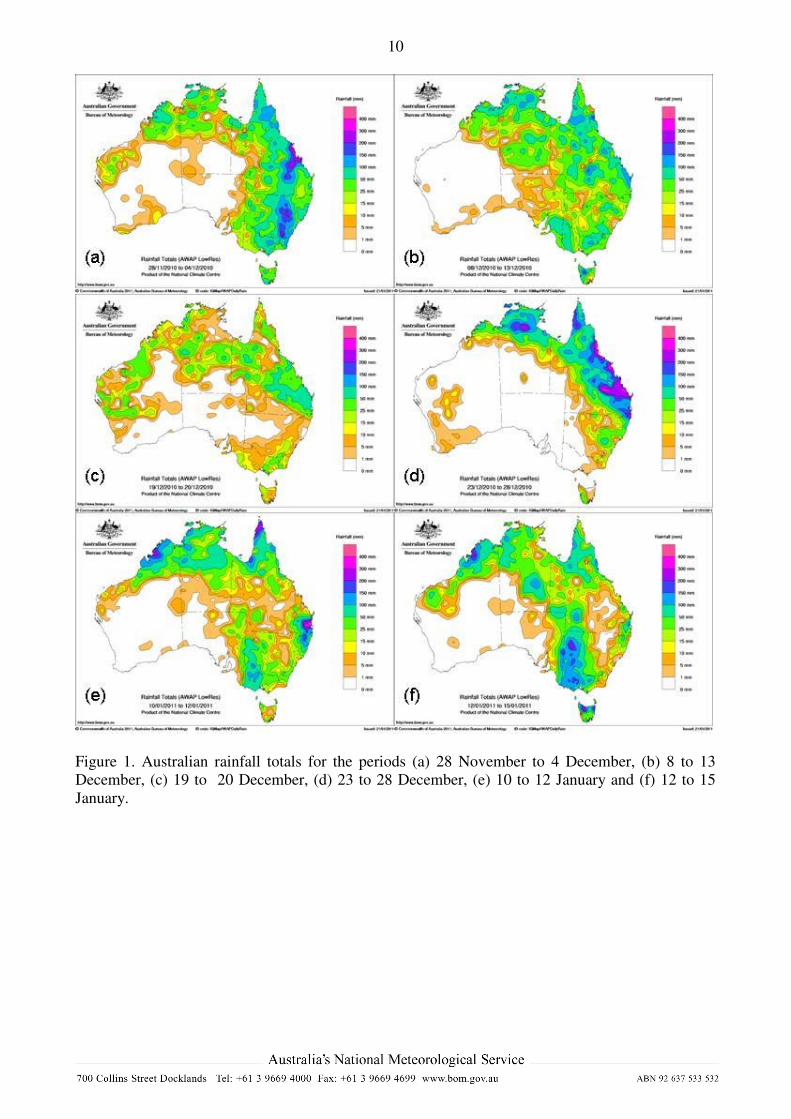
Figure 1. Australian rainfall totals for the periods (a) 28 November to 4 December, (b) 8 to 13
December, (c) 19 to 20 December, (d) 23 to 28 December, (e) 10 to 12 January and (f) 12 to 15
January.
11
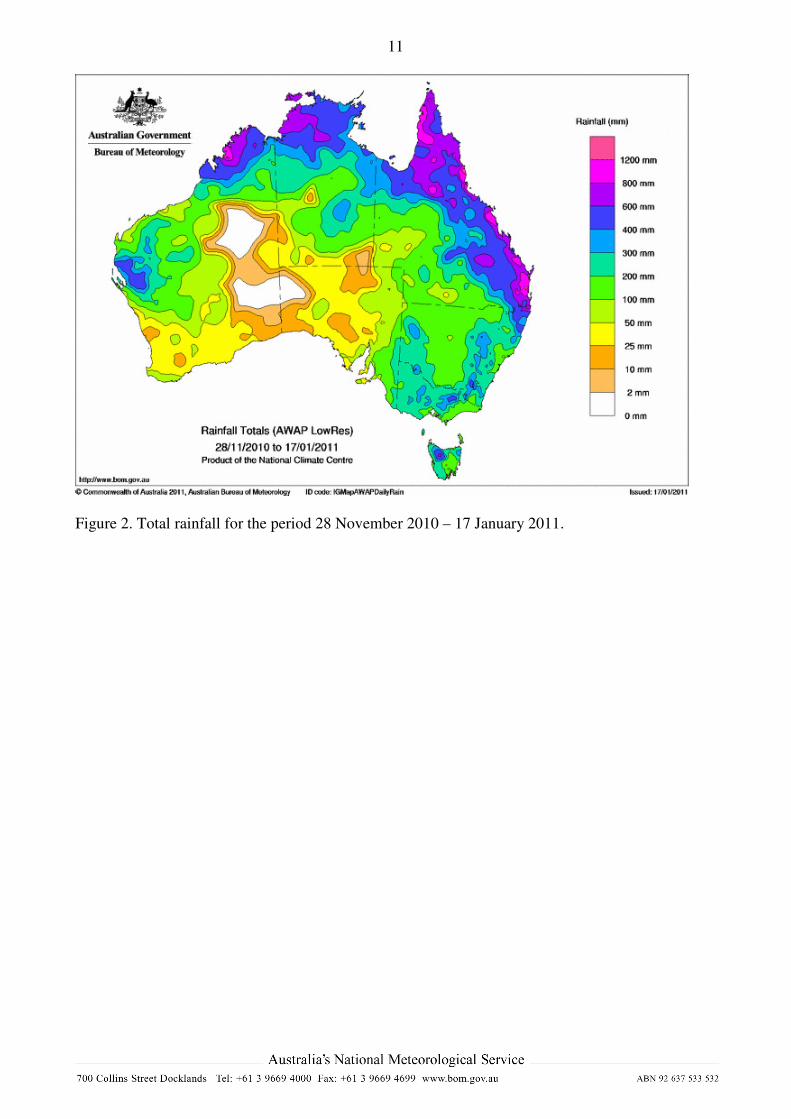
Figure 2. Total rainfall for the period 28 November 2010 – 17 January 2011.
12
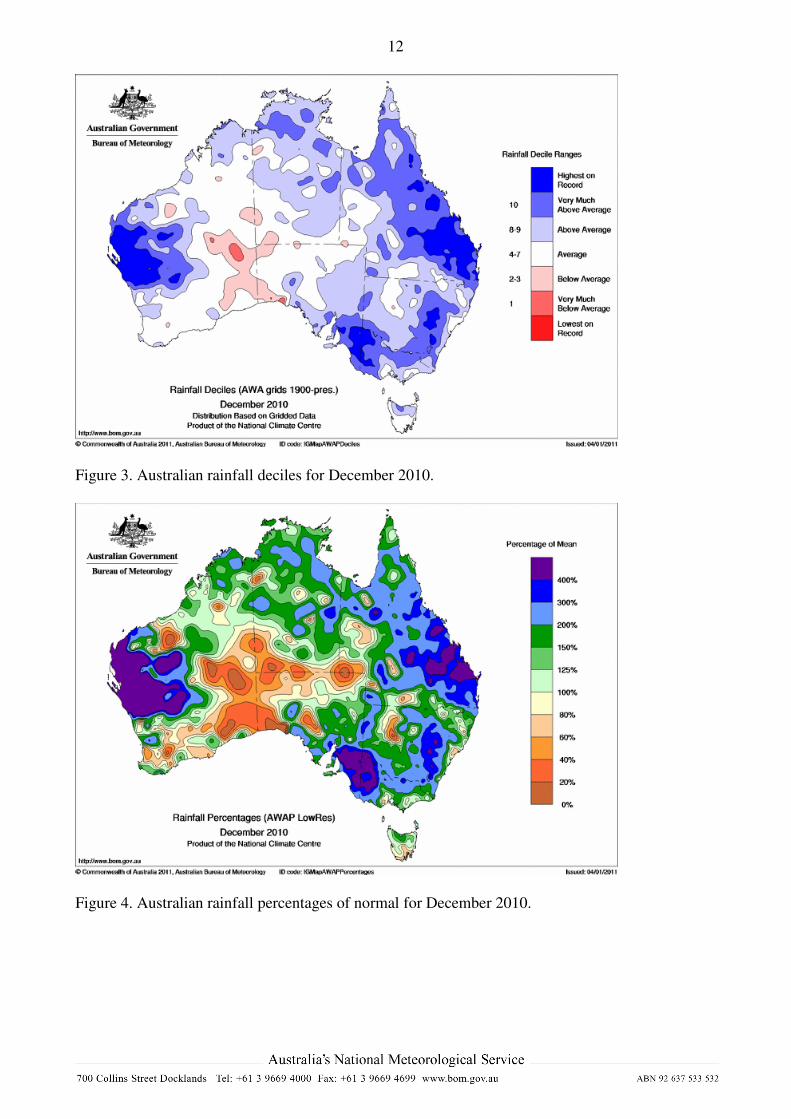
Figure 3. Australian rainfall deciles for December 2010.
Figure 4. Australian rainfall percentages of normal for December 2010.
13
Figure 5. Three-day rainfalls for the periods from 25 to 27 January 1974 (left) and 10 to 12 January
2011 (centre), and the difference between the two (right; positive values indicate where 2011 is
wetter).
14
Figure 6. Flood peaks in eastern Australia over the period 26 November 2010 – 20 January 2011.
15
Figure 7(a). Preliminary flood hydrographs at selected Queensland towns: (from top) Bundaberg,
Chinchilla and Dalby.
16
Figure 7(b). Preliminary flood hydrographs at selected Queensland towns: (from top) Emerald,
Rockhampton and Theodore
17
. Station
number
Name State Rainfall
(mm)
Date Previous
record (mm)
Date
18058
21001
21002
21003
21004
21012
21019
21022
21026
21033
21034
21047
23005
23013
23025
23078
23090/23000
23305
23307
23309
23310
23311
23314
23315
23318
23319
23343
23370
23705
23719
23737
23752
24006
24010
24013
24017
24517
24525
24534
25000
25002
25006
Whyalla (Mullaquana)
Auburn
Balaklava
Blyth
Booborowie
Bute
Farrell Flat
Gulnare
Hoyleton
Mintaro
Mount Bryan
Spalding
Glen Osmond
Parafield
Smithfield
Gawler
Adelaide
Greenock
Kapunda
Lyndoch
Manoora
Marrabel
Riverton
Saddleworth
Tanunda
Tarlee
Turretfield
Stockport (Clifton)
Birdwood
Gumeracha
Mount Pleasant
Williamstown
Kingston on Murray
Moorook
Loxton (Pyap)
Taldra
Mannum
Palmer
Sutherlands
Alawoona
Purnong
Karoonda
SA
SA
SA
SA
SA
SA
SA
SA
SA
SA
SA
SA
SA
SA
SA
SA
SA
SA
SA
SA
SA
SA
SA
SA
SA
SA
SA
SA
SA
SA
SA
SA
SA
SA
SA
SA
SA
SA
SA
SA
SA
SA
44.8
65.8
84.2
63.6
71.4
66.0
89.6
61.0
74.2
66.8
76.6
53.0
64.8
51.2
68.8
72.8
70.0
98.8
85.0
86.4
77.0
70.0
90.0
74.8
94.0
109.8
90.0
88.2
128.2
73.4
73.6
94.6
85.2
92.0
93.0
102.0
130.0
86.2
87.0
65.0
132.0
75.0
73.6
8/12
8/12
8/12
8/12
8/12
8/12
8/12
8/12
8/12
8/12
8/12
8/12
8/12
8/12
8/12
8/12
8/12
8/12
8/12
8/12
8/12
8/12
8/12
8/12
8/12
8/12
8/12
8/12
8/12
8/12
8/12
8/12
8/12
8/12
8/12
8/12
8/12
8/12
8/12
8/12
14/1
8/12
8/12
39.2
50.3
46.0
62.5
49.0
35.0
69.3
50.3
62.0
54.6
57.9 (Dec)
62.4 (all)
52.3
53.1
47.0
45.7
35.6
61.5
50.5
46.7
39.9
52.8
50.8
63.0
60.5
48.5 (Dec)
87.1 (all)
64.8
28.4
43.0
62.5 (Dec)
125.5 (all)
58.4
48.2
45.7
53.3 (Dec)
82.2 (all)
41.1 (Dec)
86.4 (all)
41.4 (Dec)
73.7 (all)
49.0 (Dec)
71.1 (all) 62.2
81.0
83.1
53.6
61.0 (Jan)
67.0 (all)
48.0
57.2
12/12/2008
12/12/1917
12/12/1917
21/12/1921
1/12/1966
3/12/1989
27/12/1929
1/12/1966
12/12/2008
12/12/1917
25/12/1946
27/9/1979
1/12/1966
23/12/1913
28/12/1929
27/12/1920
19/12/1922
23/12/1913
28/12/1896
18/12/1923
25/12/1946
12/12/2008
12/12/1917
12/12/2008
17/12/1902
28/12/1896,
5/12/1966
17/4/1889
24/12/1954
4/12/1911,
25/12/1964
12/12/2008
25/12/1948
9/2/1969
27/12/1920
1/12/1987
27/12/1920
17/12/1936
20/2/2000
27/12/1929
17/11/1961
27/12/1929
21/2/1917
1/12/1911
17/11/1961 25/12/1946
18/12/1992
26/12/1946
31/12/1983
25/1/1941
12/11/1998
28/12/1929
28/12/1929
Table 1. Selected record daily rainfall totals which have occurred during December 2010 and
January 2011 at locations with 50 or more years of data. Values shown in bold are records for any
calendar month.
18
Station
number
Name State Rainfall
(mm)
Date Previous
record (mm)
Date
25010
25013
25014
25015
25017
25509
25519
26007
26009
26018
26021
35018
35021
35051
35077
35079
35090
35194
36003
36143
39204
40020
40071
40120
40158
40169
40247
40382
41069
41082
42009
42016
42048
47016
47093
49002
50045
56032
63267 64009
65020
70016
70083
70097
70351/70014
72004
72150
73007
Mindarie
Parilla
Paruna
Pinnaroo
Sandalwood
Lameroo
Wolseley
Frances
Kalangadoo
Millicent
Mount Gambier
Carnarvon Station
Comet
Orion
Warrinilla
Wharton Creek
Rewan
Wyseby
Birricannia
Blackall
Colodan
Blackbutt
Lanark
Lowood
Nanango
Peachester
Lindfield
Crows Nest
Millmerran
Pittsworth
Drillham
Hannaford
Condamine
Lake Victoria
Burtundy
Balranald
Yalgogrin North
Tenterfield
Wyangala Dam Dunedoo
Manildra
Captains Flat
Tharwa
Breadalbane
Canberra
Batlow
Wagga Wagga
Burrinjuck Dam
SA
SA
SA
SA
SA
SA
SA
SA
SA
SA
SA
QLD
QLD
QLD
QLD
QLD
QLD
QLD
QLD
QLD
QLD
QLD
QLD
QLD
QLD
QLD
QLD
QLD
QLD
QLD
QLD
QLD
QLD
NSW
NSW
NSW
NSW
NSW
NSW NSW
NSW
NSW
ACT
NSW
ACT
NSW
NSW
NSW
85.0
79.0
64.6
64.0
82.0
73.0
86.2
104.0
74.0
59.8
82.4
273.6
148.4
153.4
238.0
257.0
190.6
247.2
95.0
123.6
89.0
149.2
102.0
203.2
183.8
298.0
257.0
162.4
97.0
114.0
81.0
102.0
148.0
86.0
49.0
71.8
68.2
144.0
103.4 77.6
63.8
74.2
85.0
136.4
87.0
99.6
67.6
111.0
8/12
8/12
8/12
8/12
8/12
8/12
14/1
14/1
14/1
14/1
14/1
27/12
3/12
3/12
27/12
27/12
27/12
27/12
27/12
8/12
20/12
10/1
23/12
12/1
11/1
10/1
10/1
11/1
27/12
28/12
27/12
27/12
27/12
8/12
14/1
14/1
9/12
11/1
10/12 1/12
10/12
9/12
9/12
9/12
3/12
9/12
9/12
3/12
35.6 (Dec)
79.8 (all)
74.0
40.6
38.4
36.8
60.0
61.4
56.0
59.7
45.2
53.4
124.5 (Dec)
126.0 (all)
136.4
139.8
165.4 (Dec)
204.0 (all)
103.1 (Dec)
184.2 (all)
144.8
119.6 (Dec)
213.8 (all)
87.9
96.4
83.0
113.8
100.1
194.0
167.1
265.0
179.8 (Jan)
237.8 (all) 142.4
94.0
100.1
66.5
90.2
96.6
49.0
45.7
70.4
66.5
110.5
102.6 71.6
63.2
68.8
80.3
77.0 (Dec)
121.9 (all)
86.6
94.0
65.2
87.6
27/12/1920
18/12/1946
26/12/1999
22/12/2000
28/12/1962
22/12/1964
26/12/1999
20/1/2007
20/1/2007
25/1/1941
25/1/1941
15/1/1995
28/12/2008
1/6/1981
30/12/1962
28/12/2008
29/12/1921
3/3/1990
22/12/1956
24/11/1950
11/12/1917
22/12/1975
3/3/1990
18/12/1944
31/12/2009
12/12/1988
27/1/1974
15/12/1965
27/1/1974
20/1/1929
27/1/1974
20/1/1929
9/2/1999 27/1/1974
5/12/2003
22/12/1956
26/12/1971
12/12/1942
22/12/1988
29/12/1957
9/1/1897
4/1/1941
17/12/1930
10/1/1902
25/12/1946 13/12/2008
14/12/1960
30/12/1948
18/12/1961
5/12/1911
26/7/1922
30/12/1948
28/12/1919
26/12/1988
18/12/1961
Table 1 (continued). Selected record daily rainfall totals which have occurred during December
2010 and January 2011 at locations with 50 or more years of data. Values shown in bold are records
for any calendar month.
19
Station
number
Name State Rainfall
(mm)
Date Previous
record (mm)
Date
74064
74110
75042
76000
76031
76038
76047
76052
76064
76067
77005
77008
77023
77030
77033
77035
77048
78010
78086
79023
79028
79036
79071
79075
80061
81038
81051
83038
83043
87029
88043
88051
88059
89002
89003
89005
89009
89011
89034
90005
90008
90059
90060
91009
91109
Lockhart
Urana
Maude
Annuello
Mildura
Murrayville
Ouyen
Red Cliffs
Walpeup
Werrimull
Berriwillock
Birchip
Lalbert
Narraport
Patchewollock
Rainbow
Ultima
Dimboola
Jeparit
Horsham (Polkemmet)
Longerenong
Natimuk
Apsley
Rupanyup
Wedderburn
Natte Yallock
Tungamah
Tawonga
Rocky Valley
Lancefield
Maryborough
Redesdale
Trentham
Ballarat
Balmoral
Beaufort
Cavendish
Dunkeld
Willaura
Beeac
Birregurra
Nelson
Nullawarre
Burnie
Yolla
NSW
NSW
NSW
VIC
VIC
VIC
VIC
VIC
VIC
VIC
VIC
VIC
VIC
VIC
VIC
VIC
VIC
VIC
VIC
VIC
VIC
VIC
VIC
VIC
VIC
VIC
VIC
VIC
VIC
VIC
VIC
VIC
VIC
VIC
VIC
VIC
VIC
VIC
VIC
VIC
VIC
VIC
VIC
TAS
TAS
53.2
69.0
54.0
76.6
61.6
70.0
50.0
83.4
78.0
71.0
63.8
90.2
57.0
70.0
67.0
131.0
64.4
104.2
161.2
98.0
97.0
54.2
48.4
90.0
84.0
81.8
83.4
144.2
182.0
92.0
90.4
78.6
110.8
95.0
103.2
96.8
106.8
78.4
98.0
66.2
52.0
113.2
70.2
87.2
131.0
9/12
9/12
12/1
14/1
12/1
8/12
14/1
12/1
8/12
8/12
14/1
14/1
14/1
14/1
8/12
12/1
14/1
12/1
12/1
12/1
12/1
8/12
8/12
14/1
14/1
14/1
9/12
9/12
9/12
14/1
14/1
14/1
14/1
14/1
8/12
14/1
8/12
8/12
8/12
14/1
14/1
14/1
8/12
13/1
14/1
45.7
60.0
51.8
60.0
37.6
41.1
49.5
57.9 (Jan)
82.3 (all)
41.0
58.8
54.0
68.1
55.8
53.0
58.4
56.4 (Jan)
118.4 (all)
61.4
95.0
119.0 (Jan)
127.3 (all) 75.4
72.9
52.1
38.6
71.0 (Jan)
76.5 (all)
62.0 (Jan)
78.8 (all)
68.0
57.7
69.0 (Dec)
95.4 (all)
128.6
71.1
83.8
76.0
101.6
83.1
56.4
85.6
65.0 (Dec)
101.6 (all)
64.0
64.8 (Dec)
91.4 (all)
52.6
48.0
77.4 (Jan)
90.2 (all)
61.6
51.8
70.1
3/12/1960
9/12/2004
17/1/1962
1/1/1988
17/1/1962
25/12/1919
3/1/1921
26/1/1959
24/3/1969
21/12/1992
31/12/2002
14/1/1974
11/1/1962
17/1/1974
27/1/1993
1/12/1987
25/1/1941
7/3/1910
22/1/1979
14/1/1974
14/1/1974
6/3/1910 7/1/1886
25/1/1863
28/12/1929
10/12/1971
27/1/1993
28/12/1929
15/1/1974
22/3/1983
16/1/1984
15/12/1894
22/12/2007
26/3/1993
14/12/1993
2/1/1970
2/1/1961
1/1/1988
1/1/1921
29/1/1963
13/12/2008
21/1/1904
13/12/2008
7/2/1957 13/12/2008
13/12/1966
6/2/1973
21/1/1904
22/1/1997
24/1/1991
18/2/1946
3/12/1985
17/1/1979
20/1/1946
Table 1 (continued). Selected record daily rainfall totals which have occurred during December
2010 and January 2011 at locations with 50 or more years of data. Values shown in bold are records
for any calendar month.
20
Station
number
Name State Rainfall
(mm)
Previous
record (mm)
Year
21001
21002
21004
21012
21019
21026
23025
23081
23305
23307
23309
23310
23311
23314
23315
23318
23319
23343
23705
23707
23752
24003
24008
24010
24013
24513
24517
24526
24535
25002
25004
25006
25010
25013
25014
25015
25017
25507
25509
25513
25519
28000
30082
30137
31029
31046
Auburn
Balaklava
Booborowie
Bute
Farrell Flat
Hoyleton
Smithfield
Gawler
Greenock
Kapunda
Lyndoch
Manoora
Marrabel
Riverton
Saddleworth
Tanunda
Tarlee
Turretfield
Birdwood
Bridgewater
Williamstown
Renmark Irrigation
Lyrup
Moorook
Loxton (Pyap)
Cambrai (Kongolia)
Mannum
Point Pass
Swan Reach
Purnong
Galga
Karoonda
Mindarie
Parilla
Paruna
Pinnaroo
Sandalwood
Keith
Lameroo
Peake
Wolseley
Laura
Gregory Springs
Hillgrove
Herberton
Mount Garnet
SA
SA
SA
SA
SA
SA
SA
SA
SA
SA
SA
SA
SA
SA
SA
SA
SA
SA
SA
SA
SA
SA
SA
SA
SA
SA
SA
SA
SA
SA
SA
SA
SA
SA
SA
SA
SA
SA
SA
SA
SA
QLD
QLD
QLD
QLD
QLD
140.0
129.2
122.2
96.0
141.6
109.6
129.8
118.8
152.4
132.2
160.0
135.4
126.0
197.0
139.0
177.4
183.6
153.7
199.2
160.5
167.0
139.4
134.6
140.2
134.6
142.0
173.0
175.4
145.2
142.0
146.4
142.4
132.4
140.6
91.6
86.0
123.3
137.8
107.8
107.9
129.6
410.4
350.2
399.4
446.2
337.4
120.8
80.9
99.6
66.7
122.4
104.2
109.5
109.7
94.8
103.1
107.2
104.4
110.6
123.7
112.1
120.4
121.0
91.8
177.8
148.6
115.4
88.4 (Dec)
138.5 (all)
88.4 (Dec)
133.2 (all)
84.1 (Dec)
116.7 (all)
78.0 (Dec)
123.3 (all)
141.5
138.6
99.6
118.2 (Dec)
134.9 (all)
87.7
104.2 (Dec)
105.3 (all)
103.6 (Dec)
113.1 (all)
84.0 (Dec)
127.3 (all)
100.4
87.6
71.6
92.8 (Dec)
119.1 (all)
78.1
88.1
107.0
106.0
406.6
315.4
254.6
416.0
327.0
1966
1894
1966
1922
1894
2008
1966
1861
2008
1902
1992
1992
1992
1902
1902
1875
1992
1992
1992
1992
1992
1992
Apr 1974
1966
Feb 1950
1966
Feb 1950
1929
Oct 1973
1992
2004
1946
1992
Feb 1973
1929
1992
Feb 1973
1992
Feb 1969
1992
Feb 1973
1937
1992
1992
1937
Mar 1921
1937
1962
1929
1894
1976
2000
2000
1950
1997
Table 2. Selected record monthly rainfall totals which have occurred during December 2010 at
locations with 50 or more years of data. Values shown in bold are records for any calendar month.
21
Station
number
Name State Rainfall
(mm)
Previous
record (mm)
Year
33008
33013
34000
35007
35014
35018
35021
35049
35051
35065
35079
35088
35109
35117
35194
35225
36143
39000
39004
39027
39040
39059
39066/39039
39070
39073
39089
39092
39097
39103
39104
Byfield
Collinsville
Balfes Creek
Bauhinia Downs
Wandoan
Carnarvon Station
Comet
Gillespie
Orion
Springsure
Wharton Creek
Birraban
Booroondarra
La Palma
Wyseby
Cardbeign
Blackall
Abercorn
Baralaba
Cordalba
Gin Gin
Lady Elliot Island
Gayndah
Mount Perry
Mundubbera
Thangool
Miara
Wateranga
Bancroft
Monto
QLD
QLD
QLD
QLD
QLD
QLD
QLD
QLD
QLD
QLD
QLD
QLD
QLD
QLD
QLD
QLD
QLD
QLD
QLD
QLD
QLD
QLD
QLD
QLD
QLD
QLD
QLD
QLD
QLD
QLD
770.0
425.9
297.5
475.2
409.0
535.8
383.0
268.6
380.1
470.2
452.0
596.0
390.4
463.8
603.2
489.6
254.0
483.6
461.2
723.2
803.7
510.0
380.8
584.8
428.6
374.4
573.0
579.0
514.2
499.0
651.9
410.4
260.3
270.6
357.8
238.9 (Dec)
340.2 (all)
273.5
213.1
350.0
316.6
307.0 (Dec)
414.3 (all)
310.7 (Dec)
484.2 (all)
277.6 (Dec)
354.6 (all)
274.6 (Dec)
431.9 (all)
339.0 (Dec)
511.6 (all)
280.5 (Dec)
411.0 (all) 246.8
281.2 (Dec)
306.8 (all)
353.9
542.2 (Dec)
723.0 (all)
411.0
383.4
321.2
365.4
321.7 (Dec)
364.4 (all)
344.4
467.0 (Dec)
564.1 (all)
426.5 (Dec)
491.0 (all)
294.0 (Dec)
423.1 (all)
248.5 (Dec)
434.2 (all)
1962
1956
1906
1988
1970
1927
Feb 1997
1956
1916
1975
1975
1956
Feb 1954
1956
Feb 2010
1990
Jan 1974
1942
Feb 1954
1970
Feb 2010
1956
Feb 1954
1965
1959
Feb 2003
1973
1956
Feb 1928
1970
1962
1942
1956
1959
Feb 1956
1973
1962
Feb 1947
1942
Feb 1928
1984
Feb 1971
1970
Feb 1971
Table 2 (continued). Selected record monthly rainfall totals which have occurred during December
2010 at locations with 50 or more years of data. Values shown in bold are records for any calendar
month.
22
Station
number
Name State Rainfall
(mm)
Previous
record (mm)
Year
39128/39015
39177
39204
39248
39278
40021
40043
40059
40071
40078
40082
40098
40099
40106
40135
40144
40152
40158
40160
40166
40170
40177
40183
40198
40231
40251
40255
40428
40455
40671
Bundaberg
Glenwood
Colodan
Tecoma
Glenhaven
Biggenden
Cape Moreton
Cooroy
Lanark
Eumundi
UQ Gatton
Howard
Imbil
Kenilworth
Moogerah Dam
Mount Joseph
Murgon
Nanango
Nerang
Oxenford
Pechey
Proston
Rosevale
Tarome
Manly
Wondai
Wooroolin
Brian Pastures
Dunollie
Killara
QLD
QLD
QLD
QLD
QLD
QLD
QLD
QLD
QLD
QLD
QLD
QLD
QLD
QLD
QLD
QLD
QLD
QLD
QLD
QLD
QLD
QLD
QLD
QLD
QLD
QLD
QLD
QLD
QLD
QLD
573.2
412.4
493.0
503.0
411.8
558.9
375.8
559.5
462.0
615.8
317.0
631.4
575.6
547.1
363.8
521.8
376.5
365.9
481.2
542.2
326.0
399.0
516.6
523.4
467.0
374.0
451.2
485.3
393.2
486.4
490.3
257.3 (Dec)
386.1 (all)
266.3 (Dec)
345.0 (all)
261.7 (Dec)
373.1 (all)
256.3 (Dec)
366.5 (all)
441.4
372.5
521.0
328.2
516.7
278.7
543.0
454.6
481.1
308.8
477.0
360.2
333.1
392.8
493.8
307.2
282.3 (Dec)
301.4 (all)
440.9 (Dec)
445.0 (all)
449.9
397.1
330.7
356.4
256.1 (Dec)
307.4 (all)
249.5 (Dec)
300.9 (all)
188.6 (Dec)
342.9 (all)
1962
1956
Feb 1956
1973
Feb 1971
1959
Feb 1971
1956
Feb 1954
1942
1965
1926
1947
1926
1942
1926
1926
1926
1921
1926
1947
1970
1897
1897
1942
1970
Feb 1971
1991
Jan 1927
1965
1970
1921
1970
1970
Jan 1959
1955
Jul 1954
1970
Feb 1971
Table 2 (continued). Selected record monthly rainfall totals which have occurred during December
2010 at locations with 50 or more years of data. Values shown in bold are records for any calendar
month.
23
Station
number
Name State Rainfall
(mm)
Previous
record (mm)
Year
41011
41018
41019
41050
41061
41069
41075
41082
41106
41110
41120
41191
41202
41242
41250
41291
41306
41314
41327
41504
42012
42016
42033
43015
43020
43093
47016
51049
55006
55023
59040
62013
Cambooya
Clifton
Condamine Plains
Jandowae
Kurrowah
Millmerran
Nobby
Pittsworth
Upper Forest Springs
Turallin
Yangan
Victory Downs
Talgai
Little Ridge
Pampas
Ehlma Park
Tosari
Brookstead
Bairnsdale
Glen Royal
Glenmorgan
Hannaford
Shelbourne
Injune
Mitchell
Waverley Downs
Lake Victoria
Trangie Research
Blackville
Gunnedah Pool
Coffs Harbour
Gulgong
QLD
QLD
QLD
QLD
QLD
QLD
QLD
QLD
QLD
QLD
QLD
QLD
QLD
QLD
QLD
QLD
QLD
QLD
QLD
QLD
QLD
QLD
QLD
QLD
QLD
QLD
NSW
NSW
NSW
NSW
NSW
NSW
325.6
359.0
370.4
376.6
413.4
312.0
423.9
433.6
422.8
333.5
374.4
292.0
352.2
360.8
318.0
270.2
349.0
370.2
346.6
385.6
301.7
254.5
371.8
349.9
319.4
304.4
140.1
145.2
244.4
232.4
395.4
241.1
298.9
261.8 (Dec)
350.7 (all)
265.1 (Dec)
360.7 (all)
268.5 (Dec)
356.4 (all)
361.9
264.0
260.9 (Dec)
361.0 (all)
297.5 (Dec)
359.7 (all)
278.2 (Dec)
296.6 (all)
333.4
292.0
278.8
251.7 (Dec)
312.8 (all)
255.2 (Dec)
304.7 (all)
256.6 (Dec)
309.8 (all)
261.0
209.8 (Dec)
288.2 (all)
218.0 (Dec)
309.6 (all)
323.7 (Dec)
326.4 (all)
264.8 (Dec)
289.6 (all)
222.6 (Dec)
268.4 (all)
242.6 (Dec)
242.8 (all)
344.8
280.4
253.9
203.4 (Dec)
286.0 (all)
98.7
137.4
208.9
185.8
383.2
212.8
1895
1928
Feb 1893
1965
Feb 1893
1921
Mar 1941
1970
1970
1970
Apr 1988
1965
Feb 1893
1975
Jan 1933
1975
1975
1970
1970
Jan 1974
1970
Jan 1974
1965
Mar 1963
1970
1965
Mar 1963
1980
Mar 1963
1965
Apr 1988
1965
May 1996
2007
Feb 2010
1942
Jan 2004
1970
1931
1931
2007
Mar 2010
1975
1992
1926
2004
1991
1958
Table 2 (continued). Selected record monthly rainfall totals which have occurred during December
2010 at locations with 50 or more years of data. Values shown in bold are records for any calendar
month.
24
Station
number
Name State Rainfall
(mm)
Previous
record (mm)
Year
63005
63035
63119
64004
64008
64009
64024
65011
65018
65020
65023
65026
65034
70025
70083
70097
70111
70117
70171
73007
76038
76064
76067
77026
77033
77041
77052
78010
79010
79023
79036
79075
83038
89003
89034
90057
Bathurst Ag Station
Hill End
Crooked Corner (Wingadeena)
Binnaway
Coonabarabran
Dunedoo
Gilgandra (Wallumburrawang)
Cumnock
Geurie
Manildra
Molong
Parkes
Wellington
Crookwell
Tharwa
Breadalbane
Biala (Alvison)
Dalton (Rose Valley)
Rugby (Carovale)
Burrinjuck Dam
Murrayville
Walpeup
Werrimull
Lascelles
Patchewollock
Speed
Woomelang
Dimboola
Drung Drung
Horsham
Natimuk
Rupanyup
Tawonga
Balmoral
Willaura
Merino
NSW
NSW
NSW
NSW
NSW
NSW
NSW
NSW
NSW
NSW
NSW
NSW
NSW
NSW
ACT
NSW
NSW
NSW
NSW
NSW
VIC
VIC
VIC
VIC
VIC
VIC
VIC
VIC
VIC
VIC
VIC
VIC
VIC
VIC
VIC
VIC
219.4
257.6
304.2
272.0
293.8
279.4
282.2
283.0
198.0
252.6
241.4
212.8
184.6
270.8
220.4
279.6
231.4
241.6
353.4
260.5
122.8
141.6
132.2
143.2
97.2
128.5
119.6
141.0
142.6
150.2
130.6
148.2
247.8
222.2
169.4
176.0
194.5
220.4
231.8 (Dec)
244.2 (all)
233.4
289.6
194.8
219.8 (Dec)
274.5 (all)
200.2
190.4
204.5
214.8
171.9
173.2
212.4
159.6
140.7 (Dec)
268.8 (all)
211.4
174.5 (Dec)
238.8 (all)
158.0 (Dec)
267.7 (all)
243.5
82.0
121.6 (Dec)
139.0 (all)
74.4
103.6 (Dec)
127.2 (all)
96.8
95.6 (Dec)
124.5 (all)
101.7
111.8
137.8
145.8
116.5
124.7
212.0
122.7 (Dec)
197.4 (all)
162.3
149.4
1947
1926
1988
Jan 1978
2007
2007
1926
2007
Jul 1920
1992
2007
1920
1947
1947
2009
1947
1961
1920
May 1925
1947
1962
Apr 1974
1968
Apr 1990
1947
1966
1992
Feb 2000
1983
1992
Mar 1996
2004
1992
Oct 1956
1930
1992
1930
1930
1930
1930
1988
1902
Jul 1947
1966
1986
Table 2 (continued). Selected record monthly rainfall totals which have occurred during December
2010 at locations with 50 or more years of data. Values shown in bold are records for any calendar
month.
25
Station
number
Name State Rainfall
(mm)
Previous
record (mm)
Year
25000
25519
26007
40095
40120
40158
40247
40258
47008
47029
47040
47093
56032
75003
75042
76000
76031
76047
76052
77004
77005
77008
77014
77023
77030
77033
77035
77039
77048
78010
78086
79023
79028
79040
79075
80002
80004 80009
80023
80027
80067
81020
81038
81085
Alawoona
Wolseley
Frances
Hattonvale
Lowood
Nanango
Lindfield
Yarraman
Cockburn (Burta)
Pooncarie
Wentworth (Wamberra)
Burtundy
Tenterfield
Barham
Maude
Annuello
Mildura
Ouyen
Red Cliffs
Beulah
Berriwillock
Birchip
Culgoa
Lalbert
Narraport
Patchewollock
Rainbow
Sea Lake
Ultima
Dimboola
Jeparit
Horsham (Polkemmet)
Longerenong
St. Arnaud
Rupanyup
Boort
Canary Island Coonooer Bridge
Kerang
Korong Vale (Burnbank)
Charlton
Inglewood
Natte Yallock
Dunolly
SA
SA
SA
QLD
QLD
QLD
QLD
QLD
NSW
NSW
NSW
NSW
NSW
NSW
NSW
VIC
VIC
VIC
VIC
VIC
VIC
VIC
VIC
VIC
VIC
VIC
VIC
VIC
VIC
VIC
VIC
VIC
VIC
VIC
VIC
VIC
VIC VIC
VIC
VIC
VIC
VIC
VIC
VIC
163.0
111.2
121.8
447.6
642.6
534.6
624.4
533.8
209.5
162.0
144.4
138.8
360.4
143.0
157.4
261.4
127.0
130.6
145.6
158.4
155.2
180.6
103.4
149.6
186.4
134.3
181.8
157.0
172.8
150.0
197.2
138.7
152.6
214.6
193.0
202.8
270.7 163.2
153.8
197.0
178.6
218.2
201.8
258.6
135.4
92.6
93.2
337.9
588.4
448.9 (Jan)
517.9 (all)
581.9 (Jan)
610.5 (all)
435.0 (Jan)
438.4 (all)
136.6 (Jan)
197.8 (all)
149.6
128.3
110.0
352.8
129.6
135.4
95.9 (Jan)
133.7 (all)
92.2
111.1
100.9 (Jan)
131.6 (all)
127.8
113.3
105.3
84.0
124.1
79.2
97.0
82.7
101.8
73.5
125.2
142.9 (Jan)
181.4 (all)
116.6
129.8
146.9
93.6 (Jan)
189.0 (all)
99.6
174.3 128.4
144.2
117.6 (Jan)
161.0 (all)
128.4
174.6 (Jan)
209.2 (all)
114.0
123.0 (Jan)
204.8 (all)
1941
2007
2007
1974
1974
1890
Feb 1893
1968
Mar 1955
1974
Feb 1950
1974
Feb 1911
1941
1941
1991
1887
1984
1984
1979
Feb 1969
1984
1941
1941
Oct 1975
1974
1974
1962
1979
1962
1984
1979
1941
1974
1998
1974
1974
Dec 1930
1941
1863
1897
1993
Oct 1975
1974
1928 1974
1928
1974
Oct 1975
1974
1974
Nov 2010
1984
1928
Oct 1975
Table 3. Selected stations with 50 or more years of data where January month-to-date rainfall totals
(as of 17 January 2011) have already exceeded January monthly records. Values shown in bold are
records for any calendar month.
26
Station
number
Name State Rainfall
(mm)
Previous
record (mm)
Year
87017
87029
88009
88015
88020
88043
88051
88059
88109
89002
89011
89068
90008
90059
91009
91065
91102
91109
98013
Blackwood
Lancefield
Cairn Curran
Clunes
Daylesford
Maryborough
Redesdale
Trentham
Mangalore
Ballarat
Dunkeld
Wurrook South
Birregurra
Nelson
Burnie
Mole Creek
Ulverstone
Yolla
Yambacoona
VIC
VIC
VIC
VIC
VIC
VIC
VIC
VIC
VIC
VIC
VIC
VIC
VIC
VIC
TAS
TAS
TAS
TAS
TAS
201.4
207.4
182.2
209.4
223.5
229.3
170.4
229.4
154.8
203.4
161.8
135.0
149.0
188.6
164.6
230.4
130.6
308.2
139.6
197.1
143.6
140.4
139.5 (Jan)
197.4 (all) 162.7
132.5 (Jan)
195.0 (all)
139.1
212.1
116.2
188.6
136.3
114.9
131.8
107.3
126.6
208.6
114.6
211.6
124.0
1970
1904
1973
1928
Dec 1933 1904
1928
Oct 1975
1928
1904
1984
1963
1963
1970
1991
1963
1996
1996
1902, 1904
1996
1997
Table 3 (continued). Selected stations with 50 or more years of data where January month-to-date
rainfall totals (as of 17 January 2011) have already exceeded January monthly records. Values
shown in bold are records for any calendar month.
27
River Location Peak height (m) Date Previous record (m) First year
of data
Dawson
Dawson
Dawson
Dawson
Dawson
Dawson
Dawson
Dawson
Dawson
Dawson
Dawson
Dawson
Nogoa
Nogoa
Nogoa
Comet
Comet
Comet
Mackenzie
Barker
Boyne
Auburn
Burnett
Burnett
Burnett
Burnett
Burnett
Burnett
Burnett
Condamine
Condamine
Condamine
Condamine
Condamine
Condamine
Condamine
Condamine
Condamine
Balonne
Balonne
Moonie
Moonie
Weir
Boyne
Kolan
Utopia Downs
Tanara Crossing
Windamere
Chilgerrie Hill
La Palma
Glebe Weir TW
Glebe Weir HW
Gyrandra Weir
Theodore
Woodleigh
Redcliff
Beckers
Raymond
Craigmore
Emerald
Rewan
Rolleston
Comet Weir
Bingegang
Glenmore
Boondooma Dam
Glenwood
Monto
Lands End
Wuruma Dam
Eidsvold
Gayndah Flume
Coringa
Walla
Clydesdale
Centenary Bridge
(Millmerran)
Loudoun Bridge
Warra-Kogan
Road Bridge
Brigalow Bridge
Beruna
Chinchilla Weir
Condamine
Cotswold
Warkon
Surat
The Deep
Crossing
Tartha
O’Connor
Awoonga Dam
Fred Haigh Dam
14.25
12.50
10.52
10.85
7.70
18.81
9.62
4.80
14.70
18.45
9.01
19.47
12+
18.16
16.05
11.3+
8.2 (approx.)
13.94
17.45
4.45
3.46
14.70
6.49
6.81
3.38
14.28
16.34
10.09
20.10
4.78
8.30
11.20
15.00
14.84
7.95
15.38
15.25
17.82
12.03
12.75
5.65
7.00
14.58
4.16
3.85
28 December
28 December
27 December
27 December
28 December
31 December
31 December
27 December
1 January
2 January
28 December
30 December
28 December
29 December
31 December
27 December
28 December
29 December
2 January
28 December
28 December
29 December
28 December
27 December
28 December
28 December
28 December
27 December
29 December
27 December
28 December
29 December
30 December
30 December
28 December
31 December
1 January
2 January
3 January
4 January
27 December
28 December
28 December
28 December
29 December
12.82 (27/4/1989)
12.09 (26/5/1983)
10.28 (3/5/1983)
10.60 (28/8/1998)
7.39 (23/2/1971)
15.19 (6/5/1983)
6.15 (6/5/1983)
3.94 (7/3/2010)
14.07 (14/2/1956)
13.97 (17/1/1996)
7.36 (22/2/1971)
15.75 (4/5/1983)
11.41 (25/11/1950)
16.25 (20/1/2008)
15.70 (27/11/1950)
10.97 (19/4/1990)
5.87 (19/2/2010)
13.19 (11/2/1954)
17.23 (6/2/1978)
4.11 (10/2/1999)
1.30 (28/7/1984)
13.11 (5/2/1971)
5.96 (9/1/1996)
6.45 (7/2/2003)
0.59 (10/2/1971)
12.36 (8/2/2003)
14.20 (5/2/1971)
8.47 (16/3/1992)
18.07 (5/2/1971)
4.65 (3/5/1996)
8.20 (February 1976)
10.89 (13/2/1976)
14.00 (1956)
13.99 (14/2/1976)
7.20 (8/2/1981)
13.97 (8/4/1988)
14.25 (13/2/1942)
16.13 (8/5/1983)
11.88 (13/1/1996)
12.40 (3/3/2010)
4.45 (10/1/1996)
6.75 (1956)
14.57 (January 1956)
1.74 (7/1/1991)
1.73 (12/3/1977)
1970
1983
1975
1983
1956
1983
1983
1988
1924
1986
1958
1965
1947
1972
1950
1987
1958
1922
1974
1988
1983
1971
1990
1987
1971
1963
1971
1986
1968
1971
1976
1956
1956
1972
1962
1956
1924
1967
1941
1910
1970
1956
1956
1987
1977
Table 4. A selection of record flood peak heights (preliminary data) reached during the event at
sites with 20 or more years of observations. (HW – headwater/lake level; TW – tailwater/outflow
level).
28
River Location Peak height (m) Date Previous record (m) First year
of data
Campaspe
Campaspe
Campaspe
Loddon
Loddon
Avoca
Avoca
Avoca
Wimmera
Redesdale
Barnadown
Rochester
Syphon
Newstead
Appin South
Archdale Junc.
Charlton
Quambatook
Glenorchy
6.30
7.59
9.17
5.86
3.52
5.32
8.05
3.01
5.04
14 January
15 January
15 January
14 January
17 January
14 January
15 January
18 January
15 January
5.80 (September 2010)
6.15 (September 1983)
9.15 (September 1983)
5.35 (July 1990)
3.19 (October 1996)
5.15 (September 1988)
7.30 (September 2010)
2.50 (September 1983)
4.97 (September 1988)
1953
1977
1963
1967
1927
1966
1989
1967
1950
Table 4 (continued). A selection of record flood peak heights (preliminary data) reached during the
event at sites with 20 or more years of observations. (HW – headwater/lake level; TW –
tailwater/outflow level).