Embed Size (px)
Citation preview

SPECIAL REPORT
· The GDP effect of the domestic provisions of Camp’s income tax reform
would be to raise the level of GDP very slightly over the long term by
about 0.2 percent compared to current law, consistent with the lower
end of the Joint Tax Committee’s estimates for the proposal.
· The improvement in GDP is dependent on a partial inflation adjustment
of the depreciation schedules for equipment in the Camp draft. Without
the partial inflation adjustment, we find that the Camp plan would
reduce GDP relative to current law by about 0.4 percent.
· The income tax reform plan would reduce labor productivity and total
pre-tax income. However, the after-tax wage would rise due to personal
tax rate reductions, encouraging more labor force participation. Reduced
labor costs and higher after-tax wages should increase hours worked,
equivalent to adding about 486,000 full-time jobs. People would be
working longer but producing less total output with less capital.
· If the reform plan had retained the current depreciation regime
(MACRS), it would generate 6 times the growth and 40 percent more
jobs and produce a small revenue gain after economic growth. If it had
retained MACRS and allowed a 50 percent exclusion of capital gains
and dividends, instead of the 40 percent exclusion in the plan, it would
generate 12 times the growth and nearly twice the additional jobs and
would result in a significant revenue gain in the long term.
· A more fundamental reform—such as replacing the income taxes with
a personal expenditure tax or other “saving-consumption neutral” tax
system—could raise GDP by 12 percent to 15 percent and could either
return larger revenue to the government for deficit reduction or remain
revenue neutral on a dynamic basis to maximize the growth effect.
Key Findings
An Economic Analysis Of The Camp Tax Reform Discussion DraftBy Stephen Entin, Michael Schuyler, William McBrideMay. 2014
No. 219

2Introduction
Chairman Dave Camp (R-MI) of the House Ways and Means Committee released his tax reform plan earlier this year. We used our Taxes and Growth model to estimate the long-run economic and federal revenue effects of the draft income tax reform plan. Our modeling effort was concentrated on the domestic provisions of the proposal.
The reform was intended to be revenue neutral on a static basis (assuming no change in GDP). It was also intended to create a less distortive tax system that might collect revenue in a more growth-friendly manner while remaining distributionally neutral.
Overall, we find that the domestic provisions of Camp’s tax reform proposal would increase GDP by 0.22 percent over the long run, which is on the low end of estimates by the Joint Committee on Taxation. Additionally, the plan would raise taxes on capital and modestly decrease the capital stock by 0.18 percent. It would reduce taxes at the margin on labor income, adding an additional 486,000 jobs, but slightly decrease pre-tax wages by 0.21 percent, largely due to the decrease in the size of the capital stock.
Chairman Camp’s Reform Proposal
Chairman Camp’s plan is based on the idea that eliminating special tax provisions that are labeled as tax expenditures might reduce tax-related distortions and make the allocation of capital in the economy more efficient, thereby offsetting the revenue cost of the lower tax rates without harming the growth objective. Another key assumption is that lower statutory tax rates and a shift to a more territorial tax system will improve the competitiveness of the American economy in the global marketplace. Lower tax rates might induce companies to bring their patents and other intellectual property back to the United States and thus shift the associated royalty income back to the U.S. as well. Other sources of income shifting might be discouraged either by closing loopholes that allow the shifting or by enacting a lower corporate tax rate to make the United States a relatively attractive place in which to report taxable income.
Pro-growth Changes to the Tax Code
Chairman Camp’s plan has many helpful features that, by themselves, would promote growth and competitiveness. Chief among these are the reduction in the corporate tax rate to 25 percent, the cut in the basic individual income tax rates to 10 percent and 25 percent, and the elimination of the individual and corporate alternative minimum taxes (AMT). The lower corporate tax rate would improve the competitiveness of American businesses in the global economy. The complex worldwide tax system for multinational businesses would be replaced by a more territorial system. A number of complicated features of the income tax, such as multiple types of education saving arrangements, are simplified. Some wasteful credits are ended, incentives for shifting income abroad are reduced, and some

3helpful anti-fraud provisions would be implemented. Enormous effort went into sorting out these complex issues.
Revenue Offsets to Pay for Rate Changes
Other features of the plan reduce the cost or provide revenue to pay for the rate changes. Some itemized deductions, such as for state and local taxes, would be eliminated. A 10 percent surtax is imposed on higher incomes, effectively creating a 35 percent tax bracket; the surtax is waived for manufacturing activity. The plan eliminates the personal deduction but offers an enhanced standard deduction and child credit. The standard deduction, child credit, the 10 percent bracket, and itemized deductions not eliminated outright would be recaptured in a number of instances via phaseouts or surtaxes that raise marginal tax rates over a range of incomes.1 Such recaptures contribute to the distributional neutrality of the proposal.
Other revenue offsets affecting individuals include a higher top tax rate on capital gains and dividends and a temporary suspension of inflation indexing of contribution limits to certain retirement arrangements. In the business tax area, the plan would shift from the current modified accelerated cost recovery system (MACRS) now in general use to the alternative depreciation system (ADS), which under current law is imposed on foreign subsidiaries of U.S. firms. ADS would require businesses to use longer asset lives in claiming deductions for the cost of purchasing plant, equipment, and structures. These elements would reduce investment and output. However, the plan includes an acceleration of the depreciation allowances in the presence of inflation, which somewhat reduces the adverse effect of the longer lives when inflation occurs. Additional details on the contents of the Camp proposal are presented in the Appendix.
In short, the Ways and Means Committee undertook a Herculean job in overhauling the income tax. It confined its efforts to reforming that system, with the additional goals of keeping the changes largely neutral as to the distribution of the tax and revenue neutral within the budget window, assuming no revenue gains from additional growth. The Committee did not consider the more dramatic step of moving away from the income tax to other types of taxes that most economists view as more conducive to economic growth. This is understandable given the current state of the federal budget, the lack of consensus on the revenue gains associated with economic growth, and the political difficulties of explaining the true distributional effects of a pro-growth reduction in the taxation of capital income. Nonetheless, the Committee requested estimates of the growth and revenue effects of the proposal, which is an important advance in the practice of policy formation.
The Results of the Proposal’s Domestic Provisions
1 Alan Cole, True Marginal Tax Rates under Chairman Camp’s Proposal, Tax FoundaTion Tax Policy Blog, Mar. 04, 2014, http://taxfoundation.org/blog/true-marginal-tax-rates-under-chairman-camps-proposal.

4Domestic Tax Provisions Affect GDP and Tax Revenue
We have attempted to sort through the combined economic effects of these many individual and business tax provisions insofar as they affect the cost of capital and the incentive to work, which govern our estimates of the effects of tax changes on domestic investment, hiring, and production. Most of the major domestic provisions were analyzed as to their effect on the economy and the resulting effect on revenue.
Some of the international ramifications of the proposal were not modeled. We expect them mainly to affect revenue, not jobs and output. (See appendix for a brief discussion.)
Growth versus Current Law: Modeling the Plan and Some
Options
We modeled the major domestic provisions in Chairman Camp’s discussion draft both with and without the inflation-adjusted depreciation feature. We assumed inflation of 2.2 percent on the chained price CPI, which is consistent with the Congressional Budget Office’s long-term inflation assumption.
We followed the conventional practice of the Joint Committee on Taxation of comparing the Camp plan to current tax law. The Camp plan would make permanent some investment incentives that are scheduled to expire or be reduced under current law. The largest include Section 179 expensing of investment for small businesses and the R&E tax credit. These items have been extended many times in the past. The extensions would prevent a tax increase compared to current law but would not reduce taxes relative to recent levels of taxation. We doubt the extension of long-effective tax incentives would raise GDP relative to current activity. Nonetheless, the JCT treats them as a tax reduction, relative to current law, and we adopt that convention. (Not counting these extensions as new growth incentives would reduce the growth estimate for the bill by about 0.1 percent, or half the projected growth effect of the bill.)
We also examined the results if two simple but important changes were made to Chairman Camp’s proposal.
· In one model run, we assumed retention of MACRS instead of the shift to ADS.
· In another model run, we assumed a 50 percent exclusion of long-term capital gains and qualified dividends, instead of 40 percent.
· As a third alternative, we combined retention of MACRS and a 50 percent exclusion rate for long-term capital gains and qualified dividends.
The GDP, capital formation, jobs, and revenue results for the different cases are displayed in Table 1. Chart 1 compares the effects on real output. Chart 2 compares the effects on federal revenue on a static and a dynamic basis.
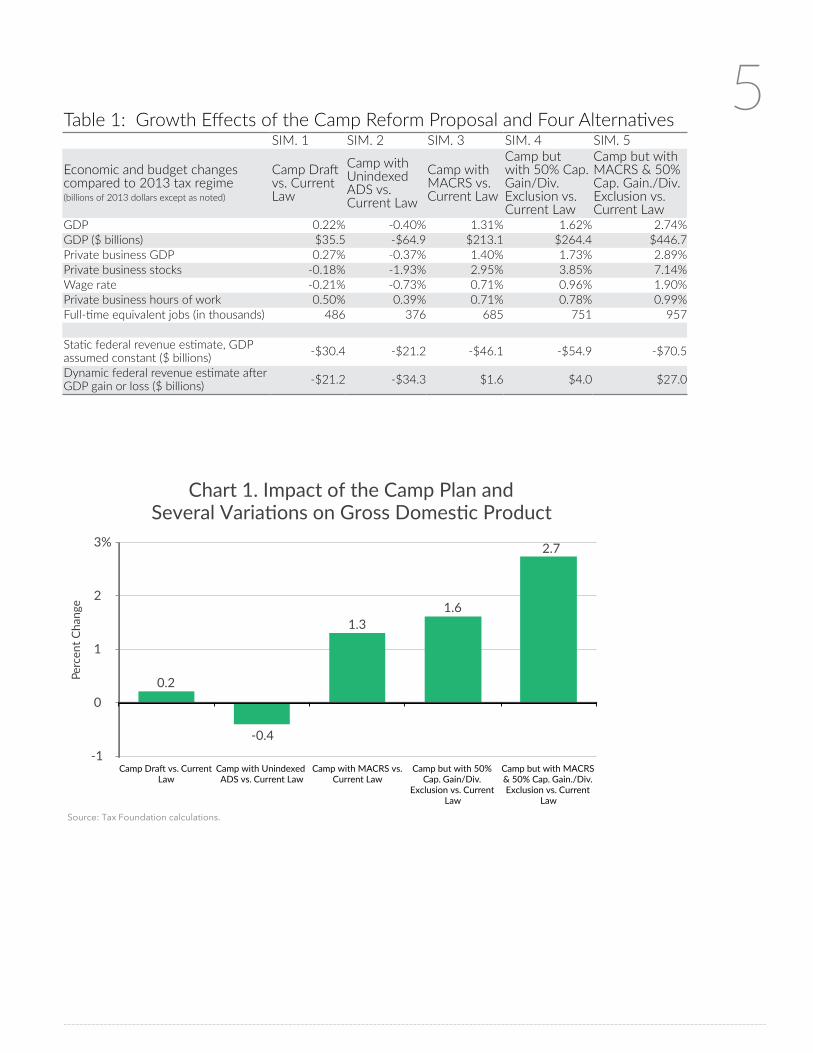
5Table 1: Growth Effects of the Camp Reform Proposal and Four Alternatives
SIM. 1 SIM. 2 SIM. 3 SIM. 4 SIM. 5
Economic and budget changes compared to 2013 tax regime(billions of 2013 dollars except as noted)
Camp Draft vs. Current Law
Camp with Unindexed ADS vs. Current Law
Camp with MACRS vs. Current Law
Camp but with 50% Cap. Gain/Div. Exclusion vs. Current Law
Camp but with MACRS & 50% Cap. Gain./Div. Exclusion vs. Current Law
GDP 0.22% -0.40% 1.31% 1.62% 2.74%GDP ($ billions) $35.5 -$64.9 $213.1 $264.4 $446.7Private business GDP 0.27% -0.37% 1.40% 1.73% 2.89%Private business stocks -0.18% -1.93% 2.95% 3.85% 7.14%Wage rate -0.21% -0.73% 0.71% 0.96% 1.90%Private business hours of work 0.50% 0.39% 0.71% 0.78% 0.99%Full-time equivalent jobs (in thousands) 486 376 685 751 957
Static federal revenue estimate, GDP assumed constant ($ billions) -$30.4 -$21.2 -$46.1 -$54.9 -$70.5
Dynamic federal revenue estimate after GDP gain or loss ($ billions) -$21.2 -$34.3 $1.6 $4.0 $27.0
0.2
-0.4
1.3 1.6
2.7
-1
0
1
2
3%
Camp Draft vs. Current Law
Camp with Unindexed ADS vs. Current Law
Camp with MACRS vs. Current Law
Camp but with 50% Cap. Gain/Div.
Exclusion vs. Current Law
Camp but with MACRS & 50% Cap. Gain./Div. Exclusion vs. Current
Law
Perc
ent C
hang
e
Source: Tax Foundation calculations.
Chart 1. Impact of the Camp Plan and Several Variations on Gross Domestic Product

6
Simulation 1: The Camp plan with the inflation adjustment for
equipment:
· The model projects a long run increase in the level of GDP, after all economic adjustments, of 0.22 percent, or about $35.5 billion in terms of 2013 dollars. Private sector GDP would rise by 0.27 percent.2
· The stock of domestic plant, equipment, commercial and residential properties, and other structures would eventually be 0.18 percent lower than under current law.
· The pre-tax wage rate would be 0.21 percent lower, but hours worked would rise 0.50 percent because the individual tax reductions would raise the after-tax wage. Total pre-tax private sector labor compensation (hours x hourly wages) would rise by about 0.29 percent, pre-tax, roughly in line with private sector GDP. The increase in hours worked would be the equivalent of about 486,000 full time jobs.
· A static revenue shortfall of about $30.4 billion (annual rate) would fall, on a dynamic basis, to about $21.2 billion long term due to the higher GDP.
2 Thesearetotallong-runcumulativechanges,notincreasesintheannualgrowthrate.Forexample,thelong-runincreaseof0.22percentofGDPmightbeachievedbyanaverageincreaseintherateofgrowthofGDPofabout0.02percentayearforadecade(from,perhaps,2.5percentto2.52percent),followedbyareturntotheunderlyinggrowthrates.
-30.4 -21.2
-46.1 -54.9
-70.5
-21.2
-34.3
1.6 4.0
27.0
-80
-60
-40
-20
0
20
40
Camp Draft vs. Current Law
Camp with Unindexed ADS vs. Current Law
Camp with MACRS vs. Current Law
Camp but with 50% Cap. Gain/Div. Exclusion
vs. Current Law
Camp but with MACRS & 50% Cap. Gain./Div. Exclusion vs. Current
Law
Dol
lar C
hang
e (in
bill
ions
)
Static Revenue Estimate
Dynamic Revenue Estimate
Source: Tax Foundation calculations.
Chart 2. Impact of the Camp Plan and Several Variations on Federal Revenue

7Simulation 2: The Camp plan without the inflation adjustment
feature for equipment:
· Without the partial acceleration of depreciation for equipment to counter some of the rise in the tax on capital, the model projects a long-run reduction in GDP of 0.40 percent, or about $64.9 billion in terms of 2013 dollars.
· The stock of domestic plant, equipment, commercial and residential properties, and other structures would eventually be 1.93 percent lower than under current law.
· The pre-tax wage rate would be 0.73 percent lower, but hours worked would rise 0.39 percent because the individual tax reductions would raise the after-tax wage. Total pre-tax private sector labor compensation would decline by about 0.34 percent. The increase in hours would be the equivalent of 376,000 full-time jobs.
· The static revenue shortfall of about $21.2 billion (annual rate) would grow, on a dynamic basis, to about $34.3 billion long term due to the smaller GDP. GDP would fall by nearly twice the tax revenue, lowering after-tax income for the economy as a whole. Government and the private sector would both lose.
· Comparing this result with the Camp plan in Simulation 1, it appears that adding the depreciation adjustment to the base case raises the static cost of the proposal by about $5 billion, but it boosts projected revenue by about $16 billion on a dynamic basis while improving GDP by about $96 billion. This suggests that further improvements in the treatment of the cost of capital could make the plan more pro-growth.
Simulation 3: The Camp plan but keeping MACRS instead of
ADS:
· Keeping MACRS while retaining the rest of the Camp plan would generate six times the gain in GDP as the Camp plan with ADS. GDP would rise 1.31 percent, or about $213 billion in terms of 2013 dollars.
· The stock of domestic plant, equipment, commercial and residential properties, and other structures would be higher by 2.95 percent than under current law, raising productivity.
· The pre-tax wage rate would be 0.71 percent higher, and hours worked would also rise 0.71 percent. Due to the rise in productivity from the higher capital stock, the pre-tax wage would rise instead of fall. The after-tax wage would rise more than in the base case. Total pre-tax private sector labor compensation would increase by nearly 1.43 percent. The increase in hours would be the equivalent of 685,000 full-time jobs.
· The static revenue shortfall of about $46 billion (annual rate) would become a nearly $2 billion long-run annual revenue gain, on a dynamic

8basis, due to the larger GDP. In effect, the economy would gain at no cost to the government.
Simulation 4: The Camp plan but raising the capital gains and
dividend exclusion to 50 percent:
· Increasing the capital gains and dividend exclusion to 50 percent, instead of the plan’s 40 percent, would generate seven times as much gain in GDP as the Camp plan. The model projects a long-run rise in GDP of 1.62 percent, or about $264 billion in terms of 2013 dollars.
· The stock of domestic plant, equipment, commercial and residential properties, and other structures would eventually be 3.85 percent higher than under current law, raising productivity.
· The pre-tax wage rate would be 0.96 percent higher, and hours worked would rise 0.78 percent. Due to the rise in productivity from the higher capital stock, the pre-tax wage would rise instead of fall. The after-tax wage would rise more than in the base case. Total pre-tax private sector labor compensation would increase by nearly 1.75 percent. The increase in hours would be the equivalent of 751,000 full-time jobs.
· The long-run static revenue shortfall of about $55 billion (annual rate) would become a $4 billion long-run annual revenue gain on a dynamic basis due to the larger GDP. The economy would gain at no cost to the government.
Simulation 5: The Camp plan but keeping MACRS and raising
the capital gains and dividend exclusion to 50 percent.
· Introducing both modifications to the reform plan would make it a strong engine for growth, yielding twelve times as much gain in GDP as the Camp plan, further improving the budget outlook. The model projects that adding these improvements would generate a long-run rise in the level of GDP of 2.74 percent, or about $447 billion in terms of 2013 dollars.
· The stock of domestic plant, equipment, commercial and residential properties, and other structures would eventually be 7.14 percent higher than under current law, raising productivity.
· The pre-tax wage rate would be 1.9 percent higher, and hours worked would rise 0.99 percent. The rise in productivity plus the individual tax reductions would raise the after-tax wage more than in the earlier cases. Total private sector labor compensation would increase by about 2.9 percent, pre-tax. The increase in hours would be the equivalent of 957,000 full-time jobs.
· The static revenue shortfall of about $70.5 billion (annual rate) would be more than recovered due to the large growth in GDP, resulting in a $27 billion revenue increase. After-tax GDP would rise by about $16 for each

9added dollar in federal revenue, so the economy would gain significantly even with tax revenue rising.
The 50 percent exclusion for dividends and long-term capital gains has a larger static tax reduction than retaining MACRS, but both would return their initial costs after generating additional output and employment. Per dollar of static revenue loss, MACRS has a more powerful effect than the higher exclusion, raising GDP by more than $11 per dollar of static tax cut versus more than $9 for the exclusion, compared to the Camp draft proposal. The combined alterations to the draft plan would raise GDP by more than $10 for each dollar of static tax reduction.
These results suggest that the anti-growth features of the bill could be corrected with a few key amendments, leading to a larger GDP, a larger tax base, and higher federal revenue than would be realized under the draft proposal. Many of the other admirable features of the draft could be retained. The result would be more growth, more jobs, and a lower deficit.
Winners and Losers
Many of the minor provisions of the Camp draft would be of major importance to the particular businesses and individuals affected. Unfortunately, we are unable to model the highly detailed accounting and regulatory changes in the bill.
More broadly, the major changes in tax rates, cost recovery, and major credits would have greatly varying impacts for different types of businesses and different industries. Winners and losers can be deduced by looking at the effects of the tax changes on the returns required for a business to break even on an investment, after tax. That return is the “service price” or “cost of capital.”
The Camp Plan Would Increase the Cost of Capital
Overall, the Camp plan would increase the service price of capital by 0.47 percent, resulting in a reduction in the capital stock, industrial output, and jobs tied to the missing capital. However, some industries would fare better than others. The service and land-intensive sectors would gain.
The Camp plan would significantly increase service prices for equipment and software (2.9 percent) and for residential structures (2.22 percent), affecting both the corporate and pass-through sectors. It would significantly lower service prices for non-residential structures (-1.6 percent) and other capital assets (mainly land and inventory by -3.98 percent). Industries heavily reliant on these different types of assets would experience rising or falling costs of capital accordingly and would tend to shrink or expand investment and output. More detail on service prices and winners and losers is available in the appendix.

10C Corporations and Pass-Through Businesses Face Different Service Price Levels
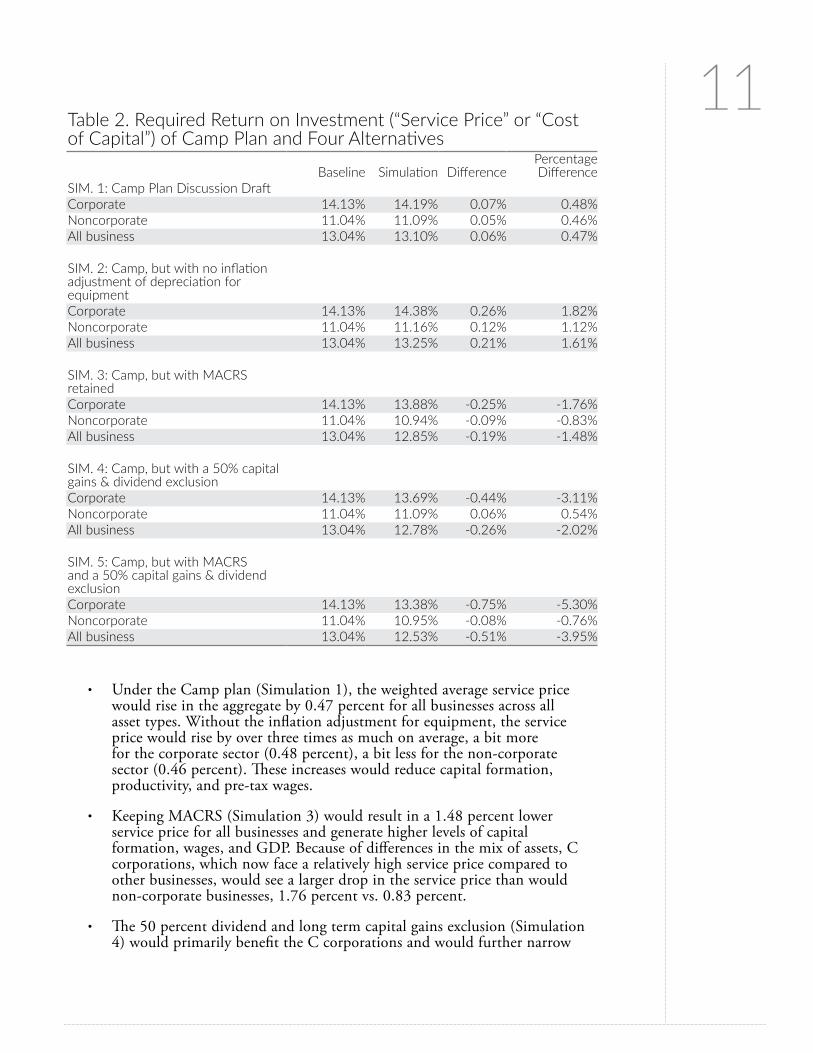
Service price levels and changes are displayed in Table 2 for corporate businesses, for non-corporate businesses, and on a weighted basis for all business, for the five simulations modeled. The service price changes are shown on a dynamic basis, after the resulting changes in GDP. The initial changes in the service prices that initiate the economic adjustments would be larger than shown. In the case of service price reductions, the resulting gains in GDP and income would move some people into higher tax brackets, increasing the service price relative to the initial reduction.
C corporation income is currently taxed more heavily than pass-through income due to the tax at the corporate level and the additional tax on dividends and capital gains imposed on the shareholders. Consequently, the average service price in the corporate sector (14.13 percent) is higher than in the non-corporate sector (11.04 percent). Table 3 shows the changes in more detail by type of asset.
The changes in the services prices vary by type of business in part because the draft plan would reduce the tax rate on C corporations more than for pass-through businesses—from 35 percent to 25 percent for the former and from 39.6 percent to 35 percent for upper income pass-through owners subject to the surtax.3 Therefore, C corporations would experience more rate reduction than would non-corporate businesses. The Camp plan’s rate changes, by themselves, would make the tax treatment in the two sectors a bit more equal (see Table 2).
However, the two types of businesses also have different mixes of asset types (equipment, residential structures, non-residential structures, inventory, and land), resulting in different exposures to the longer asset lives in ADS. Different asset classes fare differently in the shift to ADS. Under ADS, asset lives for equipment and software are about twice their MACRS equivalent. Residential property life rises from 27.5 years to 40 years, also a significant increase. Non-residential commercial property and plant lives rise from 39 years to 40, less of an increase. The asset life changes, by themselves, would raise the average service prices more in the corporate sector than the non-corporate sector, making the tax treatment in the two sectors a bit more unequal (see Table 3).
The different relative effects of the tax rate and asset life changes on the corporate and pass-through sectors roughly cancel out in the Camp plan, which would raise the service prices, on average, by nearly the same amount in both sectors. Some of the alternative plans that we modeled would reduce the disparity in the treatment of C corporations and pass-throughs.
The Service Price of Capital by Type of Business under Camp
and the Four Alternatives
3 Lowerincomepass-throughearnersmightseeasmallermarginaltaxratereductionsfromtheratecuts,asfrom28percentto25percent,orasimilarreduction,asfrom15percentto10percent.
11
· Under the Camp plan (Simulation 1), the weighted average service price would rise in the aggregate by 0.47 percent for all businesses across all asset types. Without the inflation adjustment for equipment, the service price would rise by over three times as much on average, a bit more for the corporate sector (0.48 percent), a bit less for the non-corporate sector (0.46 percent). These increases would reduce capital formation, productivity, and pre-tax wages.
· Keeping MACRS (Simulation 3) would result in a 1.48 percent lower service price for all businesses and generate higher levels of capital formation, wages, and GDP. Because of differences in the mix of assets, C corporations, which now face a relatively high service price compared to other businesses, would see a larger drop in the service price than would non-corporate businesses, 1.76 percent vs. 0.83 percent.
· The 50 percent dividend and long term capital gains exclusion (Simulation 4) would primarily benefit the C corporations and would further narrow
Table 2. Required Return on Investment (“Service Price” or “Cost of Capital”) of Camp Plan and Four Alternatives
Baseline Simulation DifferencePercentage Difference
SIM. 1: Camp Plan Discussion DraftCorporate 14.13% 14.19% 0.07% 0.48%Noncorporate 11.04% 11.09% 0.05% 0.46%All business 13.04% 13.10% 0.06% 0.47%
SIM. 2: Camp, but with no inflationadjustment of depreciation for equipmentCorporate 14.13% 14.38% 0.26% 1.82%Noncorporate 11.04% 11.16% 0.12% 1.12%All business 13.04% 13.25% 0.21% 1.61%
SIM. 3: Camp, but with MACRS retainedCorporate 14.13% 13.88% -0.25% -1.76%Noncorporate 11.04% 10.94% -0.09% -0.83%All business 13.04% 12.85% -0.19% -1.48%
SIM. 4: Camp, but with a 50% capitalgains & dividend exclusionCorporate 14.13% 13.69% -0.44% -3.11%Noncorporate 11.04% 11.09% 0.06% 0.54%All business 13.04% 12.78% -0.26% -2.02%
SIM. 5: Camp, but with MACRS and a 50% capital gains & dividend exclusionCorporate 14.13% 13.38% -0.75% -5.30%Noncorporate 11.04% 10.95% -0.08% -0.76%All business 13.04% 12.53% -0.51% -3.95%

12the difference in tax levels between the C corporate and pass-through sectors.
· Retaining MACRS and adopting a 50 percent dividend and capital gains exclusion (Simulation 5) would lower the average service price by 3.95 percent. It would fall 5.3 percent in the corporate sector and 0.76 percent in the non-corporate sector.
TABLE 3. Change in Required Return on Investment (“Service Price” or “Cost of Capital”) by Asset Category, Camp Plan and Alternatives
Corporate Non-Corporate
Ave. AllBusinesses
SIM. 1: Camp Plan Discussion DraftAll Assets 0.48% 0.46% 0.47% Equipment & Software 2.84% 3.31% 2.90% Non-Residential Structures -1.90% -0.15% -1.60% Residential Structures 0.79% 2.40% 2.22% Other -4.35% -1.22% -3.98%
SIM. 2: Camp, but with no inflation adjustment of depreciation for equipmentAll Assets 1.82% 1.12% 1.61% Equipment & Software 4.44% 4.76% 4.48% Non-Residential Structures -0.56% 1.37% -0.22% Residential Structures 0.77% 2.54% 2.34% Other -4.38% -1.21% -4.01%
Sim. 3: Camp, but with MACRS retainedAll Assets -1.76% -0.83% -1.48% Equipment & Software -0.85% -0.23% -0.77% Non-Residential Structures -2.48% -0.68% -2.17% Residential Structures -2.37% -0.67% -0.86% Other -4.28% -1.24% -3.93%
SIM. 4: Camp, but with a 50% capital gains & dividend exclusionAll Assets -3.11% 0.54% -2.02% Equipment & Software -0.97% 3.35% -0.44% Non-Residential Structures -5.31% -0.08% -4.40% Residential Structures -2.62% 2.48% 1.91% Other -7.34% -1.11% -6.61%
SIM. 5: Camp, but with MACRS and a 50% capital gains & dividend exclusionAll Assets -5.30% -0.76% -3.95% Equipment &S oftware -4.55% -0.20% -4.02% Non-Residential Structures -5.90% -0.62% -4.97% Residential Structures -5.69% -0.61% -1.18% Other -7.31% -1.15% -6.58%

13The Service Price of Capital by Asset Class
· The Camp plan (Simulation 1) would sharply increase service prices for equipment and software by 2.9 percent for all business. The increase is higher for non-corporate businesses (3.31 percent) than for C corporations (2.84 percent). Industries dependent on these inputs, and the makers of these inputs, would feel the largest effects. Non-residential structures would have a lower service price (-1.6 percent), especially in the corporate sector (-1.9 percent), where the rate cuts would lower the service price more than the longer asset life would raise it. The effect in the non-corporate sector would be nearly zero (-0.15 percent). Residential structures would face a higher service price (2.22 percent), with a greater increase for non-corporate businesses (2.4 percent) than for C corporations (0.79 percent). Other asset types (e.g., inventory and land) would see significant reductions in service prices (3.98 percent), perhaps benefitting retail and agriculture.
· By contrast, if MACRS were retained (Simulation 3), the rest of the draft plan would lower service prices for all assets for both types of businesses. The biggest relative improvements are for non-residential structures (-1.48 percent) and inventory and land (-3.93 percent).
· The plan with a 50 percent dividend and capital gains exclusion (Simulation 4) would reduce the service price for C corporation capital, which is subject to taxation at both the shareholder and corporate levels. C corporations would gain significantly from a lower cost of plant (-5.31 percent) and other assets, including inventory and land (-7.34 percent). The added income growth would result in a small increase in the service price for pass-throughs.
· Adopting both modifications (Simulation 5) would reduce service prices significantly across all types of businesses and assets.
A Broader Reform: An Ultimate Growth and Jobs Engine
For comparison, we modeled a more fundamental reform plan that would eliminate all of the income tax biases against saving and investment. Most fundamental tax reforms are economically the same in that they tend to levy only one layer of taxation. Examples of fundamental reforms include the personal expenditure tax or other “saving-consumption neutral” tax systems, such as an individual cash flow tax (a tax on income less saving, that is, on personal consumption expenditures), the Flat Tax, a national sales tax, or a VAT.
Generally, a neutral reform plan would adopt full expensing of investment in plant, equipment, and structures, defer tax on all saving, not just in retirement plans, end the double taxation of C corporation income, and eliminate the estate and gift taxes. We modeled a personal expenditure tax, which have a similar economic effect to each of the comprehensive plans previously listed. (See Table 4.)
· A 14 percent rate “personal expenditure tax” would lift GDP by nearly 12 percent and would be close to revenue neutral on a static basis. It would increase revenues on a dynamic basis, after growth, by about $236 billion

14Table 4. Personal Expenditure Taxes
14% Tax Rate
11.5% Tax Rate
GDP 11.70% 14.82%$GDP ($ billions) $1,907.8 $2,416.6Private business GDP 14.09% 17.18%Private business stocks 32.77% 40.54%Wage rate 8.57% 9.75%Private business hours of work 5.09% 6.77%
Static revenue estimate ($ billions) -$5.9 -$307.5
Federal revenue (dynamic) ($ billions) $235.5 -$1.5
Full-time job equivalent (thousands) 4,898 6,519
Weighted Average Service Price* % Change % ChangeCorporate -29.61% -29.55%Noncorporate -19.09% -19.03%All business -26.48% -26.42%
Weighted Average Service Price by Asset Type* Corporate
Non-Corporate Wtd Ave Corporate
Non-Corporate Wtd Ave
Equipment & software -25.04% -7.56% -22.89% -24.97% -7.54% -22.83% Nonresidential structures -33.90% -17.13% -30.97% -33.84% -17.07% -30.91% Residential structures -33.20% -17.22% -19.01% -33.14% -17.16% -18.95% Other -39.91% -26.25% -38.31% -39.87% -26.17% -38.26% All assets -29.61% -19.09% -26.48% -29.55% -19.03% -26.42%* Shown on a dynamic basis after growth. Initial cuts are larger.
-$5.9 -$307.5
$235.5
-$1.5
$1,908
$2,417
-500
0
500
1,000
1,500
2,000
2,500
3,000
14% Tax Rate 11.5% Tax Rate
Dol
lar C
hang
e (in
bill
ions
)
Static Revenue Estimate
Dynamic Revenue Estimate
GDP
Source: Tax Foundation calculations.
Chart 3. Impact of a Personal Expenditure Tax on Federal Revenue and GDP
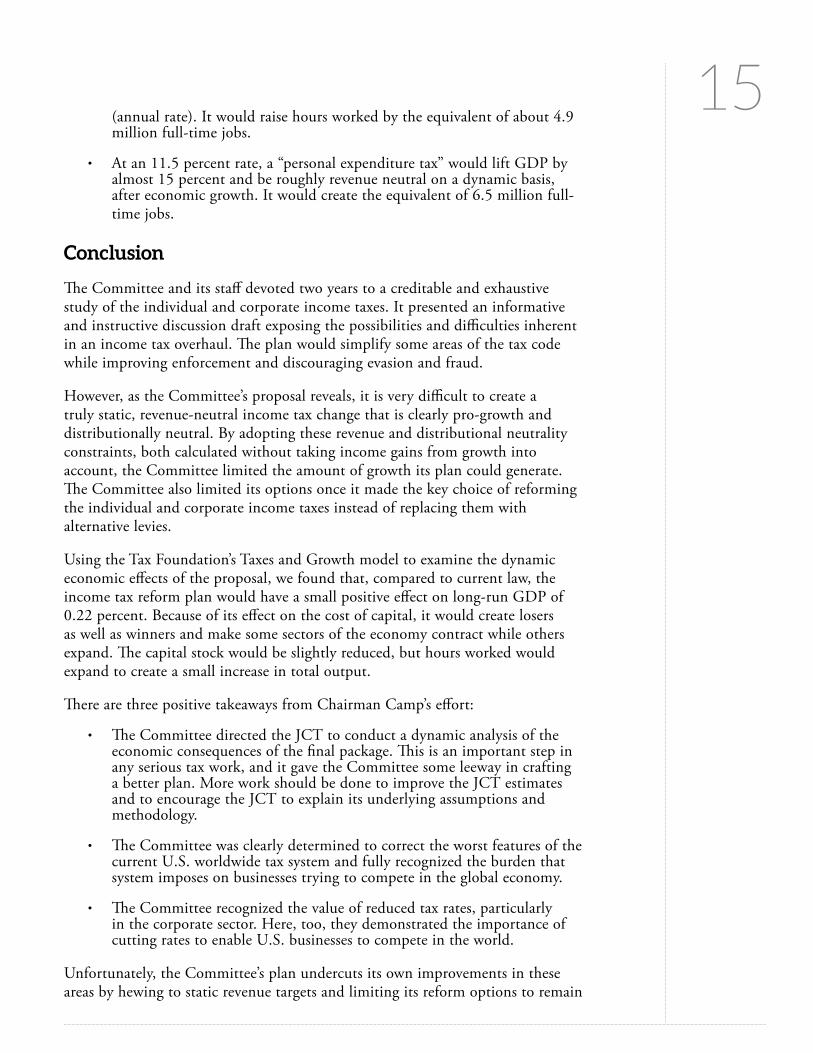
15(annual rate). It would raise hours worked by the equivalent of about 4.9 million full-time jobs.
· At an 11.5 percent rate, a “personal expenditure tax” would lift GDP by almost 15 percent and be roughly revenue neutral on a dynamic basis, after economic growth. It would create the equivalent of 6.5 million full-time jobs.
Conclusion
The Committee and its staff devoted two years to a creditable and exhaustive study of the individual and corporate income taxes. It presented an informative and instructive discussion draft exposing the possibilities and difficulties inherent in an income tax overhaul. The plan would simplify some areas of the tax code while improving enforcement and discouraging evasion and fraud.
However, as the Committee’s proposal reveals, it is very difficult to create a truly static, revenue-neutral income tax change that is clearly pro-growth and distributionally neutral. By adopting these revenue and distributional neutrality constraints, both calculated without taking income gains from growth into account, the Committee limited the amount of growth its plan could generate. The Committee also limited its options once it made the key choice of reforming the individual and corporate income taxes instead of replacing them with alternative levies.
Using the Tax Foundation’s Taxes and Growth model to examine the dynamic economic effects of the proposal, we found that, compared to current law, the income tax reform plan would have a small positive effect on long-run GDP of 0.22 percent. Because of its effect on the cost of capital, it would create losers as well as winners and make some sectors of the economy contract while others expand. The capital stock would be slightly reduced, but hours worked would expand to create a small increase in total output.
There are three positive takeaways from Chairman Camp’s effort:
· The Committee directed the JCT to conduct a dynamic analysis of the economic consequences of the final package. This is an important step in any serious tax work, and it gave the Committee some leeway in crafting a better plan. More work should be done to improve the JCT estimates and to encourage the JCT to explain its underlying assumptions and methodology.
· The Committee was clearly determined to correct the worst features of the current U.S. worldwide tax system and fully recognized the burden that system imposes on businesses trying to compete in the global economy.
· The Committee recognized the value of reduced tax rates, particularly in the corporate sector. Here, too, they demonstrated the importance of cutting rates to enable U.S. businesses to compete in the world.
Unfortunately, the Committee’s plan undercuts its own improvements in these areas by hewing to static revenue targets and limiting its reform options to remain

16within the narrow confines of the income tax. These limitations resulted in a plan with limited growth.
Earlier in the process, the Committee should have made more use of dynamic analysis of the economic effects to shape the package. Had they relied on more economic analysis in the planning stages, they could have steered away from including some of the most anti-growth elements of the proposal, including adverse changes to cost recovery. If the Committee had included the benefits of economic growth for lower- and middle-income taxpayers in its calculations, it would have made some of the anti-growth provisions relating to distributional neutrality unnecessary.
The Committee could build on the many good features of the proposal by adjusting its approach to capital cost recovery and the taxation of saving. They would discover that a bolder reform, with lower tax rates on saving and capital formation, would generate stronger growth and higher incomes for the public at no net revenue cost to the government. That sort of reform would raise incomes and employment by many times that of the current plan.

17APPENDIX
The Camp Proposal’s Main Features
Chairman Camp’s primary goal was to reduce the top individual and corporate tax rates to 25 percent. He saw these dramatic rate cuts as part of a package that would include provisions eliminating unjustified tax breaks, simplifying the tax code, and taking common sense steps to discourage tax fraud.4
Title I. The individual tax rate changes and alterations to
deductions and credits
The plan Chairman Camp developed would move the individual income tax’s statutory rates part way toward his goal. The tax would have brackets of 10 percent on the first $35,600 of taxable income ($71,200 for joint filers) and 25 percent on additional taxable income (amounts in 2013 dollars). In addition, there would be a 10 percent surtax beginning at $400,000 ($450,000 for joint filers), which might be regarded as a third bracket of 35 percent. The surtax’s threshold would be based on modified adjusted gross income (MAGI), which is an expanded definition of income that would disallow most deductions and would include several items not currently subject to the income tax, such as employer-provided health benefits and municipal bond interest.
Chairman Camp also proposes to raise the standard deduction to $11,000 ($22,000 for joint filers).
The plan would rationalize the income tax adjustments for children and other dependents by increasing the child credit to $1,500, extending it to children under age 18 rather than current law’s age 17, adding a $500 credit for other dependents, repositioning the earned income tax credit (EITC) to its original objective of, in effect, exempting the poor from payroll taxes on their first several thousand dollars of earned income, establishing a $5,500 additional standard deduction for low-income single parents, and repealing the personal exemption. The Ways and Means Committee summary notes that these measures, together with the higher standard deduction, would be more beneficial to most taxpayers than current-law treatment.
The Camp plan would replace the confusing welter of education deductions, exclusions, and credits in the income tax code with a permanent, reformed American Opportunity Tax Credit (AOTC) and would expand the exclusion of Pell grants from taxable income.
The plan includes a variety of surtaxes and phaseouts. The 10 percent surtax mentioned above is the most obvious. There would also be a 5 percent surtax,
4 ForadiscussionofChairmanCamp’saspirationsandthebenefitsifhesucceeded,seeHouseWaysandMeansCommittee,The Tax Reform Act Of 2014, Fixing Our Broken Tax Code So That It Works For American Families And Job Creators(Feb.2014),http://waysandmeans.house.gov/UploadedFiles/Tax_Reform_Executive_Summary.pdf.

18starting at $250,000 of MAGI ($300,000 for joint filers) to claw back the tax savings from the 10 percent rate bracket. The standard deduction would be phased out at a 20 percent rate, starting at $356,800 of MAGI ($513,600 for joint filers).5 An equivalent phaseout would apply to itemized deductions. The additional standard deduction would be phased out at a 100 percent rate, starting at $30,000 of adjusted gross income. The child tax credit would be phased out at a 5 percent rate, starting at $411,800 of MAGI ($623,600 for joints), which is much higher than the current-law threshold.6 The EITC would also be phased out based on AGI, starting at higher thresholds than those of current law.
Whereas current law caps the individual income tax rate on long-term capital gains and qualified dividends at 20 percent, Chairman Camp’s plan would exclude 40 percent of long-term capital gains and qualified dividends from income but tax the remainder at the ordinary tax rate. For a taxpayer in the 25 percent bracket and subject to the 10 percent surtax, this would create a 21 percent tax rate, which is slightly higher than the top rate under current law. When this is combined with the Affordable Care Act’s newly effective 3.8 percent surtax on investment income for higher-income taxpayers, which the Camp proposal would retain, the top rate on capital gains and dividends would rise from 23.8 percent under current law to 24.8 percent. Other take-backs could push the rate higher.7
The plan would repeal or trim most itemized deductions. Among those that would be eliminated entirely are the state and local tax deductions and the medical deduction. The charitable deduction would remain but would be limited to contributions exceeding 2 percent of AGI. On the other hand, while current law permits most miscellaneous deductions to be claimed only to the extent they exceed 2 percent of AGI, the Camp plan would no longer impose that haircut.
The Camp proposal has a variety of other revenue raisers, most highly technical. For example, under current law, the contribution limits on defined benefit and defined contribution retirement plans are generally indexed for inflation. The Camp plan would suspend this inflation indexing for a decade, resulting in $63.4 billion of added federal revenue according to the JCT.8 This would reduce the value of the contribution limits by about 25 percent at the CBO’s forecast rate of inflation of a bit over 2 percent a year over the decade.
The net result of these changes would be a large decrease in individual income taxes. The JCT states, “The proposal is projected to result in a reduction in
5 ThesenumbersdifferslightlyfromthoseintheCommittee’ssection-by-sectionsummary.SeeHouseWaysandMeansCommittee,Tax Reform Act of 2014, Discussion Draft, Section-by-Section Summary(Feb.2014),http://waysandmeans.house.gov/UploadedFiles/Ways_and_Means_Section_by_Section_Summary_FINAL_022614.pdf[hereinafterWaysandMeans,Discussion Draft].Thisphaseoutissequencedtobeginwheretheprevioustake-backends.ByTaxFoundationcalculations,thenumbersinthetextarethephaseout’sstartingpoint.(AsintheCommittee’sdiscussiondraft,theamountsarein2013dollars.)Seenote2, supra.
6 WaysandMeans,Discussion Draft, supranote5.7 Oneofthemostobscurebutdramaticexamplesisthatsomeonesellingahomewouldlosethenormal
exemptiononthegainfromthesaleattherateofonedollaroflostexemptionforeverydollarofMAGIabove$250,000($500,000forjointfilers).Wedidnothavethedatatomodelthisprovisionexplicitlyfortheaffectedtaxpayers.WetreateditasabackdoorincreaseinthecapitalgainstaxrateinproportiontotherevenuegainreportedbytheJCT.
8 SeeWaysandMeans,Discussion Draft, supranote5,at44-45.

19individual income tax payments (not including revenues due to broadening the taxable base of pass-through businesses) of about $590 billion over that [2014-2023] budget period.”9 The parenthetical expression warns that the $590 billion estimate does not include new revenue from broadening the tax base for pass-through businesses; if it did, the tax reduction on the individual side would still be large, but not as big as $590 billion.
Tax increases on the pass-through entities are recorded in the business tax side of the JCT’s revenue estimation table along with the tax increases on the C corporations. They total more than $590 billion. The entire plan is scored as being nearly budget neutral on a static basis.
Title II. Repeal of the AMT
Title II of the draft bill repeals the individual and corporate alternative minimum taxes. Our model deals directly with the individual AMT. The repeal of the corporate AMT was modeled as a tax reduction offsetting some of the revenue raisers levied on the C corporations, based on the revenue estimate in the JCT table.
Title III. Business tax changes
Title III of the draft deals with other business tax changes.
Subtitle A provides a phased-in reduction of the top corporate tax rate from 35 percent to 25 percent in stages of two percentage points a year for five years. The long-run rate, 25 percent, was modeled directly. The provision also raises the lowest corporate bracket rate from 10 percent to 25 percent, but it affects relatively little income at the margin, and we did not model it.
Subtitle B covers the reform of 40 business-related exclusions or deductions.
Cost recovery. The biggest item is the shift from MACRS to ADS, with a modest and imperfect inflation adjustment. Our model directly computes the changes in depreciation regimes. We added the inflation adjustment to our capital recovery calculator. The inflation provision would accelerate write-offs for equipment and short-lived structures in the presence of inflation. The inflation adjustment does not apply to real property, which has the longest asset life and is affected the most by inflation. For the shorter-lived assets, the provision offsets only a small portion (about 20 percent) of the adverse effect of inflation on the real present value of the capital cost recovery allowances. Nonetheless, it is sufficient to convert the total
9 SeeJointCommitteeonTaxation,Macroeconomic Analysis Of the ‘Tax Reform Act Of 2014’,JCX-22-14(Feb.26,2014)at7,http://waysandmeans.house.gov/UploadedFiles/JCT_Macroeconomic_Analysis_JCX_22_14__022614.pdf.

20tax package from having a small negative effect on economic growth to one with a small gain in GDP.10
Most other provisions in the subtitle raise business costs at the margin. Among the largest provisions are the phaseout and repeal of the domestic production deduction (the manufacturer’s deduction), amortization of half of advertising costs over $1 million, amortization of expenditures on research and development, and repeal of deductions for most entertainment outlays. Items in this section were attributed either to the C corporation sector or the pass-through sector where information on the division was available from the JCT or Treasury tax expenditure documents or other sources. Otherwise, the dollar amounts were divided as 45 percent C corporate and 55 percent pass-through, in rough proportion to the two sectors’ shares of net business income. Deductions relating to certain conservation outlays were treated as non-marginal.
Section 179 expensing. The extension of the allowance for the expensing of small business investment, known as Section 179 expensing, is scored as a tax reduction by the JCT. We have reluctantly adopted that convention. We have two objections: 1) the extension is at levels that are less than were available in recent years, and 2) Section 179 has a phaseout that diminishes its effectiveness at the margin.
Section 179 has been expanded in recent years on a temporary basis. In 2013, businesses could expense up to $500,000 of investment if the total investment did not exceed $2 million. As investment exceeded the $2 million threshold, the credit was reduced, which increased the cost of the incremental investment in the phaseout range. Therefore, some businesses experienced an incentive to add to investment, while others experienced a disincentive to grow further.
The enlarged expensing limits and phaseout thresholds expired at the end of 2013, and the allowable amounts reverted to their permanent levels of $25,000 in investment for businesses with a phaseout beginning at $200,000 in total investment. The Camp plan would make permanent a portion of the recent enlargements. It would permit expensing of up to $250,000 in investment for businesses with up to $800,000 in total investment. Because the new levels are higher than the old permanent limits that have reemerged under current law, the JCT scores the extension of the provision as a net tax reduction. However, while the limits are larger than the permanent levels in current law, the new limits would be lower than in recent years and would do less to encourage investment going forward than the current levels. On the other hand, making the allowance permanent would increase confidence among investors as to its reliability.
Subtitle C reforms 30 business credits. Many are repealed. We treated most as equivalent to a tax rate increase of equal value and allocated them to the C
10Theprovisionismislabeled“neutralcostrecovery,”otherwiseknownasNCRS.NCRSwouldexpandscheduleddepreciationdeductionsforinflationandanormalrealreturnoninvestment,makingthemequalinvaluetoimmediateexpensing.Theprovisioninthedraftonlydealswithinflation,andnotcompletely.Afullinflationadjustmentwouldindexthedepreciationschedulesforinflation,notmerelyadvancepartoftheexistingnominalwrite-off.

21corporate sector or the pass-through sector as was done for the items in Subtitle B. A credit for electricity from unconventional sources was considered to be not at the margin, as it replaces one source of relatively low-cost power with another, higher-cost alternative. Its repeal would not reduce GDP.
The R&E credit expired (as it sometimes does) at the end of 2013. It is being considered for renewal in the current “extenders” bill. The Camp proposal would permanently extend the R&E credit with modifications that make it somewhat less attractive than its recent (pre-expiration) form. As discussed above regarding Section 179, we followed the JCT convention and treated the R&E credit extension as a net tax cut compared to current law. This treats the provision as increasing GDP, even though it is not a tax reduction compared to recent policy and, indeed, is not as beneficial. One argument for treating it as a tax reduction is that permanency would increase the credit’s reliability, which has suffered over the years from the occasional lapses of the provision.
Subtitle D limits the use of cash accounting. The provision mainly affects pass-throughs. This subtitle eliminates last-in, first-out treatment of inventories (LIFO) and the use of “lower of cost or market” rules. Most of the cost would be borne by C corporations. All are at the margin and were modeled as rate increases of equal value.
LIFO repeal required special attention. The provision requires the use of first-in, first-out accounting (FIFO) going forward and requires businesses to begin to report as taxable income their existing LIFO reserve, the difference between LIFO and FIFO dating back on their books for all existing inventory. The tax on the reserve is collected in stages over four years, 2019-2022.11 We counted only the permanent portion of the LIFO repeal as a tax increase for the long run estimates (roughly $1.7 billion a year).
Subtitle E tightens rules relating to a number of financial instruments and practices, including termination of private activity bonds that enjoy tax-exempt status. We assumed that the provisions would affect financing of marginal investments in the economy and reduce investment. The largest provisions include the tax timing of certain derivatives and the termination of private activity bonds.
Subtitle F contains reforms of the insurance sector. The largest involve requiring the computation of life insurance tax reserves, amortization instead of expensing of policy acquisition costs, and changes in the discounting rules for property and casualty insurance companies. We consider most of the provisions to adversely affect saving and to act at the margin to slow growth. We assumed the elimination of the tax free status of the Blues to have no effect at the margin, as if the current exclusion does more to rearrange market share than increase total activity in the sector.
11 CloselyheldbusinesseswouldhavetopayononlyaportionoftheirFIFOreserves,20percentforcloselyheldentitiesand28percentforcloselyheldCcorporations.

22Subtitle G contains 39 provisions classified as relating to pass-through entities, many dealing with the accounting treatment of REITs and insurance. These items were allocated to pass-throughs and treated as acting at the margin as equivalent to a tax rate increase.
Subtitle H provisions are classified as provisions in the taxation of foreign persons. Except for some tax increases on foreign cruise ships, they actually fall on domestic businesses dealing with foreign parties. The provisions relating to reinsurance with foreign companies, earnings stripping, and reduced deductibility of payments to foreign affiliates were treated as at the margin costs of the C corporation sector.
Subtitle I provisions relating to compensation primarily limit deductions for salaries or pension contributions for high-income employees. These provisions, and the elimination of a credit for employers’ payroll tax on tip income of employees in Subtitle C, were treated as implicit increases in the marginal tax rate on wages and salaries in the C corporation sector.
Title IV. Taxation of Foreign Income
Taxation of foreign income would be transformed. The plan would end the current practice of taxing worldwide income of U.S. businesses on a deferred basis with a foreign tax credit for taxes paid abroad (when it is repatriated). The plan would replace it with a nearly territorial tax system, without deferral, but with a sharply reduced tax rate on foreign earnings. A pure territorial tax would not tax the foreign earnings of domestic businesses. The proposed reform would subject 5 percent of foreign earnings to tax on an annual basis, in line with the practice of a handful of other developed countries. The effective tax rate would be 1.25 percent (5 percent of a 25 percent corporate tax rate). Firms would have to pay the reduced-rate tax each year on foreign earnings they are now able to defer indefinitely.12 The draft reform could improve the competitiveness of U.S. firms that have been repatriating profits under current law but would slightly increase taxes for businesses that have been reinvesting foreign earnings abroad. It would simplify the taxation of multinational businesses, and make it easier for firms to tap liquid foreign assets to finance expansion in the U.S.
Many nations encourage the location of highly mobile capital in their countries by means of a reduced tax rate on assets such as patents and other intellectual property. The Camp plan would set a low tax rate on “super-normal” earnings of intangibles such as patents, and of other assets, imposed equally whether U.S. firms choose to house the property in the United States or abroad in low-tax
12 Underatransitionrule,firmswouldhavetopaytaxonexistingdeferredforeignearningsdatingbackto1986atreducedtaxratesof8.75percentonearningsheldincashorcashequivalentsand3.5percentonearningstiedupinlessliquidproperty.Taxesreceivedunderthisprovisionwouldbeearmarkedforthehighwaytrustfund,yettheyareincludedinthecalculationofwhetherthereformisrevenueneutralonastaticbasis.

23countries such as Ireland or Switzerland. The reduced rate would be set at 15 percent on earnings in excess of a 10 percent rate of return (by means of a 40 percent exclusion of the income from the normal 25 percent tax). Though less than the current 35 percent corporate tax rate and the proposed 25 percent corporate tax rate in the draft plan, the 15 percent rate is higher than companies now pay by holding patents abroad in low-tax countries and deferring the income. This arrangement would eliminate incentives to house patents abroad in low-tax countries. However, the effective tax increase might discourage research and development by U.S. firms and reduce the hoped-for revenue from an assumed shift of patents and their associated royalties to the U.S. The complexity of computing a tax on income above a threshold rate of return could counter the simplification achieved in the international reform area.
Title V. Tax Exempt Entities and Title VI – Tax Administration
and Compliance
These sections had minimal revenue effects and were not modeled.
Title VII. Excise Taxes
Title VII of the draft relates to excise taxes, although the largest element is a tax on assets. One of the two big items in the section is the repeal of the Affordable Care Act excise tax on medical devices. The Tax Foundation’s Taxes and Growth model treats excise taxes as falling two-thirds on labor and one-third on capital. The other big item is a tax on the assets of about a dozen large banks and insurance companies if their assets exceed $500 billion and they are deemed to be systemically important according to the Dodd-Frank Act. We modeled it as a corporate tax rate increase affecting the C corporate sector. The tax may be avoided if businesses shift massive amounts of borrowing to smaller banks or if the major banks and insurers split themselves up to fall beneath the asset threshold of the tax. However, there are substantial advantages to nationwide banking and insurance, and large economies of scale in the sector, especially for businesses seeking large loans or engaging in new issues of stock. Avoidance would be difficult and disruptive.
International Provisions Omitted: They Mainly Affect Revenue, Not Jobs And Output.
Many of the international provisions of the plan would affect federal revenue but not real economic activity. We did not model the economic or budget effects of the shift to a quasi-territorial tax and the effect on tax revenues from income shifting from abroad due to the lower U.S. tax rates. The JCT has tried to include such behavior changes in its analysis of the reform plan because they would affect federal revenue. There is considerable evidence that income shifting is a real phenomenon, although estimates of the amount vary widely. The behavior changes may also play a role in some of JCT’s macroeconomic analysis.
24Income shifting
The JCT has suggested a significant revenue effect from income shifting back to the U.S. from abroad. The international tax provisions in the reform proposal simplify matters for U.S. multinational businesses and the IRS, and they reduce incentives for transfer pricing and other tax planning efforts. We do not model these compliance and enforcement savings, and we do not estimate any revenue enhancement from these international provisions.
Unlocking foreign earnings
The unlocking effect on accumulated foreign earnings is important to businesses with large amounts of accumulated foreign earnings abroad that they do not wish to invest there. Firms can borrow against liquid foreign assets to finance domestic growth without repatriating the income and paying U.S. tax. Consequently, important domestic projects go forward in spite of the tax nuisance. However, borrowing is more costly and more cumbersome in terms of legal and filing fees than having free access to one’s own funds. We do not model these costs.
Relocating intangibles
One of the JCT’s models (the OLG model) assumes that patent shifting impacts domestic production to a small degree. We do not make that assumption. Patent shifting by itself would do little to change domestic production. Shifting a patent from Dublin to Delaware would increase royalty income reported to the IRS and move that global royalty output from Irish GDP accounts to U.S. GDP accounts. That by itself would not increase U.S. production of goods and services by businesses using the technology or other benefits of the patent insofar as they are already using the technology to boost output. However, provisions of Subpart F may create a link between the location of patents and the location of manufacturing. Subpart F can penalize firms that manufacture here but locate their associated patents abroad. Under certain conditions, if the U.S. production unit licenses the patent from the foreign affiliate, it can result in a prohibitive tax on the worldwide royalties. But instead of inducing firms to keep the patents at home with their domestic manufacturing, the unintended consequence may be to induce the firms to move the domestic manufacturing abroad to be with the patents. The “anti-base erosion” features of Chairman Camp’s proposal aim to make it equally as attractive to keep the patents and manufacturing in the U.S. as abroad. We lack data to estimate the effect of correcting this consequence of
current law.

25Comparative Analytics
The Tax Foundation Taxes and Growth Model, Assumptions,
and Methods
People’s willingness to supply labor and capital in the production process depends on incentives. If tax changes increase the after-tax rewards to labor and capital, people will supply more labor and capital, enabling output to rise. Conversely, tax changes that reduce after-tax incentives will depress the quantities of labor and capital and lead to less output.
The Tax Foundation’s Taxes and Growth model is driven by the effect of tax rate and depreciation changes on the cost of capital assets, which determines the amount of capital sited in the United States, and the marginal tax rates on the earnings of labor, which affect the incentive to work and the cost of hiring. These combine to generate the amounts of capital stock and labor inputs that together produce GDP.
The Taxes and Growth model is a long-run dynamic equilibrium model.13 The model calculates the long run changes to the economy that a policy shift would produce, after all economic adjustments have time to unfold. This would normally take about five years for tax changes to equipment and ten years for changes to plant and commercial buildings. Labor and the prices of financial assets would move swiftly to begin the adjustment process. International financial flows (such as an inflow of foreign funds if U.S. tax changes make investing here more attractive) speed the adjustment process.
The model first calculates how tax changes affect the after-tax rewards to labor and capital. For individual income tax changes, the model simulates the tax effects using an anonymous sample of approximately 140,000 tax returns from the IRS’s Public Use File for 2008. The model then estimates the long-run adjustments in the quantities of labor and capital to the new after-tax rewards. Based on historical evidence, the supply of labor is mildly responsive to changes in after-tax rewards, and capital is extremely responsive. The model next calculates the amount of output that the new quantities of labor and capital will produce. The model relates the quantities of labor and capital to the quantity of output using what is known as a Cobb-Douglas production function. The initial quantities of labor, capital, and output are all calibrated to actual data from the National Income and Products Accounts (NIPA).
Note that the labor supply effects are determined by changes in after-tax wages. In the results above, reduced investment leads to lower productivity and lower pre-tax wages and total compensation. However, hours worked rise because they are driven by the higher after-tax wages of workers who pay taxes and get a tax reduction, or receive higher refundable work-related credits. They are working
13FormoreinformationabouttheTaxFoundation’sTaxesandGrowth(TAG)model,see http://taxfoundation.org/taxes-and-growth.

26more hours but are producing less output. The loss in GDP is ultimately born by savers, retirees, and consumers. The population as a whole is worse off.
We assume a labor force elasticity of 0.3; that is, a 10 percent increase in the after-tax wage would trigger a 3 percent increase in the labor supply. This is in the middle-to-high portion of the labor responses usually assumed by labor economists based on domestic data (anything from zero to 0.4).
Government receipts depend to some extent on the health of the economy, faltering when the economy weakens and rising when the economy strengthens. Accordingly, a tax cut that improves production incentives and lifts output will have a positive feedback on government receipts, partially paying for itself, while a tax increase that worsens incentives will have a negative economic feedback. In estimating the revenue effects of tax changes, the Taxes and Growth model takes induced economic feedbacks into account. It provides what are known as dynamic revenue estimates.
The model tracks the change in the real economy. It does not impose a financial market constraint on the growth. World financial markets provide ample sources of funding for the economic expansion in the event of a reduction of the tax burden on domestic production. The only constraints to the expansion are the capacity of the capital goods industries and the construction trades to create the added physical machines, buildings, infrastructure, mines, and wells; skill shortages requiring training or movement of population; and regulatory and planning delays.
We were able to model directly most of the major individual tax provisions, such as the new tax rates and brackets, the treatment of dividends and capital gains, the enlarged standard deduction, and the repeal of most itemized deductions and the personal exemption. Other provisions that were deemed to be unrelated to the cost of capital and labor were modeled as having no economic effect. Where the individual tax changes appeared to rise and fall in line with wages (such as pension changes) or capital gains (as with taxation of profits on sales of homes), they were modeled as increases or decreases in the effective marginal tax rate.14
The plan would repeal or trim many itemized deductions now claimed on Schedule A for medical and dental payments, other taxes paid, charitable giving, and miscellaneous deductions. We were able to model most of these proposed changes directly. A change we could not model because of lack of data is a proposal to reduce the amount of home mortgage debt on which the mortgage interest deduction can be claimed from $1 million to $500,000. This restriction would clearly be a tax increase, and it would fall on a type of capital (residential
14TheequivalenceofsomebasebroadenerstoataxrateincreaseisdiscussedbyJaneG.GravelleoftheCongressionalResearchServiceinherstudyDynamic Scoring for Tax Legislation: A Review of the Models.Onpage3,shestates,“Inataxreform,itiscrucialtorecognizethatthebehavioralresponsecannotbemeasuredsolelybystatutoryratechanges.Theeffectivemarginaltaxratedeterminesthisbehavioralresponseandchangesintheincomebasethatchangetheshareofincometaxedatthemarginalsoaffectthismarginaleffectivetaxrate.Itispossibleforbasebroadeningprovisionstoraiseeffectivemarginaltaxratesmorethanenoughtooffsettheeffectsofacutinstatutorytaxrates,leadingtoacontractionratherthananexpansioninoutput.”

27structures). If we had been able to model it, it would have had a slight negative effect on our growth estimates.
We were able to model directly the reduction in the corporate tax rate and the imposition of ADS with a partial inflation adjustment for capital cost recovery for all businesses. Other provisions affecting businesses at the margin were generally modeled as tax rate increases or decreases of equal dollar value to the JCT’s estimated revenue effect.15 Where the tax changes appeared to be dissociated from any direct effect on incremental output, they were deemed not to have any rate-like impact or any impact on GDP.
The business sections of the draft bill cover Subchapter C corporations (companies whose earnings are taxed at both the corporate level and the shareholder level) and pass-through entities (Subchapter S corporations, partnerships, proprietorships, REITs, RICs) taxed on the individual tax returns of the owners. The JCT revenue estimation table did not break out the amounts of business taxes falling on the corporate and pass-through businesses, except for one group of provisions in the bill clearly labeled as only affecting pass-throughs, and a handful of provisions, such as the tax rate changes, that apply only to one form of business or another. Where we were able to determine the split in the revenue estimates of other provisions between non-corporate businesses and corporate businesses, either from the nature of the provision or from the supporting documents16 or other sources, we allocated the revenue effects of the tax changes to individual or C corporation taxes accordingly. All other estimates were split in proportion to the net income figures for pass-throughs and C corporations in recent years, about 55 percent for pass-throughs and 45 percent for C corporations.
To approximate long-run effects (as is the nature of the model), we took JCT estimates of the provisions of the bill as of the last year shown, 2023.17 In some cases, the provisions were of a type that required them to be phased in, and the 2023 figures did not reflect full implementation. When we were able, we substituted a corresponding figure from the JCT or Treasury tax expenditure tables for the long-run effect of the policy.18 The tax expenditure tables assume the provision in question has been in place long enough for all effects to have been realized.
The JCT’s GDP and Revenue Estimates
Normally, when the JCT estimates the revenue effects of proposed tax changes, it assumes that taxes have no impact on total economic activity. In its estimates, the economic pie is held to exactly the same size regardless of whether the proposed
15 Id.16 See, e.g.,JointCommitteeonTaxation,Technical Explanation of the Tax Reform Act of 2014, A Discussion Draft
of the Chairman of the House Committee on Ways and Means to Reform the Internal Revenue Code: Title III – Business Tax Reform,JCX-22-14(Feb.26,2014).
17JointCommitteeonTaxation,Estimated Revenue Effects of the ‘Tax Reform Act of 2014’, Fiscal Years 2014-2023,JCX-20-14(Feb.26,2014)[hereinafterJCTEstimated Effects].
18 LIFOwasaspecialcase,discussedbelow.Wealsoreducedthereportedeffectofthechangeinthetaxtreatmentofadvertising,whichwouldbephasedinbetween2019and2022.Inlateryears,someofthedeferredadvertisingdeductionswouldbecomeavailabletothebusinesses,reducingthelong-runimpact.

28tax changes would be wonderful, terrible, or somewhere in between. The JCT does allow for what are sometimes called behavioral or micro-dynamic responses. These are tax-induced changes within the economy that are constrained to leave macroeconomic aggregates unchanged, such as more investment in one industry exactly offset by less investment in other industries, a shift of jobs from one part of the economy to another, or a change in tax compliance without any alteration in the real economy.
To Chairman Camp’s credit, he directed the JCT to prepare dynamic growth and revenue estimates as a supplement to the conventional estimates. In the no-growth-effects revenue score, the JCT estimated that the overall package would yield a net revenue change of $3 billion over 10 years.19 Mr. Camp had pledged that his plan would be revenue neutral according to static scoring, and that is as close to revenue neutral within the ten-year budget window as one can get. The plan’s details were designed to achieve that result.
In estimating growth effects, the JCT used two models. One is its Macroeconomic Equilibrium Growth (MEG) model. This is the same general type of model as the Tax Foundation uses, although there are many specific differences between the two. The other JCT model is what is known as an Overlapping Generations Lifecycle (OLG) model.
The models were run to estimate the economic effects of the reform plan over the ten-year budget window of 2014-2023. The average changes in GDP, capital formation, labor force participation, private sector employment, and consumption were displayed for the full ten years and for the first half and second half of the period. The second half numbers are closer to the long-run, fully phased-in results of the reform plan, and we concentrate on those.20
Table 5 summarizes the JCT’s growth estimates of the Camp plan for the five-year period of 2019-2023. The table shows the range of estimates for each JCT model. In all cases, the JCT predicts faster growth, with real GDP rising between 0.1 percent and 1.4 percent relative to current law during the last half of the budget window. The JCT estimates that the plan would have a neutral or negative effect on capital formation with the capital stock changing between 0.0 percent and -1.0 percent compared to current law in these out years. The JCT predicts the plan would have a positive effect on labor force participation and employment with private sector employment rising 0.5 percent to 1.5 percent relative to current law. The JCT also concludes that the plan would encourage consumption with consumption in all cases increasing more rapidly than real output relative to the baseline.
The JCT does not provide a revenue estimate for each scenario but instead states, “The increase in projected economic activity is projected to increase revenues
19JCTEstimated Effects, supranote17.20TheJCTnumbersarenotpresentedannually,sotheend-of-windowvaluesfor2023arenotavailable.
Nonumbersaregivenforafullyphased-inreformafteralleconomicadjustments,whichmightbeseveralyearsbeyondthebudgetwindow.TheTaxFoundationTaxesandGrowthmodelfocusesonthelong-runadjustment.Forcomparison,theclosestwecancomeistocompareourresultstotheJCTresultsfor2019-2023.

29
relative to the conventional revenue estimate by $50 to $700 billion, depending on which modeling assumptions are used, over the 10-year budget period.”21
The estimation procedures of the JCT and the Tax Foundation differ in many respects, but several of the most important differences will be mentioned here.
First, the JCT’s estimates are confined to the ten-year budget window while the Taxes and Growth model is looking at annualized long-run economic and revenue effects. The JCT’s timeframe is understandable given the committee’s assignment to estimate revenue effects within the budget window. However, it does not reveal the permanent impact of the proposal if there are further economic adjustments beyond the budget window. The Tax Foundation’s Taxes and Growth model does not provide transition estimates during the budget window but focuses instead on
21JCTEstimated Effects, supranote17,at12.
Table 5. Joint Committee on Taxation’s Estimates of the Growth Effects of Chairman Camp’s ProposalFiscal Years 2019-2023
Percent Changes Relative to Current Law
Real GDPBusiness Capital
Labor Force Participation
Pvt Sector Employment Consumption
JCT’s Macroeconomic Equilibri-um Growth (MEG) model Lowest Estimate 0.1% -1.0% 0.3% 0.5% 0.6% Highest Estimate 0.8% -0.2% 0.4% 1.2% 1.1%
JCT’s Overlapping Generations Lifecycle (OLG) model Lower Estimate 1.4% 0.0% 1.3% 1.3% 1.9% Higher Estimate 1.4% -0.3% 1.5% 1.5% 1.9%Source: Joint Committee on Taxation, Macroeconomic Analysis Of The ‘Tax Reform Act Of 2014’, JCX-22-14 (Feb. 26, 2014).
Table 6. Joint Committee on Taxation’s Estimates of the Growth Effects of Chairman Camp’s ProposalFiscal Years 2014-2023
Percent Changes Relative to Current Law
Real GDPBusiness Capital
Labor Force Participation
Pvt Sector Employment Consumption
JCT’s Macroeconomic Equilibrium Growth (MEG) model Lowest Estimate 0.1% -0.6% 0.3% 0.4% 0.4% Highest Estimate 0.6% 0.0% 0.3% 0.8% 0.7%
JCT’s Overlapping Generations Lifecycle (OLG) model Lower Estimate 1.5% 0.1% 1.3% 1.3% 2.1% Higher Estimate 1.6% -0.2% 1.5% 1.5% 2.0%Source: Joint Committee on Taxation, Macroeconomic Analysis Of The ‘Tax Reform Act Of 2014’, JCX-22-14 (Feb. 26, 2014).

30the full impact after all economic adjustments if the Camp proposal were to be enacted.
Additional differences concern how the JCT is able to predict positive economic growth from a proposal that, according to its calculations (and ours), would shift taxes from labor to capital so as to increase the after-tax return to labor but reduce the after-tax return to capital.22 Because capital is more responsive to after-tax returns than labor, that combination might be expected to cause capital to fall by significantly more, in percentage terms, than labor would rise, and lead to less output.
In the OLG model, which shows the highest growth of GDP and employment, the JCT appears to assume a higher price elasticity of labor supply than most empirical studies have found, and much higher than it uses in its MEG model. The JCT does not reveal the elasticity of labor supply in its OLG model, but it notes that “labor is [assumed to be] more responsive in the OLG model than in the MEG model.”23 In the MEG model, the JCT applies labor elasticities of 0.1 and 0.2 as low and high possibilities. We use a labor elasticity of 0.3 in the Tax Foundation’s Taxes and Growth model and report employment results more in line with the JCT MEG forecast. The JCT also finds less reduction in the capital stock in the OLG model than in its MEG model. The only case in which the JCT does not show a decline in the capital stock is one in which they assume additional domestic investment as a result of a large shift in intellectual property to the United States.
In the MEG model, the JCT appears to be relying in part on a Keynesian demand stimulus effect to overcome the tax-driven reductions in business capital.24 The Keynesian model is explicitly short run. There is much controversy about whether Keynesian demand stimulus is effective even then. This is especially true if the tax change is assumed to be revenue neutral.25 In estimating the long-term growth effects of tax changes, however, it is clearly inappropriate. The Tax Foundation’s Taxes and Growth model is long term and incentive driven; it contains no Keynesian elements.
Another major difference is that the Taxes and Growth model currently does not take account of behavioral changes that are unrelated to the cost of capital and the after-tax wage, even if they change tax revenues. For example, if a tax reduction persuades multinational businesses to shift income from other countries to the
22TheJCTcalculatesthattheCampplanincreasestheafter-taxreturntolaborbut“reducestheafter-taxreturntocapital.”Id.
23JCTEstimated Effects, supranote17,at17.24TheJCTisthoroughlyKeynesianwhenitwrites,“Relativetopresentlaw,thepolicy[directionoftheCamp
plan]providesanincentiveforincreasedconsumerpurchasesofgoodsandservicesbyincreasingafter-taxincomeofhouseholds.Thiseffectcanbeimportantwhentheeconomyisoperatingbelowfullcapacity.”See JCTEstimated Effects, supranote17,at1.
25 Spendingstimulusisgenerallyassumedtocomefromanincreaseinthedeficit,whichoughtnottooccurinasupposedlyrevenueneutraltaxchange.Infact,thereislittleevidencethataboosttospendingcanoccurevenwithadeficit,asthegovernmentmustborrowfromPetertopayPaul,whichreducesPeter’sabilitytospendthesamemoneyorlendittosomeoneelsetospend.Recorddosesoffiscalandmonetarystimulussince2008shouldhavegeneratedavigorouseconomicexpansionaccordingtoKeynesianreasoning;infact,therecoveryhasbeenoneoftheslowestandweakestinU.S.history.

31
The Tax Foundation is a 501(c)(3) non-partisan, non-profit research institution founded in 1937 to educate the public on tax policy. Based in Washington, D.C., our economic and policy analysis is guided by the principles of sound tax policy: simplicity, neutrality, transparency, and stability.
©2014 Tax Foundation
Editor, Donnie JohnsonDesigner, Dan Carvajal
Tax FoundationNational Press Building529 14th Street, NW, Suite 420Washington, DC 20045-1000
202.464.6200
taxfoundation.org
United States without moving production, the Taxes and Growth model will not pick up the revenue gain. This limitation has no effect on the model’s estimates for labor, capital, output, and other real variables. However, it may cause the model to overstate the revenue cost of tax reductions (by omitting inward income shifting and other changes increasing reported income) and exaggerate the revenue pickup from tax increases.
Another behavior change involves the unlocking effect of a reduction in the tax rate on capital gains and dividends, or the corresponding locking-up effect of a rate increase, for individuals and corporations. These affect the speed with which capital gains are realized and the amount of dividends paid or repatriated, which create revenue effects in addition to those that result from the growth effects of these taxes. We do not yet incorporate these realization effects.
The JCT, in contrast, adjusts its estimates as best it can for various microeconomic behavior shifts within the economy, although it does not reveal which behavioral shifts it models or how large they are. It appears to have adjusted some of its model runs based on assumptions about income shifting. Looking at revenue estimates the JCT prepared in 2013 for a cut in the corporate income tax rate, former Treasury economist Thomas Neubig reasons that the JCT is probably making substantial adjustments to its revenue forecast for higher corporate capital gains realizations, a lower debt-to-equity ratio, less income shifting, and reduced organization of businesses as pass-through entities.26 The JCT explicitly refers to income shifting as a source of higher revenues.27
This additional revenue, coming chiefly from income shifting induced by the reduction in the U.S. corporate tax rate, is probably the main reason the JCT static score is revenue-neutral while ours shows a modest static tax cut of about $36 billion. It is fortunate that they were able to make that determination. It allowed the proposal to meet its revenue target while achieving a 25 percent corporate tax rate. We did not impose that static revenue neutrality constraint in our simulation of the 25 percent rate. Had we done so, our corporate tax rate would have had to be about 4.1 percentage points higher to be static revenue neutral. That change, in our model, would suggest that GDP would be about 0.75 percent lower under the discussion plan, instead of 0.22 higher, a difference of 0.97 percent. The lower growth would have taken back the added revenue on a dynamic basis, leaving us with much the same revenue loss as we started with.
Whichever approach is correct, it suggests that added growth from a lower corporate tax rate will largely cover its own apparent revenue loss. This further suggests that additional revenue offsets are not strictly needed, and that they can be judged chiefly on their own merits as aiding or slowing growth and economic efficiency.
26ThomasNeubig,Dynamic Microbehavioral Effects Are Scored, Tax noTes 980-987 (Mar. 3, 2014). 27JCTEstimated Effects, supranote17,at13-14(statingthat“[t]heMEGmodelisnotdesignedtomodelspecificallythe
differencebetweenIPandcapitalortheeffectsofshiftingofreportedprofitsbetweencountriestotakeadvantageofdifferencesinrelativetaxrates.Theconventionalrevenueestimateaccountsfortheeffectsofthelatterbehavioronrevenues,butnotoneconomicactivity.IntheOLGmodel,theabilitytoshiftprofitstominimizetaxliabilitywithoutshiftingeconomicactivityresultsinincreasedeconomicactivitywithintheUnitedStates.”).