Embed Size (px)
Citation preview

Welcome
1NYSE: G

Program Schedule
Genpact Investor DayMarch 17, 2009
Time Session Speaker / Lead
08:30 - 09:30 am Breakfast & Registration All Attendees
09:30 - 09:40 am Welcome & Introductions Anil Nayar
09:40 - 10:40 am 2008 Update, Strategy & Way Forward Pramod Bhasin
10:40 - 11:15 am Business Pipeline & Customer Growth NV 'Tiger' Tyagarajan
11:15 - 11:25 am Break All Attendees
11:25 - 11:55 pm Financial Overview Vivek Gour
11:55 - 12:00 pm Closing Remarks Pramod Bhasin
2
12:00 - 01:00 pm Question & Answers All Attendees

Disclaimer
These materials contain certain statements concerning our future growth prospects and forward-looking statements, as defined in the safe harbor provisions of the U.S. Private Securities Litigation Reform Act of 1995. These statements involve a number of risks, uncertainties and other factors that could cause actual results to differ materially from those in such forward-looking statements. These risks and uncertainties include but are not limited to a slowdown in the economies and sectors in which our clients operate, a slowdown in the BPO and IT Services sectors, the risks and uncertainties arising from our past and future acquisitions, our ability to manage growth, factors which may impact our cost advantage, wage increases, our ability to attract and retain skilled professionals, risks and uncertainties regarding fluctuations in our earnings, general economic conditions affecting our industry as well as other risks detailed in our reports filed with the U.S. Securities and Exchange Commission, including the Company's Annual Report on Form 10-K. These filings are available at www.sec.gov. Genpact may from time to time make additional g g p ywritten and oral forward-looking statements, including statements contained in our filings with the Securities and Exchange Commission and our reports to shareholders. Although the Company believes that these forward-looking statements are based on reasonable assumptions, you are cautioned not to pay undue reliance on these forward-looking statements which reflect management's current analysis ofpay undue reliance on these forward looking statements, which reflect management s current analysis of future events. The Company does not undertake to update any forward-looking statements that may be made from time to time by or on behalf of the Company. In addition, you should be advised that our past performance is not necessarily indicative of future performance, particularly given the current global economic environment
3
economic environment.

2008 Business Update,Strategy & Way ForwardStrategy & Way Forward
Pramod BhasinPresident & CEOPresident & CEO
March 17 2009
4NYSE: G
March 17, 2009

Agenda
Genpact Overview
The Current Environment & Strategies for GrowthThe Current Environment & Strategies for Growth
The Year Ahead
5

Overview
6

Who Are We?
Leaders in Business Process Management solutions and the globalization of these services
Unique End-to-End (E2E) approach: measuring performance metrics (process efficiency) and business outcome (process effectiveness) differentiates us in the market, which typically measures only efficiency
Our deep process excellence, analytical capabilities, technology competence and breadth and depth of services combined with operational and business insights, results in business and strategic value to our clients
7Operational Innovation with Business Process Management

Why Genpact Even in This Environment?Market opport nit remains h ge despite en ironmentMarket opportunity remains huge despite environment
Global business process market, significantly under-penetrated, Est. 6-8% growth vs. flat ITOProven business model – start small and expand with clients
Expanding diversified blue-chip client relationships, and enhancing products and services, support p g p p , g p , ppcontinued growth (85% from existing clients); growth in GE revenues even after 10 years
Breadth and depth of services across verticals and marketsIndustry led solutions around BFSI and manufacturing coupled with domain expertise in F&A, Procurement Analytics and Technology Enablers supports client value creationProcurement, Analytics and Technology Enablers supports client value creationSwiftly allocating resources to new growth areas and to domestic markets of India & China
Proven track record of performance and growth: 30% revenue CAGR over 3 years Driven by Global Client (GC) growth: $551MM in ‘08 GC revenues, more than 13X $42MM in ’05Long-term margin improvement
Strong balance sheet and cash flows, including approximately $385MM of liquidityCash from operations – improved to 20% of revenue compared to 18% in ‘07
Strong pipeline – new prospects driven by new economic realitiesStrong pipeline – new prospects driven by new economic realitiesE2E: a differentiated way to deliver business outcomes for clients
Previous investments in Re-Engineering, Six Sigma, Lean, Process Management & IT drive non-capital intensive operating innovation
8
E2E capabilities, along with IT, process & analytics, and focus on effectiveness not just efficiency
Perfectly Positioned for this Environment

Top-Tier Financial Performance in 200880% f di ti / iRevenue Mix 80% of revenue non-discretionary / recurring; critical for sustainability of client’s operations
Long-term client contracts551
GEGCa
Revenue Mix
CAGR30%1041
823613
‘06-’08
Top 15 GC average remaining term 3-5 years
Strong organic growth of 26% in ’08 despite economic headwinds
481
342
490
551613 86%
4%
203
453
160
61%
2%
114%
6% economic headwinds
Diversified Client Growth
29 clients over $5MM vs. 18 prior year
07 0806
Adjusted Operating Incomeb
($MM) CAGR20 clients grew relationship by over 70%
Organic Growth
Global Client growth 62% over 2007134
178
( ) CAGR36%
134 80bp
97g
GE growth of 7% (adj. for dispositions of GE businesses we continue to serve) demonstrates ability to penetrate business over the long-term
07 0806
17.1%16.3%
97
15.8%
50bp
9Consistent Tier I Performance
a) Global client revenue including GE divested businesses and acquisitions (GAAP)
b) Adjusted Operating Income = Income from Operations + Formation Accounting Amortization + Stock Options Charge + Indian Fringe benefit tax on Stock Option

Governance is a Way of Life
Controllership
Strong GE heritage
Monthly operating reviews with
Independent Audit CommitteeExternal Audits: SAS 70 technology environment audits... SOX certification
Compliance
Business level risk assessment
Framework to comply with cross
CEO / CFO / Business leaders
Quarterly representation letters
from all business units
Stringent financial close
Internal Audits: leveraged GE CAS framework... 20 member strong team with real operating experience...
Client Audits: 100’s of client
border requirements
Strong ombudsperson process
Strong 11 Member Independent Board – Global Experience
Stringent financial close
process... segregation of duties,
checks and balances
operational audits
Strong 11 Member Independent Board Global Experience
Rajat Gupta Chairman of Board, Genpact;Former Managing Partner, McKinsey
J Taylor Crandall
Jagdish KhattarFormer CEO, Maruti Udyog, India
Denis J NaydenManaging Partner Oak Hill Capital
John Barter Chairman of Audit Committee; Former President & CFO, Allied Signal
Michael SpenceJ Taylor CrandallManaging Partner, Oak Hill Capital
Steven Denning,Chairman, General Atlantic
Robert Scott
Managing Partner, Oak Hill Capital
Mark DzialgaManaging Partner, General Atlantic
Jim MaddenFormer CEO Exult
Michael SpenceNobel Laureate, Stanford University
Pramod BhasinPresident & CEO, Genpact
10Compliance and Integrity – Non-negotiable
Former COO, Morgan StanleyFormer CEO, Exult

The Current Environment
11

The World has Changed
Li idit i i M k t ll I t fid h tt d B k tLiquidity crisis… Market collapse… Investor confidence shattered… Bankruptcy
Impact on our clients:
Nissan: Auto sales plunge 41% in Feb 2009 20 000 job cuts; first annual loss in nine yearsNissan: Auto sales plunge 41% in Feb 2009, 20,000 job cuts; first annual loss in nine years
Wachovia: Announced $33B loss, plans 12,000 job cuts; S&P downgrades its debentures
GE: Lost $254B in market capitalization; cut dividend in the 4Q’08
Changing Client Needs Impact on Genpact
Focus from growth & expansion to reduction in cost
Preserve cash & improve working capital mgt.
Improve productivity
Slowness of decision-making
Budget cut-backs in IT spend
Shorter pay-back period – razor-sharp solutions
M ti CAPEX & b tt ROIDeflation focused sourcing & spend requirement
Minimize capital investment
More scrutiny on CAPEX & better ROI
Client business volumes down
Demand for operational innovation
P i i
12
Pricing pressures
Factored These Risks in our Growth Plans

With Change Comes Opportunities
Environment Creates Opportunity for Growth
Focus on cash preservation & cost reduction
How We Are Reacting
Our E2E solutions are non-capital intensiveleading clients to look aggressively at new ideas
New Growth Markets:
China… India
Our E2E solutions are non capital intensive
Scale existing cash / cost solutions
Re-allocate dedicated leadership resources Middle East ... Japan
Growth Opportunities:
Healthcare … Pharma
and swat teams to growth areas
Speed of deployment for 90 day pay-back
Id l ti t i l b l t l tCollections… “Cash Is King”
“Cost out”
Risk Management
P / S l Ch i
Ideal time to acquire global talent
Outcome-based / gain share pay-back model
Operating InnovationProcurement / Supply Chain
Strong Pipeline:
New categories of prospect, driven by economic realities
p g
13
driven by economic realities
Driving Sustainable and Superior Organic Growth

Recession Creates Opportunity to Scale Existing Solutions
Reduce Warranty Costs(COST)
$23MM Excess warranty payouts.. High servicing cost
Multiple legacy systemsManual Intervention
Developed integrated web enabled claims processing tools
30% processing timeWorking Capital
Applicable to all manufacturing companies
Incomplete reporting 35% in disallowed claimsCapital
Improve fraud
24%Detection of fraudulent non-compliant claims taking too long & getting paid out early
Complete process re-designReporting dashboardP i t 25%
Applicable to all insurance companiesdetection
(RISK)
long & getting paid out earlyMultiple hand-offsAbsence of report generation process
Processing steps 25%Processing time 50%Fraudulent
Claims
companies
14E2E Solutions Address Client Needs… Scalable for Growth

I2I and C2C Markets Continue to GrowChiI di ChinaIndia
EnvironmentDomestic BPO Market: $1.3B
Expected BPO growth @ 40% in 2009
Domestic BPO Market: $1.4B
Expected BPO growth @ 26% in 2009
Cost arbitrage not a prime driver
Achieve global standards to compete globally
Expected BPO growth @ 40% in 2009 Expected BPO growth @ 26% in 2009
Lack of process expertise in operations
Build domestic capability; offer E2E solutions
Lack of six sigma, lean and re-engineering skills
Insights
Products: Collection, Customer Service, Procurement, Analytics
Industries: Insurance, Manufacturing, Healthcare Banking Airlines
Products: F&A, Analytics, Re-Engineering, Customer Service
Industries: Banking, Telecom
ActionsHealthcare, Banking, Airlines
Govt. organizations looking for process optimization… efficiency enhancement
Hosted platform / asset takeover
Banking operation to mid-small banks
Potential JVs with local partners
15Domestic Markets – Huge Growth Opportunities – Strong Pipeline

End-to-End: Game Changing Differentiator
What is it?Looking at the complete operational process from start to finish; driving business outcome through overall process effectiveness, rather than discrete transactional efficiency
Most companies do not ha e meas rement metrics for E2EMost companies do not have measurement metrics for E2E
Most service providers only measure process efficiency, providing marginal benefit
Why is it important to clients today?Supports companies drive for step improvement in overall process performance“Capital-light” solution designProvides many times the benefit efficiency metrics can deliver
Why are we best positioned?Leaders in operational innovation… in our DNA due to our process view
Encompasses all attributes of E2E
Worked on over 2000 different kinds of processes – all with data, learnings... Our IP
Benchmark key process metrics
Detailed roadmap for clients to realize value
16Hard to Replicate & Even Harder to Compete Against
Operational rigor to ensure performance… it is not a project

Key Business Outcome Improvement Drivers
End-to-End Process Efficiency Effectiveness
O i i ti↓ Time to key in an invoice Conversion rates on applications… Volumes
Originations ↓ Cost per loan application ↓ Cycle time to open a new customer account
Bill to Cash Collection efficiency % (Cashcollected / Total AR)P t d %
Eliminate billing leakage
↓ Days Sales Outstanding ↓ Past due %
Account Payable
Invoices actioned on time
↓Total AP cycle time
Paid on Time %
↓ Vendor queries
Vendor discountsVendor discounts
Insights – Technology only solves part of the problem:E.g., only 40% of transactions in the Accounts Payable process are “first pass, straight through”E.g., only 40% of transactions in the Accounts Payable process are first pass, straight through
Typically only 5-10% of the end-to-end cycle time of a process is “value-added time”
The E2E approach also leads to higher employee engagement
Will facilitate the move from FTE-based pricing to outcome-based pricing models
17
p g p g

E2E View Enables Critical Business OutcomesAccounts Payable – End-to-End View – Comparison of traditional vs business impact approach
Sourcing Procurement Payment
Accounts Payable End-to-End View Comparison of traditional vs. business impact approach
Spend Analysis
Category Strategy
Planning & PO Issue
Material Receipt
Accounts Payable
Negotiation & Contract
Effectiveness - Key Performance Measures
End-to-End Cycle Time
Invoices/Person/Year
3919
4500011000
5400
25
Efficiency - Key Business Outcomes
Cash Flow Optimization
C t T ti$3
$9Invoices/Person/Year
Vendor Terms
450005400
75030
Cost per Transaction $9$1.3
80%10%Early PaymentDiscount Capture
Highlights
Difference between best and worst is not incremental, but multiple times
Measuring just efficiency misses the opportunity
Focusing on key objectives of a process (as opposed to transactional metrics) will deliver business outcomes
T h l i t th l ti t l i ti
g g
Outcome
Technology is not the solution to solve process variation
For a typical US $5B revenue company – reduce annual purchase spend by $50 – 150MM, increase margins by 100
Focusing on AP will give you 10-15% productivity on FTE offshored... minimal impact
18
p p y $ , g y– 300 bps.
p
Minimum
Genpact Best-in-ClassMedian
Links business outcomes, key performance measures and performance drivers
Key performance drivers
% spend93
Key performance measuresSub-processes Activities
% spend 75
Practices
Middleware that can interact with multiple% spend
visible accurately
45 100
% of spend controlled by purchasing
30 7050
Spend analysis
% spend extracted accurately
10040
Extract, cleanse and categorize data 89% spend
interact with multiple ERPs to develop consolidated spend database
Automated categorization based on
Key business outcomes
Reduc-tion in TCO* 1 15
9
purchasing
% of supplier for 80% of spend
21
47 2.77
Category strategy
10045p
categorized accurately
grules developed by category expertsSystem driven master clean up every quarter
Category expertise driven spendTCO*
(% of spend)
15
% preferred 67
% spend through catalogues
9%521
Planning
Divide order among
% price reduction contracted
1 53Negotia-
tion and contracting
driven spend cataloguing and automated refreshStandardized features e.g., speed, capacityInclusion of services along with materials% preferred
vendor spend 0 100
discount availed/
% invoices without PO 20 98
78
801050
and PO issue
Accounts
among suppliers and release PO
along with materials e.g., AMC with printers
Automated requisition creation and approval process to reduce TAT and thus limit maverick
Minimum
Median
19
discount available
8010payable spendImplement No-PO, No-Pay policy
Max
Median
*TCO: Total cost of ownership

Proven Experience of Effectively Managing Cost Base
Various levers to drive productivity year over year
SalaryAnnual increases held to 7-8% vs. 10-12% for industryEntry-level wages held flat for 4 years
InfrastructureSEZs locked in rental rates below market by ~50%Tier 2 city costs 25% lower… Tier 3 cities further savingsRenegotiating 15-20% supplier rates to hold price escalation
Telecom Improved utilization by 5-7% from scale and sourcing rate re-negotiation…. Lowest in industry
Improve supervisory spans as client scaleScalability
Return
Improve supervisory spans as client scaleClient profitability increases as accounts mature
Wage inflation and FX sharing built into contractsGain-sharing Paid for impact deliveredGain-sharing – Paid for impact delivered
New InitiativesWork From Home – Targeted 3000 people, reduces cost per person by ~7-8%NIIT JV to improve training effectiveness and reduce costs by ~30%
20Relentless Focus to Drive Internal Efficiencies

Experienced, Global Leadership Executive Yrs of Exp Title
Management TeamManagement TeamExperienced operating leadership… average 20 years of experience
L i i ki h
Pramod Bhasin 27 President & CEO
V.N. (Tiger) Tyagarajan 23 COO
Vivek Gour 23 CFOLongevity in working together ~ average 10 years of experience
Local leader in global locations
Adding key talent where
Robert Pryor 25 EVP, Head of Sales
Mitsuru Maekawa 34 CEO Asia
Patrick Cogny 18 CEO Europe g yrequired
Sales Leader – Robert Pryor
Marketing Leader – Lynda Smith
Patrick Cogny 18 CEO Europe
Walter Yosafat 28 CIO & CEO Americas
Mohit Bhatia 21 Business Leader F&A
World-class HR practices to acquire, develop and retain talent
Mohit Thukral 20 Business Leader BFSI, Wachovia
Rakesh Chopra 31 Business Leader
Anju Talwar 25 Business Leader
Tajinder Vohra 20 Business Leader
Victor Guaglianone 25 General Counsel
21
Longevity of Leadership Team Allows to Build Relationship and Drive Operating Excellence
Piyush Mehta 19 Human Resources

The Year Ahead
22

Key Challenges and How We Will Address Themf %
ClientGrowth
Bulk of our services are non-discretionary and 80-85% recurring
New growth markets and new service areas… I2I / Risk Management / Healthcare
IT more discretionary – will face similar challenges as peer group
C ti t d it i t
Margin
Continues to grow despite environment
Geographic and segment diversification; over 2,700 statements-of-work reduces risk
Multiple levers: manage wage inflation, discretionary spend; utilization of infrastructure P t k d i i fit bl ith i ti li t
GE
Margin Compression
Client
Proven track record in growing profitably with existing clientsContinue relentless focus on cost discipline and improved productivity
Quality of clients establishes roadmap for growth; 29 clients over $5MM… 20 clients Client
Concentrationgrew over 70% in 2008
Low levels of penetration achieved to date
New category of prospects entering pipeline, driven by new economic realitiesPipeline Slower conversion… pricing pressures
Many more entry points
Non-Capital Intensive
E2E led solutions focused on cost/cash improvement
Depth and breadth of industry solutions and process expertise
23Strong Financial Discipline and Hands-on Management
Intensive Solutions
Depth and breadth of industry solutions and process expertise
Quick pay-back

The Year Ahead
Responding to the dramatic change around us from a position of strength.
We can be part of the solution: validation from a strong pipeline with new prospects…demand for our services has never been higher.p p g
Our business model of expanding diversified blue-chip client relationships, and enhancing our products and services, supports continued growth.continued growth.
Investments in Re-Engineering, Six Sigma, Lean, Process Management & IT well-timed to drive non-capital intensive operating innovation in this environmentenvironment.
Allocating resources: investing in talent, domain expertise, new growth areas and markets.
Our unique capabilities (E2E, process management, depth of experience, combined with IT, process & analytics, and focus on effectiveness not just efficiency), represent a huge competitive differentiator, especially today.
24
Acquisitions at the right price, but in no hurry.
Companies that Invest During Recession Emerge as Market Leaders

Thank You
25
www.genpact.com

Business Pipeline& Customer Growth& Customer Growth
‘Tiger’ TyagarajanChief Operating OfficerChief Operating Officer
March 17 2009
26NYSE: G
March 17, 2009

Insights Into Pipeline in These Volatile Times
More activity… many more proof points of success
Activity increases: Regional Banks, Healthcare Providers, Pharma, Retailers
The case against setting up new captives strengthens
Many more entry points into clients
Fast start with Re-Engineering, quick fixes to generate cost savings & cash
Procurement and Finance & Accounting (F&A) often bundled now
New models of adding value and quicker pay-back gain traction
Outcome-based Pricing, Re-Engineering
27
Many More Entry Points… “doors that were always shut are now beginning to open”
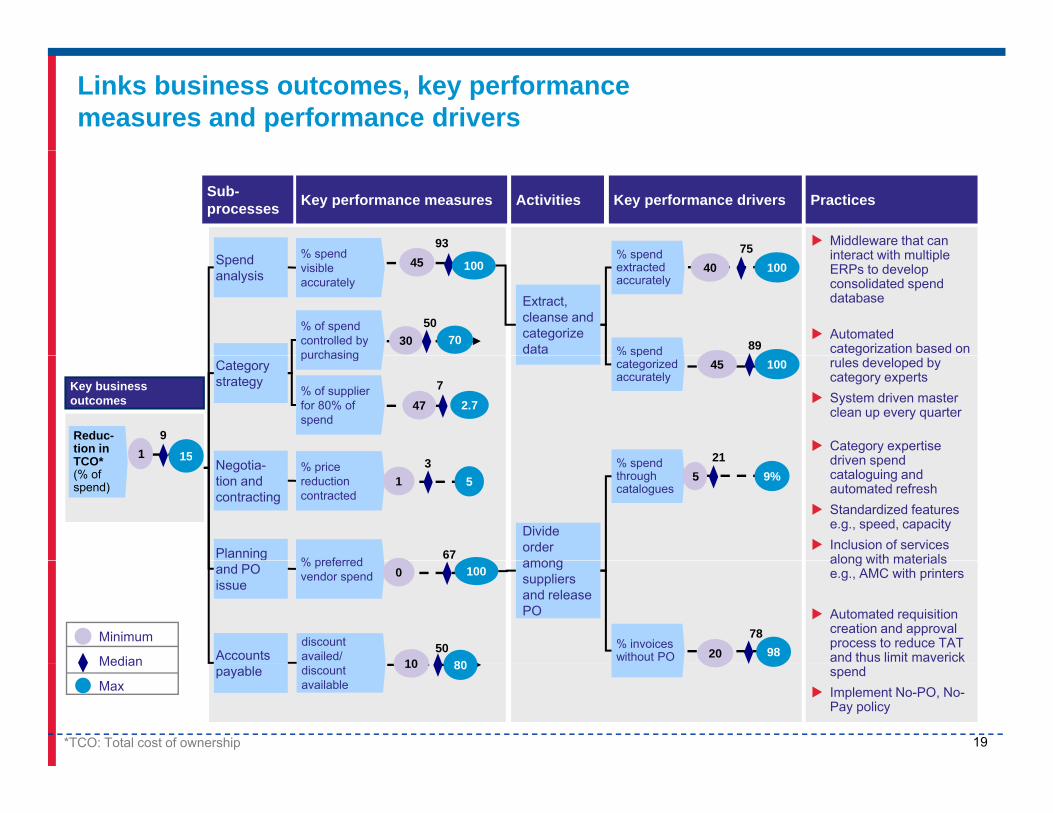
Insights Into Pipeline in These Volatile Times
More corporations with $1-5B revenue enter pipelineEurope and Asia Pacific growing well
India to India (I2I) gaining traction with nearly 10 deals in pipeline spread across Telecom, Financial Services, Manufacturing, Insurance
BUT
Discretionary budgets cut – IT programs being postponed and de-scoped
BUT
Pricing pressure exists – demanding price drops/ higher productivity
Slower conversions: cycle times from 6-9 months, to 9-12 months Boards and CXOs delay pulling the trigger New Leadership ChangeBoards and CXOs delay pulling the trigger… New Leadership… Change Management
Faster transitions and reduced transition costs critical to initiate new program
28Cycle Times Continue to be Long

Environment Driving Different Client Profile
15%Never considered outsourcing beforeFocus on risk mitigation
Depth of talent pool 12 t i l b ll
Client Profile Plays to Our Strength
15% Focus on risk mitigationRequire lower transition time & costWant established geographic presence and depth of capability
12 countries globallyComplex transition abilityExperience & speed of deployment
New clients who know their specific pain-points Want a sharply defined solution
35%Acutely focused Re-Eng. solutionsInvest in industry & domain expertise Cash & cost reduction solutions with
Existing clients
Want a sharply defined solution Cash & cost reduction solutions with faster pay-back
Expand into multiple productsExisting clientsTrusted relationships who want to accelerate to new areas
50% Deploy outcome-based approach, where applicableIncrease investment in Account Management
29
g
New Prospects in Pipeline Driven by New Economic Realities

Pipeline Growth Across Industries and Services R i Mi (D li )Industry Mix
Manufacturing and Services drive pipeline growth, while BFSI holds its ownBFSI
ServicesManufacturing
Region Mix (Delivery)Industry Mix
Industry-specific solutions, Procurement Services, Analytics, Re-Engineering driving growth,
hil F&A h ld itwhile F&A holds it own
60% of our revenue needs global delivery and we are well positioned to deliver
Q2'07 Q4'07 Q2'08 Q4'08
Services Mixto deliver
F&A
ITOIndustry-SpecificSolutions
Customer ServicesProcurement Svcs.Others
30Environment Creating Growth in Pipeline
Q2'07 Q4'07 Q2'08 Q4'08

Why Do Clients Choose to Partner with Us?
Clients gravitating from efficiency to
Why Win?
effectiveness
Seeing business impact E2E can create
Proven track record in operational excellenceexcellence
Global Delivery footprint
Ability to build partnerships quickly
Price higher than competition
Niche capabilities in certain industries
We lose to incumbents in the ITO space
Why Lose?
31
y ose
Increased Client Confidence Through Delivering Business Impact

A Journey to Win a Relationship
Global ERP D i S l t d
Competitive Selection Process RFP to 7providers
Shortlist to 2
H2’08 H2’08
Detailed Due Diligence
H2’08
Design-Invited as functional Experts
H1’09
Selected Preferred Partner
H1’09
Stayed Engaged
Decision made to outsource
H2’08 H2’08 H2’08
Continued Dialogue
H1’09 H1’09
H1’08 H1’08Drive EffectivenessReplicate O2C & P2P - multiple divisionsDrive Working Capital ReductionE2E Process Knowledge ERP template
1st Engagement: Point Solution
H1’07 H2’07
Procurement, HRO, F&A &
IT
Re-Eng: O2C & P2P
Discussion on Captive vs. Outsource
H2’07
E2E Process Knowledge - ERP templateCan all this be done at an effective price?
32Outstanding Execution and Partnership Approach

Growth With Our Clients Reaffirms Our Strategy
$ < 2 MM 17% Existing clients drove ~85% of our
CAGR
es
MM
$5 – 25
$2 – 5 MM
125%
76%
Existing clients drove 85% of our growth in 2008
Increasing client diversification
> $25 MM
Rev
enue MM
12%
125%~20 clients doubled their relationship in 2008 vs. 2007
Several clients won in 2005 & 2006MM 12%
each contributed over $10MM in 2008
Client Base
2006 2007 2008
33Our Growth is Driven by the Strength and Quality of Our Clients

Breadth & Depth of Services Leads to Growth
Several ways to expand a relationship:Analytics
OthersIndustry-Specific Solutions >100%
CAGR
Several ways to expand a relationship:
Expand to different divisionsProgress across functionsReplicate geographically
F&ACustomer Services / CollectionsITO
>100%
Replicate geographicallyRe-Engineering & Analytics to drive outcome
>100%
87%
Foundation remains consistent: Robust day-to-day operational excellence
>100%
Lean & Six Sigma based improvements
2005 2006 2007 2008
52%
34
2005 2006 2007 2008
Each Client has to be “Referenceable” – Only Way to Grow

As We Grow, We Expand Our Footprint Globally
How did we do this?$9MM – $18MMOver $18MM
Latin America - 3 countries
$ $CXO level partnership & dialogue
Jointly own and drive outcomes (Order to Cash Procure to Pay)Addition of IT
• Procurement & Customer Svs.
Transition to Transitions for 5
F&A expansion with 3 countries
(Order-to-Cash, Procure-to-Pay)
Reinforce strategic account ownership - Global Operating Leader & dedicated Relationship
Addition of IT Services
$3MM – $6MM
venu
e ($
)
Transition to Top 5 Countries
10+ countries -
Procurement Svs. 8 - 34 countries
EU countries Manager
Continuous improvement in Net Promoter Score (NPS)
Rev
2007 2008 2009
F&A and Procurement
2 more countriesStarted Re-Eng
10+ countries -Africa & AsiaOutcome Based
India
Europe
China
Americas
35
2007 2008 2009
Start Small and Expand with Clients

Driving Business Outcome: ~$100MM Reduction in Raw Material Inventory
Business Challenge
A client with 30+ product lines each with 20K+ parts across 6 assembly organizations was struggling ith l t i l i t twith low raw material inventory turns
Root Cause
Unavailable complete view of parts level inventory; policy levels determined through manual judgment
Genpact SolutionGenpact Solution
Inventory segmentation into “prior, current, ahead, surplus” with clear definitions
Developed a web-based inventory analysis tool; analyzed order policies and transit timesp y y ; y p
Raw material inventory turns: Improved from 12 to 17
36
Inventory Reduction Support Extended to Other Business Units Reducing Raw Material Inventory - From $220MM to $120MM

Collaborative Approach Strengthens Relationships
Several business impact projects completed … each a $10-25MM idea … replicable across clients and industries
Base Cost Reduction – T&L, Telecom, Fleet, purchased services and program costs
Our DNA500+ Trained BBs / MBBs
Income Leakage – Identify Supplemental Billing Opportunities for Contracts
Inventory Reduction – Reduce Excess and 500+ Trained BBs / MBBs / QLs (175 Certified)9000+ Trained Green Belts (1700+ Certified)650+ Lean Six Sigma
Inventory Reduction Reduce Excess and Obsolete Inventory
Warranty Cost Reduction – Improve Warranty Cost as % of Sales 650+ Lean, Six Sigma
projects certified in 2008
Warranty Cost as % of Sales
37Our Foundation: Best-In-Class and Industrial Strength DNA

Our Relationship with GE
Broad and deep – 30+ sub-businesses across globe, plus multiple products
Strong performance over 10 years: Net Promoter Score at highest ever, 59%
High-level connections – about 200+ different CXO-level relationships across GE business units
Business risks and opportunitiesGE Capital origination volume decline offset by increased collections
Growth in Infrastructure businesses
GE 300,000 employees...Genpact only 14,000
New products under discussion
Europe - an opportunity
Increased quality and quantity of interaction at all levels to leverage theIncreased quality and quantity of interaction at all levels to leverage the opportunities and manage the risk
30+ front-end executives getting business
Dedicated account managers
38Well-Established, Deep Connections – Critical In These Times
Dedicated account managers

Our Client-Centric DNA Yields Top NPS Results
Genpact Achieved a Net Promoter Score (NPS) of 47% in 2008
Genpact compares with the best Services Companies in the U S * 47%Genpact compares with the best Services Companies in the U.S.
More Than 1 in 2 Respondents Are Promoters or “Delighted Customers”
39%
47%
NPS
8pts
gPromoters - customers that indicate they are highly likely (9 or 10 on a 10 point scale) to recommend a company to friends
The Customer Voice Excerpts from our Last Survey
H1 ‘07 H1 ‘08Time
The Customer Voice – Excerpts from our Last Survey
“Relationship to date has been very constructive. Feels like a partnership. Very strong capabilities…”
*Source: “2008 Satmetrix Net Promoter Industry Reports”, As reported on Business Wire, April 10, 2008Net Promoter® is a registered trademark of Bain & Company, Inc., Fred Reichheld and Satmetrix Systems, Inc.”
“Genpact is a true business partner, that brings a wide breadth of talent to help solve and support business processes of the clients.”
39*
Reflects our Continuous Focus and Rigor on Client Satisfaction & Outcomes

2009…Ideal Time to Acquire Talent
“A downturn can give smart companies a chance to upgrade their talent.” (Upgrading Talent, McKinsey Quarterly Dec 2008)
Talent imperatives:
Build talent pipeline for Revenue GrowthStrategic Initiatives industry domain experts banking insurance healthcareStrategic Initiatives...industry domain experts - banking, insurance, healthcare, retail, etc. New Geographies…India to India, China to China
Enhance competitive position on talentEnhance competitive position on talentContinue focus on retention… drive engagement initiativesSeize the opportunity to close critical skill gaps…hire “not-in-play” talent
Benchmark Cost Competitiveness: Cut Fat FastBenchmark Cost-Competitiveness: Cut Fat FastIncrease spans, support, supervision and drive Shared Services
Attrition DownBeneficial to our clients and in line with our focus on Account Management
40
Beneficial to our clients and in-line with our focus on Account Management
Highly Engaged Talent Pool - Meet Changing Client Needs

Takeaways
Despite uncertain economic environment and pricing pressure, long-term market opportunity remains huge
New prospects entering pipeline…driven by new economic realities
Our Industrial Strength Six Sigma, Process Excellence, unique E2E approach and Re Engineering services position us strongly to meet theapproach and Re-Engineering services position us strongly to meet the critical changing needs of our clients today
Our Operational Focus and Operating Rigor help drive End-To-End I t li t ’ t t i i tiImpact on our clients’ strategic imperatives
Momentum with existing clients – further builds on well-established, strong relationships
Focus on the growth areas…invest further in the breadth and depth of our services across verticals and new geographies
Continue to drive productivity and efficiency
41
Continue to drive productivity and efficiency
Thank You
42
www.genpact.com

Break
43NYSE: G

Financial OverviewFinancial Overview
Vivek N GourChief Financial OfficerChief Financial Officer
March 17 2009
44NYSE: G
March 17, 2009

Financial Strategy Aligned with Genpact’s Long-Term Vision of Sustained Profitable Growth
Well-evolved, Mature and Stable Long-term Business ModelScale, risk diversification and investment for growth
Diversified Recurring Revenue Base Driving Sustained Profitable GrowthTremendous mining potential from existing well established clients
Growth markets… Europe, India to India, China to China
Products… E2E, Procurement, F&A, Collections, Re-engineering, Analytics, ‘Cash is King’, ‘Risk Management’, ‘Cost Out’
Industry… Healthcare, BFSI, Services
Drive Operational and Cost efficiencyPermanently change cost structure e.g NIIT training JV: train & hire vs. hire & train
Re-negotiated down terms and costs of new SEZs
Conservative Financial Policy and ControlsStringent deal review and pricing discipline
Rigorous tracking of operating units on business-critical metrics
45
Rigorous tracking of operating units on business critical metrics
Prudent cash management
Strong corporate governance

Global Clients Driving Sustained Revenue Growth
2008 growth at 26%
Global Clients grew 62% over 2007($ in MM)
Global Clients-a)
Genpact Revenue Growth
Global Clients grew 62% over 2007
GE grew 7% (adj. for divested businesses) CAGR30%
823
1,041
GE
Revenue per employee increased 9% to
$30,800 over 2007, 17% since 2006,
reflecting shift towards higher value work,
613
9%
53%
53%160342
551
26%
53%
reflecting shift towards higher value work,
Re-engineering, Analytics, E2E
85% growth from existing clients453 481 490
26%
85% growth from existing clients
Delivered on 2008 guidance
91%74%
2006 2007 2008
74% 47%
Revenue / Employee $K 26.4 28.2 30.8
46Outstanding Global Client Growth-a) Global Clients Revenue including GE Divested businesses and acquisitions (GAAP)
p y $

Revenue Diversified by Geography (Service Delivery)
Europe India Americas Asia ($ in MM) 2006 2007 2008 08 G% CAGR %
Europe 31 84 112 34% 90%11%8%
8%
p
Asia 34 50 81 62% 55%
India 483 609 764 25% 26%
73%
Americas 65 81 84 4% 14%
Total 613 823 1,041 26% 30%
Europe growth 50% (adjusted for ICE acquisition), mainly driven by multi-lingual capability
in F&A practice
Growth in Asia driven by customer services practice in Philippines
F&A, Supply Chain & Analytics driving growth in India
47
Europe, China & Philippines leading the growth trajectory… value of our global delivery model

Revenue Diversified by Industry Vertical
16%
BFSI Manufacturing Services
42%
42%
($ in MM) 2006 2007 2008 08 G % CAGR BFSI 273 361 442 22% 27%
Manufacturing 268 347 435 25% 27%
Services 72 115 164 43% 51%
* Services segments include Media, Retail, Telecom, Hospitality and Transportation
Total 613 823 1,041 26% 30%
48
Balanced growth in Manufacturing and BFSI segment…While increasing penetration in Business Services

Delivered Significant Margin Expansion
Adjusted Income from Operations at $178MM, +33% over 2007, margin at 17.1% 80 bps($MM)
Adjusted Operating Income and Margin-a)
4,6005,300
Adj. Op. Inc. per employee +15% vs. 2007 $5,300, +26% since 2006
CAGR36%
4,200
97134
178Moving up the value and margin chain, over the long term
New offerings like Re-Engineering Analytics
36%
New offerings like Re Engineering, Analytics, E2E, and gain share building momentum
Margin improves as existing global clients gain scale and reach stable state
15.8% 16.3% 17.1%
2006 2007 2008 gain scale and reach stable state
Tight contracting discipline… terms include inflation adjustmentsAdj Op Inc / Employee $
Adj. Diluted 0.44 0.50 0.76EPS $
49
Cost productivity each year on input factors
Adjusted Diluted EPS at $0.76, up 51% from $0.50 in 2007
-a) Adjusted Operating Income = Income from Operations + Formation Accounting Amortization + Stock Options Charge + Indian Fringe benefit tax on Stock Option

Proven Cost Management Disciplines
Wage inflation ~7-8% in 2008 vs market 10-12% minimumCosts Actions
SalariesWage inflation 7-8% in 2008 vs. market 10-12%, minimum increase in entry level compensation, Increment freeze on VP+2009 estimated wage inflation at 4-5%
Span of control up from 15 per supervisor to 16Supervision Span of control up from 15 per supervisor, to 16
Support FunctionSupport headcount held flat since 2007… through 2009
Bench Bench as % of revenue-generating employees ↓ from 13% in 2007 to 10% in 2008; Targeting further reduction of 1-2% in 2009
InfrastructureContinue to expand to Tier 2 cities and SEZ units, productivity in Utility, Transport cost
Costs of hire per associate in India down 8% in 2008;Hiring
Training
Costs of hire per associate in India down 8% in 2008; 2009 target further 10% reduction
Investment in building domain expertise and E2E capabilities; fundamental shift to NIIT JV ‘Train & Hire’
50
IT/Telecom
fundamental shift to NIIT JV Train & Hire
Driving productivity through bandwidth rationalization, better rates and scale benefits
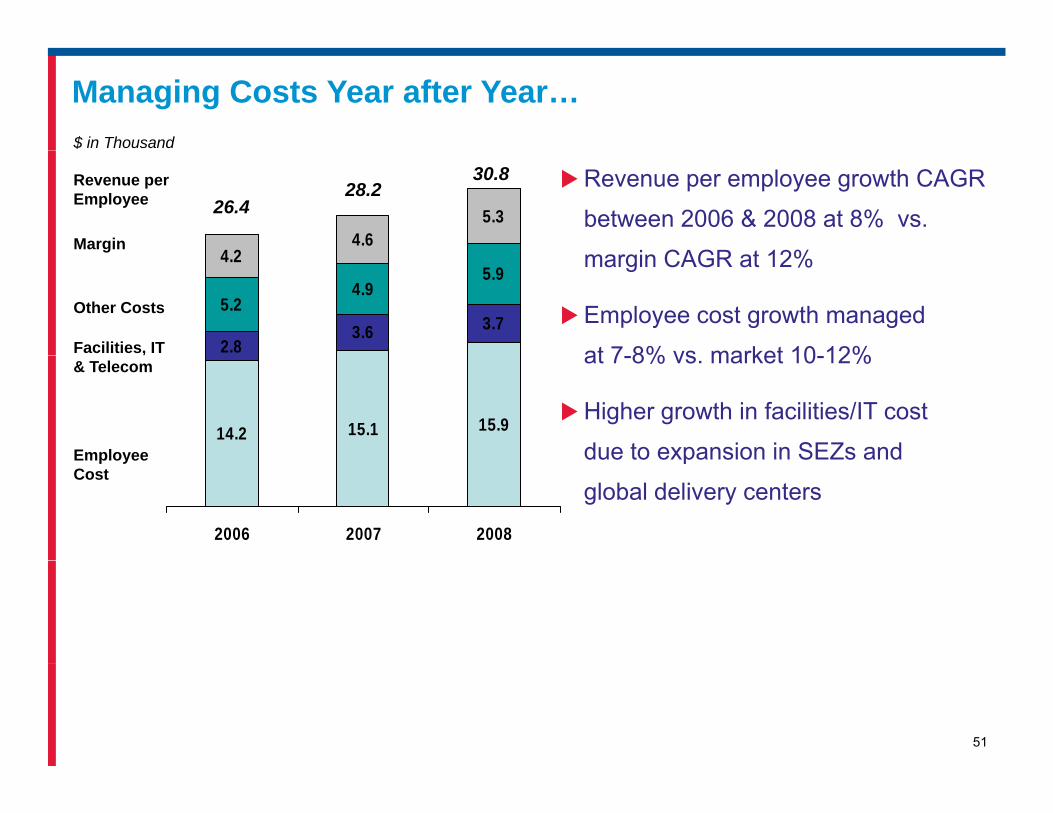
Managing Costs Year after Year…$ in Thousand
4 24.6
5.3Margin
Revenue per Employee 26.4
28.230.8 Revenue per employee growth CAGR
between 2006 & 2008 at 8% vs.
i CAGR t 12%
2.83.6 3.7
5.24.9
5.94.2
Facilities, IT
Other Costs
margin CAGR at 12%
Employee cost growth managed
at 7 8% vs market 10 12%
14.2 15.1 15.9Employee
& Telecom at 7-8% vs. market 10-12%
Higher growth in facilities/IT cost
due to expansion in SEZs and
2006 2007 2008
EmployeeCost
due to expansion in SEZs and
global delivery centers
51

What is Driving SG&A Leverage in Q4’08 vs. Q3’08 ?
(23%)$71$55SG&A 4%$271$282Revenue
V%Q3’08Q4’08$MM
(690 bps)26.3%19.4%% of Revenue
Leverage from lower bench and support headcount levels ~125 bps
Lower travel in Q4 over Q3 ~100 bps
Leadership training spend in Q3 ~50 bps
Annual actuarial true-up of employee benefits ~75 bps
Higher India fringe benefit tax in Q3 over Q4 ~50 bps
Lower bad debt provision ~50 bps
Lower other operational costs (legal, consultants, insurance, G&A) ~100 bps
52
Lower IT costs ~50 bps
Infrastructure leverage ~90 bps

Consistently Generated Strong Cash Flow Growth
Cash flow from Operations and % of Revenue
($MM)18%
20%$66MM from Increase in Operating Income
18%DSO improved from 75 days to 73 days
211
Cash Held in Banks $135MM150
211
US Govt. Treasury Bills $191MM
Short Term deposit with GE $59MM
$385MM
CFOA as a % of Revenue
2007 2008
53Strong Cash Flow Backed by Prudent Liquidity Management

Capital Expenditure
Capital Expenditure and % of Revenue (a) Invested in new sites in Guatemala,
Morocco and Lublin (Poland)($MM)
8%13%
Re-negotiated SEZ terms on capacity
in India7%
Re-negotiated supplier contracts on IT
in India7966 69
7%
2006 2007 2008Capex as a % of Revenue
542009 Estimated Capex 6% of Revenues
(a) Capital expenditure excluding proceeds from sale of assets

2009 Guidance
Revenue Growth 10-15%
GE growth (adjusted for divestiture) Low single digitGE growth (adjusted for divestiture) Low single digit
Adjusted Operating Income Margin% 16-17%
Capex 6% of revenue
Effective Tax Rate 17% - 19%% %
Our guidance represents a cautious approach given the uncertainties in the macro environment.
55

Thank You
56
www.genpact.com

Closing RemarksClosing Remarks
Pramod BhasinPresident & CEOPresident & CEO
March 17 2009
57NYSE: G
March 17, 2009

The World has Changed
Changing Client Needs
From growth & i t t
Opportunities for Growth
Focus on cash preservation and t d ti l di li t t
How We Are Positioned to Capture Opportunity
E2E solutions are non-capital i t iexpansion to cost
reduction
Preservation of cash & improved working capital
cost reduction leading clients to aggressively look at new ideas and operating modelsNew Growth Markets:
China
intensive
Scale existing cash / cost solutions
Re-allocate dedicated Middle EastImprove productivity
Deflation focused sourcing & spend requirements
ChinaIndia
Growth Opportunities:HealthcarePharmaceuticals
leadership resources and swat teams to growth areas
Speed of deployment for 90 day pay-back
Middle East Japan
CollectionsRisk Management
Minimize capital investment
“Cash Is King”“Cost out”
Strong Pipeline:New categories of prospects d i b i liti
Ideal time to acquire global talent
Outcome based / gain share pay-back model
Risk ManagementProcurement / Supply Chain
driven by economic realitiesOperating Innovation
58Factored These Risks in our Growth Plans

Investing for the future
Build our brand, sales engine
Hire great resources… Global talent never more attractive
Expand into new growth markets… Middle East, Russia, Latin America, Scandinavia
E l i i d l M f FTE’ t tEvolve pricing models…. Move away from FTE’s to outcome based
Increasing investment in technology enabling & coreIncreasing investment in technology, enabling & core
Drive E2E across more products & industries, build domain expertisep
59Investing now for future growth

Why Genpact Even in This Environment?Market opport nit remains h ge despite en ironmentMarket opportunity remains huge despite environment
Global business process market, significantly under-penetrated, Est. 6-8% growth vs. flat ITOProven business model – start small and expand with clients
Expanding diversified blue-chip client relationships, and enhancing products and services, support p g p p , g p , ppcontinued growth (85% from existing clients); Growth in GE revenues even after 10 years
Breadth and depth of services across verticals and marketsIndustry led solutions around BFSI and manufacturing coupled with domain expertise in F&A, Procurement Analytics and Technology enablers supports client value creationProcurement, Analytics and Technology enablers supports client value creationSwiftly allocating resources to new growth areas and to domestic markets of India & China
Proven track record of performance and growth: 30% revenue CAGR over 3 years Driven by Global Client (GC) growth: $551MM in ‘08 GC revenues, more than 13X $42MM in ’05Long-term margin improvement
Strong balance sheet and cash flows, including approximately $385MM of liquidityCash from operations – improved to 20% of revenue compared to 18% in ‘07
Strong pipeline – new prospects driven by new economic realitiesStrong pipeline – new prospects driven by new economic realitiesE2E: a differentiated way to deliver business outcomes for clients
Previous investments in Re-Engineering, Six Sigma, Lean, Process Management & IT drive non-capital intensive operating innovation
60
E2E capabilities, along with IT, process & analytics, and focus on effectiveness not just efficiency
Perfectly Positioned for this Environment

The Year Ahead
Responding to the dramatic change around us from a position of strength.
We can be part of the solution: validation from a strong pipeline with new prospects…demand for our services has never been higher.p p g
Our business model of expanding diversified blue-chip client relationships, and enhancing our products and services, supports continued growth.continued growth.
Investments in Re-Engineering, Six Sigma, Lean, Process Management & IT well-timed to drive non-capital intensive operating innovation in this environmentenvironment.
Allocating resources: investing in talent, domain expertise, new growth areas and markets.
Our unique capabilities (E2E, process management, depth of experience, combined with IT, process & analytics, and focus on effectiveness not just efficiency), represent a huge competitive differentiator, especially today.
61
Acquisitions at the right price, but in no hurry.
Companies that Invest During Recession Emerge as Market Leaders

Thank You
62
www.genpact.com

Question and Answer SessionQuestion and Answer Session
63NYSE: G

64NYSE: G