Embed Size (px)
Citation preview

TECHNICAL REPORT ONGOLLIER CREEK KAOLIN PROJECTWOOD MOUNTAIN, SASKATCHEWANPREPARED FORWHITEMUD RESOURCES INC.
NI 43-101 Report
Author:Donald H. Hains, P.Geo.
RPASCOTT WILSON ROSCOE POSTLE ASSOCIATES INC.
January 30, 2008

SCOTT WILSON RPA www.scottwilson.com www.scottwilsonmining.com
i
TABLE OF CONTENTS PAGE
1 SUMMARY.................................................................................................................. 1-1
2 INTRODUCTION AND TERMS OF REFERENCE .................................................. 2-1
3 RELIANCE ON OTHER EXPERTS ........................................................................... 3-1
4 PROPERTY DESCRIPTION AND LOCATION........................................................ 4-1
5 ACCESSIBILITY, CLIMATE, LOCAL RESOURCES, INFRASTRUCTURE AND PHYSIOGRAPHY........................................................................................................... 5-1
6 HISTORY ..................................................................................................................... 6-1
7 GEOLOGICAL SETTING ........................................................................................... 7-1 Regional Geology ...................................................................................................... 7-1 Local and Property Geology ...................................................................................... 7-7
8 DEPOSIT TYPES......................................................................................................... 8-1
9 MINERALIZATION .................................................................................................... 9-1
10 EXPLORATION....................................................................................................... 10-1
11 DRILLING................................................................................................................ 11-1
12 SAMPLING METHOD AND APPROACH............................................................ 12-1
13 SAMPLE PREPARATION, ANALYSES AND SECURITY ................................. 13-1
14 DATA VERIFICATION .......................................................................................... 14-1
15 ADJACENT PROPERTIES ..................................................................................... 15-1
16 MINERAL PROCESSING AND METALLURGICAL TESTING......................... 16-1
17 MINERAL RESOURCE AND MINERAL RESERVE ESTIMATES.................... 17-1 2006 Mineral Resource Estimate ............................................................................. 17-2 2006 Mineral Reserves ............................................................................................ 17-4 2007 Mineral Resource Estimate ............................................................................. 17-5 Mineral Resource and Mineral Reserve Summary .................................................. 17-5
18 OTHER RELEVANT DATA AND INFORMATION ............................................ 18-1 Mining Operations ................................................................................................... 18-1 Mineral Processing................................................................................................. 18-12 Site Infrastructure................................................................................................... 18-18 Tailings Management............................................................................................. 18-23 Reclamation ........................................................................................................... 18-25 Markets .................................................................................................................. 18-26 Environmental Considerations............................................................................... 18-54

SCOTT WILSON RPA www.scottwilson.com www.scottwilsonmining.com
ii
Capital And Operating Cost Estimates .................................................................. 18-60 Economic Analysis ................................................................................................ 18-72
19 INTERPRETATION AND CONCLUSIONS.......................................................... 19-1
20 RECOMMENDATIONS AND BUDGET ............................................................... 20-1
21 REFERENCES ......................................................................................................... 21-1
22 SIGNATURE PAGE ................................................................................................ 22-1
23 CERTIFICATE OF QUALIFICATIONS................................................................. 23-1
24 APPENDICES (VOLUME 2)................................................................................... 24-1
LIST OF TABLES PAGE
Table 1-1 Mineral Resource Estimate............................................................................ 1-5 Table 1-2 Mineral Reserve Estimate – West Pit ............................................................ 1-5 Table 1-3 WRI Initial Sales Commitments (Tonnes Annualized through 2008) .......... 1-8 Table 1-4 Results of DCF Evaluation – Base Case ....................................................... 1-9 Table 1-5 Recommended Budget................................................................................. 1-12 Table 4-1 Mineral Lease Holdings ................................................................................ 4-3 Table 5-1 Dominant Plant Communities ....................................................................... 5-4 Table 5-2 Rare Plants In Project Area ........................................................................... 5-5 Table 5-3 Gollier Creek Area – Potential White Sucker Habitat................................... 5-6 Table 5-4 Summary of Significant Impacts ................................................................... 5-7 Table 6-1 Historical Resource Estimate - Ekaton Properties......................................... 6-4 Table 7-1 Cretaceous-Pleistocene Stratigraphy in Southwestern Saskatchewan .......... 7-7 Table 7-2 Stratigraphy and Lithology of Part of Upper Cretaceous – Tertiary Sequence in Wood Mountain Region............................................................................................... 7-9 Table 11-1 Program Drill Hole Summary – 2006 Drill Program ................................ 11-3 Table 11-2 Program Drill Hole Summary – 2007 Drill Program ................................. 11-5 Table 12-1 Bulk Density Test Results ......................................................................... 12-3 Table 14-1 Scott Wilson RPA Sample List ................................................................. 14-2 Table 14-2 Summary of Qualitative X-Ray Diffraction Results – Composite Samples........................................................................................................................................ 14-3 Table 14-3 Qemscan Particle Analysis of Composite Samples................................... 14-4 Table 16-1 Chemical Analysis Comparison ................................................................ 16-5 Table 16-2 Physical Property Test Summary .............................................................. 16-7 Table 16-3 WRI Metakaolin Evaluation - Metakaolin vs. Silica Fume ...................... 16-9 Table 16-4 WRI Metakaolin Evaluation - Metakaolin vs. Fly Ash........................... 16-10 Table 16-5 WRI Kaolin Evaluation -Comparison in HPC Bridge Deck Mix vs. Silica Fume ............................................................................................................................ 16-11

SCOTT WILSON RPA www.scottwilson.com www.scottwilsonmining.com
iii
Table 17-1 Inferred Mineral Resources - Wood Mountain and Project 12 Areas ....... 17-3 Table 17-2 Mineral Resource Estimates - Gollier Creek Deposits – 2006 Drilling .... 17-4 Table 17-3 Mineral Resource Estimate Based on the 2007 Drilling Program ............ 17-5 Table 17-4 Mineral Resource Estimate Summary ....................................................... 17-6 Table 17-5 Mineral Reserve Estimate – West Pit ........................................................ 17-7 Table 18-1 Mine Schedule ......................................................................................... 18-11 Table 18-2 Pozzolanic Reactivities (Chappelle Test) ................................................ 18-26 Table 18-3 Typical Chemical and Physical Properties of Selected Pozzolans .......... 18-29 Table 18-4 Estimated SCM Use in Canada – 2001 (Tonnes).................................... 18-29 Table 18-5 U.S. Consumption of SCMs in Cement Production (‘000 Tonnes) ........ 18-30 Table 18-6 Cost-Performance Summary for Cementitious Materials in Oilfield Cements...................................................................................................................................... 18-35 Table 18-7 Cost Comparison of Cement Mix Designs (20% wt replacement of cement)...................................................................................................................................... 18-35 Table 18-8 U.S. Oilfield Cement Demand (‘000 tonnes) .......................................... 18-36 Table 18-9 SCM Use in Canada as a Separate Ingredient (Tonnes).......................... 18-39 Table 18-10 Specialty SCM Applications in Canada (Tonnes)................................. 18-39 Table 18-11 Blended Cement Production and Consumption in Canada (Tonnes) .... 18-40 Table 18-12 Canadian Concrete Market – 2004 (m3) ................................................ 18-42 Table 18-13 U.S. Regional Portland Cement Shipments – 2004 (‘000 tonnes) ........ 18-44 Table 18-14 WRI Initial Sales Commitments (tonnes, annualized through 2008).... 18-54 Table 18-15 Summary of Impacts and Mitigation..................................................... 18-57 Table 18-16 Process Plant Capital Cost Estimate – Phase I ...................................... 18-62 Table 18-17 Process Plant Capital Cost Estimate – Phase II..................................... 18-63 Table 18-18 Life-of-Mine Mining Costs ................................................................... 18-65 Table 18-19 Total Average Operating Costs (Life of Mine Basis) ........................... 18-71 Table 18-20 Annualized Cash Flow Forecast ............................................................ 18-75 Table 18-21 Results of DCF Evaluation - Base Case ................................................ 18-76 Table 20-1 Recommended Budget............................................................................... 20-2
LIST OF FIGURES PAGE
Figure 4-1 Location Map ............................................................................................... 4-6 Figure 4-2 2006 Dispositions......................................................................................... 4-7 Figure 4-3 Mineral Dispositions, Wood Mountain Area, as of December 2007........... 4-8 Figure 6-1 Whitemud Formation Outcrop at Gollier Creek Site ................................... 6-2 Figure 6-2 Gollier Creek Test Pit................................................................................... 6-6 Figure 6-3 Gollier Creek Property ................................................................................. 6-7 Figure 7-1 Regional Geology......................................................................................... 7-4 Figure 7-2 Structure Contours on Top of the Lower Eastend Formation or Upper Transition Zone................................................................................................................ 7-5

SCOTT WILSON RPA www.scottwilson.com www.scottwilsonmining.com
iv
Figure 7-3 Structure Map on Top of the Kaolinized Sediments of the Whitemud Formation......................................................................................................................... 7-6 Figure 7-4 Outcrop at Gollier Creek Showing Ravenscrag/Whitemud Contact.......... 7-10 Figure 10-1 Drill Core Sampling by Scott Wilson RPA.............................................. 10-2 Figure 11-1 2006 Drill Program – Hole Locations...................................................... 11-1 Figure 11-2 Drill Rig ................................................................................................... 11-2 Figure 11-3 Drill Core ................................................................................................. 11-2 Figure 11-4 Sampled Core ........................................................................................... 11-2 Figure 11-5 Contact between Whitemud and Eastend Formations ............................. 11-2 Figure 15-1 IXL Quarry near Readlyn, Saskatchewan................................................ 15-1 Figure 16-1 Metakaolin Production - Process Flow Block Diagram........................... 16-2 Figure 16-2 Consultec Mass Balance .......................................................................... 16-6 Figure 16-3 WRI Test Results ................................................................................... 16-12 Figure 16-4 WRI Kaolin vs. U.S. Competitor ........................................................... 16-14 Figure 17-1 Drill Hole Locations and 200 m Block Model Limit – 2006 Resource Estimate.......................................................................................................................... 17-8 Figure 17-2 Drill Hole Locations and West Pit Toe and Strip Ratio Contours ........... 17-9 Figure 17-3 Resource and Pit Outline – 2006 Drill Program .................................... 17-10 Figure 17-4 Fill-in Holes and Expanded Resource Limit – 2006 Drill Program....... 17-11 Figure 17-5 Expanded Resource Limit – 2007 Drill Program Results...................... 17-12 Figure 18-1 Development Schedule............................................................................. 18-4 Figure 18-2 Process Plant as of December 17, 2007 ................................................... 18-5 Figure 18-3 West Pit Cuts............................................................................................ 18-8 Figure 18-4 Conceptual 26 Year Pit Plan – Year 5-10-15-20-25 Pit........................... 18-9 Figure 18-5 Phase I Flow Sheet ................................................................................. 18-15 Figure 18-6 Phase II Flow Sheet................................................................................ 18-16 Figure 18-7 Plan View of the Plant Layout ............................................................... 18-17 Figure 18-8 Alternative Road Transport Routes........................................................ 18-22 Figure 18-9 U.S. Target Market Region .................................................................... 18-43 Figure 18-10 2005 U.S. Regional Market.................................................................. 18-45 Figure 18-11 U.S. Cement Consumption................................................................... 18-47 Figure 18-12 Regional Demand Growth – Cement Consumption............................. 18-48 Figure 18-13 Plant Organization Chart...................................................................... 18-69 Figure 18-14 Sensitivity of Pre-Tax NPV at 10% Discount Rate ............................. 18-77 Figure 18-15 Sensitivity of After-Tax NPV at 10% Discount Rate .......................... 18-78 Figure 18-16 Sensitivity of Pre-Tax IRR................................................................... 18-79 Figure 18-17 Sensitivity of After-Tax IRR................................................................ 18-80 Figure 18-18 Project Sensitivity to Discount Rate .................................................... 18-81
SCOTT WILSON RPA www.scottwilson.com www.scottwilsonmining.com
1-1
1 SUMMARY Scott Wilson Roscoe Postle Associates Inc. (Scott Wilson RPA) was retained by
Whitemud Resources Inc. (WRI) to prepare a Technical Report on the Gollier Creek
Kaolin Project (the Project), Wood Mountain, Saskatchewan. This report supersedes a
Technical Report issued on December 6, 2006. The purpose of this Technical Report is
to prepare mineral resource and mineral reserve estimates and complete a pre-feasibility
study (PFS) for the Project. Changes have been made with respect to reported mineral
resources and capital and operating costs, and are based on the results of a drilling
program conducted in 2007 and progress in construction of the mine and processing
plant. A press release dated December 16, 2007, was issued by WRI detailing the results
of the 2007 drilling program and providing an update on plant construction. This
Technical Report conforms to National Instrument 43-101 Standards of Disclosure for
Mineral Projects (NI 43-101).
WRI is a Canadian company based in Calgary, Alberta, that has been established to
manufacture and supply metakaolin to the North American Portland cement, ready-mix
concrete, and oilwell cementing markets. Metakaolin is a high performance
supplementary cementitious material (SCM) used as a performance-enhancing additive to
Portland cement and concrete. Metakaolin is highly pozzolanic and its addition to
cement and concrete can offer significant technical and cost advantages.
WRI is developing the kaolin resources near Wood Mountain, Saskatchewan, for the
production of metakaolin. The kaolinized sand deposits of the Wood Mountain and
surrounding areas which are contained within the Whitemud Formation have been known
for many years. WRI holds quarry leases and/or quarry prospecting permits covering a
total area of 11,433.20 ha in southern Saskatchewan. WRI’s mineral properties are
located in five major lease blocks (Gollier Creek, Wood Mountain, Project 12, Waverley,
and Eastend) and one Quarry Prospecting Permit (QPP 144) extending over a distance of
more than 160 km east to west. The focus of the current activity is on the resources
contained within the Gollier Creek block. This area has been the subject of considerable

SCOTT WILSON RPA www.scottwilson.com www.scottwilsonmining.com
1-2
exploration activity in prior years and features significant outcrops of kaolinized
sediments.
Previous attempts to develop the kaolinized sediment resources contained in the
Whitemud Formation have concentrated on the potential for production of kaolin for
paper coating and filler applications. All of the prior development attempts have been
unsuccessful. WRI has conducted test work on beneficiation of the kaolinized sediments
to recover kaolin, and on production of metakaolin from the kaolin. Test results have
been highly encouraging. Technical studies of the performance of the metakaolin in
various cement, concrete mix, and oilwell cementing designs indicate the product can
provide performance improvements comparable to competing metakaolin products and to
alternative SCMs such as silica fume and fly ash.
Market research analysis indicates the potential for WRI to develop a significant
business. The plant will have an initial capacity of 200,000 tpa (Phase I), with provision
for expansion to 350,000 tpa metakaolin by the end of Year 4 (Phase II) of operations and
to 700,000 tpa by Year 7. The originally projected capital cost of Phase I is
approximately $54.56 million. Based on the most recent information, capital costs for
Phase I are now anticipated to total $46.0 million. Phase II is projected to cost an
approximate additional $18.65 million. Capital costs to reach maximum capacity are
projected to total a further $73.2 million. An economic analysis of the Project based on
the estimated capital costs, reasonable estimates of operating costs, selling prices, and the
projected annual production volumes indicates that the Project has economic merit.
The evaluation and development of an industrial mineral property is similar to that of
conventional “Mineral Property” but also requires the additional scrutiny of the guideline
set out in the “Estimation of Mineral Resources and Mineral Reserves Best Practice
Guidelines” adopted by CIM Council on November 23, 2003, in the part which deals
with Non-Metallic Mineral Deposits and specifically with industrial minerals. The
guidelines define an industrial mineral as “any rock, mineral or other naturally occurring
substance of economic value, exclusive of metallic ores, mineral fuels and gemstones;

SCOTT WILSON RPA www.scottwilson.com www.scottwilsonmining.com
1-3
that is one of the non-metallic minerals”. It further states, “Before a tonnage and quality
and/or value per tonne estimate of an industrial mineral deposit can be classified as a
mineral resource, the qualified person preparing the tonnage and quality estimate must
recognize that there is a viable market for the product or that a market can be reasonably
developed”.
CONCLUSIONS The major conclusions arising from this report are:
RESOURCES AND RESERVES
WRI holds a 100% interest in quarry leases totalling 9,405.26 ha in southern
Saskatchewan, plus an additional 2,027.94 ha held in the form of a Quarry Prospecting
Permit (QPP). The mineral lease holdings and permits are in six major blocks, viz.,
Gollier Creek, Wood Mountain, Waverly, Project 12, Eastend, and QPP 144. The Gollier
Creek deposit, centered on 17-05-02 W3M and 18-05-02 W3M, is the area of prime
interest at present.
The Gollier Creek deposit held by WRI consists of kaolinized sediments containing
quartz sand, feldspars, and mica cemented by kaolinite, and trace amounts of illite and
smectite clays. The deposit is hosted in the Cretaceous-age Whitemud Formation and
outcrops along the edge of the Gollier Creek valley. The deposit is overlain by the
Tertiary-age Ravenscrag Formation and glacial till. The top of the Whitemud Formation
is demarcated by the presence of a lignite band immediately above, which represents the
lowermost interval of the Ravenscrag Formation.
The available evidence suggests the source rock of the kaolinized sediments of the
Whitemud Formation originated some distance from the site of deposition but was
transported in largely unaltered condition. Kaolinization of the sediments is interpreted
as taking place largely in-situ.

SCOTT WILSON RPA www.scottwilson.com www.scottwilsonmining.com
1-4
The kaolinized sediments of the Whitemud Formation range in colour from white to
off-white/grey to yellowish-greenish, and finally to greenish grey. The Eastend
Formation, which also consists of partly kaolinized sediments, is transitional to the
lowermost portions of the Whitemud Formation and is marked by the transition to a
greenish grey colour. The colour distinctions in the Whitemud Formation allow for clear
demarcation of the highly kaolinized portion of the deposit. The average thickness of the
highly kaolinized sections of the Whitemud Formation is approximately seven metres.
Analysis of samples from the highly kaolinized section of the Whitemud Formation
indicates the sediments are composed of kaolinite, quartz, feldspars, micas, chlorite,
oxides, amphiboles, and trace amounts of smectite and illite clays. Kaolinite accounts for
approximately 20% to as high as 60% of the mineral mass, with a typical average of
approximately 40%. Particle size analysis of the kaolinized sediments indicates an
average of approximately 40% minus 44 microns (-325 mesh). The indicated in-situ bulk
specific gravity of the kaolinized sediments is 2.01 tonnes per cubic metre.
Extensive exploration and drilling work in the 1980s has provided an excellent drill
hole database for the Project. The available drill data have been supplemented by drilling
and core sampling in 2006 and 2007 by WRI to provide additional geological,
mineralogical, and particle size data.
The estimated mineral resources and mineral reserves contained on WRI’s properties
are summarized in Tables 1-1 and 1-2.

SCOTT WILSON RPA www.scottwilson.com www.scottwilsonmining.com
1-5
TABLE 1-1 MINERAL RESOURCE ESTIMATE Whitemud Resources Inc. – Gollier Creek Kaolin Project
Category and Property Area Grade, % - 325 mesh Tonnage (Mt) Measured Resources
West Pit 40.80 52.9 North Pit 36.78 13.2 East Pit 41.36 8.0
Elm Springs Deposit W. Extension of West Pit
East Bridge Pit Total Measured
43.00 45.10 40.30 41.72
23.5 29.1 8.6
135.3
Indicated Resources N. Extension of West Pit
37.8
27.8
Total Meas. + Ind. 41.05 163.1 Inferred Resources
Project 12 30% 62.46 Wood Mountain 30% 8.83
Total Inferred 30% 71.29 Notes:
1. CIM definitions were followed for mineral resources. 2. Mineral resources are estimated based on wt% -44 micron fraction in ore 3. Mineral resources are estimated using an average long-term price of C$ 209 per tonne
metakaolin and a US$/C$ exchange rate of 1.13. 4. Indicated Mineral Resources are inclusive of Mineral Reserves. 5. Bulk density is 2.01 t/m3. 6. Indicated Resources are net of adjustment for environmental consideration.
TABLE 1-2 MINERAL RESERVE ESTIMATE – WEST PIT Whitemud Resources Inc. – Gollier Creek Kaolin Project
Category Grade, % - 325 mesh Tonnage (Mt)
Proven 40.80 52.9
Notes:
1. CIM definitions were followed for mineral reserves. 2. Mineral reserves are estimated based on wt% -44 micron fraction in ore 3. Mineral reserves are estimated using an average long-term price of C$ 209 per tonne
metakaolin and a US$/C$ exchange rate of 1.13. 4. Bulk density is 2.01 t/m3.
A pre-feasibility level economic and financial analysis of developing the West Pit
allows classification of the resources in this area as Proven Reserves. The estimated

SCOTT WILSON RPA www.scottwilson.com www.scottwilsonmining.com
1-6
Proven Reserves are sufficient for 25.4 years of production, assuming the production
schedule developed for the Project.
PRODUCT TESTING
WRI is proposing to mine and process the kaolinized sediments of the Gollier Creek
deposit to produce metakaolin, a high performance pozzolanic material, and raw kaolin.
Test work conducted on WRI’s metakaolin product shows that:
• Metakaolin performs equivalently to silica fume in a ternary mix with fly ash and cement in terms of slump, concrete temperature, initial set time, and final set time. Compressive strength at 3, 7, 28, 56, and 91 days is comparable for equivalent additions of silica fume or metakaolin. At equivalent addition rates, water demand is reduced with the use of metakaolin versus silica fume.
• In a High Performance Concrete (HPC) bridge deck mix design using fly ash
and silica fume, metakaolin provided equivalent compressive strength and water demand. At an 8% addition rate, chloride ion permeability was higher for metakaolin than for silica fume but still well within the limits for low permeability concrete (Note: other data indicate equivalent permeability for mixes without fly ash but equivalent silica fume or metakaolin addition).
• Metakaolin addition can reduce the total cementitious requirement by up to
20% with equivalent 28 day compressive strength and set times. • Metakaolin can significantly reduce expansion due to adverse alkali-silica
reactions. • WRI’s metakaolin is performance-competitive versus commercially available
product.
PROCESS PLANT Environmental approvals for the Phase I mine and processing plant have been
received. As of December 31, 2007, WRI’s process plant is 98% complete. The
processing plant has an initial production capacity of 175,000 tpa metakaolin and 25,000
tpa kaolin (Phase I plant). This plant would be expanded to a capacity of 350,000 tpa
metakaolin and 25,000 tpa kaolin (Phase II plant). Further expansion to 700,000 tpa
metakaolin production would take place by duplicating the plant.

SCOTT WILSON RPA www.scottwilson.com www.scottwilsonmining.com
1-7
Commissioning of the process plant is scheduled to start in January 2008, with
commercial product shipments anticipated to begin in late February or early March 2008.
A mine plan has been developed to match the proposed production rate. The West Pit
has sufficient reserves for a 25.4 year mine life. Pre-stripping and initial pit development
has been completed and approximately 100,000 tonnes of ore have been stockpiled on
surface as initial feed for the process plant.
The proposed plant has an estimated capital cost of $54.564 million. Expansion of the
plant is estimated to require an additional $18.645 million for a total investment of
$73.209 million. A second plant is estimated to cost approximately the same amount. As
of September 30, 2007, capital expenditures have totalled $37.6 million. Based on
expenditures since that date and projected costs to plant completion, total capital
expenditures are anticipated to be $46.0 million, or 15.7% below the original capital cost
estimate.
Quarry pre-stripping costs as of September 30, 2007, were $1.4 million. Based on
expenditures since that date and estimated expenditures to plant start-up, pre-stripping
and initial mine development costs are projected to be $3.0 million. Actual pre-stripping
and initial ore stockpiling costs were $1.1 million, or $1.70/tonne, which is well below
the estimated $2.02/tonne projected in the pre-feasibility study. The balance of the costs
was incurred in general site preparation activities, internal road improvements and other
activities. Total quarry development costs are above the original estimated costs of $2.9
million but well within the budgetary contingency allowance.
Infrastructure upgrades for electrical power, natural gas pipeline and roads were
originally estimated at $1.8 million. Actual expenditures for the natural gas pipeline were
$1.1 million, with the other required upgrades resulting in negligible expenditures.

SCOTT WILSON RPA www.scottwilson.com www.scottwilsonmining.com
1-8
An analysis of operating costs for both the mine and process plant indicates total
mining, processing and general and administrative costs, exclusive of product distribution
costs, will approximate $53.93 per tonne product over the life of the mine.
MARKETS
Major target markets for WRI’s metakaolin product include oilfield cements, ready-
mix concretes, and blended cements.
Independent market research conducted by WRI has identified significant Canadian
and U.S. markets for WRI’s metakaolin products. These markets are conservatively
estimated to initially exceed 600,000 tonnes and could exceed 3.2 million tonnes within
10 years given a well developed technical development and marketing program.
WRI has received initial purchase orders and letters of intent and/or expressions of
interest for over 160,000 tpa of metakaolin (Table 1-3). Anticipated future purchase
commitments from identified markets exceed 575,000 tpa within the next six to eight
years. Expansion of the customer base beyond this level to reach full production capacity
of 700,000 tpa metakaolin is believed to be reasonable and achievable.
TABLE 1-3 WRI INITIAL SALES COMMITMENTS (TONNES ANNUALIZED THROUGH 2008)
Whitemud Resources Inc. – Gollier Creek Kaolin Project
Market Area Market Application Oilfield Cements Ready-Mix Concrete
Canada 45,000 50,600 United States 15,000 50,000
Total 60,000 100,600
Markets for approximately 25,000 tpa of raw kaolin have been identified, with strong
customer interest expressed.
Achievement of the projected sales volume will be dependent upon WRI providing
consistent product quality and undertaking extensive education and testing programs

SCOTT WILSON RPA www.scottwilson.com www.scottwilsonmining.com
1-9
related to the use of metakaolin with cement and ready-mix concrete companies,
consulting engineers and concrete specifiers, and regulatory agencies.
As of January 18, 2008, the market volume and pricing and distribution cost
assumptions detailed in the 2006 technical report remain valid.
ECONOMIC ANALYSIS
The economic viability of the Project has been evaluated by conventional discounted
cash flow (DCF) analysis. This is the most commonly used procedure for determining the
economic merit of mining ventures.
The Base Case evaluation has been performed on the basis of contract mining, a mine
life of approximately 25.4 years, and metakaolin production increasing from 175,000 tpa
in Phase I to 350,000 tpa in Phase II and 700,000 tpa when the plant is doubled in size.
This case is assessed under financing assumptions of 100% equity.
Variance analyses are provided for Net Present Value (NPV) at a discount rate of
10% per annum as the capital costs, operating costs, distribution costs, and revenues are
varied from their estimated values over a range from minus 25% to plus 25%.
The results of the DCF evaluation, based on the original capital and operating costs
estimates, are summarized in Table 1-4.
TABLE 1-4 RESULTS OF DCF EVALUATION – BASE CASE Whitemud Resources Inc. – Gollier Creek Kaolin Project
(not adjusted for reduced capital costs)
Cash Flow Basis (incl. working
capital)
NPV @ 10%
(M $)
Internal Rate of Return (IRR),
%
Payback Period
(Years) Pre-Tax 227.71 28 7
After-Tax 141.15 24 8

SCOTT WILSON RPA www.scottwilson.com www.scottwilsonmining.com
1-10
The sensitivity of the Project cash flows to variations in capital costs, total operating
costs, distribution costs, and product revenues was tested by varying those parameters
over a range from -25% to +25% of the estimated values. The sensitivity analyses
demonstrate that the Net Present Value and return on investment of the Project are most
sensitive to changes in revenue and least sensitive to changes in capital costs. Variations
in total direct operating costs and product distribution costs have intermediate impacts on
Net Present Value and return on investment. Based on the information available as of
January 18, 2008, the Base Case assumptions and DCF evaluation results remain valid.
RECOMMENDATIONS The following recommendations are based on the results of the 2007 drill program
and progress in advancing construction and operation of the process plant:
1. Undertake an analysis of capital and operating costs for transport alternatives for ore from the east side of Gollier Creek to the processing plant. Alternatives to include truck haul and conveyor transport.
2. Complete a feasibility study of developing the resource on the east side of
Gollier Creek to extend the life of the Project.
3. Drill additional holes in the N Extension West Pit area to increase the confidence in the resource estimate from Indicated to Measured.
4. Complete a feasibility study for development of an expanded West Pit to
allow for increased metakaolin production. 5. Conduct additional test work on the properties of cement and concrete mixes
incorporating various addition rates of metakaolin, fly ash, and silica fume. The focus should be placed on determining the strength and other properties of ternary blends of cement, fly ash, and metakaolin.
6. Continue test work to develop additional data respecting the performance of
WRI’s metakaolin product in target cement and concrete applications. 7. Initiate project development to mine and process quantities of test product for
delivery to customers as part of a market development program. 8. Complete a feasibility study for the full project development based on initial
results of test production.

SCOTT WILSON RPA www.scottwilson.com www.scottwilsonmining.com
1-11
WRI has completed many of the recommendations detailed in the 2006 report. It is
anticipated that the remaining recommendations detailed in the 2006 report will be
completed in 2008.
BUDGET The indicated budget to implement the recommendations detailed above is provided
in Table 1-5.

SCOTT WILSON RPA www.scottwilson.com www.scottwilsonmining.com
1-12
TABLE 1-5 RECOMMENDED BUDGET Whitemud Resources Inc. – Gollier Creek Kaolin Project
Recommendation Estimated Cost ($) Contingencies 1. Undertake an analysis of capital and operating costs for transport alternatives for ore from the east side of Gollier Creek to the processing plant. Alternatives to include truck haul and conveyor transport
$30,000 - $80,000 None
2. Complete a feasibility study of developing the resource on the east side of Gollier Creek to extend the life of the Project.
$50,000 - $150,000 Dependent upon positive results for Recommendation 2
3. Drill additional holes in the N. Extension West Pit area to increase the confidence in the resource estimate from Indicated to Measured.
$10,000 - $15,000 None
4. Conduct additional test work on the properties of cement and concrete mixes incorporating various addition rates of metakaolin, fly ash, and silica fume. The focus should be placed on determining the strength and other properties of ternary blends of cement, fly ash and metakaolin.
$20,000 - $60,000 per year, ongoing
None. Considered as part of normal product development and testing during Phase 1 of project development (Recommendation 6)
5. Continue test work to develop additional data respecting the performance of WRI’s metakaolin product in target cement and concrete applications.
$20,000 - $60,000 per year, ongoing
None. Considered as part of normal product development and testing during Phase 1 of project development (Recommendation 6)
6. Initiate project development to mine and process quantities of test product for delivery to customers as part of a market development program
$54.56 million None. Phase 1 of project development
7. Complete a Feasibility Study for the full project development based on initial results of test production
$200,000 - $500,000 Dependent upon positive results for Recommendation 6 – successful operation of Demonstration Plant (Phase 1)

SCOTT WILSON RPA www.scottwilson.com www.scottwilsonmining.com
2-1
2 INTRODUCTION AND TERMS OF REFERENCE
Scott Wilson Roscoe Postle Associates Inc. (Scott Wilson RPA) was retained by
Whitemud Resources Inc. (WRI) to prepare a Technical Report on the Gollier Creek
Kaolin Project (the Project), Wood Mountain, Saskatchewan. This report supersedes a
Technical Report issued on December 6, 2006. The purpose of this Technical Report is
to prepare mineral resource and mineral reserve estimates and complete a pre-feasibility
study (PFS) for the Project. Changes have been made with respect to reported mineral
resources and capital and operating costs, and are based on the results of a drilling
program conducted in 2007 and progress in construction of the mine and processing
plant. A press release dated December 16, 2007, was issued by WRI detailing the results
of the 2007 drilling program and providing an update on plant construction. This
Technical Report conforms to National Instrument 43-101 Standards of Disclosure for
Mineral Projects (NI 43-101). Scott Wilson RPA has visited the Project a few times over
the last three years, most recently on December 17, 2007.
WRI is a Canadian company based in Calgary, Alberta, that has been established to
manufacture and supply metakaolin to the North American Portland cement, ready-mix
concrete, and oilwell cementing markets. Metakaolin is a high performance
supplementary cementitious material (SCM) used as a performance-enhancing additive to
Portland cement and concrete. Metakaolin is highly pozzolanic and its addition to
cement and concrete can offer significant technical and cost advantages.
WRI is proposing to develop the kaolin resources near Wood Mountain,
Saskatchewan, for the production of metakaolin. The kaolinized sand deposits of the
Wood Mountain and surrounding areas which are contained within the Whitemud
Formation have been known for many years. WRI holds a 100% interest in quarry leases
and/or quarry prospecting permits covering a total area of 7,485.83 ha in southern
Saskatchewan. WRI’s mineral properties are located in five major lease blocks (Gollier
Creek, Wood Mountain, Project 12, Waverley, and Eastend) and one Quarry Prospecting

SCOTT WILSON RPA www.scottwilson.com www.scottwilsonmining.com
2-2
Permit (QPP 144) extending over a distance of more than 160 km east to west. The focus
of the current activity is on the resources contained within the Gollier Creek block. This
area has been the subject of considerable exploration activity in prior years, and features
significant outcrops of kaolinized sediments.
Previous attempts to develop the kaolinized sediment resources contained in the
Whitemud Formation have concentrated on the potential for production of kaolin for
paper coating and filler applications. All of the prior development attempts have been
unsuccessful. WRI has conducted test work on beneficiation of the kaolinized sediments
to recover kaolin, and on production of metakaolin from the kaolin. Test results have
been highly encouraging. Technical studies of the performance of the metakaolin in
various cement, concrete mix, and oilwell cementing designs indicate the product can
provide performance improvements comparable to competing metakaolin products and to
alternative SCMs such as silica fume and fly ash.
Market research analysis indicates the potential for WRI to develop a significant
business. WRI is proposing to construct a mine and processing plant for the production
of metakaolin. The plant will have an initial capacity of 200,000 tpa (Phase I), with
provision for expansion to 350,000 tpa metakaolin by the end of Year 4 (Phase II) of
operations and to 700,000 tpa by Year 7.
The evaluation and development of an industrial mineral property is similar to that of
a conventional “Mineral Property” but also requires the additional scrutiny of the
guideline set out in the “Estimation of Mineral Resources and Mineral Reserves Best
Practice Guidelines” adopted by CIM Council on November 23, 2003, in the part which
deals with industrial minerals. The guidelines define an industrial mineral as “any rock,
mineral or other naturally occurring substance of economic value, exclusive of metallic
ores, mineral fuels and gemstones; that is one of the non-metallic minerals”. It further
states, “Before a tonnage and quality and/or value per tonne estimate of an industrial
mineral deposit can be classified as a mineral resource, the qualified person preparing the

SCOTT WILSON RPA www.scottwilson.com www.scottwilsonmining.com
2-3
tonnage and quality estimate must recognize that there is a viable market for the product
or that a market can be reasonably developed”.
SOURCES OF INFORMATION The terms of reference of the technical report called for the following:
• Site visit to the property and inspection of drill core • Independent sampling and analysis of drill core • Review of historical data such as drill logs, assay reports, maps, technical
reports and other data respecting the geology and mineralogy of the deposits, • Review of current technical work by WRI with respect to mineralogy,
chemistry and particle size data for the kaolinized sediments and kaolin product,
• Review of pilot plant beneficiation data, • Review of test data related to performance of metakaolin in various cement
and concrete mix designs, • Review of market analysis data developed by WRI and independent
consultants, • Review of engineering design data for the proposed production plant and
capital cost estimates, • Review of environmental reports related to development of the Gollier Creek
deposits and the proposed mine and production plant; and • Development and review of operating cost estimates for the proposed mine
and processing plant.
Initial discussions with WRI and data review were conducted by Scott Wilson RPA in
October 2005. Mr. Donald H. Hains, P.Geo., Associate Geologist with Scott Wilson
RPA, visited the Gollier Creek deposits and carried out inspection of drill core held at the
Saskatchewan Department of Industry and Resources Subsurface Geological Laboratory
on November 25-26, 2005. A second site visit to examine the 2006 exploration program
was made on August 8, 2006. Mr. Hains made a site visit on December 17, 2007, to
inspect progress on plant construction and mine development, and review the 2007
drilling program.
This Technical Report was prepared by Mr. Hains. Computer modelling of the
resource and mine plan was prepared by John Boyce, P. Eng., Systems Specialist with
Scott Wilson RPA. Development of the mine cost and financial analysis models was the
SCOTT WILSON RPA www.scottwilson.com www.scottwilsonmining.com
2-4
responsibility of James W. Hendry, P. Eng., Consulting Mining Engineer with Scott
Wilson RPA. The mine design, production plans and economic analysis are based on a
reasonable estimate of potential markets. Letters indicating intent to purchase WRI’s
products have been received from potential customers. In aggregate, the volumes
specified in these letters account for 80% of the initial proposed production capacity of
the mine and plant. The PFS assumes that full capacity utilization will be achieved
within the projected time frame of seven years from plant start-up. The mine design of
the PFS is based on a Measured Mineral Resource.
Discussions were held with WRI personnel as follows:
Kelly Babichuk, P. Eng., President and Chief Operating Officer Lynn Kelley, P. Geo., Manager, Geology and Exploration Chris Gagnon, P. Eng., Vice President, Manufacturing Robin Phinney, P. Eng., Vice President, Engineering J. Robert Martin, Vice President, Logistics Kevin J. Graham, Vice President, Marketing Ron Love, CA, Vice President and CFO Burl Aycock, Chief Executive Officer
The documentation reviewed, and other sources of information, are listed at the end
of this report in Item 21, References.
DEFINITIONS OF TERMS The terms “mineral property”, “mineral resource”, “mineral reserve” are as defined
by CIM Standards on Mineral Resources and Reserves adopted by CIM Council on
December 11, 2005 (CIM definitions). These definitions may be amended by CIM from
time to time, and are included by reference in NI 43-101.
Other terms used in this report are as follows:
• Binary Blended Hydraulic Cement: a product obtained by blending Portland cement and a single supplementary cementing material or by intergrinding Portland cement clinker, and a single supplementary cementing material to which the various forms of calcium sulphate, limestone, water and processing additions may be added.

SCOTT WILSON RPA www.scottwilson.com www.scottwilsonmining.com
2-5
• Blended Hydraulic Cement: a product consisting of: the blending of Portland cement and one or more of granulated blast furnace slag, fly ash or silica fume; or the intergrinding of Portland cement clinker and one or more of granulated blast furnace slag, fly ash, or silica fume to which the various forms of calcium sulphate, limestone, water, and processing additions may be added at the option of the manufacturer.
• Cemetitious Material: Portland cement, blended hydraulic cement,
supplementary cementing materials, masonry cement, and mortar cement, for example, used as binders to make concrete or mortar.
• Fly Ash: the finely divided residue that results from the combustion of
pulverized coal and that is carried from the combustion chamber of a furnace by exhaust gases. Fly ash is classified in Canada as F, CI, or CH by its calcium oxide content. Fly ash can be used as a pozzolan or cementing material in concrete.
• Granulated Blast Furnace Slag: the glassy granular material formed when
molten blast furnace slag is rapidly chilled. Granulation may be achieved by immersing the molten slag in water, by the pelletizing process, or by other satisfactory methods that will ensure a high percentage of glass or vitrification. This may be accomplished in the initial melt or after remelting air-cooled slag. Small percentages of silica or alumina may be added while the slag is molten to enhance desired characteristics.
• Ground Granulated Blast Furnace Slag: a product resulting from grinding
granulated blast furnace slag to which the various forms of calcium sulphate, water, and processing additions may be added at the option of the manufacturer.
• High Performance Concrete: a concrete mix typically having a compressive
strength at 28 days curing time in excess of 50 MPa. Other properties of high performance concrete generally include low chloride ion permeability and rapid compressive and flexural strength development to permit form-stripping within 12 to 48 hours of placement.
• Kaolinized Sediment (Ksd): a mixture of silica sand (quartz) loosely
cemented by a clay-feldspar mix consisting of kaolin, micas, altered and unaltered feldspars, and trace amounts of illite and smectite clays. The host ore for the kaolin.
• Kaolin: a white, soft plastic clay composed mainly of the fine-grained platy
mineral kaolinite; a white hydrous aluminum silicate, Al2Si2O5(OH)4 with a nominal composition of 39.50% Al2O3, 46.55% SiO2, 13.96% H2O. Kaolinite is quite soft and occurs as extremely fine hexagonal-shaped crystals of micron and sub-micron size. Commercial-grade kaolin is rarely pure kaolinite but an

SCOTT WILSON RPA www.scottwilson.com www.scottwilsonmining.com
2-6
admixture of kaolinite with quartz and feldspar. The chemical composition of commercial-grade kaolin can vary as much as ±2% to 3% in terms of alumina and silica from the theoretical kaolinite composition.
• Metakaolin: an amorphous aluminosilicate material produced by the
controlled calcination of kaolin clay at temperatures ranging from approximately 6500C to 8500C. The reaction can be represented as: 2Al2Si2O5(OH)4 2Al2Si2O7 + H2O. The calcination temperature is a function of the degree of crystallinity of the kaolin and the chemical composition of the kaolin.
• Pozzolan: a siliceous or alumino-siliceous material, which, in finely divided
form and in the presence of moisture, chemically reacts at ordinary temperatures with calcium hydroxide, released by the hydration of Portland cement, to form compounds possessing cementing properties.
• Portland Cement: a product obtained by pulverizing clinker consisting
essentially of hydraulic calcium silicates to which various forms of calcium sulphate, limestone, water, and processing additions may be added at the option of the manufacturer.
• Silica Fume: the finely divided residue, resulting from the production of
silicon, ferro-silicon, or other silicon-containing alloys, that is carried from the burning area of the furnace by exhaust gases. Silica fume is commonly used as a pozzolan in concrete, and especially in high-performance concrete.
• Supplementary Cementing Material: a material that, when used in
conjunction with Portland cement, contributes to the properties of the hardened concrete through hydraulic or pozzolanic activity, or both.
• Ternary Blended Hydraulic Cement: a product obtained either by blending
Portland cement and a combination of any two SCMs, or by intergrinding Portland cement clinker and a combination of any two SCMs to which various forms of calcium sulphate, limestone, water, and processing additions may be added.

SCOTT WILSON RPA www.scottwilson.com www.scottwilsonmining.com
2-7
LIST OF ABBREVIATIONS Units of measurement used in this report conform to the SI (metric) system. All
currency in this report is Canadian dollars (C$) unless otherwise noted.
µ micron kPa kilopascal °C degree Celsius kVA kilovolt-amperes °F degree Fahrenheit kW kilowatt µg microgram kWh kilowatt-hour A ampere L litre a annum L/s litres per second bbl barrels m metre Btu British thermal units M mega (million) C$ Canadian dollars m2 square metre cal calorie m3 cubic metre cfm cubic metres per minute min minute cm centimetre MASL metres above sea level cm2 square centimetre mm millimetre d day mph miles per hour dia. diameter MVA megavolt-amperes dmt dry metric tonne MW megawatt dwt dead-weight ton MWh megawatt-hour ft foot m3/h cubic metres per hour ft/s foot per second opt, oz/st ounce per short ton ft2 square foot oz Troy ounce (31.1035g) ft3 cubic foot oz/dmt ounce per dry metric tonne g gram ppm part per million G giga (billion) psia pound per square inch absolute Gal Imperial gallon psig pound per square inch gauge g/L gram per litre RL relative elevation g/t gram per tonne s second gpm Imperial gallons per minute st short ton gr/ft3 grain per cubic foot stpa short ton per year gr/m3 grain per cubic metre stpd short ton per day hr hour t metric tonne ha hectare tpa metric tonne per year hp horsepower tpd metric tonne per day in inch US$ United States dollar in2 square inch USg United States gallon J joule USgpm US gallon per minute k kilo (thousand) V volt kcal kilocalorie W watt kg kilogram wmt wet metric tonne km kilometre yd3 cubic yard km/h kilometre per hour yr year km2 square kilometre

SCOTT WILSON RPA www.scottwilson.com www.scottwilsonmining.com
3-1
3 RELIANCE ON OTHER EXPERTS This report has been prepared by Scott Wilson Roscoe Postle Associates Inc. (Scott
Wilson RPA) for Whitemud Resources Inc. (WRI). The information, conclusions,
opinions, and estimates contained herein are based on:
• Information available to Scott Wilson RPA at the time of preparation of this report,
• Assumptions, conditions, and qualifications as set forth in this report, and • Data, reports, and other information supplied by WRI and other third party
sources. For the purpose of this report, Scott Wilson RPA has relied on ownership information
provided by WRI. Scott Wilson RPA has not researched property title or mineral rights
for the WRI property and expresses no opinion as to the ownership status of the property.
Scott Wilson RPA has relied on other third party sources as follows:
• Process design review, mass and energy balance verification and process operating cost estimate review - Consultec Ltd.
• Project capital cost estimate – Hatch Energy • Process metallurgical test work and equipment evaluation – Alstom Power,
Hosakawa America, FFE Minerals • Raw material evaluation and quality – Haydn Murray & Associates • Product testing and evaluation – AMEC, EBA Engineering, CANMET, CTL
Group • Environmental assessment and permitting – Clifton Associates Ltd. • Geological core logging and sampling – Chris Curry, P. Geo. • Market research – FracRite Services Ltd., CTL Group, J.R Bickley Consultants,
CSI Technologies
Except for the purposes legislated under provincial securities laws, any use of this
report by any third party is at that party’s sole risk.

SCOTT WILSON RPA www.scottwilson.com www.scottwilsonmining.com
4-1
4 PROPERTY DESCRIPTION AND LOCATION The Project is located in southern Saskatchewan, centered south of Assiniboia and
approximately nine kilometres east of the Town of Wood Mountain (Figure 4-1), in the
Rural Municipality of Old Post.
Kaolinized resources are held under 43 quarry leases totalling 9,405.26 ha (23,231
acres) in five major parcels, and as an exploration permit totaling 2,027.94 ha (5,009.0
acres) as detailed in Table 4-1 and illustrated in Figures 4-2 and 4-3. All properties are
currently in good standing to the indicated renewal dates.
WRI has applied for quarry leases to cover the eastern extension of the Elm Springs
deposit. Approval of these leases is anticipated by the end of March 2008. WRI has also
applied for conversion of Quarry Prospecting Permit 144 to a Quarry Lease. This is
anticipated to be effective March 31, 2008.
The primary focus of the present work is W½ Sec. 17-5-2 W3M and SE ¼ Sec. 18-5-
2 W3M (West Pit area). These areas are proposed to be the first developed for mine
operations and for the proposed processing plant location. The Company has acquired
surface rights or holds options to acquire surface rights on all parcels required for mining
the West Pit. The property has not been subject to a legal survey. However, all land
parcels held by WRI are referenced to the Dominion Land Survey. Quarry Lease Y6176-
R5 is held by IXL Industries Ltd. (IXL). This lease covers 5.66 ha of riparian habitat
setback and does not affect mine operations. WRI has secured mineral and surface leases
for the road allowance between Sec. 17 and 18 from RM 43, Old Post.
The quarry rights which include the right to mine clay, kaolin and silica sand are held
under Saskatchewan Quarry Regulations, 1957. The term of quarry leases is not more
than 21 years, but leases are typically granted in five-year terms, with five year renewals
upon application being secure, provided that all reporting and rental payments have been

SCOTT WILSON RPA www.scottwilson.com www.scottwilsonmining.com
4-2
received on a timely basis. The exploration permit expires in March 2008 and will be
brought to lease at that time.
No surface rights are granted with the mineral rights under the Saskatchewan Quarry
Regulations, 1957. However, the registered owner of the minerals may not be
unreasonably denied access by the owner of the surface rights. The Saskatchewan Quarry
Regulations, 1957 contain provisions for an arbitration process to settle disputes between
the mineral owner and the surface owner. WRI owns the surface outright at the SE
quarter of 17, SW quarter 17, and the SE and SW quarter of 18, T5, R2, W3M. This
covers the initial opening and first several years of mining of the Gollier Creek West Pit.
WRI has an option to purchase essentially all the land required for mining of the West
Pit. The surface landowners from whom WRI acquired the surface rights have been
granted a right to repurchase the land after it has been mined and reclaimed for one
dollar.
There are no specific work obligation requirements for leases under the Saskatchewan
Quarry Regulations, 1957, beyond reporting production, if any, paying royalties if there
is production and paying annual rentals of $2 per acre. Quarry prospecting permits
require a deposit of $500 which is returned upon submission of satisfactory exploration
work. The royalty is $0.05 per cubic yard of raw material. WRI’s ore bulk density of 2.01
tonnes per cubic metre converted for the purpose of calculating royalties is 1.535 tonne
per cubic yard. Therefore, it is estimated that WRI would pay a royalty of approximately
$0.03 on each metric tonne mined, or about $0.10 per tonne of product.
Maintenance of mineral rights requires rental payments and submission of production
reports quarterly, and payment of royalty payments if applicable. There are no
encumbrances attached to the leases, nor have there been any environmental liabilities
identified with any of WRI’s holdings.

BLOCK & NTS
LOCATIONQUARRYING LEASE NO.
LEASE DATE
EFFECTIVE DATE
RENTAL DATE
RENTAL AMOUNT
GROSS ACREAGE
EXPIRY DATE LEGAL DESCRIPTION SUBSTANCE LESSOR LESSEE* / WI OWNERS ROYALTY
M00 1 Y-7808 27-Apr-05 05-Apr-05 05-Apr $160.00 80 05-Apr-10 T5 R2 W3M Sec 17 Lsd's 5, 6Clay, Kaolin, Silica Sand
Minister of Industry and Resources for Saskatchewan Whitemud Resources Inc.* 100% Sask Crown
M00 2 Y-7809 27-Apr-05 05-Apr-05 05-Apr $320.00 160 05-Apr-10 T5 R2 W3M Sec 20SWClay, Kaolin, Silica Sand
Minister of Industry and Resources for Saskatchewan Whitemud Resources Inc.* 100% Sask Crown
M00 3 Y-7810 27-Apr-05 05-Apr-05 05-Apr $480.00 240 05-Apr-10 T5 R2 W3M Sec 18NW, Lsd's 7, 8Clay, Kaolin, Silica Sand
Minister of Industry and Resources for Saskatchewan Whitemud Resources Inc.* 100% Sask Crown
M00 4 Y-7811 06-Jun-05 28-Apr-05 28-Apr $1,092.00 546 28-Apr-10
T5 R2 W3M Sec 17 excluding lands covered by Quarry Lease No's Y-6175
and Y-7808Kaolin, Clay, Silica Sand
Minister of Industry and Resources for Saskatchewan Whitemud Resources Inc.* 100% Sask Crown
M00 5 Y-7812 06-Jun-05 28-Apr-05 28-Apr $800.00 400 28-Apr-10 T5 R2 W3M Sec 18W, Lsd's 1, 2Kaolin, Clay, Silica Sand
Minister of Industry and Resources for Saskatchewan Whitemud Resources Inc.* 100% Sask Crown
M00 6 Y-7813 06-Jun-05 28-Apr-05 28-Apr $960.00 480 28-Apr-10 T5 R2 W3M Sec 20SE, NKaolin, Clay, Silica Sand
Minister of Industry and Resources for Saskatchewan Whitemud Resources Inc.* 100% Sask Crown
M00 7 Y-7814 06-Jun-05 28-Apr-05 28-Apr $1,280.00 640 28-Apr-10 T5 R2 W3M Sec 19Kaolin, Clay, Silica Sand
Minister of Industry and Resources for Saskatchewan Whitemud Resources Inc.* 100% Sask Crown
M00 8 Y-7815 06-Jun-05 28-Apr-05 28-Apr $1,272.00 636 28-Apr-10 T5 R2 W3M Sec 29Kaolin, Clay, Silica Sand
Minister of Industry and Resources for Saskatchewan Whitemud Resources Inc.* 100% Sask Crown
M00 9 Y-7816 06-Jun-05 28-Apr-05 28-Apr $1,280.00 640 28-Apr-10 T5 R2 W3M Sec 30Kaolin, Clay, Silica Sand
Minister of Industry and Resources for Saskatchewan Whitemud Resources Inc.* 100% Sask Crown
M00 10 Y-7817 06-Jun-05 28-Apr-05 28-Apr $1,280.00 640 28-Apr-10 T5 R2 W3M Sec 31S, 32SKaolin, Clay, Silica Sand
Minister of Industry and Resources for Saskatchewan Whitemud Resources Inc.* 100% Sask Crown
M00 18 Y-7825 06-Jun-05 28-Apr-05 28-Apr $1,280.00 640 28-Apr-10 T5 R3 W5M Sec 25E, 36SKaolin, Clay, Silica Sand
Minister of Industry and Resources for Saskatchewan Whitemud Resources Inc.* 100% Sask Crown
M00 19 Y-7826 06-Jun-05 28-Apr-05 28-Apr $1,280.00 640 28-Apr-10 T5 R3 W3M Sec 24Kaolin, Clay, Silica Sand
Minister of Industry and Resources for Saskatchewan Whitemud Resources Inc.* 100% Sask Crown
M00 38 Y-7862 05-Feb-07 05-Feb-07 $1,280.00 640 05-Feb-12T5 R2 W3M Sec 32N T6
R2 W3M Sec 5SKaolin, Clay, Silica Sand
Minister of Industry and Resources for Saskatchewan Whitemud Resources Inc.* 100% Sask Crown
M00 39 Y-7863 05-Feb-07 05-Feb-07 $1,280.00 640 05-Feb-12T5 R2 W3M Sec 33N T6 R2 W3M Sec 4S
Kaolin, Clay, Silica Sand
Minister of Industry and Resources for Saskatchewan Whitemud Resources Inc.* 100% Sask Crown
M00 40 Y-7864 05-Feb-07 05-Feb-07 $1,280.00 640 05-Feb-12T5 R2 W3M Sec 34N T6 R2 W3M Sec 3S
Kaolin, Clay, Silica Sand
Minister of Industry and Resources for Saskatchewan Whitemud Resources Inc.* 100% Sask Crown
M00 41 Y-7865 05-Feb-07 05-Feb-07 $1,280.00 640 05-Feb-12 T6 R2 W3M Sec 4N, 9SKaolin, Clay, Silica Sand
Minister of Industry and Resources for Saskatchewan Whitemud Resources Inc.* 100% Sask Crown
M00 42 Y-7866 05-Feb-07 05-Feb-07 $1,280.00 640 05-Feb-12 T6 R2 W3M Sec 3N, 10SKaolin, Clay, Silica Sand
Minister of Industry and Resources for Saskatchewan Whitemud Resources Inc.* 100% Sask Crown
M00 43 Y-7867 05-Feb-07 05-Feb-07 $1,280.00 640 05-Feb-12T6 R2 W3M Sec 35NW
T6 R2 W3M Sec 2W, 11SWKaolin, Clay, Silica Sand
Minister of Industry and Resources for Saskatchewan Whitemud Resources Inc.* 100% Sask Crown
Subtotal Gollier Creek
$19,164.00 9582
Whitemud Resources Inc. – Gollier Creek Kaolin ProjectTABLE 4-1 MINERAL LEASE HOLDINGS
WHITEMUD FILE NO.
Gollier Creek (NTS72G08)
SCO
TT
WIL
SON
RPA
www.scottwilson.com
www.scottwilsonm
ining.com
4-3

BLOCK & NTS
LOCATIONQUARRYING LEASE NO.
LEASE DATE
EFFECTIVE DATE
RENTAL DATE
RENTAL AMOUNT
GROSS ACREAGE
EXPIRY DATE LEGAL DESCRIPTION SUBSTANCE LESSOR LESSEE* / WI OWNERS ROYALTY
WHITEMUD FILE NO.
M00 13 Y-7820 06-Jun-05 28-Apr-05 28-Apr $1,280.00 550 28-Apr-10 T5 R3 W3M Sec 27SKaolin, Clay, Silica Sand
Minister of Industry and Resources for Saskatchewan Whitemud Resources Inc.* 100% Sask Crown
M00 14 Y-7821 06-Jun-05 28-Apr-05 28-Apr $1,280.00 640 28-Apr-10 T5 R3 W3M Sec 22Kaolin, Clay, Silica Sand
Minister of Industry and Resources for Saskatchewan Whitemud Resources Inc.* 100% Sask Crown
M00 15 Y-7822 06-Jun-05 28-Apr-05 28-Apr $1,280.00 640 28-Apr-10 T5 R3 W3M Sec 15Kaolin, Clay, Silica Sand
Minister of Industry and Resources for Saskatchewan Whitemud Resources Inc.* 100% Sask Crown
M00 16 Y-7823 06-Jun-05 28-Apr-05 28-Apr $1,272.00 636 28-Apr-10 T5 R3 W3M Sec 28SE, 21E, 16NEKaolin, Clay, Silica Sand
Minister of Industry and Resources for Saskatchewan Whitemud Resources Inc.* 100% Sask Crown
M00 17 Y-7824 06-Jun-05 28-Apr-05 28-Apr $956.00 478 28-Apr-10 T5 R3 W5M Sec 26SW, 23WKaolin, Clay, Silica Sand
Minister of Industry and Resources for Saskatchewan Whitemud Resources Inc.* 100% Sask Crown
M00 34 Y-7857 05-Feb-07 05-Feb-07 $638.00 319 05-Feb-12 T5 R3 W3M Sec 23EKaolin, Clay, Silica Sand
Minister of Industry and Resources for Saskatchewan Whitemud Resources Inc.* 100% Sask Crown
M00 35 Y-7858 05-Feb-07 05-Feb-07 $1,276.00 638 05-Feb-12 T5 R3 W3M Sec 25W, 26EKaolin, Clay, Silica Sand
Minister of Industry and Resources for Saskatchewan Whitemud Resources Inc.* 100% Sask Crown
M00 36 Y-7859 05-Feb-07 05-Feb-07 $954.00 477 05-Feb-12 T5 R3 W3M Sec 26NW, 35SKaolin, Clay, Silica Sand
Minister of Industry and Resources for Saskatchewan Whitemud Resources Inc.* 100% Sask Crown
M00 37 Y-7861 05-Feb-07 05-Feb-07 $1,272.00 636 05-Feb-12 T5 R3 23M Sec 34Kaolin, Clay, Silica Sand
Minister of Industry and Resources for Saskatchewan Whitemud Resources Inc.* 100% Sask Crown
Subtotal Wood
Mountain$10,208.00 5014
M00 11 Y-7818 06-Jun-05 28-Apr-05 28-Apr $1,280.00 640 28-Apr-10 T5 R4 W3M Sec 25Kaolin, Clay, Silica Sand
Minister of Industry and Resources for Saskatchewan Whitemud Resources Inc.* 100% Sask Crown
M00 21 Y-7828 20-Jun-05 20-May-05 20-May $962.00 481 20-May-10 T5 R3 W3M Sec 30S, NWKaolin, Clay, Silica Sand
Minister of Industry and Resources for Saskatchewan Whitemud Resources Inc.* 100% Sask Crown
M00 22 Y-7829 20-Jun-05 20-May-05 20-May $1,280.00 640 20-May-10T5 R3 W3M Sec 19N T5 R4 W3M Sec 24N
Kaolin, Clay, Silica Sand
Minister of Industry and Resources for Saskatchewan Whitemud Resources Inc.* 100% Sask Crown
M00 23 Y-7830 20-Jun-05 20-May-05 20-May $960.00 480 20-May-10 T5 R4 W3M Sec 26E, 35SEKaolin, Clay, Silica Sand
Minister of Industry and Resources for Saskatchewan Whitemud Resources Inc.* 100% Sask Crown
Subtotal Waverley $4,482.00 2241
Wood Mountain
(NTS72G08)
Waverley (NTS72G08)
SCO
TT
WIL
SON
RPA
www.scottwilson.com
www.scottwilsonm
ining.com
4-4

BLOCK & NTS
LOCATIONQUARRYING LEASE NO.
LEASE DATE
EFFECTIVE DATE
RENTAL DATE
RENTAL AMOUNT
GROSS ACREAGE
EXPIRY DATE LEGAL DESCRIPTION SUBSTANCE LESSOR LESSEE* / WI OWNERS ROYALTY
WHITEMUD FILE NO.
M00 12 Y-7819 06-Jun-05 28-Apr-05 28-Apr $636.00 318 28-Apr-10T5 R4 W3M Sec 6SW T5 R5 W3M Sec 1SE
Kaolin, Clay, Silica Sand
Minister of Industry and Resources for Saskatchewan Whitemud Resources Inc.* 100% Sask Crown
M00 25 Y-7847 11-Sep-06 28-Jul-06 28-Jul $1,280.00 640 28-Jul-11 T5 R4 W3M Sec 15S, 16SKaolin, Clay, Silica Sand
Minister of Industry and Resources for Saskatchewan Whitemud Resources Inc.* 100% Sask Crown
M00 26 Y-7848 11-Sep-06 28-Jul-06 28-Jul $640.00 320 28-Jul-11 T5 R4 W3M Sec 9NKaolin, Clay, Silica Sand
Minister of Industry and Resources for Saskatchewan Whitemud Resources Inc.* 100% Sask Crown
M00 27 Y-7850 05-Feb-07 05-Feb-07 $640.00 320 05-Feb-12 T5 R4 W3M Sec 10NKaolin, Clay, Silica Sand
Minister of Industry and Resources for Saskatchewan Whitemud Resources Inc.* 100% Sask Crown
M00 28 Y-7851 05-Feb-07 05-Feb-07 $960.00 480 05-Feb-12 T5 R4 W3M Sec 9SKaolin, Clay, Silica Sand
Minister of Industry and Resources for Saskatchewan Whitemud Resources Inc.* 100% Sask Crown
M00 29 Y-7852 05-Feb-07 05-Feb-07 $1,280.00 640 05-Feb-12 T5 R4 W3M Sec 16NKaolin, Clay, Silica Sand
Minister of Industry and Resources for Saskatchewan Whitemud Resources Inc.* 100% Sask Crown
M00 30 Y-7853 05-Feb-07 05-Feb-07 $1,280.00 640 05-Feb-12 T5 R4 W3M Sec 21N, Sec 28SKaolin, Clay, Silica Sand
Minister of Industry and Resources for Saskatchewan Whitemud Resources Inc.* 100% Sask Crown
M00 31 Y-7854 05-Feb-07 05-Feb-07 $1,280.00 640 05-Feb-12 T5 R4 W3M Sec 28N, 29NKaolin, Clay, Silica Sand
Minister of Industry and Resources for Saskatchewan Whitemud Resources Inc.* 100% Sask Crown
M00 32 Y-7855 05-Feb-07 05-Feb-07 $1,280.00 640 05-Feb-12 T5 R4 W3M Sec 17NE, 20E, 29SEKaolin, Clay, Silica Sand
Minister of Industry and Resources for Saskatchewan Whitemud Resources Inc.* 100% Sask Crown
M00 33 Y-7856 05-Feb-07 05-Feb-07 $960.00 480 05-Feb-12 T5 R4 W3M Sec 8E, 17SEKaolin, Clay, Silica Sand
Minister of Industry and Resources for Saskatchewan Whitemud Resources Inc.* 100% Sask Crown
Subtotal Project 12 $10,236.00 5118
M00 20 Y-7827 06-Jun-05 28-Apr-05 28-Apr $1,280.00 640 28-Apr-10 T6 R20 W3M Sec 2W, 3EKaolin, Clay, Silica
Sand
Minister of Industry and Resources for Saskatchewan Whitemud Resources Inc.* 100% Sask Crown
M00 24 Y-7831 20-Jun-05 20-May-05 20-May $1,272.00 636 20-May-10 T6 R2 W3M Sec 28W, 29EKaolin, Clay, Silica Sand
Minister of Industry and Resources for Saskatchewan Whitemud Resources Inc.* 100% Sask Crown
Subtotal Eastend $2,552.00 1276
Total 43 $46,642.00 23,231
Project 12 (NTS 72G07
& NTS 72G08)
Eastend (NTS72F07)
SCO
TT
WIL
SON
RPA
www.scottwilson.com
www.scottwilsonm
ining.com
4-5

N
January 2008 Source: Whitemud Resources Inc., 2006.
SCOTT WILSON RPA www.scottwilson.comwww.scottwilsonmining.com
Whitemud Kaolin Project
Location Map
Whitemud Resources Inc.
Saskatchewan, Canada
Figure 4-1
4-6

N
January 2008 Source: Whitemud Resources Inc., 2006.
Whitemud Kaolin Project
2006 Dispositions
Whitemud Resources Inc.
Saskatchewan, Canada
Figure 4-2
4-7
SC
OT
TW
ILS
ON
RP
Aw
ww
.scottw
ilson
.com
ww
w.sco
ttwilso
nm
inin
g.co
m

0 2 10
Kilometres
4 6 8
N
Quarry Leases - December 2006
Legend:
Quarry Leases Applications, Dec. 2007
Quarry Leases - December 2007
Processing Plant
Areas included in2006 Resource Inventory
Areas added toDec. 2007 Resource Inventory
Village of Wood Mountain
Abandoned Rail
Major Highways
January 2008
Township grid at six mile intervals
Source: Whitemud Resources Inc., 2008.
Whitemud Kaolin Project
Mineral DispositionsWood Mountain Areaas of December 2007
Whitemud Resources Inc.
Saskatchewan, Canada
Figure 4-3
SC
OT
TW
ILS
ON
RP
A
4-8
ww
w.sco
ttwilso
n.co
mw
ww
.scottw
ilson
min
ing.co
m

SCOTT WILSON RPA www.scottwilson.com www.scottwilsonmining.com
5-1
5 ACCESSIBILITY, CLIMATE, LOCAL RESOURCES, INFRASTRUCTURE AND PHYSIOGRAPHY ACCESSIBILITY
Access to the property is provided by a series of provincial highways and secondary
municipal and rural roads. Primary access is via Highway 2 south from Assiniboia
approximately 25 km (15 miles), thence west on the Pickthall Grid Rd. approximately
13.3 km (8 miles), south on the Popescul Grid Rd. approximately 6.7 km (4 miles) and
west for 6.7 km on a farm access road. Access is also possible from Limerick and Wood
Mountain via Highway 358 and the farm access road, or from Highway 2 via Super Grid
No. 705. The farm road running east from the plant site to Scout Lake has been upgraded
by the rural municipality to handle heavy truck traffic. This road joins Highway 2 at
Scout Lake and is the principal truck haul route for movement of product from the plant
to the transload station at Scout Lake.
CLIMATE The Project is located in the semi-arid prairie region of south central Saskatchewan. It
is on the north flank of the Wood Mountain upland which places it a little above the
surrounding prairie. Assiniboia, about 35 air-km to the northeast of the Project site and at
elevation 723 m asl is the closest long term weather station. Climatic conditions at the
site can be expected to be similar to those at Assiniboia.
Average temperatures at Assiniboia range from -12.6oC in January to 18.6oC in July.
The lowest recorded temperature was -43.9oC on January 11, 1916, and the highest was
42.8oC on July 7, 1937.
Average annual precipitation is 396 mm, with 26% occurring as snow and 74%
occurring as rain. The four month period from May to August accounts for 57% of annual
precipitation.
SCOTT WILSON RPA www.scottwilson.com www.scottwilsonmining.com
5-2
LOCAL RESOURCES AND INFRASTRUCTURE The surrounding area is agricultural, with grain crops and ranching as the principal
activities. The nearest communities, Wood Mountain, Scout Lake and Flintoft, are quite
small and have limited facilities. Assiniboia, population 2,700, is the closest significant
community and contains a range of commercial and institutional services such as farm
equipment sales and repair, banks, schools, restaurants, and hardware stores.
Aside from the regional road network, CP Rail maintains a rail siding at Assiniboia
for loading grain. Fife Lake Railway operates a short line from Assiniboia to Coronach,
which passes through the village of Scout Lake, approximately 19 km east of the Project
site. Fife Lake Railway and Trimac Ltd. have developed a loadout facility and a rail
siding at Scout Lake for transloading of WRI’s products. Telecommunications is via
fixed line. Cellular telephone coverage in the area is weak, although plans are in place to
upgrade service coverage. Water supply is via wells. WRI has completed a water supply
well at the proposed Gollier Creek plant site. Electricity supply has been brought to the
plant site by Saskatchewan Power, and a natural gas line has been installed to the plant
site by the utility. Coal for kaolin calcination is available at Bienfait, Saskatchewan, or
Coronach, Saskatchewan
PHYSIOGRAPHY The Project area is characterized as prairie plateau incised by deep arroyos and creek
valleys with a generally northward orientation. The surface elevation of the plateau
ranges from approximately 800 m asl to approximately 830 m asl. Outcrop exposure of
the Whitemud Formation on the flanks of the creek valleys is generally excellent. Glacial
cover is generally thin (rarely > 3 m) and highly irregular. Glacial cover decreases toward
the southeast of the Project area. Most of the preglacial cover consists of partly
consolidated sands, silts, and clays of the Ravenscrag Formation.
The Project site lies within the Old Wives Lake Basin. Gollier Creek is the main
drainage system in the primary Project area, with Wood Mountain Creek acting as a
second major drainage area in the western part of the Project property. Gollier Creek

SCOTT WILSON RPA www.scottwilson.com www.scottwilsonmining.com
5-3
originates above elevation 975 m asl on the Wood Mountain upland approximately 10 km
southwest of the proposed Project location and discharges into Twelve Mile Lake at an
elevation of approximately 755 m asl approximately 10 km north of the proposed Project
site. Twelve Mile Lake drains into Lynthorpe Creek and thence successively to the Wood
River, Thomson Lake and eventually into Old Wives Lake, a closed basin with no outlet.
Both the Gollier Creek and Wood Mountain Creek drainages are wide, flat valleys
lying approximately 25 m below the surface of the plateau. The Gollier Creek drainage
basin is reported to be approximately 83 km2 (Clifton, 2006). Creek flow is sufficient for
livestock watering and domestic uses but not sufficient for large water demands. The
major runoff period is February to April, with occasional summer storm runoff. Water
flows are negligible after August. The median annual runoff is 8 mm (Clifton, 2006).
Sand units in the Ravenscrag Formation, the Whitemud Formation, and the
underlying Eastend Formation have sufficient hydraulic conductivity and porosity to be
low to moderate yielding sources of groundwater supply for domestic uses. There is a
general northeasterly groundwater gradient toward the Gollier Creek valley. Exploratory
bore holes within the proposed mine area indicate the water table lies approximately 20 m
to 25 m below the surface elevation. WRI has completed a water supply well, screened
across the Ravenscrag and Whitemud formations at the proposed plant site. A 24 hour
pump test indicated that sustained yields of 10 gpm from this well should be achievable.
The nearest domestic water wells are located approximately 1.5 km from the proposed
mine site.
VEGETATION AND WILDLIFE The Project area occurs in the Wood Mountain Plateau Landscape area in the mixed
Grassland Ecoregion of the Prairies Ecozone (Clifton, 2006). Vegetation in the Project
area primarily consists of rangeland and cropland. Native mixed-grass prairie occurs in
association with Tertiary quartzites and gravels of the plateaus and gullied lands. Surveys
conducted by Clifton Associates Ltd. (Clifton) for the Project Proposal submitted to the

SCOTT WILSON RPA www.scottwilson.com www.scottwilsonmining.com
5-4
Environmental Assessment Branch of Saskatchewan Environment reported the following
plant communities (Table 5-1):
TABLE 5-1 DOMINANT PLANT COMMUNITIES Whitemud Resources Inc. – Gollier Creek Kaolin Project
Plant Community Area (ha) % Cover1
Native Grassland 401.08 37.9 Cultivated Land 408.30 38.6 Tame Pasture 20.19 1.9 Shrubland 43.64 4.1 Riparian/Wetland 188.78 17.9 Marsh 1.19 0.1 Total 1, 057 101 1 some overlap exists between plant communities; therefore, percent cover is more than 100% Source: Clifton, 2006
The environmental assessment report prepared by Clifton identified six vascular
plants in the study area ranked as S3 (rare-uncommon) and one as S2 (rare) as listed in
the Saskatchewan Conservation Data Centre database (Table 5-2). None of the identified
plants were ranked as rare by the Committee on the Status of Endangered Wildlife in
Canada (COSEWIC).

SCOTT WILSON RPA www.scottwilson.com www.scottwilsonmining.com
5-5
TABLE 5-2 RARE PLANTS IN PROJECT AREA Whitemud Resources Inc. – Gollier Creek Kaolin Project
Scientific Name Common Name Prov./Global
Rank Number of Sites
Habitat
Aster pauciflorus Few-flowered aster S3/G4 5 Alkaline flats Astragalus lotiflorus
Low milk-vetch S3/G5 12 Dry slopes and prairie, gravelly or sandy hillsides, dune slicks in blowout areas; gravelly or sandy lakeshores. Grasslands and opening on dry soils.
Erigeron compositus
Compound fleabane S3?/G5 3 Eroded hillsides, badlands, and dry or gravelly ridges. High, dry butte; eroded cobbly slope
Hedeoma hispida
Rough pennyroyal S3/G5 5 Sandy soil, eroded slopes, and abandoned fields
Lesquerella alpine
Alpine bladderpod S2S3/G5 1 Dry hillsides and badlands. Dry slope of road cut, calcareous; E-facing mid-slope
Navarettia leucocephala ssp. Minima
Lesser navarettia S3/G4T? 1 Moist areas on plains. Bottomlands, sandy places, and slough margins
Plantago patagonica
Pursh’s plantain S3/G5 17 Sandy soil, river flats, and dry soils
Source: Clifton, 2006
The Project area includes sensitive wildlife habitat (native grassland and
riparian/wetland areas). Several rare animal and bird species could potentially occur
within the Project area, although only three species were definitively identified: northern
leopard frog, prairie falcon, and golden eagle. Of these, only the northern leopard frog
was noted as a resident. No nest sites for the prairie falcon or golden eagle were noted.
Northern leopard frogs were abundant along Gollier Creek, with both adults and froglets
being observed throughout the area.
Current Saskatchewan activity restrictions provide for a recommended setback of
500 m from ponds used by leopard frogs for breeding, living or hibernating when
conducting high impact activities such as mining and quarrying. As the proposed mine

SCOTT WILSON RPA www.scottwilson.com www.scottwilsonmining.com
5-6
site falls within this limit, special mitigative measures have been proposed by WRI and
accepted by Saskatchewan Environment. These measures will permit the mine to operate
within 50 m of the edge of the Gollier Creek valley.
Five fish species were noted in Gollier Creek, of which the brassy and fathead
minnows were most common. None of the fish species recorded are reported as rare or
endangered.
White sucker was the most common large bodied fish noted. A detailed survey of fish
habitat along Gollier Creek identified that only a small portion of the stream would be
suitable white sucker habitat (Table 5-3).
TABLE 5-3 GOLLIER CREEK AREA – POTENTIAL WHITE SUCKER HABITAT
Whitemud Resources Inc. – Gollier Creek Kaolin Project
Habitat Type Marginal Marginal to Moderate Moderate Highly Suitable
Spawning 0.6 % 0.4 % 0 0 Nursery/Rearing 0 0 8.9 % 0 Overwintering 7.9 % 0 0 0 Source: Clifton, 2006
ARCHAEOLOGICAL AND HISTORICAL RESOURCES Paleontological finds are known to occur in the Rock Creek badlands to the south of
the Project site. Specimens of petrified wood have been found on the Project site,
however, the site is not considered highly fossiliferous.
Archaeological sites of interest have been identified in the surrounding area, but none
in the immediate vicinity of the proposed plant site or within the 5 year mining area.
Additional surveys completed as part of the environmental assessment process identified
three sites beyond the five year mine area. These sites will be assessed as part of the
mine progression plan but do not affect any approvals required for mine development and
construction.

SCOTT WILSON RPA www.scottwilson.com www.scottwilsonmining.com
5-7
The immediate area of the proposed quarry has very low historical significance. Most
of the significant historical events have been located to the south of the Project area. The
Hudson Bay Company established an outpost of Fort Qu’Appelle at Wood Mountain and
the NWMP established Wood Mountain Post in 1874.
SUMMARY Table 5-4 summarizes the major identified environmental and socio-economic
impacts of the Project.
TABLE 5-4 SUMMARY OF SIGNIFICANT IMPACTS Whitemud Resources Inc. – Gollier Creek Kaolin Project
Neutral Impacts Negative Impacts Positive Impacts
Disturbance of cultivated land
Quarry seepage and depression of local water table
Creation of local ponds on upland
Permanent modification of topography of quarried land
Dust and wind erosion of tailings and reclaimed land
Reduction in net CO2 and Greenhouse Gases (GHG) generated from cement production
Disturbance of agricultural land
Disturbance of native grassland
Provision of employment in community
Disturbance of rare plants Support of local and regional businesses and institutions
Disturbance of sensitive wildlife habitat and disturbance of native animals
Improvements to transportation infrastructure
Source: Clifton, 2006
WRI has proposed several measures to mitigate any potential adverse impacts arising
from development of the Project. The potential environmental and socio-economic
impacts and proposed mitigation measures are described more fully in Item 18 of this
report.

SCOTT WILSON RPA www.scottwilson.com www.scottwilsonmining.com
6-1
6 HISTORY The Whitemud Formation occurs over an extensive area in southern Saskatchewan
and southeastern Alberta. In southeastern Alberta, outcrops of the formation are visible
along the north and south slopes of the Cypress Hills, on Eagle Butte and along both sides
of the Medicine Lodge Coulee. Further west, it outcrops in the Red Deer River Valley, at
Kneehill Creek and Threehills Creek and just north of the Bow River Valley. Outcrops
are also found at a location in Oldman River Valley. In Saskatchewan, the Whitemud
Formation occurs in two main outcrop areas. One is in the vicinity of Eastend (near the
Frenchman River) and the other is in the vicinity of Wood Mountain. In between, over a
distance of 150 km, the formation is absent.
The Formation was named “Whitemud” by N.B. Davis of the Mines Branch,
Dominion Bureau of Mines, in 1918. The name derives from the characteristic white
appearance of the outcrops which are visible high upon the sides of river valleys and are
excellent stratigraphic markers (Figure 6-1).

SCOTT WILSON RPA www.scottwilson.com www.scottwilsonmining.com
6-2
FIGURE 6-1 WHITEMUD FORMATION OUTCROP AT GOLLIER CREEK SITE
Note lignite band near top of outcrop. Whitemud Formation begins immediately below
Historically, material from the Whitemud Formation was used as whitewash and as
clay for local ceramic ware manufacturing. Formal geological exploration and
beneficiation studies of the potential of the kaolin resources in the Whitemud Formation
started after World War II. The focus of work since the late 1940s up to the recent
activity by WRI has been on development of the kaolin for paper applications.
Between 1948 and 1954, the Saskatchewan Department of Mineral Resources
conducted a program for drilling for industrial mineral resources. Several areas of
kaolinized sand and clay were identified and recorded. A pilot plant test was done by the
Saskatchewan Department of Mineral Resources in 1954 on samples collected in the
areas identified by the 1948-1954 program. The test work determined that considerable
beneficiation of the kaolin would be required before it could be used in paper coating or
filler applications (Master, 1985).
SCOTT WILSON RPA www.scottwilson.com www.scottwilsonmining.com
6-3
In 1960, the Eastend outcrops of the Whitemud Formation were examined by L.S.
Beck (unpublished report) specifically to determine their economic potential. “Huge
reserves of kaolin clays and kaolin sands” were reported by Beck (Master, 1985).
In 1965, a Ph.D. thesis by S.H. Whitaker dealt with the geology of the Eastend and
Wood Mountain areas, including the Whitemud Formation. Maps #5 and #22 of the
Saskatchewan Research Council summarize this work (Master, 1985). This work was
followed up in 1976 by test work by Steetley Research on the brightness of kaolinized
sands of the Wood Mountain area. The work indicated that oxidation and reduction
bleaching could improve the brightness of the kaolin, but insufficiently to render the
kaolin suitable for filler grade applications.
In the early 1980s, Ekaton Resources Ltd. (Ekaton) acquired prospecting rights over
an area from near the Alberta border east to Estevan. Ekaton was of the belief that new
beneficiation techniques and changing industry specifications for kaolin use in paper
could result in a potentially viable business based on exploitation of the kaolinized sands
of the Whitemud Formation.
In 1984-85, Ekaton conducted surface mapping and sampling and completed 113 drill
holes covering an area of 41,172 ha (101,696 acres) in the Eastend and Wood Mountain
regions. Holes were generally drilled at section corners on a one mile grid using a
combination of CRS rotary (mainly through overburden) and split tube core drilling
(primarily in kaolinized sediments). The holes were generally about 30 m (100 ft.) deep
for a total of 1,870.5 m (6,157 ft.) rotary and 905.9 m (2,982 ft.) core drilling. This work
identified the area with the best potential as being in the Wood Mountain region.
Ekaton prepared a preliminary resource estimation (non NI 43-101 compliant) based
on the results of the 1985 drilling and mapping program. This historical estimate assumed
an average thickness of kaolinized sediments of 6.1 m, an in-situ bulk density of 1.75,
and continuity between drill holes and outcrops. Areas less than 4.6 m in thickness were
excluded from the estimate. In developing the historical resource estimate, Master (1987)

SCOTT WILSON RPA www.scottwilson.com www.scottwilsonmining.com
6-4
reported that “insufficient outcrop and drill samples have been tested for kaolin content;
…, grade boundaries have not been located and the whole deposit has been treated as
having a single grade”. Using the assumptions noted, Ekaton prepared the following
resource estimate (Master, 1987):
TABLE 6-1 HISTORICAL RESOURCE ESTIMATE - EKATON PROPERTIES (Non 43-101 compliant)
Whitemud Resources Inc. – Gollier Creek Kaolin Project
Location Short Tons Kaolinized Sediments Total
Strip ratio 1:1 Strip Ratio 2:1 Strip Ratio 3:1
Waverley 64,480,875 64,480,875
Wood Mountain 120,218,579 15,846,994 20,765,078 156,830,651
Project 12 19,672,131 24,043,716 18,852,459 62,568,306
Gollier Creek 50,273,224 14,754,098 26,229,508 91,256,830
Total 254,644,809 54,644,808 65,847,045 375,136,662
Source: Master, 1987 Note: The historical resource estimate detailed above does not conform to the requirements of NI 43-101 and should not be relied upon. It is included here for historical information purposes only.
In 1987, Ekaton made another estimate of the resources in the Wood Mountain
deposits based on visual categorization of the kaolinized sediments as either “good” or
“medium” grade. An historical in-situ resource of 293.1 million tonnes as determined by
the frustum of pyramid formula was estimated. Similarly, Ekaton estimated a total of
62.77 million tonnes of in-situ resources having a stripping ratio of less than 1:1 at the
Eastend deposits.
Also in 1984, Ekaton took a 680 kg (1,500 lb) bulk sample of material from the
Project 12 area for beneficiation test work at the Saskatchewan Research Council in
Saskatoon. This work was designed to evaluate different separation methods to remove
the kaolin from the sand. Products from this work were sent to the Colorado School of
Mines Research Institute, Miles Industrial Minerals Research and Eriez Magnetics for
further work on magnetic separation and bleaching of the kaolin to improve brightness
and remove grit.

SCOTT WILSON RPA www.scottwilson.com www.scottwilsonmining.com
6-5
A scoping study for the production of filler and coating grades of kaolin was
completed by GPW & Associates for Ekaton in February, 1986. By the end of 1986,
Ekaton had spent $1.619 million on the Project. Ekaton was sufficiently encouraged by
the drill results and test work to undertake a second phase of work beginning in 1987.
This work, which was conducted in joint venture with Esso Resources Canada Inc.,
included another drilling program, isopach mapping, further beneficiation studies,
including the construction of a pilot plant near Regina and preliminary resource
calculations and preparation of a pre-feasibility study.
A total of 118 holes totalling 3,310.5 m (10, 897 ft.) were drilled in 1987, using a
combination of CSR and core drilling. These holes were generally drilled on a 1,000 m x
1,000 m or tighter grid, especially in the vicinity of Gollier Creek. Core was only
recovered from the kaolinized intersections and represented about 65% of total drilling. A
very large bulk sample, several thousand tonnes, was collected from a test pit at Gollier
Creek (Figure 6-2). This material provided the basis for an extensive program of test
work to develop a beneficiation process for recovery of high brightness filler and coating
grade kaolin. A further drill program of 13 drill holes was completed in August 1988. By
mid-1988, Ekaton had spent an additional $2.116 million on exploration and process
development work. Ekaton continued process development and material characterization
studies through 1989, but, by the end of 1989, had exhausted its funds and the company
was liquidated, with purchased land and equipment being sold.

SCOTT WILSON RPA www.scottwilson.com www.scottwilsonmining.com
6-6
FIGURE 6-2 GOLLIER CREEK TEST PIT
Kaolin Industries Limited (KIL) acquired the former Ekaton pilot plant equipment in
the early 1990s and began a new research program to produce paper grade kaolin. The
company extracted a new bulk sample of material from the Ekaton pit at Gollier Creek.
The work, which was conducted in 1992 and 1993 and summarized in a 1994 report,
reportedly resulted in a process to produce paper coating grade kaolin with reasonable
brightness (860 - 870 GE). KIL exhausted its funds in 1994 and the plant and equipment
were sold off.
Minfocus International Inc. (Minfocus) revisited the potential for the Gollier Creek
kaolin deposits in 1998 and 1999. In 1998, Minfocus obtained a Quarrying Permit
covering 696.36 ha (1,720 acres) in the Gollier Creek area covering all or portions of
Sections 17, 18, 19 and 20, Township 5, Range 2 W3M. Auger holes to 5 m depth were
drilled and samples of core from the Ekaton drill program obtained. Mineralogical work
on the core samples was undertaken by Dr. Haydn Murray of the University of Indiana to
characterize the material in terms of kaolin content, particle size distribution and other
parameters. This work concluded that the kaolin could not be economically beneficiated

SCOTT WILSON RPA www.scottwilson.com www.scottwilsonmining.com
6-7
to yield a marketable kaolin product for paper applications. Based on this result,
Minfocus relinquished its permits sometime in 1999.
In 2003, WRI was formed to examine the potential of the Gollier Creek – Wood
Mountain kaolin deposits for the production of metakaolin. WRI obtained permits to the
prime kaolinized areas identified by Ekaton, as well as the historical database of drill
logs, assays and test work, and began its own program of work to define the resource
potential of the deposits and design and develop a suitable process for manufacturing
metakaolin from the kaolin. The focus of the activity by WRI has been on the resources
contained within the Gollier Creek lease block (Figure 6-3).
FIGURE 6-3 GOLLIER CREEK PROPERTY 17-05-02 W3M (partial); 18-05-02 W3M (partial)
Note: Numbers indicate location of Ekaton drill holes

SCOTT WILSON RPA www.scottwilson.com www.scottwilsonmining.com
7-1
7 GEOLOGICAL SETTING The following description of the geological setting, regional and local geology of
WRI’s mineral properties is largely taken from Master (1987).
The subject properties are located to the north of the Wood Mountain Upland, which
forms the divide between the Old Wives Lake drainage basin to the north and the
Missouri River drainage basin to the south. To the south, topographic relief gradually
becomes more rugged into the Wood Mountain Upland. Major step-sided valleys, 15 to
90 m deep and up to five kilometres wide, occur in the area (Master, 1987). Twelve Mile
Lake occupies one such valley. It is a meltwater channel formed towards the close of the
last glaciation (Master, 1987). Gollier Creek and Wood Mountain Creek drain into
Twelve Mile Lake. Most bedrock exposures in WRI’s lease blocks occur along these
steep-sided channels.
Glacial drift cover is thin or absent. The western half of the Project area is covered by
hummocky moraines composed mainly of sand with minor amounts of till. The eastern
half of the area is bedrock upland with a thin veneer of glacial drift consisting of
relatively flat areas separated by deep, steep-sided drainage channels (Master, 1987)
REGIONAL GEOLOGY
The WRI mineral dispositions are along the main contact between Tertiary and Upper
Cretaceous rocks (Figure 7-1). Upper Cretaceous rocks represent most of the bedrock
exposures west of the contact, while the area to the east of the contact is underlain mainly
by Tertiary rocks, although large inliers of Upper Cretaceous rocks are located along
Lake of the Rivers, Willow Bunch Lake, and Big Muddy Lake valley. Strata generally
dip eastward toward the centre of the Williston Basin, but local folds cause deviations
from the regional trend.

SCOTT WILSON RPA www.scottwilson.com www.scottwilsonmining.com
7-2
The WRI properties are located a considerable distance south of known salt deposits
of the Middle Devonian Prairie Evaporite. Some salt-free areas were, geologically,
underlain by the Prairie Evaporite, and salt was removed by sub-surface solution. Some
portions of the salt may have been removed later in the Tertiary Period, following
deposition of the Ravenscrag Formation. In addition to the better known, large collapse
structures in the area, such as Hummingbird, evidence from Ekaton’s 1985 drilling
program suggests that localized features near Wood Mountain may also be due to post-
Whitemud (possibly post-Ravenscrag) salt removal and collapse.
STRUCTURE
The drilling work by Ekaton in the mid-to-late 1980s indicates that the regional dip of
the kaolinized sediments is generally eastward, being shallower in the more easterly
portion of the study area. The kaolinized sediments appear to be folded into four ridges,
viz. Project 12 Ridge, Waverly Ridge, Wood Mountain Ridge and Gollier Ridge. All of
these, except for the Gollier Ridge, trend east-northeast (Master, 1987).
The crests of the Project 12, Waverly and Wood Mountain Ridges lie between the
limits of the kaolinized sediments, indicating these crests were eroded off in post-
Whitemud, pre-Ravenscrag time. Structure-contour mapping of the top of the Lower
Eastend Formation or Upper Transition Zone (Figure 7-2) shows structural highs that
coincide fairly closely with the projected ridge crests on top of the kaolinized sediments
(Figure 7-3). Crests of the Waverly Ridge and Wood Mountain Ridge directly overlie a
prominent structural high with a similar coincidence under the Project 12 Ridge. The
relationship of the Gollier Ridge to the structure underneath appears to be similar
(Master, 1987).
The base of the Tertiary Ravenscrag Formation shows a generally northeasterly dip
and some degree of structural continuity with the top of the Whitemud Formation
kaolinized sediments.
Mapping of the Tertiary-Upper Cretaceous structure provides additional information
on the development of the Whitemud Formation. Assuming the zone between the

SCOTT WILSON RPA www.scottwilson.com www.scottwilsonmining.com
7-3
Ravenscrag and Whitemud or Lower Eastend Formation is the Frenchman Formation, the
kaolinized sediments appear to be of fairly uniform thickness wherever they are
encountered and may at one time have been fairly continuous. A later major deformation,
probably before the Tertiary Period, created several ridges in the Upper Cretaceous
formations. The Whitemud sediments at the crests of the ridges were stripped off prior to
deposition of the Ravenscrag. Thus, the existing deposits of the Whitemud and Upper
Eastend kaolinized sediments are remnants, preserved on the flanks of these ridges.
Isopachs of the kaolinized sediments indicate they are thinner towards the projected
crests of the ridges, a result of differential erosion between the crests and the more
protected flanks of the ridges (Master, 1987).
It is not known if the Tertiary Ravenscrag sediments were also involved in this
deformation and erosion process, primarily because consistent data about the structure of
the Ravenscrag Formation was not recorded during the Ekaton drilling programs of the
mid-to-late 1980s. The Frenchman Formation appears to wedge out eastwards on the
original Ekaton permits, and the Ravenscrag directly overlies the Whitemud and Lower
Eastend Formations in the south and east (Master, 1987)

January 2008
Source: Whitemud Resources Inc., 2006.
Whitemud Kaolin Project
Regional Geology
Whitemud Resources Inc.
Saskatchewan, Canada
Figure 7-1
7-4
SC
OT
TW
ILS
ON
RP
Aw
ww
.scottw
ilson
.com
ww
w.sco
ttwilso
nm
inin
g.co
m

January 2008 Source: Whitemud Resources Inc., 2006.
Whitemud Resources Inc.
Structure Contours on Top of theLower Easrend Formation or
Upper Transition Zone
Whitemud Kaolin ProjectSaskatchewan, Canada
Figure 7-2
7-5
SC
OT
TW
ILS
ON
RP
Aw
ww
.scottw
ilson
.com
ww
w.sco
ttwilso
nm
inin
g.co
m

January 2008 Source: Whitemud Resources Inc., 2006.
Whitemud Kaolin Project
Structure Map on Top of theKaolinized Sediments of the
Whitemud Formation
Whitemud Resources Inc.
Saskatchewan, Canada
Figure 7-3
7-6
SC
OT
TW
ILS
ON
RP
Aw
ww
.scottw
ilson
.com
ww
w.sco
ttwilso
nm
inin
g.co
m

SCOTT WILSON RPA www.scottwilson.com www.scottwilsonmining.com
7-7
LOCAL AND PROPERTY GEOLOGY GENERAL
The main area of interest for WRI is the extensive deposits of kaolinized sediments
which have been outlined by outcrop mapping and drilling in the Wood Mountain area.
The kaolinized sediments are mainly part of the Whitemud Formation and partly of the
Upper Eastend Formation, both high in the Upper Cretaceous Series (Table 7-1)
TABLE 7-1 CRETACEOUS-PLEISTOCENE STRATIGRAPHY IN SOUTHWESTERN SASKATCHEWAN
Whitemud Resources Inc. – Gollier Creek Kaolin Project
System Series Formation Quaternary Pleistocene Glacial Drift Tertiary Pliocene Miocene Wood Mountain Oligocene Cypress Hill Eocene Swift Current Paleocene Ravenscrag Cretaceous Upper Cretaceous Frenchman Battle Whitemud Eastend Bearpaw Belly River Upper Colorado
First White Speckled Shale Second White Speckled Shale
Lower Colorado Shale Fish Scale Zone Shale
Lower Cretaceous Viking Blairmore
The sediments of the Whitemud and Eastend Formations are similar in mineralogy
and chemistry but differ in the degree of kaolinization. Feldspars (including altered
pseudomorphs) are recognizable in both the kaolinized and the relatively unkaolinized
sediments of the Whitemud and Eastend Formations. In fact, feldspar pseudomorphs are

SCOTT WILSON RPA www.scottwilson.com www.scottwilsonmining.com
7-8
abundant in even the most kaolinized sediments. The sediments of the Whitemud and
Eastend Formations are possibly derived from the same source material, and most of the
kaolinization may have occurred in-situ following deposition. The amount and nature of
feldspar alteration was a function of the environment of deposition and/or post-
depositional, in-situ alteration, both of which were variable over short lateral distances
and over short time spans.
Local structures within the Whitemud and Eastend Formations, as interpreted from
the 1985 Ekaton data, may be related to subsidence of the sediments following the
solution of the underlying Devonian Prairie Evaporite. At and adjacent to the crests of
some structural highs, the Whitemud Formation was eroded off. A few of the features
may be related to Tertiary collapse structures described by Whitaker et al (1978), but
evidence suggests that most of the structural highs were eroded prior to the deposition of
the Ravenscrag Formation (Tertiary).
STRATIGRAPHY AND LITHOLOGY
Table 7-2 is a compilation of previously published sections and the results of
Ekaton’s 1985 drilling program as reported by Master (1987).

SCOTT WILSON RPA www.scottwilson.com www.scottwilsonmining.com
7-9
TABLE 7-2 STRATIGRAPHY AND LITHOLOGY OF PART OF UPPER CRETACEOUS – TERTIARY SEQUENCE IN WOOD MOUNTAIN REGION
Whitemud Resources Inc. – Gollier Creek Kaolin Project
System Formation Lithology
Tertiary Ravenscrag Formation Green-grey, buff feldspathic sandstone, clayey sands, silts and coal seams
Grey-green, purple bentonite clays, carbon and/or grey-green, yellow sand or sandstone-carbon
Frenchman Formation (?)
Purple or dark-grey ball clay, some sand and silt
White to partly yellow, consolidated clayey fine sand to clay (fireclay)
White to grey, consolidated sandy clay
Band of iron nodules
Whitemud Formation - Kaolinized
White, grey-green clayey sand and sandstone
Upper - partly kaolinized Grey to white clayey sand and sandstone, silt-carbon
Eastend Formation Clay in matrix yellow-orange
Lower Uniform, unconsolidated, fine green-grey sand
Upper Transition Zone Grey to greenish grey, partly consolidated, fine-to-medium sand or interbedded silt with clay
Lower Transition Zone Consolidated interbedded grey clays and yellow to grey-white sandstone or grey to apple-green bentonitic clays – variable silt and fine sand
Upper Cretaceous
Bearpaw Formation Grey, partly bentonitic shales
Fine to medium sands, silts and clays show cyclic repetition in the Upper Cretaceous
and Tertiary strata. The Whitemud Formation, composed of white kaolinized sediments,
is the only distinct marker horizon. Some of the colour differences, which cut across
formational boundaries, are probably a result of post-depositional processes. In the
absence of the white kaolinized marker beds, formation identification from lithology is
difficult. For example, the Ravenscrag and Frenchman Formations are almost
indistinguishable from the Eastend Formation in drill holes unless the white kaolinized
sediments of the Whitemud are present.

SCOTT WILSON RPA www.scottwilson.com www.scottwilsonmining.com
7-10
The Ravenscrag Formation is characterized by distinct beds of lignite. Whitaker
(1978) reports that a greenish-grey clay or silt band below the lowermost lignite seam
forms a distinct lithological marker for the contact between the Ravenscrag and the
underlying Whitemud Formation. However, other green sediments lie within the
Ravenscrag and Frenchman Formations, and the marker horizon of Whitaker is usable
only in conjunction with geophysical logs. In the absence of geophysical logs, the base of
the Ravenscrag Formation is considered to be the bottom of the lowest distinct lignite
seam (Figure 7-4).
FIGURE 7-4 OUTCROP AT GOLLIER CREEK SHOWING RAVENSCRAG/WHITEMUD CONTACT
(contact at lignite seam)
Older records report that the kaolinized sediments of the Whitemud Formation are
overlain by a layer of ball clay, a relationship recognizable in some outcrops and in drill
core. During drilling, however, the ball clay is difficult to distinguish visually from the
plastic bentonitic clays of the overlying Frenchman and Ravenscrag Formations.

SCOTT WILSON RPA www.scottwilson.com www.scottwilsonmining.com
7-11
Examination of several outcrops indicates that a distinct unconformity exists on top of the
kaolinized sediments so that in places the kaolinized sediments are overlain by the
Frenchman, while in others they are directly overlain by the Ravenscrag, and in spots by
the gravels of the Wood Mountain Formation. In many places the ball clay is absent and
kaolinized sediments are overlain directly by the Frenchman, Ravenscrag or Wood
Mountain Formations. The upper contact of the Whitemud is generally marked by a
downward colour change to white or greyish white. The lithology above the contact is
variable, and, in the absence of the kaolinized sediments, difficulty exists in determining
if the drill intersections represent the section above or below the Whitemud Formation.
The Whitemud sediments vary laterally and vertically over several metres between
the following lithologies:
• kaolinized feldspathic sands and sandstone, • clayey (kaolinitic) sand and sandstone, • consolidated sandy clay (kaolin), and • consolidated clayey (kaolinitic) fine sand and fireclay.
The sediments range in colour from white to yellow to grey and greyish-green with
gradations between. The dark minerals, identifiable in a hand lens, consist mainly of chert
but some carbon grains (lignite/coal?) are also generally present. The dark chert and
carbon give some of the rocks a salt-and-pepper appearance. The grain size ranges from
medium sand to fine sand, silt and clay. Variations in grain size and colour are easily
observed in outcrop. With a hand lens, kaolin infillings are distinguishable and distinct
lath-shaped clay pseudomorphs after feldspar are recognizable.
The lower contact of the Whitemud Formation with the Eastend Formation is
described in the literature as gradational. The contact is generally easy to recognize by
colour. It is commonly gradational over 1.5 m to 3.0 m through either grey to yellow
feldspathic sandstone, or grey to white clayey sand, siltstone or sandstone. This
gradational zone has been termed the Upper Eastend Formation.

SCOTT WILSON RPA www.scottwilson.com www.scottwilsonmining.com
7-12
The lower contact between the kaolinized sediments (including the partly kaolinized
Upper Eastend) and the underlying rocks is marked by a distinct downward colour
change to apple green or apple green-grey. The sediments below the kaolinized material
are unconsolidated uniform fine sand, partly consolidated fine-to-medium sand or
interbedded with clay. The uniform fine sand is designated as the Lower Eastend
Formation and the remaining sediments are part of the Upper Transition Zone.
A Transition Zone separates the Eastend Formation from the underlying Bearpaw
Formation. The Upper Transition Zone is coarser grained and, according to Whitaker
(1965), should be placed in the Eastend Formation whereas the Lower Transition Zone
should be considered part of the Bearpaw Formation.
The Lower Transition Zone was rarely intersected in the Ekaton drill program as the
apple-green colour of the Lower Eastend and Upper Transition Zone provided clear
indication that the drill was below the potential zone for kaolinized sediments. The
bentonitic clays are recognizable from their green colour and vitreous luster on freshly
cut surfaces.

SCOTT WILSON RPA www.scottwilson.com www.scottwilsonmining.com
8-1
8 DEPOSIT TYPES The Gollier Creek kaolinized sediment deposit is classified as a sedimentary deposit
consisting of altered and unaltered feldspars and pseudomorphs within a silica sand
matrix. Based on the results of the Ekaton work (Master, 1987) and the characterization
work conducted by Minfocus and WRI, the genesis of the kaolin is proposed as follows:
• It is most probable that the non-marine sediments of the Whitemud and Upper Eastend formations were derived from the same source material. Byers (1969) has suggested Montana, while McLaren (Fraser et al., 1935) suggest the Purcell and Selkirk Mountains.
• The strong lithological and mineralogical similarities between the kaolinized
sediments and the partly kaolinized and poorly kaolinized sediments of the Eastend are evidence that all the sediments are derived from the same source area.
• Drill core and outcrop samples from the Ekaton 1985 drilling suggest the
kaolinized sediments of the Whitemud, the partly kaolinized sediments of the Upper Eastend and the unkaolinized sediments of the Lower Eastend/Upper Transition are mineralogically similar. The degree of feldspar alteration appears to be similar, but the alteration products are different.
• The presence of angular quartz grains in all the formations suggests relatively
short distance of transport from indeterminate source areas. Sorting with respect to grain size and chert content appears to have occurred. Some reworking and redistribution of the Whitemud sediments over short distances may have taken place. Ball clays present in the Whitemud sediments probably represent reworked material derived from the underlying kaolinized sediments.
• In-situ alteration (kaolinization) of the Whitemud sediments due to
fluctuations of water table and climate is most likely as unaltered feldspar represents less than 5% of the rock, but the abundance of feldspar pseudomorphs (particularly in kaolinized material) suggests that the total feldspar content of the original sandstone was between 30 and 40 percent.
• The significant amounts of feldspar, ranging from clay and sericite
pseudomorphs after feldspar to unaltered grains, suggests that the kaolin in the sediments was derived from the weathering of the feldspars at the site of deposition. If kaolinization took place in the source area, less kaolin would be present in the form of lath-shaped feldspar pseudomorphs.

SCOTT WILSON RPA www.scottwilson.com www.scottwilsonmining.com
9-1
9 MINERALIZATION Mineralogical analysis of the Whitemud Formation sediments was conducted by
Miles Industrial Minerals Research on behalf of Ekaton in 1985. Random core samples
from the 1984 drill program representing material from the Whitemud Formation, Upper
Eastend, Lower Eastend-Upper Transition and Lower Transition zones were selected.
Mineral species were identified in thin section by optical methods. The results of this
work are summarized as follows:
• Quartz and feldspar are the dominant minerals, with clay fill representing between 10% and 75% on a volume basis (typically 10% to 20% clay fill).
• Clay sediments of low birefringence appear to be deposited between the grains
of quartz and feldspar (grains generally touch each other) and do not appear to be altered in situ.
• Quartz and feldspar grains have angular edges, suggesting that they have been
transported relatively short distances. The muscovite, quartz, and feldspar distribution is generally uniform, with larger quartz grains associated with larger muscovite and feldspar grains.
• The altered feldspar content of the kaolinized sediment is not much different
from that of the partly kaolinized and unkaolinized material. • The volume percentages of quartz and clay-fill minerals in the sediments of
the Whitemud and the underlying Eastend/Transition sediments show that feldspar, quartz, and clay-fill contents are generally similar, suggesting a common source area for the sediments.
Additional mineralogical work by Ekaton identified illite and traces of smectite as
accessory clay minerals within the clay fill.
Mineralogical work in 1999 by Minfocus, using samples of core from the Ekaton drill
program of the mid-1980s, manual auger samples collected by Minfocus, and channel
samples from outcrop at the Gollier Creek pit, focused on characterization of the mineral
species and evaluation of mineralogical differences by particle size. Drill core samples

SCOTT WILSON RPA www.scottwilson.com www.scottwilsonmining.com
9-2
were collected from drill core from holes in the Gollier Creek area, primarily holes
located near the Ekaton test pit.
X-ray diffraction studies of the -325 mesh (-44 micron) size fraction showed that the
samples were composed principally of quartz and kaolinite, with minor amounts of illite,
muscovite mica, sericite, amphibole, orthoclase feldspars, and oligoclase feldspars. The -
325 mesh fraction represented 33.7% to 52.2% by weight of the samples, with drill core
samples typically being in the mid 30% range. Quartz was primarily contained in the
+325 mesh fraction, but fine quartz was also found in the finer fractions at levels ranging
from a low of 1.81% for a <2 micron sample to a high of 15.89% for a <10 micron
sample.

SCOTT WILSON RPA www.scottwilson.com www.scottwilsonmining.com
10-1
10 EXPLORATION EKATON EXPLORATION
Ekaton conducted an extensive exploration program across all of the WRI lease areas
in the 1980s. This program included surface sampling and mapping, drilling and core
sampling. Drill core from the Ekaton drill program is stored at the core library at the
Saskatchewan Industry and Resources Subsurface Geological Laboratory in Regina. Drill
logs, assay data sheets and other geological information from the Ekaton exploration
program was obtained by WRI from Saskatchewan Industry and resources mineral
assessment files and from former Ekaton employees, especially Pilsum Master, P. Geo.,
formerly exploration manager for Ekaton. Review of the data indicates the Ekaton work
was done to a high standard.
The drill core library in Regina maintains core for Ekaton holes 103 through 252.
Drill logs are available for all holes, with assay data (chemical analysis, mineralogical
analysis, particle size analysis, in part or in combination, being available for a large
number of holes). Ekaton holes 104 through 252 were relogged by WRI (Chris Curry, P.
Geo.), while the drill logs for Ekaton holes 1 through 99 were examined and reinterpreted
to conform to the stratigraphic relationships established for the relogged core.
Scott Wilson RPA examined the available core, reviewed the revised logs and took
selected samples of core for analysis as part of its due diligence (Figure 10-1).

SCOTT WILSON RPA www.scottwilson.com www.scottwilsonmining.com
10-2
FIGURE 10-1 DRILL CORE SAMPLING BY SCOTT WILSON RPA (Hole WM 87-132 at 61’)
The available drill core covers all of the property areas of primary interest, with a
focus on the Gollier Creek, Wood Mountain, and Project 12 deposits. In the opinion of
Scott Wilson RPA, the available core and related analytical data can be used to develop
resource and reserve estimates, and additional drilling is not required to confirm historical
data with respect to stratigraphic relationships and interpretation of the thickness of the
kaolinized sediments of the Whitemud Formation and the associated overburden.
WRI EXPLORATION WRI has conducted additional infill drilling and particle size analysis of drill core for
the Gollier Creek deposits. These data have been used to develop tonnage and grade
estimates for the Gollier Creek deposits at the Indicated Resource and better level of
resource estimation. Additional infill drilling, combined with particle size analysis of drill
core samples, has been conducted to extend and upgrade the categorization of resource
estimates across most of the remaining WRI property holdings.

SCOTT WILSON RPA www.scottwilson.com www.scottwilsonmining.com
10-3
WRI has utilized the existing stockpiles of kaolinized sediments at Gollier Creek in
its metallurgical test work. These stockpiles, representing several thousand tonnes of
kaolinized material, have been exposed to the weather since 1987. Inspection of the
stockpiles by Scott Wilson RPA and comparison with outcrop exposures indicates some
kaolin may have been washed from the surface of the pile, but that the interior material
should be representative of the material originally removed from the test pit. Samples of
this material have been analyzed by X-ray diffraction (XRD) for mineralogical
characterization, by X-ray fluorescence (XRF) for chemical composition and by
Sedigraph for particle size distribution at the University of Indiana by Dr. Haydn Murray.
WRI completed a LIDAR (laser interferometer distance and ranging) topographic
survey of its quarry leases in 2006, with a focus on the leases in the Gollier Creek area.
This survey provides topographic information to approximately ±0.1 m elevation
accuracy. The results of this survey have been used in development of the 2006 drilling
program, and to assist in resource estimation and mine planning.

SCOTT WILSON RPA www.scottwilson.com www.scottwilsonmining.com
11-1
11 DRILLING The 2006 drill program was designed to fill in gaps between some of the Ekaton holes
in the Gollier Creek area, and to extend the potential limits for resource estimation
purposes. The program was designed after Scott Wilson RPA had completed its initial
data review and resource estimations. Drill hole spacing was 400 m or less from adjacent
holes. This distance was determined from semi-variogram analysis of the Ekaton drill
data. Holes were drilled to the west and north of the Ekaton holes on the west side of
Gollier Creek and between areas of Ekaton holes on the east side of Gollier Creek. The
drill hole locations are indicated on Figure 11-1.
FIGURE 11-1 2006 DRILL PROGRAM – HOLE LOCATIONS

SCOTT WILSON RPA www.scottwilson.com www.scottwilsonmining.com
11-2
The drill program consisted of 30 planned holes, of which 25 were eventually
completed. Holes were labelled either Axx or Bxx, with A indicating priority holes
Drilling was conducted using a rotary drill with a hollow stem core barrel. Core recovery
was initiated once the drill cuttings return indicated the bit had entered sand. Core was
recovered in three-metre intervals. After removal of surface drilling mud, the core was
logged and sampled. Figures 11-2, 11-3, 11-4, and 11-5 illustrate the 2006 drill program.
Resistivity logs for each hole were also completed. The resistivity logs generally
indicated sharp distinctions between the clay and kaolinized sediment layers and provided
good correlation with the drill logs. A summary of the drill hole results is provided in
Table 11-1.
FIGURE 11-2 DRILL RIG FIGURE 11-3 DRILL CORE
FIGURE 11-4 SAMPLED CORE FIGURE 11-5 CONTACT BETWEEN WHITEMUD AND
EASTEND FORMATIONS

SCOTT WILSON RPA www.scottwilson.com www.scottwilsonmining.com
11-3
TABLE 11-1 PROGRAM DRILL HOLE SUMMARY – 2006 DRILL PROGRAM
Whitemud Resources Inc. – Gollier Creek Kaolin Project
UTM Location Hole No. Easting Northing
Collar Elev. (m)
Depth (ft)
Top of Ksd (ft)
Bottom of Ksd (ft)
Remarks
A01 408206 5472788 798 54 13 34 A02 408197 5472383 807 58 17 34.5 A03 408208 5471665 811 110.5 76.2 97.5 A04 408960 5470907 818 119 62 104 A05 408668 5471815 804 128 98 112 A06 408252 5471213 811 72 32 55 Poor core recovery.
Contacts estimated from resistivity log
A08 408396 5470860 821 Hole not drilled A09 408136 5471996 804 72 31 53 A10 408077 5471582 817 112 56 94.9 A11 408071 5471198 822 118 75.2 115.2 B01 407998 5472562 802 48 13 31.8 Cored from 18 to
eoh. Good recovery in Ksd
B02 409602 5471573 814 69 17 54.5 B03 407905 5472215 811 70 26 48.5 B04 407838 5471937 819 113 74.5 107.7 B05 Not drilled.
Redundant after moving neighboring holes
B06 407657 5472545 808 70 20 48 Lost core 20 - 40 B10 407855 5471729 812 108 72.7 97.7 B11 407800 5471392 818 124 81 112.5 B20 408184 5473100 795 54 14 32 B21 408079 5473366 793 40 18 28 B22 407776 5473415 798 100 11 22 Rotary test hole –
not cored B23 407925 5473147 798 54 10 34.5 B24 407863 5472886 805 41 17 31 B25 407843 5473237 801 60 Nil nil B26 407579 5472989 803 120 18? 22? Inferred from
cutting. No Whitemud recovered in core
B30 409788 5471271 812 80 16.5 54 100% recovery below 20 ft.
The 2007 drill program totalled 68 holes for 2,218.6 m (7,278 ft.). Of these holes, 14
holes totalling 306.47 m (1,005.5 ft.) were drilled in the area of the West Pit as in-fill

SCOTT WILSON RPA www.scottwilson.com www.scottwilsonmining.com
11-4
holes; five holes totalling 243.0 m (797.5 ft.) were drilled in the Readlyn area; and 11
holes totalling 386.2 m (1,267 ft.) drilled in other areas to test possible exploration
targets. Holes utilized in updating the mineral resource estimate in the Gollier Creek area
are detailed in Table 11-2.

N83UTME N83UTMN 1/4 Sec Section Twp Rng MerWRI2007-B07 409940 5471515 822 NE 17 5 2 3 135 71 109 38WRI2007-B08 410628 5471523 819 NE 17 5 2 3 160 55 78 23WRI2007-B09 410580 5471225 817 NE 17 5 2 3 180 84.5 110.5 26WRI2007-B10 410362 5471204 830 NE 17 5 2 3 220 116 140 24WRI2007-B11 410088 5471106 829 NE 17 5 2 3 160 60 102 42WRI2007-A10 410264 5471547 824 NE 17 5 2 3 130 88 110 22WRI2007-B30 411064 5474399 811 NW 28 5 2 3 120 45 58 13WRI2007-B38 411064 5474750 802 NW 28 5 2 3 67 35 59 24WRI2007-B31 410373 5474515 801 NE 29 5 2 3 62 14 53 39WRI2007-B34 410573 5474992 794 NE 29 5 2 3 52 15 48 33WRI2007-B36 410039 5474477 793 NE 29 5 2 3 100 0 0 0WRI2007-B37 410463 5474716 805 NE 29 5 2 3 72 14 51.7 37.7WRI2007-A15 410685 5474301 803 SE 29 5 2 3 99 10.5 62 51.5WRI2007-B33 410389 5473990 792 SE 29 5 2 3 100 17 38.3 21.3WRI2007-B21 411287 5475460 814.5 SW 33 5 2 3 159 125.3 137 11.7WRI2007-B22 411091 5475203 797 SW 33 5 2 3 160 52 62 10WRI2007-A08 408566 5474913 783 NE 30 5 2 3 52 0 0 0WRI2007-B04 408314 5474649 796 NE 30 5 2 3 74 13 41 28WRI2007-A07 407900 5475093 799 NW 30 5 2 3 100 12 61 49WRI2007-B03 408049 5474370 803 NW 30 5 2 3 70 26 61 35WRI2007-B05 408660 5473796 809 SE 30 5 2 3 89 13 44.4 31.4WRI2007-A06 408245 5474032 803 SW 30 5 2 3 68 15 56 41WRI2007-B01 408214 5473783 799 SW 30 5 2 3 70 22 51 29WRI2007-B02 408076 5473938 803 SW 30 5 2 3 66 15 47 32
WRI2007-RD03 446146 5492303 739 NW 21 7 28 2 200 84.7 107.8 23.1WRI2007-RD04 445399 5492302 720 NW 21 7 28 2 120 0 0 0WRI2007-RD02 447053 5493882 712 NW 27 7 28 2 180 54 73.5 19.5WRI2007-RD05 447050 5493505 720.3 NW 27 7 28 2 107.5 64.5 96 31.5WRI2007-RD01 447041 5493103 726 SW 27 7 28 2 190 105 155 50WRI2007-A01 407446 5472562 815 SW 19 5 2 3 37 14 ? naWRI2007-B28 407436 5472178 820 SW 19 5 2 3 160 62 110 48WRI2007-A21 405069 5472146 800 SE 23 5 3 3 120 32 43.5 11.5WRI2007-A14 407041 5472798 814 NE 24 5 3 3 87 43 62 19WRI2007-A02 407060 5473226 815 NE 24 5 3 3 120 9 50.5 41.5WRI2007-B27 407051 5472474 824 SE 24 5 3 3 160 71 85 14WRI2007-B29 407114 5472068 822 SE 24 5 3 3 180 0 0 0WRI2007-A03 405852 5472337 812 SW 24 5 3 3 120 47.2 78 30.8WRI2007-A04 406574 5472707 812 SW 24 5 3 3 62 32 52 20WRI2007-B23 406574 5472306 813 SW 24 5 3 3 131 74 121 47WRI2007-B24 406591 5471951 828 SW 24 5 3 3 200 93 132 39WRI2007-B25 406191 5471951 814.2 SW 24 5 3 3 122 75 101.5 26.5WRI2007 B26 406115 5472366 815 SW 24 5 3 3 72 42 62 20WRI2007-B35 406091 5472738 804 SW 24 5 3 3 42 21 31 10GCM-01-A01 408773.33 5470888.3 806.1 SE 18 5 2 3 62 21 50.5 29.5GCM-01-A02 408773.05 5470839.3 810.7 SE 18 5 2 3 81 42 70 28GCM-01-A03 408719.44 5470787.8 811.3 SE 18 5 2 3 81.5 43.6 69 25.4GCM-01-A04 408720.01 5470843.8 807.8 SE 18 5 2 3 62 23 33 10GCM-01-A05 408667.01 5470793.9 810.9 SE 18 5 2 3 73 28.5 55 26.5GCM-02-A01 408912.3 5470838.9 816.0 SE 18 5 2 3 100 52.8 75 22.2GCM-02-A02 408925.5 5470918.4 815.9 SE 18 5 2 3 113 68 98 30GCM02-B02 408942 5471041 798 SE 18 5 2 3 50.5 14 44 30GCM02-B03 408916 5471001 805 SE 18 5 2 3 60.5 22 50.5 28.5GCM02-B04 408871 5470966 804 SE 18 5 2 3 70.5 26.6 65 38.4GCM03-A01 408852 5470823 806 SE 18 5 2 3 80 28.5 70 41.5GCM03-A02 408804 5470773 807 SE 18 5 2 3 80 40 70.5 30.5GCM03-A03 408742 5470703 811 SE 18 5 2 3 89.5 40.5 77 36.5GCM02-B01 408980 5471053 793 SE 18 5 2 3 32 9 23 14
WRI2007-A18 412159 5478070 803 NE 4 6 2 3 70 18.5 42 23.5WRI2007-A19 412237 5476966 791 SE 4 6 2 3 140 0 0 0WRI2007-A17 410998 5477063 806 SW 4 6 2 3 100 0 0 0WRI2007-A16 410765 5478313 825 NE 5 6 2 3 160 80.5 101 20.5WRI2007-A22b 404661 5471506 812 NW 14 5 3 3 100 30 49.5 19.5WRI2007-A13 410127 5473273 793 NE 20 5 2 3 52 0 0 0WRI2007-B06 410678 5472978 806 NE 20 5 2 3 105 45.5 66.5 21WRI2007-A12 409478 5473042 798 NW 20 5 2 3 100 0 0 0WRI2007-A11 409547 5473606 783 SW 29 5 2 3 60 0 0 0WRI2007-A20 411257 5476059 818 NW 33 5 2 3 200 120 160 40WRI2007-B20 411548 5476217 806 NW 33 5 2 3 180 94.8 110 15.2
7,278
TABLE 11-2 PROGRAM DRILL HOLE SUMMARY – 2007 DRILL PROGRAMWhitemud Resources Inc. – Gollier Creek Kaolin Project
Thickness Ksd, ft
Hole Location - Geographic TD, ft Top Ksd, ft
Bottom Ksd, ft
Elm Springs Deposit
E Pit Bridge
Other Exploratory
Holes
Hole Coordinates
Total Depth (ft)
Resource Area Location NameCollar
Elev, m
West Pit Active Blocks
W Extension W Pit
Readlyn
N Extension W Pit
SCOTT WILSON RPA www.scottwilson.com www.scottwilsonmining.com
11-5

SCOTT WILSON RPA www.scottwilson.com www.scottwilsonmining.com
12-1
12 SAMPLING METHOD AND APPROACH WRI is proposing to produce metakaolin by calcination of kaolinized material. In the
process, raw kaolinized sediments are mined and crushed and passed through a rotary
dryer to reduce the moisture content to less than 1%. At this point, the cementing action
of the moist kaolin particles becomes negligible and the kaolin particles, together with
any other fine clay, feldspar and quartz particles, are separated from the coarser particles.
Test work by WRI indicates that the initial feed material to the dryer should be less than
0.25 in. (approximately 3 1/2 mesh, or 5.6 mm).
Prior particle size analysis work by Ekaton had defined 325 mesh (44 micron) as an
initial separation point for beneficiation of kaolin. Work by Ekaton had also defined the -
10 micron size fraction as representing the true kaolin fraction in the kaolinized
sediments. The available Ekaton data provided an initial data base for samples which had
been subject to particle size analysis. Samples for analysis were taken by Ekaton at 0.61
m (2 ft.) intervals from drill core. The weight fractions for the -325 mesh and -10 micron
size fractions were determined using sieve analysis. These data were used by Scott
Wilson RPA to develop an initial semi-variogram of the particle size distribution of the
kaolinized sediments in the Gollier Creek deposit area.
Scott Wilson RPA determined that the available Ekaton data were insufficient to
develop reliable estimates of the particle size distribution of the kaolinized sediments
throughout the Gollier Creek deposit. Accordingly, WRI obtained samples from drill
core from holes specified by Scott Wilson RPA. Samples were collected from split drill
core at 1.22 m (4 foot intervals) within the identified Whitemud Formation. In total, 235
samples were taken. Wet sieve analyses to determine the wt% -44 microns (-325 mesh)
were conducted. In addition, Coulter Count analysis of the volume % of each size
fraction was conducted for eleven samples.
A similar procedure was followed for sampling of the drill core obtained during the
2006 and 2007 drill programs. Drill core was cleaned of drill mud and samples obtained

SCOTT WILSON RPA www.scottwilson.com www.scottwilsonmining.com
12-2
by slicing the surface of the drill core along four foot intervals. In some cases, it was not
possible to obtain four foot intervals and shorter sample lengths were used. Particle size
analysis using the wet sieve method to determine the wt% -44 micron fraction was
conducted. Coulter count analysis of the volume % of each size fraction was also
conducted for selected samples.
Sampling of Ekaton drill core material for determination of bulk density was
undertaken by WRI. WRI took 22 samples of drill core and one chip sample from
outcrop from the Gollier Creek area. Samples were selected to be representative of
various depths within the kaolinized sediments of the Whitemud Formation. Table 12-1
details the results of the bulk density tests.

SCOTT WILSON RPA www.scottwilson.com www.scottwilsonmining.com
12-3
TABLE 12-1 BULK DENSITY TEST RESULTS Whitemud Resources Inc. – Gollier Creek Kaolin Project
Bulk Density (kg/m3) Sample
Identification Interval Moisture
Content (%) Wet Dry WM 87-115 120’ – 123’ 1.6 1794 1765 WM87-115 112’ – 115’ 1.1 1795 1776 WM87-126 101’ – 104’ 2.2 1726 1690 WM87-130 71’ – 74’ 1.4 1779 1755 WM87-130 85’ – 88’ 2.0 1772 1738 WM87-133 74’ – 77’ 2.0 1843 1808 WM87-140 75’ – 78’ 1.3 1781 1757 WM87-140 98’ – 101’ 2.3 1759 1719 WM87-141 57’ – 60’ 1.0 1787 1769 WM87-141 79’ – 87’ 1.7 1801 1770 WM87-145 73’ – 76’ 2.9 1832 1780 WM87-145 83’ – 86’ 2.5 1779 1735 WM87-162 35’ – 38’ 1.7 1779 1750 WM87-162 47’ – 50’ 1.8 1737 1706 WM87-167 37’ – 40’ 1.4 1758 1735 WM87-174 63’ – 66’ 2.1 1832 1794 WM87-174 71’ – 74’ 1.8 1767 1736 WM87-155 12’ – 15’ 0.7 1718 1706 WM87-127 52’ – 55’ 0.4 1811 1803 WM87-155 24’ – 27’ 1.1 1773 1753 WM87-127 64’ – 67’ 0.5 1770 1762 WM87-127 68’ – 71’ 1.0 1826 1809
Outcrop 0.5 1775 1767
These data are in accord with specific gravity tests conducted by Hardy Associates of
Calgary in 1985 for Ekaton. These tests determined a dry bulk specific gravity of 1.75
g/cm3 based on analysis of 13 widely separated samples.
The moisture content of the drill core from the 2006 drill program was also
determined. Results of the analysis indicated a moisture content ranging from
approximately 10% to in excess of 20%, with an average of approximately 15%. These
data are in general agreement with moisture measurements of auger drill cuttings
obtained from two test bore wells drilled in 2005 for piezometer installation. Based on
these results, an in-situ moisture content of 15%, yielding a wet bulk specific gravity of
2.01 g/cm3, has been used for resource estimation purposes.
SCOTT WILSON RPA www.scottwilson.com www.scottwilsonmining.com
13-1
13 SAMPLE PREPARATION, ANALYSES AND SECURITY
Samples of Ekaton drill core for particle size analysis were collected by Chris Curry,
P. Geo. Samples were taken over four foot intervals of drill core within the identified
Whitemud Formation for each hole of interest. Scott Wilson RPA identified the holes
from which samples were obtained but did not attend the actual sampling process.
Samples were tagged and bagged, with duplicate sample tags left in the drill core boxes.
Samples of drill core from the 2006 drill program were collected by Lynn Kelley, P.
Geo., Manager, Geology and Exploration, for WRI. Samples were collected at 4 foot
intervals or as available. Samples were obtained by cleaning drill core of drilling mud and
then slicing off a section several millimetres thick along the sample length using a putty
knife. Samples were placed in plastic bags and labelled with the hole number and
interval. Drill core was stored in waxed cardboard core boxes as illustrated in Figure 11-
4. Scott Wilson RPA observed the drilling and sampling process and is of the opinion that
the sampling procedures employed are acceptable.
All drill core samples were shipped to Core Laboratories Canada Ltd. (Core
Laboratories) in Calgary, Alberta, for analysis. Core Laboratories is a CSA certified
testing laboratory. The analytical procedure followed for the sieve analysis was:
• Weigh initial sample and jaw crush • Riffle split representative sample • Weigh out ~75 gram sample, place in beaker, with methanol and cover with
2.5% solution of sodium hexametaphosphate • Disaggregate sample using ultrasonic breaker • Wet sieve on 8” dia. 325 mesh brass sieve • Dry and weigh the +325 mesh fraction • Calculate wt% fractions for +325 mesh and -325 mesh fractions
Appendix 1 incorporates the results of the particle size analysis.

SCOTT WILSON RPA www.scottwilson.com www.scottwilsonmining.com
13-2
Samples for determination of bulk specific gravity were tested in accordance with
Saskatchewan Highways and Transportation Standard STP 205-9, which references
ASTM Standard D 4531.The analytical work was conducted by AMEC Earth and
Environmental Ltd. in Calgary, Alberta. AMEC is a certified concrete testing laboratory
with experience in conducting the required test work.
Drill core samples from the 2007 drill program were handled in a similar manner as
detailed above for the 2006 drill samples. Samples were analyzed at SGS Lakefield
Research Limited, Lakefield, Ontario (SGS Lakefield), for particle size, chemistry and
mineralogy (Appendix 5).

SCOTT WILSON RPA www.scottwilson.com www.scottwilsonmining.com
14-1
14 DATA VERIFICATION The author examined available Ekaton drill core and compared the core to the original
Ekaton drill log descriptions. Available assay data respecting chemical, mineralogical,
and particle size information assay data have been reviewed and compared to the current
results, where possible. Scott Wilson RPA is satisfied that the sampling methods and
analytical techniques used by Ekaton and WRI are appropriate and that the mineralogical
information, particle size, and bulk specific gravity data developed by Ekaton and WRI
are reliable.
As part of the due diligence for this report, Scott Wilson RPA collected samples for
mineralogical analysis from drill core from the Gollier Creek deposit and from the Project
12 area. Individual and composite samples were characterized by SGS Lakefield
laboratories for particle size distribution using Malvern Mastersizer, while composite
samples were characterized for mineralogy using XRD and Qemscan particle analysis.
The list of samples and composites are detailed in Table 14-1, with the results of the
analyses detailed in Tables 14-2 and 14-3.
Scott Wilson RPA has reviewed the analytical results and assay certificates for the
2007 drill program and is satisfied that the analytical data are correct and complete, and
reliable. The analytical results for the 2007 drill program are consistent with prior
laboratory results for the 2006 drill program and Scott Wilson RPA’s due diligence of the
2006 drilling and sampling program and prior work.

SCOTT WILSON RPA www.scottwilson.com www.scottwilsonmining.com
14-2
TABLE 14-1 SCOTT WILSON RPA SAMPLE LIST Whitemud Resources Inc. – Gollier Creek Kaolin Project
Sample No. Hole No. Intersection
(ft. from collar) Composite Area
71051 148 110.5 ft Gollier Creek 71054 132 42 ft Gollier Creek 71058 132 61 ft Gollier Creek 71057 121 119 ft Gollier Creek 71059 147 25 ft
1
Gollier Creek 71053 117 55 ft Gollier Creek 71060 113 21 – 22 ft Gollier Creek 71061 113 44.5 ft Gollier Creek 71071 219 26 – 31 ft Gollier Creek 71072 219 56 – 58 ft Gollier Creek 71079 221 17 – 19 ft Gollier Creek 71080 221 48 – 51.5 ft
2
Gollier Creek 71055 159 78.5 ft Gollier Creek 71056 159 99.3 ft Gollier Creek 71065 128 58.5 ft Gollier Creek 71066 128 85.5 ft Gollier Creek 71067 162 33 – 34 ft Gollier Creek 71073 167 35 ft
3
Gollier Creek 71068 201 13 – 15 ft Project 12 71078 184 29 – 31 ft Project 12 71081 214 76 – 78 ft
4 Project 12

SCOTT WILSON RPA www.scottwilson.com www.scottwilsonmining.com
14-3
TABLE 14-2 SUMMARY OF QUALITATIVE X-RAY DIFFRACTION RESULTS – COMPOSITE SAMPLES
Whitemud Resources Inc. – Gollier Creek Kaolin Project
Crystalline Mineral Assemblage (relative proportions based on peak height) Sample Major Moderate Minor Trace Comp 1 kaolinite quartz, potassium-
feldspar *chlorite, *amphibole,
mica *plagioclase-feldspar
Comp 2 kaolinite quartz, potassium-feldspar
*chlorite,
mica *plagioclase-feldspar
Comp 3 kaolinite quartz, potassium-feldspar
*chlorite, *amphibole,
mica *plagioclase-feldspar
Comp 4 kaolinite quartz plagioclase-feldspar,
*chlorite,
potassium-feldspar,
*montmorillonite
aluminite, mica
*Tentative identification due to low concentrations, diffraction line overlap or poor crystallinity

SCOTT WILSON RPA www.scottwilson.com www.scottwilsonmining.com
14-4
TABLE 14-3 QEMSCAN PARTICLE ANALYSIS OF COMPOSITE SAMPLES
Whitemud Resources Inc. – Gollier Creek Kaolin Project
Sample Name Comp 1 Comp 2 Comp 3 Comp 4 Mineral Mass (%) Kaolinite 21.2 29.3 38.4 46.4 Quartz 25.2 20.7 10.8 4.4 Plagioclase 15.4 15.4 12.9 15.7 K-Feldspar 10.8 7.8 8.3 11.6 Sericite/Muscovite 20.7 20.1 23.0 11.7 Chlorite 1.4 0.5 3.0 3.1 Oxides 4.0 4.9 2.5 4.1 Amphibole 0.6 0.9 1.0 2.2 Other 0.6 0.3 0.2 0.4 100.0 100.0 100.0 99.8 Particle Size 19 23 25 36 Grain Size Kaolinite 12 14 17 21 Quartz 17 18 15 15 Plagioclase 7 7 7 9 K-Feldspar 12 11 10 10 Sericite/Muscovite 9 9 8 6 Chlorite 10 9 6 8 Oxides 14 15 12 13 Amphibole 7 10 8 8 Other 16 12 9 16
The data detailed in Tables 14-2 and 14-3 are consistent with the mineralogical and
particle size analysis data obtained by Ekaton and WRI for the kaolinized sediments
within the Gollier Creek property.

SCOTT WILSON RPA www.scottwilson.com www.scottwilsonmining.com
15-1
15 ADJACENT PROPERTIES WRI’s Quarry Prospecting Permit 144 is located near Readlyn, Saskatchewan.
Estevan Brick, now a subsidiary of IXL, operated a kaolinized sand quarry nearby,
centered at UTM Zone 13, E 466275, N 5494050. The kaolinized sand exposed in the
quarry has similar textural and mineralogical characteristics to that exposed at Gollier
Creek. Total thickness exposed in the quarry face is in excess of 20 ft. Figure 15-1
illustrates the IXL quarry.
FIGURE 15-1 IXL QUARRY NEAR READLYN, SASKATCHEWAN
WRI drilled five holes on the property in 2007 to test the depth of kaolinization. One
hole did not return any kaolinized sediment. The remaining four holes retuned kaolinized
sediment intervals from 5.9 m to 15.2 m in thickness, for an average of 9.45 m thickness.

SCOTT WILSON RPA www.scottwilson.com www.scottwilsonmining.com
16-1
16 MINERAL PROCESSING AND METALLURGICAL TESTING GENERAL
WRI proposes to produce metakaolin by controlled calcination of a kaolin feed.
Metakaolin is a supplementary cementitious material (SCM) used as a replacement for
Portland cement. Metakaolin is a highly reactive pozzolanic material and both competes
with and complements other SCMs such as silica fume (SF), fly ash (FA), and ground
granulated blast furnace slag (GGBFS).
Metakaolin is produced by the controlled calcination of kaolin at moderately high
temperature (650oC – 800oC). The calcination process breaks down the crystal structure
of the kaolin, producing a transition phase material consisting of silica and amorphous
alumina in reactive form with a very high surface area per unit mass. The optimum
calcination temperature for production of metakaolin is a function of the purity of the
originating kaolin material and the degree of crystallinity of the kaolin. Calcination at too
high a temperature will cause recrystallization of the kaolin into quartz and mullite,
which are inert materials in cement mixes. Calcination at too low a temperature will fail
to break down the kaolin crystal. For these reasons, processing parameters for metakaolin
are specific to the base material used and pilot plant work is required to establish the
correct operating conditions to produce a highly reactive metakaolin product.
The basic flow chart for the process is illustrated in Figure 16-1.

SCOTT WILSON RPA www.scottwilson.com www.scottwilsonmining.com
16-2
FIGURE 16-1 METAKAOLIN PRODUCTION - PROCESS FLOW BLOCK DIAGRAM
Mined material is transported to a crushing and screening plant where raw ore is
crushed to 90% passing 0.25 inches. This material is transferred to a rotary dryer where it
is dried to less than 0.5% moisture. As drying proceeds, the kaolin is liberated from the
coarse sand fraction. Fine material is passed through a hot air cyclone/baghouse to
separate the kaolin into a coarse fraction and a fine fraction. Fine silica is removed from
the coarse kaolin in the cyclone, while fine kaolin is captured in the baghouse. Kaolin is
recovered from the cyclone and baghouse and fed to a rotary calciner, where chemically
bound water is removed and the kaolin is converted to metakaolin. The metakaolin is
cooled in a rotary cooler and transferred to silos for shipment.
METALLURGICAL TEST RESULTS WRI has conducted a number of test programs designed to evaluate different process
options and provide base data for engineering design. Test material was obtained from
the kaolin stockpiles at the Gollier Creek deposit. These stockpiles represent material
excavated by Ekaton in 1987.
Mine Crush & Screen to
- 1/4”
Rotary Dryer
Sand
Cyclone/Baghouse
Rotary Calciner
Cooler
Metakaolin Product
Fine Silica

SCOTT WILSON RPA www.scottwilson.com www.scottwilsonmining.com
16-3
Process test work was conducted to determine the relationship of crushed ore size to
drying and initial kaolin-sand separation efficiency, calcination behaviour and associated
mass and heat transfer relationships, and the impact of coal type on burner efficiency and
flame stability. Work on the relationship between crushed ore size and dryer parameters
was conducted at Hosakawa America and Alstom Power, while calcination tests were
conducted at Alstom Power and FFE Minerals. Pilot plant work indicates product
recoveries somewhat below the recoveries anticipated in the commercial plant. This is not
unusual for industrial minerals process development work due to the inherent difficulties
in operating small-scale dry-process pilot plants. The differences in product recoveries
between the pilot plant and the commercial plant have been discussed with WRI’s
process engineers and based on the process engineering reports from Consultec Ltd. Scott
Wilson RPA is satisfied that the estimated commercial plant product recoveries are
reasonable. Figure 16-2 details the projected mass balance assuming a feed material
containing 30% kaolin by weight on a dry basis. This mass balance has been used in
equipment sizing for the production plant.
A coal fired roasting test was run by WRI personnel at FFE Minerals in Bethlehem,
Pennsylvania, in November 2005. Approximately 1,100 pounds of kaolin was run
through their test calciner, starting on natural gas and gradually switching to pulverized
coal (from Bienfait, Saskatchewan). The pulverized coal burned very well. FFE
Minerals tested for carbon carryover in the finished metakaolin, with levels below the
minimum detection level of 0.05%.
The final test results indicated the following:
• Kaolin recovery in pilot plant operations was 89% by weight. • Metakaolin recovery in pilot plant operations was 79.4% by weight. • Indicated recoveries of kaolin and metakaolin for commercial plant design are
91.47% by weight (dry basis) of raw kaolin feed and 89.19% by weight (dry basis) of dry kaolin feed, respectively.
• Bienfait coal has higher heat value than Coronach coal.

SCOTT WILSON RPA www.scottwilson.com www.scottwilsonmining.com
16-4
The results of the pilot plant test work have been used by WRI, Hatch Energy and
Consultec Ltd. for specification and engineering of the process plant. The results of this
design analysis are described more fully in Item 18 of this report.
PRODUCT TEST RESULTS Performance testing of the final metakaolin product for use in concrete applications
was conducted by AMEC Earth and Environmental, Hamilton, Ontario, CTL
Technologies Inc. (CTL) of Chicago and several cement companies. AMEC and CTL are
accredited concrete materials testing laboratories. Test work was conducted to determine
compliance of WRI’s metakaolin product with CSA Standard A 3001-03 Cementitious
Materials for Use in Concrete, Appendix D, Guide for the Evaluation of Alternative
Supplementary Cementing Materials (SCMs) for Use in Concrete and ASTM Standard
C618.
Test work included the following:
Chemical Analysis: Loss on Ignition, major oxides: ASTM C114 Available Alkali: ASTM C311 Mineralogical Composition (X-Ray Diffraction)
Physical Analysis: Fineness by Air Permeability (Blaine Fineness): ASTM C204 Particle Size Analysis by Horiba Capa-700 particle Analyzer Density: ASTM C188 Fineness (% retained on 45 µm sieve): ASTM C430 Increase in drying shrinkage of mortar bar: ASTM C157 Soundness: ASTM C151 Air entrainment of mortar: ASTM C311 Strength activity index: ASTM C109 Water requirement: ASTM C109
Effectiveness of mineral admixtures to control Alkai Silica Reactions (ASR): ASTM C441 Effectiveness of mineral admixtures to control sulphate reactions: ASTM C1012

SCOTT WILSON RPA www.scottwilson.com www.scottwilsonmining.com
16-5
Two samples of metakaolin (WMC and WM1) produced on two separate pilot runs
by WRI were tested. Both samples were produced from the Gollier Creek kaolin. The
results of the test work are summarized in Tables 16-1 and 16-2.
TABLE 16-1 CHEMICAL ANALYSIS COMPARISON Whitemud Resources Inc. – Gollier Creek Kaolin Project
Element Oxide (%) WMC WM1
SiO2 62.1 60.5 Al2O3 31.9 33.0 Fe2O3 1.35 1.40 MgO 0.45 0.42 CaO 0.38 0.16 Na2O 0.13 0.11 K2O 1.31 1.35 P2O5 0.04 0.03 MnO 0.01 0.01 Cr2O3 0.02 0.02 V2O5 0.03 0.03
C 0.05 0.02 Total Alkali 0.99 1.00
LOI 0.86 0.86
XRD patterns showed no discernable differences in the mineralogical composition of
the two materials.

January 2008 Source: Whitemud Resources Inc., 2006.
Whitemud Kaolin Project
Consultec Mass Balance
Whitemud Resources Inc.
Saskatchewan, Canada
Figure 16-2
16-6
SCOTT WILSON RPA www.scottwilson.comwww.scottwilsonmining.com

SCOTT WILSON RPA www.scottwilson.com www.scottwilsonmining.com
16-7
TABLE 16-2 PHYSICAL PROPERTY TEST SUMMARY Whitemud Resources Inc. – Gollier Creek Kaolin Project
Test Test Method Test Results Specification
Requirement Density ASTM C188 WMC: 2510 kg/m3
WM1: 2630 kg/m3 N/A
Fineness ASTM C204 WMC: 1101 m2/kg WM1: 1164 m2/kg
Consistent with water demand and particle
size data
Fineness ASTM C430 WMC: <1% WM1: <1%
CSA A3001-03: max. 34%
ASTM C618: max. 34%
Particle Size Analysis Horiba Capa-700 WMC: 2.03 µ median WM1: 2.09 µ median
N/A
Increase in drying shrinkage of mortar
bar
ASTM C157 WM1: 0.0643 at 28 days
ASTM C618: 0.03% of control at 64 weeks
Soundness ASTM C151 WM1: 0.02% expansion (20% mix)
CSA A3001-03: 0.8% max for Type N
material ASTM C618: 0.8%
max for Type N material
Air entrainment of mortar
ASTM C311 WM1: 17% 18% air entrainment at minimal addition of air entraining agent
(AEA)
Strength activity index ASTM C311 WMC: 41.8 MPa @ 28 days
WM1: 50.6 MPa @ 28 days
CSA A3001-03: min. 75% of control for Type N material
ASTM C618: min. 75% of control for Type N material
Water requirement ASTM C109 WMC: 107%
WM1: 109% ASTM C618: max. 115% for Type N
material
Effectiveness of mineral admixtures to
control Alkali Silica Reactions (ASR)
ASTM C441 WM1: 99% based on 20% metakaolin in
mix
ASTM C618: max. 100% of control for
Type N material
Effectiveness of mineral admixtures to
control sulphate reactions
ASTM C1012 WM1: 0.0237% @ 4 months
Max. 0.1% @ 6 months for Type N
material

SCOTT WILSON RPA www.scottwilson.com www.scottwilsonmining.com
16-8
Tests of the performance of WRI’s metakaolin product in concrete mixes have been
conducted by AMEC Earth and Environmental, EBA Engineering, and CANMET
Materials Technology Laboratory. Test work has concentrated on the performance of
metakaolin in selected binary, ternary and quaternary concrete mix designs to determine
the optimum level of metakaolin addition in terms of property improvement and overall
cost reduction.
Selected test results are illustrated in Tables 16-3, 16-4, 16-5, and Figure 16-3.

SCOTT WILSON RPA www.scottwilson.com www.scottwilsonmining.com
16-9
TABLE 16-3 WRI METAKAOLIN EVALUATION - METAKAOLIN VS. SILICA FUME
Whitemud Resources Inc. – Gollier Creek Kaolin Project
Mix No.
Cement (kg)
Fly Ash (kg)
Silica Fume (kg)
Metakaolin (kg)
Slump (mm)
Conc. Temp
3 day (MPa)
7 day (MPa)
28 day (MPa)
56 day (MPa)
91 day (MPa)
Initial Set
(hrs)
Final Set
(Hrs) 2 204 60 0 36 80 17 15.9 30.2 40.8 45.3 48.3 6.0 7.9 10 204 60 36 0 80 17 16.5 25.3 41.3 45.0 45.3 6.6 9.0 11 221 60 0 19 70 17 18.4 28.0 39.6 41.7 46.7 5.9 7.9 12 221 60 19 0 80 17 20.3 29.4 47.1 49.4 52.7 6.4 7.8

SCOTT WILSON RPA www.scottwilson.com www.scottwilsonmining.com
16-10
TABLE 16-4 WRI METAKAOLIN EVALUATION - METAKAOLIN VS. FLY ASH
Whitemud Resources Inc. – Gollier Creek Kaolin Project
Mix Design Test Results Compressive
Strength (Mpa)
Mix No. Cement
(kg) Fly Ash (kg)
Metakaolin (kg)
Total Cementi-tious (kg)
Slump mm
Conc. Temp
3 day
7 day
28 day
Initial set hrs.
Final set hrs.
18 240 60 300 80 21.6 21.8 28.2 37.3 6.7 8.4 19 197 58 35 290 80 20.6 17.4 28.1 38.4 5.8 7.9 20 190 56 34 280 70 20.8 15.8 27.8 36.9 6.3 8.2 21 184 54 32 270 80 20.6 13.8 24.4 32.7 6.8 8.6
Mix No. Cement (kg)
Fly Ash (kg)
Metakaolin (kg)
Total Cementi-
tious (kg)
Slump mm
Conc. Temp
3 day
7 day
14 day
28 day
Control 240 60 300 80 21 19.6 25.8 31.3 39.0 Mix A1 204 60 36 300 80 21 18.2 32.5 40.6 43.3 Mix B1 204 60 36 300 80 21 16.4 28.8 36.4 39.7
Note 1) water reducer added at 280 mL/100 kg cementitious

TABLE 16-5 WRI KAOLIN EVALUATION -COMPARISON IN HPC BRIDGE DECK MIX VS. SILICA FUME Whitemud Resources Inc. – Gollier Creek Kaolin Project
Mix Design Test Results Mix No. Cement
(kg) Fly Ash Fume(kg)
SilicaFume(kg)
Meta-kaolin(kg)
Slump(mm)
Air (%) Conc. Temp
3 Day (MPa)
7 Day (MPa)
28 Day (MPa)
56 Day (MPa)
91 Day (MPa)
Avg. Coulomb
Rating 13 400 40 40 0 170 5.6 17 30.7 37.9 49.7 52.7 52.2 442 14 400 40 0 40 180 5.4 18 30.7 41.2 49.2 50.0 53.0 981
Note: All mixes contain: (1) water reducer @ 140 mL per 100 kg of cementitious; (2) superplasticizer @ 1200 mL per 100 kg cementitious; (3) air entraining agent to entrain specified air content
Compressive Strength Results
0
10
20
30
40
50
60
13 14
Mix #
Com
pres
sive
Str
engh
t (M
Pa)
3 day (MPa)7 day (MPa)28 day (MPa)56 day (MPa)91 day (MPa)
Water Demand
155160165170175180185190195200
13 14
Mix #
Mas
s (k
g)
Water (kg)
Chloride Ion Permeability
0
200
400
600
800
1000
1200
13 14
Mix #
Coul
ombs
Pas
sed
Mix Proportions
360380
400420440460
480500
13 14
Mix #
Mas
s (k
g)
Silica Fume (kg)Metakaolin (kg)Fly Ash (kg)Cement (kg)
SCO
TT
WIL
SON
RPA
www.scottwilson.com
www.scottwilsonm
ining.com
16-11

Reduction of ASR Expansion
Standard Test Method for Effectiveness of Mineral Admixtures in Preventing ExcessiveExpansion of Concrete Due to the Alkali-Silica Reaction (ASTM C441)
Tests by AMEC EARTH & Environmental - 2005
Control
MK
0.14
*99.5% Reductionin Expansion withWhitemud
* With 20% WhitemudMK
0.04
0.06
0.08
0.10
0.12
0.00
0.02
January 2008 Source: Whitemud Resources Inc., 2006.
Whitemud Kaolin Project
WRI Test Results
Whitemud Resources Inc.
Saskatchewan, Canada
Figure 16-3
16-12
SCOTT WILSON RPA www.scottwilson.comwww.scottwilsonmining.com

SCOTT WILSON RPA www.scottwilson.com www.scottwilsonmining.com
16-13
WRI engaged CTL Group (CTL), a well known consulting firm specializing in
cement and concrete materials and technology, to conduct tests of WRI’s metakaolin
product. CTL conducted the following tests:
• Chemical analysis by X-ray fluorescence (XRF) • Particle size distribution (PSD) • Laboratory Concrete Testing
Fresh Properties: • Slump (ASTM C143) • Air content (ASTM C231) • Temperature (ASTM C1017) • Density (ASTM C138) • Setting Time (ASTM C403)
Hardened Properties: • Compressive strength (ASTM C39) • Rapid chloride permeability (ASTM C1202)
The results of the test work by CTL are detailed in Appendix 2.
CTL found that WRI’s metakaolin product had a slightly higher silica content than
commercially available materials, but this did not have a significant impact on the
performance of the material. When tested, WRI’s metakaolin product met the
compressive strength activity requirements of ASTM C618. When evaluated against a
competing product, PowerPozz, the WRI metakaolin had a similar water demand and 28-
day strength index values. Seven-day strength activity for the WRI material was about
7% lower, while at 28 days the strength activity indices of both metakaolin samples were
on a similar order of magnitude (Figure 16-4). Overall, CTL concluded that WRI’s
metakaolin product would be performance-competitive against existing metakaolin
products.

140
110
100
120
130
80
Whitemud A3K3106-4
105
100
95
90
85
110
120
115
Power PozzWhitemud A3K3106-4Power Pozz
Constant Flow Constant w/c
SA
I&
Wate
rD
em
an
d(%
Co
ntr
ol)
Flo
w,m
m
Legend:
7-Day SAI Water Demand 28-Day SAI Flow (Control = 128)
January 2008 Source: Whitemud Resources Inc., 2006.
Whitemud Kaolin Project
WRI Kaolin vs. U.S. Competitor
ASTM C 311 Strength Activity Index (SAJ)Standard (constant flow) vs. Modified (constant w/c)
Whitemud Resources Inc.
Saskatchewan, Canada
Figure 16-4
16-1
4
SC
OT
TW
ILS
ON
RP
Aw
ww
.scottw
ilson
.com
ww
w.sco
ttwilso
nm
inin
g.co
m

SCOTT WILSON RPA www.scottwilson.com www.scottwilsonmining.com
16-15
In summary, the test work conducted on WRI’s metakaolin product shows that:
• Metakaolin performs equivalently to silica fume in a ternary mix with fly ash and cement in terms of slump, concrete temperature, initial set time and final set time. Compressive strength at 3, 7, 28, 56 and 91 days is comparable for equivalent additions of silica fume or metakaolin. At equivalent addition rates, water demand is reduced with the use of metakaolin versus silica fume.
• In a High Performance Concrete (HPC) bridge deck mix design using fly ash
and silica fume, metakaolin provided equivalent compressive strength and water demand. At an 8% addition rate, chloride ion permeability was higher for metakaolin than for silica fume but still well within the limits for low permeability concrete (Note: other data indicate equivalent permeability for mixes without fly ash but equivalent silica fume or metakaolin addition).
• Metakaolin addition can reduce the total cementitious requirement by up to
20% with equivalent 28 day compressive strength and set times.
• Metakaolin can significantly reduce expansion due to adverse alkali-silica reactions.
• WRI’s metakaolin is performance-competitive versus commercially available
product.

SCOTT WILSON RPA www.scottwilson.com www.scottwilsonmining.com
17-1
17 MINERAL RESOURCE AND MINERAL RESERVE ESTIMATES
Mineral resource and mineral reserve estimates have been prepared for WRI’s kaolin
resources based on the following considerations:
• Topographic surfaces have been modelled from LIDAR topographic data supplied by WRI.
• Drill hole coordinates for Ekaton drill holes have been obtained from the drill
hole data base for the Ekaton drill programs conducted in the 1980s. Coordinates were originally determined by geographic reference to known bench marks, were not surveyed in, and recorded on 1:1,000 to 1: 10,000 maps. Coordinates have been transformed to UTM coordinates (NAD 83 datum) based on the available Ekaton map and drill log data. Drill hole coordinates for the 2006 drill program were determined using a hand held GPS unit (Garmin eTrex Legend C).
• Collar elevations of Ekaton drill holes used in the resource calculation have
been adjusted to conform to the surface elevations determined by the LIDAR topographic data for the Gollier Creek area. Collar elevations for the balance of the Ekaton drill holes have been adjusted to conform to the elevations determined from digitizing elevations obtained from NTS 1:50 000 maps of the permit areas. Collar elevations for the 2006 drill program have been determined using a hand held GPS and cross-referenced to the LIDAR topographic data.
• Lithological strata elevations for all Ekaton drill holes have been taken from
the Ekaton drill logs as relogged for WRI by Chris Curry, P. Geo. • Lithological strata elevations for the 2006 drill holes were determined by
Lynn Kelley, P. Geo., WRI’s Manager of Geology and Exploration. • Data for wt% -325 mesh material within the kaolinized sediments of the
Whitemud Formation for drill holes have been obtained from Ekaton assay data (based on two-foot sample intervals) and from assays of selected Ekaton drill holes by WRI (based on 4 foot sample intervals) and on four foot intervals for holes from the 2006 drill program. Comparisons of wt% -325 mesh and -10 µm material for individual drill holes are based on a combination of Ekaton data (-10 µm) and/or Ekaton and WRI data (-325 mesh).

SCOTT WILSON RPA www.scottwilson.com www.scottwilsonmining.com
17-2
• Semivariogram analysis has been used to define a zone of influence of 200 m for average grade continuity (% - 44 microns) around each drill hole.
• A 50 m setback from the crest of stream valleys has been assumed. • An in-situ bulk specific gravity of 2.01 tonnes/m3 for both overburden and
kaolinized material has been assumed based on a 15% moisture content. • Block modelling has been conducted using Gemcom software.
Similar procedures have been utilized in developing the resources estimates based on
the 2007 drill program.
2006 MINERAL RESOURCE ESTIMATE
The mineral resource estimates were prepared for the Gollier Creek, Project 12, and
Wood Mountain lease areas. Estimates were developed only for those portions of each
area within a 200 m radius of an adjacent drill hole. Resource estimates for the Gollier
Creek lease area were based on grade data obtained from particle size analysis of drill
core. Deposit depths and overburden thickness were determined from the drill log data to
interpret the thickness of the Whitemud Formation and overburden, with topographic data
from the LIDAR survey used to establish the surface elevations.
The 2006 resource estimates for the Project 12 and Wood Mountain lease areas are
based on an assumption of 30% -44 micron material in the ore. Resource boundary limits
were set at 200 m beyond the outsidemost holes not exceeding a 400 m distance from
each other. Top and bottom surfaces for the ore body (kaolinized sand) were taken from
the (Kaolin Sand 1) lithological descriptions in the drill logs as prepared by Chris Curry,
P. Geo. Overburden was taken from the “Kaolin Sand 1” lithology intervals and the
distance below the drill collars. Vertical surfaces between the outside limit of the holes
and the top and bottom surfaces were used to create a solid.

SCOTT WILSON RPA www.scottwilson.com www.scottwilsonmining.com
17-3
PROJECT 12 AND WOOD MOUNTAIN AREAS Inferred Resource estimates for the Project 12 and Wood Mountain areas were
developed based on the methodology outlined above (Table 17-1).
TABLE 17-1 INFERRED MINERAL RESOURCES - WOOD MOUNTAIN AND PROJECT 12 AREAS
Whitemud Resources Inc. – Gollier Creek Kaolin Project
Area Volume (‘000 m3)
In-situ Specific
Gravity (t/m3)
Inferred Resource
(‘000 t)
Calculated Stripping
Ratio
Kaolin Content @ 30% - 44 micron
(‘000 t) Project 12 31,075 2.01 62,460 1.79:1 18,378 Wood Mountain
4,393 2.01 8,830 2.29:1 2,649
Total 35,468 2.01 71,290 1.85:1 21,387
As described above, mineral resource estimates were developed only for those
portions of each area within a 200 m radius of an adjacent drill hole, and for which
quantitative data on particle size were available. In the case of the Wood Mountain
Block, only two historic drill holes met those criteria. Therefore, the Scott Wilson RPA
estimate for the Wood Mountain block is much smaller than the resource (non NI 43-101
compliant) estimated by Ekaton, who used a greater number of widely spaced drill holes.
GOLLIER CREEK AREA RESOURCES
The mineral resources and mineral reserves defined for the Gollier Creek area are
contained in Section 17, Twp. 5, Range 2 W3M and Section 18, Twp. 5, Range 2 W3M.
Figure 17-1 plots the locations of the drill holes used in the analysis and outlines the
resource area within the 200 m limit of the drill holes. Using the identified Whitemud
Formation thicknesses from the drill hole data, the particle size analysis for the drill holes
and an in-situ specific bulk density of 2.01, the total Measured and Indicated kaolinized
resources within the area were estimated, as of December 2006, to contain 96.36 million
tonnes grading 40.77% minus 325 mesh material. The calculated stripping ratio was
1.27:1.

SCOTT WILSON RPA www.scottwilson.com www.scottwilsonmining.com
17-4
Figure 17-2 details the stripping ratio contours for the outlined resource area and the
50 m setback from the brow of the Gollier Creek valley. Applying a constraint of a
maximum 3:1 waste:ore stripping ratio and the 50 m setback from the brow of the valley
results in development of three distinct pits, as illustrated in Figure 17-3. These pits are
termed the West Pit, North Pit, and East Pit. Resource estimations for these three pits are
summarized in Table 17-2. Resources contained within each pit are classified as a
Measured Resource.
TABLE 17-2 MINERAL RESOURCE ESTIMATES - GOLLIER CREEK DEPOSITS – 2006 DRILLING
(based on maximum 3:1 stripping ratio)
Whitemud Resources Inc. – Gollier Creek Kaolin Project
Pit Overburden Tonnage and Grade1
Strip Ratio Resource Classification
West Pit 71.8 MM tonnes 52.9 MM tonnes @ 40.80%
1.36:1 Measured Resource
North Pit 13.2 MM tonnes 13.2 MM tonnes @ 36.78%
0.99:1 Measured Resource
East Pit 18.2 MM tonnes 8.0 MM tonnes @ 41.36%
2.28:1 Measured Resource
1 based on wt% -325 mesh material in ore
The available stripping ratio data indicated it would be possible to link up the North
and East Pits with additional drilling. Two additional holes were recommended, as shown
in Figure 17-4.
2006 MINERAL RESERVES
A pre-feasibility financial analysis of mining and processing ore from the West Pit
indicates that the Project will be economically viable based on the estimate and
assumptions applied. Details of the financial analysis are provided in Item 18 of this
report. Based on the positive pre-feasibility study, Scott Wilson RPA would classify the
Measured Mineral Resources of the West Pit as Proven Reserves containing 52.9 million
tonnes of kaolinized ore at a grade of 40.8% -325 mesh material. The calculated stripping
ratio is 1.36.

SCOTT WILSON RPA www.scottwilson.com www.scottwilsonmining.com
17-5
2007 MINERAL RESOURCE ESTIMATE
Estimates of mineral resources based on the 2007 drilling program were prepared by
WRI using the Surpac Quarry software, version 6.01. Estimates were based on a search
ellipse of 400 m. In certain cases, a search ellipse of 500 m was used and a 30% nominal
grade of -45 micron kaolin used for drill holes for which core recovery was poor. The
results from these holes were then recalculated using a 400 m search ellipse. Scott Wilson
RPA has reviewed the mineral resource estimate methodology and assumptions with
WRI and is in agreement with the procedures and the results.
Independently, Scott Wilson RPA utilized Gemcom software to estimate the quantity
and grade mineral of resources identified by the 2007 drill program. The identified
additional resource areas and estimates of tonnage and grade are illustrated in Figure 17-
5. The results of Scott Wilson RPA’s estimation closely match WRI’s results and are
summarized in Table 17-3.
TABLE 17-3 MINERAL RESOURCE ESTIMATE BASED ON THE 2007 DRILLING PROGRAM
Whitemud Resources Inc. – Gollier Creek Kaolin Project
Category and Property Area Grade, % - 325 mesh Tonnage (Mt) Measured Resources
Elm Springs Deposit W. Extension of West Pit
East Bridge Pit Total Measured
43.00 45.10 40.30 43.62
23.5 29.1 8.6
57.0
Indicated Resources N. Extension of West Pit
37.8
27.8
Total Meas. + Ind. 41.80 89.0
MINERAL RESOURCE AND MINERAL RESERVE SUMMARY
The estimated mineral resources and mineral reserves contained on WRI’s properties
are summarized in Tables 17-4 and 17-5.

SCOTT WILSON RPA www.scottwilson.com www.scottwilsonmining.com
17-6
TABLE 17-4 MINERAL RESOURCE ESTIMATE SUMMARY Whitemud Resources Inc. – Gollier Creek Kaolin Project
Category and Property
Area Grade, % - 325 mesh Tonnage (Mt)
Measured Resources West Pit 40.80 52.9 North Pit 36.78 13.2 East Pit 41.36 8.0
Elm Springs Deposit W. Extension of West Pit
East Bridge Pit Total Measured
43.00 45.10 40.30 41.72
23.5 29.1 8.6
135.3
Indicated Resources N. Extension of West Pit
37.8
27.8
Total Meas. + Ind. 41.05 163.1 Inferred Resources
Project 12 30% 62.46 Wood Mountain 30% 8.83
Total Inferred 30% 71.29 Notes:
1. CIM definitions were followed for mineral resources. 2. Mineral resources are estimated based on wt% -44 micron fraction in ore 3. Mineral resources are estimated using an average long-term price of C$ 209 per tonne
metakaolin and a US$/C$ exchange rate of 1.13. 4. Indicated Mineral Resources are inclusive of Mineral Reserves. 5. Bulk density is 2.01 t/m3. 6. Indicated Resources are net of adjustment for environmental consideration.
The North Pit, East Pit and East Bridge Pit can be combined as one resource area
containing Measured Resources of 29.7 million tonnes grading 39.02% -44 micron
kaolin.

SCOTT WILSON RPA www.scottwilson.com www.scottwilsonmining.com
17-7
TABLE 17-5 MINERAL RESERVE ESTIMATE – WEST PIT Whitemud Resources Inc. – Gollier Creek Kaolin Project
Category Grade, % - 325 mesh Tonnage (Mt)
Proven 40.80 52.9
Notes:
1. CIM definitions were followed for mineral reserves. 2. Mineral reserves are estimated based on wt% -44 micron fraction in ore 3. Mineral reserves are estimated using an average long-term price of C$ 209 per tonne
metakaolin and a US$/C$ exchange rate of 1.13. 4. Bulk density is 2.01 t/m3.
The resource estimates for the Project 12 and Wood Mountain areas are applicable for
only a portion of the lease areas. Infill drilling and particle size analysis data for all drill
holes are required to better estimate the contained mineral resources for the full extent of
these properties.

Whitemud Resources Inc.Kaolin Project
Dril Hole Locations and200m Block Model Limit - 2006 Resource
SCOTT WILSON RPAGEOLOGICAL AND MINING CONSULTANTS
55 University Avenue, Suite 501Toronto, Ontario M5J 2H7
SCOTT WILSON RPA
Figure 17-1
111
119
129
131
134 135136
137
148
150
151
152
154
160
161
163
165
168 169
247
249
250
61
6263
65
69
70
8485
87
2006-A08
2006-B22
2006-B25
2006-B26
111
119
131
134 135136
137
154
161168 169
107
108 109 110 112
113114
115
116117118
120
121
122
123
124
125126
127
128
130132
133
138
139140
141
142
143 144 145
146
147
149
153
155
156
157
158
159
162
164
166
167
170 171
172173
174
175
218219
220221
222223
86
2006-A01
2006-A02
2006-A03
2006-A04
2006-A05
2006-A06
2006-A09
2006-A10
2006-A11
2006-B01
2006-B02
2006-B03
2006-B04
2006-B06
2006-B10
2006-B11
2006-B20
2006-B21
2006-B23
2006-B24
2006-B30
-200 0 200 400 600 800
Scale 1:20000
4080
0 0 E
4090
0 0 E
4100
0 0 E
5470000 N
5471000 N
5472000 N
5473000 N
www.scottwilsonmining.com
Holes with < 325 Data
Holes with WMUD Data Only
All Other Holes
www.scottwilson.com
17-8
January 2008

Whitemud Resources Inc.Kaolin Project
Dril Hole Locations andWest Pit Toe and Strip Ratio Contours
SCOTT WILSON RPAGEOLOGICAL AND MINING CONSULTANTS
55 University Avenue, Suite 501Toronto, Ontario M5J 2H7
SCOTT WILSON RPA
Figure 17-2
111
119
129
131
134 135136
137
148
150
151
152
154
160
161
163
165
168 169
247
249
250
61
6263
65
69
70
8485
87
2006-A08
2006-B22
2006-B25
2006-B26
111
119
131
134 135136
137
154
161168 169
107
108 109 110 112
113114
115
116117118
120
121
122
123
124
125126
127
128
130132
133
138
139140
141
142
143 144 145
146
147
149
153
155
156
157
158
159
162
164
166
167
170 171
172173
174
175
218219
220221
222223
86
2006-A01
2006-A02
2006-A03
2006-A04
2006-A05
2006-A06
2006-A09
2006-A10
2006-A11
2006-B01
2006-B02
2006-B03
2006-B04
2006-B06
2006-B10
2006-B11
2006-B20
2006-B21
2006-B23
2006-B24
2006-B30
0.
50
0.
50
0.50
0.
50
0.50
0.50
0 . 5
0
0.5
0
0.50
0.5
0
0 . 50
0.
5 0
0
. 50
0.
50
0.
5
0
0.
50
0 . 5 0
0.
50
0.
50 0.
50
0.
50
0 . 50
0.
5
0
0.
50
0.
5 0
0.50 0 . 5 0
0 . 50
0.50
0.50
0.
50
0 . 5 0
0 . 5 0
0 . 5 0
0 . 5 0
0.
50
0 . 50
0
. 50
0. 5 0
0 . 5 0
0.5
0
0.
50
0.50
0. 5 0
0.
50
0.50
0
.50
0.
50
0.
50
0.
50
0.50
0.
50
0.
50
0.50
0 .
50
0 . 5 0
0 . 5
0
0.
0.
5
0
0 . 5 0
0
.5
00.
50
0 . 50
0 . 5
0 0.5
0
0 . 5 0
0.
50
0 . 5 0
0.
50
0 .
50
0.
50
0.50
0
.5
00
0. 5
0
0.50
0.500.50
0.50
0.
50
0 . 5 0 0 .
50
0. 5
0
0
. 5 0
0.
50
0 . 5 0
0 . 5 0
0.
50
0 .5
0
0 . 5 0
0.
50
0.
50
0.
50
0.
5 00 . 5 0 0
.5
00
.5
0
0 . 5 0
0.5
0
0.5
0
0 . 5 0
0.
50
0.
5
0
0.5
0
0.500.50
0 . 50
0.50
0.50
0 . 5 0
0.50
0.5
0
0.
50
0.
50
0.5
0
0.
5 0
0.
50
0.50
0
0.50
1.
00
1.
00
1
.
0
0
1.00
1.00
1.00
1
.0
0
1 . 0 0
1.
00
1.00
1.
0
0
1.0
0
1.00
1.00
1.00
1
.00
1.0
0
1.
00
1.
00
1.
00
1 . 0 0
1.
00
1.
00
1 . 0 0
1.
0 0
1.0
0
1 . 0
0
1
.001.00
1.
00
1.
00
1.00
1.00
1
.00
1.
001
.00
1.00
1.
0
0
1.
00
1.
00
1. 00
1.00
1.00
1.00
1.00
1.
00
1
.00
1.
00
1.0
01
.0
0
1.00
1
.00
1
. 00
1 . 0 0
1.
00
1.
00
1.
00
1.
00
1.
00
1.
00
1.
00
1.
00
1.0
0
1.
00
1 . 0 0
1.0
0
1
.
0 0
0
1.
00
1.
00
1.0
0
1.
00
1.
00
1. 0
0
1
.00
1.
0
0
1.
00
1.
00
1. 0
0
1.
00
1
.
1.00
1
.0
0
1.
00
1.00
1.
00
1.
0 0
1.0
0
1.
0 0
1.
0
0 1 . 0 0
1.00 1
.00
1.0
0
1
.
00
1.
0
0
1
1.
00
1.
00
1.
00
1 . 0
0
1.
00
1
.00
1
.00
1.
0 0
1 . 0 0
1.
00
1 . 5 0
1.
50
1 . 5
0
1.50
1
.50
1.5 01
.5
0
1.50
1.
50
1.50
1.
50
1.50
1.
50
1.50
1.5
0
1.
50
1 . 5 0
1 . 5 0
1. 5 0
1 . 5 0
1. 5 0
1
.
50
1.50
1.50
1.50
1.50
1.
50
1.50
1.50
1.5
0
1.50
1.50
1.50
1.
50
1.
50
1.
50
1.
50
1 . 5 0
1
.
5
0
1
. 5 01.50
1.50
1.
50
1.
5 0
1.50
1.5
0
1 . 5 01
.5
0
1.
50
1.
50
1.
50
1
.501
.5
0
1.5
01.
50
1.50
1.50
1.
50
1.
50
1
. 5 0
1 .
5
1.
50 1
. 50
1.50
1.
5 0
1.
50
1.
50
1.
50
1. 5
0
1.
50
1.
50
1.5
0
1.
50
1.50
1.
50
1.
50
1.
50
1.
5
0
1.
50
1.
5 0
1 . 5 0
1 . 5 0
1.50
1.
50
1
. 5 0
1
.5
0
1. 50
1.
50
2.
00
2.
00
2.
00
2.
00
2.00
2.00
2.
00
2.
00
2.002.00
2.00
2.
0
0
2.00
2.00
2.
0
0
2.00
2.
00
2 . 0 0
2.
00
2 . 0 0
2 . 0 02 .
00
2.00
2.
0
0
2.00
2.
00
2.00
2.00
2.00
2
.00
2.00
2.00
2.00
2.00
2.00
2.00
2.00
2
. 0 0
2.
00
2
.00
2 . 00
2
. 0 0
2.
00
2
.
0
0
2.0
0
2 . 0 02
.0
0
2 .00
2.0
0
2.
0 0
2.00
2.
00
2.
00
2
.
2
.0 0
2
.00
.0
0
2 . 0 0
2.
00
2.
50
2 . 5 0
2.
50
2.
50
2.50
2.50
2
.50
2.50
2.50
2.
50
2.
50
2.50
2.
50
2.
50
2.50
2.
50
2.50
2
.50
2.
50
2.
50
2 .
50
2.
50
2.
50
2.502.50
2
.50
2.
50
2 . 5 0
2.
50
2.50
2.
50
2.50
2 . 5 0
2.
50
2.
50
2.
50
2
.5
0
2. 5 0
2.50
2.50
2.
5
0
2.
50
2
.50
2.50
2.
50
2.
5 0
2.
5
0
2. 5 0
2 . 5 0 2 . 5 0
2.
50
2.50
2.5
0
3.
00
3.
00
3.00
3.0
0
3.
00
3.00
3.00
3
.00
3.00
3.0
0
3.
00
3.00
3.0
03.
00
3.
00
3.0
03
.0
03
.0
0
3.0
0
3.
00
3 . 0
3.
00
3 . 0 0
3.
00
3.00
3
.0
0
3.00
3.
00
3.
00
3 . 0 0
3.
00
3
.0
0
3.
00
3 . 0
0
3.0
3.00
3.
00
3.
00 3
.0
0
3
.0
0
3.
0 0
3.
00
3.00
3. 0 0
3.00
3. 0 0
3 . 0 0
3.00
3.
50
3.
50
3.50
3.5
0
3.50
3.5
0
3.50
3.50
3
.5
0
3.50
3.
50
3.50
3.
503
.5
0
3.
50
3.
50
3.
50
3.
50
3.50
3.50
3 . 5 0
3
.
5
3.
50
3.
50
3. 5 0
3.
50
3.
5 0
3
3.5
0 3.
50
3.5
0
3.50
3 . 5 0
3.
50
4.
00
4.00
4.0
0
4.00
4.
00
4.00
4.
00
4.00
4.
00
4.
00
4.
00
4.00
4.00
4.00
4.
00
4.
00
4.
00
4.0
4.
00
4.00
4 . 0 0
4.00
4.00
4
. 0 0
4 . 0 0
4.00
4.
00
4.00
4 . 0 0
4.
50
4.
50
4.
50
4.
50
4.
50
4.50
4 . 5 0
4. 5 0 4
. 5
0
4.50
4 .5
0
5.00
5.
00
5.
0 5.
00
5.
00
5.00
5 . 00
5.
00
5.
00
5.50
5.
50
5.
5.
50
5.
5
0
5.50
5.
50
5.
50
6.00
6.
00
6.
00
6.
00
6.
00
6.
00
6.
00
6.50
6 . 5 0
6
6.
50
6.
50
6.
5 0
7.
00
7.
00
7.
00
7.0
7
.5
0
7.
50
7.50
8.
00
8.00
8.
50
8.5
0
9
.0
0 9.
501 0 . 0 0
-200 0 200 400 600 800
Scale 1:20000
4080
0 0 E
4090
0 0 E
4100
0 0 E
5470000 N
5471000 N
5472000 N
5473000 N
www.scottwilsonmining.com
Holes with < 325 Data
Holes with WMUD Data Only
All Other Holes
www.scottwilson.com
17-9
January 2008

Whitemud Resources Inc.Kaolin Project
Resource and Pit Outline2006 Drill Program
SCOTT WILSON RPAGEOLOGICAL AND MINING CONSULTANTS
55 University Avenue, Suite 501Toronto, Ontario M5J 2H7
SCOTT WILSON RPA
Figure 17-3
-200 0 200 400 600 800
Scale 1:20000
4070
0 0 E
4080
0 0 E
4090
0 0 E
4100
0 0 E
5470000 N
5471000 N
5472000 N
5473000 N
5474000 N
www.scottwilsonmining.com
West Pit
Overburden = 71.8 mt
Ore = 52.9 mt @ 40.80%
Strip Ratio = 1.36
North Pit
Overburden = 13.2 mt
Ore = 13.2 mt @ 36.78%
Strip Ratio = 0.99
Strip Ratio = 2.28
Ore = 8.0 mt @ 41.36%
Overburden = 18.2 mt
East Pit
www.scottwilson.com
17-10
January 2008

Whitemud Resources Inc.Kaolin Project
Fill-in Holes and Expanded Resource Limit2006 Drill Program
SCOTT WILSON RPAGEOLOGICAL AND MINING CONSULTANTS
55 University Avenue, Suite 501Toronto, Ontario M5J 2H7
SCOTT WILSON RPA
Figure 17-4
111
119
129
131
134 135136
137
148
150
151
152
154
160
161
163
165
168 169
247
249
250
61
62
65
69
70
84
2006-A08
2006-B22
2006-B25
2006-B26
111
119
131
134 135136
137
154
161168 169
107
108 109 110 112
113114
115
116117118
120
121
122
123
124
125126
127
128
130132
133
138
139140
141
142
143 144 145
146
147
149
153
155
156
157
158
159
162
164
166
167
170 171
172173
174
175
218219
220221
222223
86
2006-A01
2006-A02
2006-A03
2006-A04
2006-A05
2006-A06
2006-A09
2006-A10
2006-A11
2006-B01
2006-B02
2006-B03
2006-B04
2006-B06
2006-B10
2006-B11
2006-B20
2006-B21
2006-B23
2006-B24
2006-B30
-200 0 200 400 600 800
Scale 1:20000
4070
0 0 E
4080
0 0 E
4090
0 0 E
4100
0 0 E
5470000 N
5471000 N
5472000 N
5473000 N
5474000 N
www.scottwilsonmining.com
Fill-in Holes
ExpandedResource
Limit
www.scottwilson.com
17-11
January 2008

5,470,000 N
5,471,000 N
5,472,000 N
5,473,000 N
5,474,000 N
5,475,000 N
5,476,000 N 406,0
00
E
407,0
00
E
408,0
00
E
409,0
00
E
410,0
00
E
411,0
00
E
5,470,000 N
5,471,000 N
5,472,000 N
5,473,000 N
5,474,000 N
5,475,000 N
5,476,000 N
ELM SPRING DEPOSIT23.5 MMt @ 43.0%
Measured
NORTH PIT13.2 MMt @ 36.8%
Measured
EAST PIT8.0 MMt @ 41.4%
Measured
EAST PIT BRIDGE8.6 MMt @ 40.3%
Measured
N EXTENSION OF W PIT27.8 MMt @ 37.8%
Indicated
W EXTENSION OF W PIT29.1 MMt @ 45.1%
Measured
WEST PIT52.9 MMt @ 40.8%
Measured ResourceProven Reserve
Process Plant
Processing Plant
Legend:
Areas added to December 2007 Resource Inventory
Areas included in 2006 Resource Inventory
0 250
Metres
500 750 1000
N
January 2008
Whitemud Kaolin Project
Expanded Resource Limit2007 Drill Program Results
Whitemud Resources Inc.
Saskatchewan, Canada
Figure 17-5
SCOTT WILSON RPA
17-12
www.scottwilson.comwww.scottwilsonmining.com

SCOTT WILSON RPA www.scottwilson.com www.scottwilsonmining.com
18-1
18 OTHER RELEVANT DATA AND INFORMATION MINING OPERATIONS
WRI commissioned Hatch Energy to prepare a pre-feasibility estimate for the design
and construction of a kaolin processing plant to produce 200,000 tpa of product
consisting of 175,000 tpa metakaolin and 25,000 tpa kaolin (Phase I). The scope of work
provided for analysis of equipment requirements and additional capital expenditures to
expand annual production to 350,000 tonnes metakaolin and 25,000 tonnes kaolin (Phase
II). Hatch Energy was also requested to provide preliminary estimates of the capital costs
for increasing production to 700,000 tonnes metakaolin and 25,000 tonnes kaolin by
duplicating the Phase II plant design.
The Hatch Energy estimates were prepared as Class IV estimates with an approximate
accuracy of +30%/-15% and a 20% contingency factor for Phase I. The capital cost
estimate for Phase II was based on a Class V estimate with an approximate accuracy level
of +50%/-30% and a 25% contingency to cover project risk. The estimate of costs for
doubling production capacity assumed capital costs would be twice the required capital
for construction of the Phase I and Phase II plants.
WRI also engaged Consultec Ltd. (Consultec) to review the process engineering
design and to prepare mass and energy balances for the Project, and to develop operating
cost estimates for the Project for both Phase I and Phase II. The process flow sheets and
mass balance were reviewed and checked against the proposed equipment capacities.
Heat balance calculations were conducted to establish energy requirements. Operating
cost estimates for labour, materials, energy and consumables as estimated by WRI were
reviewed by Consultec for reasonableness, accuracy and completeness.
Scott Wilson RPA is of the opinion that the accuracy of the capital cost and operating
cost estimates prepared by Hatch Energy and Consultec and the engineering review of the

SCOTT WILSON RPA www.scottwilson.com www.scottwilsonmining.com
18-2
process design conducted by Consultec are suitable for a preliminary feasibility study to
establish the economic viability of the Project.
Scott Wilson RPA has prepared a mining plan and developed mine operating costs for
the Project. Scott Wilson RPA has utilized the results of the Hatch Energy and Consultec
reports and its own work to complete an economic analysis for the Project using
discounted cash flow analysis. A sensitivity analysis of return on investment and net
present value incorporating changes in capital cost, operating costs and revenues has been
conducted.
PROJECT DESCRIPTION
WRI’s Gollier Creek Project is based on an initial production rate of 200,000 tpa of
product consisting of 175,000 tpa metakaolin and 25,000 tpa kaolin. Initial production is
scheduled for Fall 2007. WRI is planning to ramp up production to 350,000 tpa
metakaolin and 25,000 tpa kaolin by 2010. This will require construction of a two-stage
preheater tower and associated materials handling facilities in 2009. Further expansion to
700,000 tpa metakaolin and 25,000 tpa kaolin is planned for 2013 by duplicating the
plant. Production from the plant will be shipped using bulk rail and bulk truck. It is
anticipated a limited amount of kaolin may be shipped in bulk bag format.
Quarrying operations will be in SE 18-05-02-W3M and NE 18-05-02-W3M, with the
processing plant located in SE 18-05-02-W3M in the Gollier Creek lease block. The
proposed facilities are located approximately nine kilometres from Wood Mountain on
land that currently has mixed use as natural and tame-grass pasture and cultivated
farmland. Site preparation for the plant has been initiated and deposits have been placed
on major equipment. Production start-up is planned for late 2007.
The proposed quarry will be developed as a conventional open pit mine using
excavators and ore haul trucks. A contractor operated mine is planned. Ore will be hauled
to the processing plant where it will be crushed, screened, dried and the kaolin separated
from the quartz sand. Kaolin will then either be calcined under controlled conditions in a

SCOTT WILSON RPA www.scottwilson.com www.scottwilsonmining.com
18-3
lignite-fired rotary kiln to produce metakaolin, or directly conveyed to storage. Process
plant operations will be entirely dry.
Quartz sand recovered from the drying and separation processes will be returned to
the pit as tailings and compacted prior to regrading with overburden. It is anticipated that
a small amount of sand will be sold into local markets. It is anticipated that site
rehabilitation will proceed in parallel with the quarrying operations, consistent with the
requirement to permit efficient operation of both the quarrying and site rehabilitation
operations.
WRI has received environmental approval for the proposed mine and Phase I process
plant. WRI has completed pre-stripping operations and placed in stockpile approximately
100,000 tonnes of ore. The process plant was approximately 98% complete as of
December 17, 2007, with commissioning scheduled to start in January 2008. Commercial
shipments are anticipated to begin in late February or early March, 2008.
Figure 18-1 illustrates the development schedule for the Project. Figure 18-2 shows
the plant as of December 17, 2007.
QUARRYING
The kaolin ore occurs in strata which include overburden layers of soil, occasional
gravel beds, thin coal seams, and ball clay. To facilitate quarrying, the ore will be
exposed by stripping the various layers of overburden above the kaolin seam using
conventional earthmoving equipment. The development of the quarry will proceed in a
rational, planned manner that will support long-term harvesting of the kaolin ore along
with coincident progressive reclamation of mined out and backfilled areas.

January 2008 Source: Whitemud Resources Inc., 2006.
Whitemud Kaolin Project
Development Schedule
Whitemud Resources Inc.
Saskatchewan, Canada
Figure 18-1
18-4
SC
OT
TW
ILS
ON
RP
Aw
ww
.scottw
ilson
.com
ww
w.sco
ttwilso
nm
inin
g.co
m

SCOTT WILSON RPA www.scottwilson.com www.scottwilsonmining.com
18-5
FIGURE 18-2 PROCESS PLANT AS OF DECEMBER 17, 2007
Quarrying will commence in the NE 18-5-2-3 and the SE 18-5-2-3 in the area of
lowest stripping ratio and progress in a northwesterly direction to optimize resource
recovery in the Gollier Creek lease area. Towards the end of the mine life, quarrying will
move in a southeasterly direction into areas with a higher stripping ratio. The indicated
mine plan cut schedule is illustrated in Figure 18-3. Figure 18-4 illustrates the general
progression of the mine and development of haulage roads.
The configuration of the quarry is determined by the geology of the ore body and
material handling logistics. The methods of quarrying and quarry development are
governed mainly by economic considerations. The quarry will be an open pit operation
with the earth materials excavated and transported using conventional earth moving
equipment. An overview of the quarry operations includes the following elements:

SCOTT WILSON RPA www.scottwilson.com www.scottwilsonmining.com
18-6
• At full Phase 1 capacity, the quarry must provide approximately 695,000 tonnes of ore to the processing plant annually, or about 1,900 tpd. Following processing, approximately 390,000 tonnes of sand tailings must be returned to the quarry. These indicated volumes will approximately double by 2011 when full Phase II production capacity is reached. By 2013, ore requirements and tailings disposal requirements will double again when capacity reaches 700,000 tpa metakaolin. To accomplish this, continuous stripping, quarrying, tailings disposal and reclamation operations in the quarry will be required.
• The quarrying will be done in long strips, generally in three benches,
depending on the thickness of the ore bed. Ore preparation will take place near the plant, and a 15,000 tonne ore stockpile will be maintained at the plant.
• The quarry will be worked in a series of roughly parallel cuts to create an
“open pit” similar to the methods utilized in the strip-mining operations in the coalfields of southern Saskatchewan, but on a smaller scale. The quarry will be opened with a “box cut” where the topsoil and overburden is stockpiled outside the pit to facilitate mining of the ore in the “box cut.” This overburden stockpile would not be immediately reclaimed since it will not be replaced into the quarry. The initial plan is to place the overburden stockpiles to the west of the plant yard to act as a wind barrier for the plant.
• Subsequent cuts, or “turnover cuts”, will be initiated by stripping and
stockpiling topsoil and overburden. These materials will be transported across the pit and used to cover the sand tailings and reclaim the “quarried-out” portion of the pit. In this manner, a continuous operation of stripping, excavation of ore, deposition and cover of sand tailings and reclamation of the pit will be sustained on a long-term basis.
• The final “turnover cut” in any quarrying block will not be backfilled, but will
remain as a depression or trench that becomes a ponding area for runoff and seepage.
• The rate of land disturbance will be governed by plant production and ore
characteristics. It is estimated that the annual rate of land disturbance and reclamation will range between about 6 ha and 10 ha (approximately 15 acres to 25 acres).
• The dry fine sand tailings will be susceptible to wind erosion. To mitigate
this, the active tailings disposal will be limited to an area as small as practicable and the sand will be covered with overburden as quickly as possible to stabilize the surface.

SCOTT WILSON RPA www.scottwilson.com www.scottwilsonmining.com
18-7
Stripping and quarrying operations will be conducted under contract. WRI intends to
employ two contractors, one for stripping and site rehabilitation, and one for quarrying
and ore transport. The current mine plan provides for overburden removal, quarrying and
rehabilitation to take place on a 5 day/week, 2 shift per day basis. Tailings will be placed
in the pit by both the overburden contractor, as well as WRI staff operating one of the
haul trucks during the night shift.

Whitemud Resources Inc.Kaolin ProjectWest Pit Cuts
Planview
SCOTT WILSON RPAGEOLOGICAL AND MINING CONSULTANTS
55 University Avenue, Suite 501Toronto, Ontario M5J 2H7
Figure 18-3
-200 0 200 400 600 800
4070
0 0 E
4080
0 0 E
4090
0 0 E
4100
0 0 E
5470000 N
5471000 N
5472000 N
5473000 N
www.scottwilsonmining.com
Box Cut 1aBox Cut 1
a
Box Cut 2
Cut 53
Cut 54
Cut 60
Cut 64
Cut 2Cut 3
Cut 10
Cut 20
Cut 20
Cut 30
Cut 40
Cut 50
8-8
January 2008
www.scottwilson.comSCOTT WILSON RPA

December

SCOTT WILSON RPA www.scottwilson.com www.scottwilsonmining.com
18-10
MINE SCHEDULE Scott Wilson RPA has developed a mine schedule based on GEMCOM software
modeling of the deposit. Volumes of overburden and ore are calculated and converted to
tonnes assuming a specific density of 2.01 tonnes per cubic metre. Ore grades for each
ore block are based on percent -325 mesh for the relevant interval as obtained from the
sampling results. Process recovery factors for kaolin and metakaolin obtained from the
metallurgical test work are used in conjunction with the sales forecast to estimate the
required run-of-mine ore tonnage, associated overburden, and tailings tonnage for each
cut and for each production year.
Based on the estimated 52.8 million tonnes of proven reserves and the projected sales
tonnages, the mine has an estimated production life of 25.4 years. The projected mine
schedule is detailed in Table 18-1.

Whitemud Resources Inc. - Gollier Creek Kaolin Project
ROM Kaolin ROM Ore Contained Overburden Total MineYear Ore (t) Mined (t) Kaolin Feed (t) tonnes Material (t)0 52,863,1431 52,747,564 115,579 45,284 653,702 769,2812 52,235,305 512,259 199,946 639,798 1,152,0573 51,540,647 694,658 273,760 831,089 1,525,7484 50,517,185 1,023,462 412,901 1,214,892 2,238,3545 49,265,699 1,251,486 517,257 1,521,623 2,773,1096 47,457,101 1,808,598 760,753 1,668,463 3,477,0607 45,010,665 2,446,436 1,004,250 1,869,981 4,316,4178 42,536,426 2,474,239 1,004,250 2,362,884 4,837,1239 40,072,862 2,463,563 1,004,250 4,279,835 6,743,39810 37,647,605 2,425,257 1,004,250 6,068,541 8,493,79811 35,242,156 2,405,449 1,004,250 6,762,609 9,168,05812 32,799,746 2,442,410 1,004,250 5,343,894 7,786,30413 30,460,596 2,339,150 1,004,250 3,943,437 6,282,58714 28,140,960 2,319,636 1,004,250 3,033,429 5,353,06515 25,804,738 2,336,222 1,004,250 2,961,300 5,297,52216 23,439,327 2,365,411 1,004,250 3,355,808 5,721,21717 21,073,805 2,365,522 1,004,250 2,881,788 5,247,31018 18,650,189 2,423,616 1,004,250 2,322,725 4,746,34019 16,204,807 2,445,382 1,004,250 1,870,634 4,316,01620 13,685,556 2,519,251 1,004,250 1,915,867 4,435,11821 11,166,564 2,518,992 1,004,250 1,697,127 4,216,11922 8,595,471 2,571,092 1,004,250 1,388,422 3,959,51423 5,917,782 2,677,689 1,004,250 2,811,011 5,488,70024 3,394,202 2,523,580 1,004,250 4,028,677 6,552,25725 814,511 2,579,691 1,004,250 4,850,942 7,430,63326 814,511 276,714 1,466,489 2,281,000
Total 52,863,143 52,863,143 21,567,365 71,744,962 124,608,105
TABLE 18-1 MINE SCHEDULE
SCOTT WILSON RPA www.scottwilson.com www.scottwilsonmining.com
18-11

SCOTT WILSON RPA www.scottwilson.com www.scottwilsonmining.com
18-12
MINERAL PROCESSING
This section provides a description of the processes used to separate kaolin from the
ore in the processing plant. The flow sheet for Phase I is illustrated in Figure 18-5.
Figure 18-6 illustrates the Phase II flow sheet. The process flow sheet is preliminary and
subject to equipment and process changes during detailed engineering and construction.
The kaolin will be hauled to the plant site and dumped onto a grizzly, which will
separate oversize, +180 mm material. The undersize will flow to the apron feeder
feeding the primary crusher. Ore will be crushed to a nominal size of minus 64 mm prior
to transfer by conveyor and tripper conveyor to the raw ore storage hall. Raw ore will be
stored in the hall in two 7,500 tonne longitudinal piles. One pile will be formed while the
other pile is being reclaimed to feed the plant.
Raw ore will be reclaimed from the stockpile by front end loader and fed by conveyor
to the secondary crusher. The secondary crusher will reduce the ore to minus 6mm in an
open circuit operation. Crushed ore will be transferred by belt conveyor to the fine ore
storage bin ahead of the dryer. Dust collection is provided at all transfer points to control
fugitive dust emissions. Self-cleaning magnets are used to capture any tramp iron prior to
transfer of ore to the fine ore bin.
Fine ore is fed at a controlled rate from the fine ore bin into the rotary dryer. The
dryer operates in co-current mode with hot gases from the rotary kiln, rotary cooler and a
coal-fired hot gas generator. Supplementary heat for the dryer operation is provided from
a hot gas generator equipped with a natural gas burner.
The dryer is designed to reduce the moisture content of the ore to 0.5% as well as to
liberate the sand from the kaolin. The light kaolin particles and fine silica sand will be
swept from the dryer by the dryer exhaust gases pulled by the induced draft fan. The
coarse silica sand will be transferred by screw conveyor and bucket elevator to a hot sand
bin where it will be stored for disposal back to the quarry by the quarry trucks.

SCOTT WILSON RPA www.scottwilson.com www.scottwilsonmining.com
18-13
The dryer exhaust gases containing the kaolin and fine silica will be drawn through a
cyclone and process bag filter by the main process fan before being exhausted to the
atmosphere. The coarse kaolin fraction and fine silica sand separated by the cyclone will
be fed to a mechanical classifier for the separation of the fine silica sand from the kaolin.
Fine silica sand removed from the separator will be transferred to the hot sand bin. Fine
kaolin will be recovered in the process bag house. Kaolin collected in the main process
baghouse and the separator baghouse will be conveyed to the dry kaolin bin.
Dry kaolin will be recovered from the dry kaolin bin and either conveyed for
shipment or transferred to the rotary kiln. The rotary kiln will be a coal-fired unit
designed to calcine the kaolin in a controlled manner. Hot metakaolin will be discharged
from the rotary kiln and delivered by gravity to the rotary cooler. Cooling air will be
drawn through the cooler by the dryer vent fan and flow counter-current to the product.
Cool metakaolin will be discharged from the cooler and transferred by pneumatic
pump to storage bins and a 20,000 tonne storage dome. Product will be recovered from
the storage dome using an activated floor system for transport to the loadout stations.
Finished product will be loaded into trucks for either direct shipment to customers or
transport to a rail transfer station at Scout Lake. Rail cars will be loaded at Scout Lake for
rail shipment of product.
WRI will arrange for a contractor to handle all product transport requirements, either
direct truck or transloading into rail cars at Scout Lake.
The primary fuel source for the plant will be lignite coal. Coal will be trucked to the
plant and stored in a covered storage area. The raw coal will be recovered by front end
loader and transferred by belt conveyor to the raw coal bin. Raw coal from the coal bin
will be fed to a Raymond coal mill where it will be pulverized. Hot gases for the drying
and transport of the coal will be taken from the rotary cooler discharge hood and be
tempered with recycled gases. Pulverized coal will be transported to the kiln burner by

SCOTT WILSON RPA www.scottwilson.com www.scottwilsonmining.com
18-14
the system exhaust fan after being densified in a cyclone. A separate fan will provide
primary combustion air for the coal burner.
Phase II of the Project will increase production capacity to 350,000 tonnes metakaolin
and 25,000 tonnes kaolin. No additional crushing equipment will be required as there is
sufficient capacity. However, the crushing plant will operate on a two shift/day basis
rather than one shift per day.
An additional rotary dryer and separation circuit will be added to handle the increased
capacity and a coal-fired hot gas generator will be added to provide heat for both dryers.
A two-stage preheater will be added ahead of the rotary kiln, as well as a new fan to
control gas flow through to the kiln and preheater. Hot gases exhausted from the
preheater will be directed to the dryers. The cooler will be extended to handle the
additional product flow. The initial plant design incorporates the necessary foundation
and structural steel requirements to accommodate the added equipment.
The Phase I coal mill will be replaced with a larger mill to double the coal grinding
capacity, or an additional coal mill could be added to provide the pulverized coal required
for the dryer air heater.
At full production in Phase I, approximately 30,000 tonnes of coal will be required.
When Phase II is fully implemented, coal consumption will increase to approximately
85,000 tpa. When fully developed, the Gollier Creek Project is anticipated to require
approximately 165,000 tpa. The increase in coal consumption is the result of switch to
coal from gas as the primary energy source for both drying and calcinations.
Figure 18-7 provides a plan view of the plant layout. Photographs of various aspects
of the plant are provided as Appendix 6.

January 2008 Source: Whitemud Resources Inc., 2006.
Whitemud Kaolin Project
Process Flow SheetPhase I
Whitemud Resources Inc.
Saskatchewan, Canada
Figure 18-5
18-1
5
SC
OT
TW
ILS
ON
RP
Aw
ww
.scottw
ilson
.com
ww
w.sco
ttwilso
nm
inin
g.co
m

January 2008 Source: Whitemud Resources Inc., 2006.
Whitemud Kaolin Project
Process Flow SheetPhase II
Whitemud Resources Inc.
Saskatchewan, Canada
Figure 18-6
18-1
6
SC
OT
TW
ILS
ON
RP
Aw
ww
.scottw
ilson
.com
ww
w.sco
ttwilso
nm
inin
g.co
m

January 2008 Source: Whitemud Resources Inc., 2006.
Whitemud Kaolin Project
Plan View of thePlant Layout
Whitemud Resources Inc.
Saskatchewan, Canada
Figure 18-7
18-17
SCOTT WILSON RPA www.scottwilson.comwww.scottwilsonmining.com

SCOTT WILSON RPA www.scottwilson.com www.scottwilsonmining.com
18-18
SITE INFRASTRUCTURE
Site infrastructure is limited. Local roads have been upgraded to accommodate the
anticipated truck traffic. The current electrical power system is sufficient for Phase I of
the Project, but will require upgrading when the plant is expanded in Phase II and
beyond. A natural gas supply line has been extended to service the process plant. A
transload facility for loading rail cars has been constructed by Trimac Inc. at Scout Lake.
There is no current potable water supply and a well has been constructed.
Telecommunications service in the area is limited and upgrades in cellular service and
high speed internet access will be required. Key aspects of infrastructure requirements
are detailed below.
WATER
The Project lies in a semi-arid region of the province where water conservation and
management are paramount for social and economic reasons. WRI recognizes that water
scarcity is a common theme in the region and is planning the Project in a fashion that
conserves water by minimizing consumption, while at the same time being sensitive to
the need to minimize impacts on both surface water and groundwater resources.
To the maximum extent possible, fresh water will be diverted around the surface
facilities to avoid having excess surface water in the quarry or in the vicinity of the kaolin
processing plant. It is proposed to develop a “dugout style” storage pond to store water
for fire protection and, wherever possible, water would be diverted into that pond to
maintain it at full supply level. With that exception, the remaining surface water would
be diverted to existing watercourses.
Since the proposed process is a dry process, no water will be consumed in the plant.
A small amount will be required for wash down and vehicle maintenance. Preliminary
review of the hydrogeology indicates that a local groundwater supply with sufficient
yield should be available to meet plant personnel requirements, but filtering or treatment
may be necessary, depending upon water quality.

SCOTT WILSON RPA www.scottwilson.com www.scottwilsonmining.com
18-19
Wastewater will be treated in a septic tank system equipped with an effluent pump-
out. The effluent will be re-used as irrigation water to support the shelterbelt system that
will be developed around the plant. This is in keeping with the general philosophy of
maximum reuse of all water before it is returned to the environment.
ELECTRICAL POWER
Three phase electrical power at 25 kV suitable for 1,400 KVA demand service is
available from Saskatchewan Power approximately 1.6 km distant. Saskatchewan Power
has extended to the plant location and supplied a transformer at no cost to WRI. To
facilitate this service, WRI installed electronic soft start controls or variable speed drive
for all large motors (>100 hp) to ensure sufficient starting current is available.
Saskatchewan Power has also indicated it would be willing to upgrade the electrical
service to meet the power requirements of Phase II and later expansions. At the present
time, Saskatchewan Power has indicated there would be no cost to WRI for the upgrade
requirements.
NATURAL GAS LINE
Natural gas service is available approximately 2 km west of the plant at a hog farm
operation, but the capacity is probably insufficient to meet the needs of the plant. WRI’s
plans call for installation of a 4” dia. 80 psi line from the nearest compressor station at
Glenworth, approximately 30 km west of the plant. Installation costs were $1.1 million.
ROAD AND RAIL TRANSPORTATION
Kaolin and metakaolin products will be shipped by truck to Western Canadian and
Northern U.S. customers, where economical to do so. For shipments to British
Columbia, Eastern Canada and the remainder of the United States, pneumatic trucks will
be loaded at the plant, and transloaded into pneumatic and hopper bottom rail cars. This
will be done at a new facility at Scout Lake on a siding to be developed by Fife Lake
Railway, a recently formed short line, in partnership with Trimac Ltd. WRI has entered
into a service contract with Trimac to provide a full service transport and transload
operation. The contractor has responsibility for design, management and operation of the

SCOTT WILSON RPA www.scottwilson.com www.scottwilsonmining.com
18-20
transload facility and provides all necessary equipment and staffing. The contract terms
provide for a fixed charge for capital recovery and a variable charge for product handling.
As of December 17, 2007, foundations had been installed, the rail siding and switch
completed, and the site serviced. Conveyors and loadout equipment were scheduled for
installation by December 31, 2007. The facility is anticipated to be in full operation by
the end of February 2008.
The primary route for road-haul from the plant will be negotiated with the R.M. of
Old Post and Saskatchewan Highways and Transportation. There are three options
(Figure 18-8).
1. Four miles of Farm Access Road traveling east from Stomp Farms (Heartland Pork) farrowing barn would be upgraded to a grid road that can handle secondary weights. From the WRI plant site, trucks would travel three miles east on the upgraded farm grid, then a further nine miles east on the concession road and east on concession roads to Scout Lake. At Scout Lake, trucks would be transloaded to rail cars, or head north on Highway 2 to Assiniboia. This road has been upgraded to handle heavy truck traffic and is the main access road from the plant to the transload facility at Scout Lake.
2. A possible second route would take trucks west from the WRI plant site for
three miles on the upgraded farm grid, one-half mile south on Highway No. 358, then 17.5 miles south and east on Super Grid No. 705 to Highway No. 2. This route would then require traveling 10 miles north on the TMS section of Highway No. 2, followed by 11 miles on the higher grade secondary weight section of Highway No. 2 to Assiniboia.
3. A third potential route, recently proposed by the R.M. of Old Post, would
involve upgrading of one mile of the Farm Access Road west from the proposed plant site. Four miles of new grid road would be constructed on the existing road allowance going north from that point, in Township 5 between Sections 18, 19, 30 and 31 on the east side of Range 2, and Sections 13, 24, 25 and 36 on the west side of Range 3. After this, the route would go 12 miles east on the Pickthall Grid to Highway No. 2, then north four miles on the TMS section of Highway No.2, followed by 11 miles on the secondary weight section to Assiniboia.
WRI will negotiate an arrangement under the Provincial Partnership Program to allow
trucks to run on Highway No. 2 over the set weight classification in exchange for a share

SCOTT WILSON RPA www.scottwilson.com www.scottwilsonmining.com
18-21
of the company’s transportation cost savings. The money that would go into the
Partnership Fund would be used only for highway projects. Saskatchewan Highways and
Transportation plans to upgrade the TMS section on Highway No. 2 within about two to
three years.
ANCILLARY FACILITIES
A temporary camp for workers may be required during the construction phase only.
No permanent camp will be required since it is anticipated that all labour will be drawn
from the surrounding community.

January 2008 Source: Whitemud Resources Inc., 2006.
Whitemud Kaolin Project
Alternative RoadTransport Routes
Whitemud Resources Inc.
Saskatchewan, Canada
Figure 18-8
18-22
SCOTT WILSON RPA www.scottwilson.comwww.scottwilsonmining.com

SCOTT WILSON RPA www.scottwilson.com www.scottwilsonmining.com
18-23
Petroleum products will be stored and handled in accordance with applicable
Provincial regulations. Gasoline and diesel fuel will be stored in double wall Enviro-
Tanks with leak detection, while lubricants will be stored in secure buildings. Equipment
and supplies for immediate cleanup of spills will be maintained on site and personnel will
be trained in their use.
Domestic sewage will be treated in a septic tank with a tile field and a pump-out
system that will enable wastewater reuse as described under Site Infrastructure above.
Domestic solid waste will be disposed at the Assiniboia regional landfill, which is
appropriately licensed to accept such waste. Industrial waste such as oil, antifreeze and
filters will be disposed of through a licensed waste recycler.
WRI intends to rely on the SaskTel network for all telecommunication services, on
the understanding that adequate service can be provided.
TAILINGS MANAGEMENT
Tailings will be a high purity, dry, fine silica sand (40 to 200 mesh) with
approximately 0.5% moisture by dry weight of soil. The material will be completely
cohesionless and will be untrafficable to wheeled vehicles. It will also be highly erodible
by both water and wind. It will be devoid of nutrients and will have been sterilized
during the separation process; the sand will require substantial enhancement with
moisture, nutrients, bacteria and stabilizing cover to support plant growth. The sand is
almost pure silica and will be essentially inert from the perspective of chemical
composition. It contains no adsorbed or bonded constituents that pose an environmental
concern.
The tailings sand coming out of the Dryer and the Air Classifier will be conveyed to a
300 tonne Sand Silo. During quarrying operation, as dump trucks bring ore to the plant
stockpile, they will make return trips carrying sand back to dump in the Reclaim Pit.

SCOTT WILSON RPA www.scottwilson.com www.scottwilsonmining.com
18-24
The size of the Reclaim Pit will be kept to the minimum dimensions practicable for
the operation. The objective will be to work in small panels that can be filled in a short
time and stabilized with overburden to prevent wind erosion. Experience at other
locations in Saskatchewan has shown that soil drifting can be controlled by using this
approach and by incorporating progressive reclamation into operating plans.
Tailings stability is a critical pit design and management issue. Physical stability
refers to susceptibility to physical dislocation by erosion, frost action or mass wasting
such as instability caused by land sliding. As indicated earlier, the tailings are very
susceptible to erosion and must be covered as soon as possible upon placement to prevent
damage to adjacent land from wind-blown sand. The materials are suitable as fill
material, but must be stabilized with clay cover to prevent erosion.
Two concerns pertain to the stability of the tailings and overburden (collectively
called the “spoil pile”) that is stored in the worked-out pit; stability of the spoil slopes and
overall stability with respect to shear strength of the foundation. The tailings are a strong
material; however, the spoil pile slopes will only stand at the angle of repose of the sand,
estimated to be 32o; steeper than that angle and the sand will “run” into the pit. That is
expected to be the controlling angle for tailings and spoil placement. By contrast, it is
expected that the undisturbed clay will stand at slopes near 45o for a sufficient time to
allow the ore to be excavated.
Overall stability of the spoil will be enhanced if it is placed in a fully dewatered pit.
To maintain spoil stability, water must be pumped from the pit prior to placing the
bottom lift of tailings and spoil.
In summary, physical stability of the tailings and spoil will be maintained by:
• Transporting the tailings in a fashion that minimizes dusting; • Operating the tailings area in small cells, covering each cell as quickly as
possible after placing the tailings and progressively reclaiming the tailings and spoil areas as quarrying proceeds;

SCOTT WILSON RPA www.scottwilson.com www.scottwilsonmining.com
18-25
• Ensuring the pit is dewatered prior to placing the bottom lift of tailings and spoil.
RECLAMATION
The method of quarrying and backfilling the pit with spoil and tailings was described
under Mining Operations. The process after the initial box cut will be repetitive and can
be summarized as follows:
• Topsoil will be removed and stockpiled separately or spread directly on backfilled areas that are ready for final stages of reclamation.
• Overburden will be stripped from the ore and spread on top of the tailings and
spoil as a first stage of reclamation. • The ore will be quarried and transported to the processing plant. • The barren pit will be dewatered to accept the bottom lift of tailings with
filling continuing to the design elevation. The coal ash will be recycled into the metakaolin.
• Overburden will be spread to cap the tailings, it will be contoured, scarified
and prepared to accept topsoil. • Once the final topsoil lift is in place, the area will be cultivated, fertilized and
seeded with an appropriate seed mixture to provide a sustainable vegetative cover for this environment. In this regard, the experience of other open pit operators such as SaskPower and Prairie Coal will be closely reviewed and their best practices adopted.
• The reclaimed areas will be irrigated with available water.
It is expected that the tailings would be covered with >5 m of overburden followed by
about 300 mm of topsoil. Given the loss of the kaolin fraction and the volume change
that results from handling, the final ground line will not replicate the pre-quarrying
topography. The reclaimed landscape will be contoured to a “knoll and swale”
topography wherein small basins with shallow ponding areas are created. Experience has
shown that this landform creates a variety of micro-environments and returns to
productive agricultural use relatively quickly.

SCOTT WILSON RPA www.scottwilson.com www.scottwilsonmining.com
18-26
MARKETS
Metakaolin is one of a family of pozzolanic supplementary cementitious materials
(SCMs) that can be used as a partial replacement for Portland cement (materials
substitution/cost reduction) or as an additive to improve the properties of the cement mix
(performance improvement). These attributes are generally complementary, but the
relative importance of each can vary depending on the particular market application.
Pozzolanic materials are materials that can react with the calcium hydroxide formed
in the cement hydration process to produce new cementitious compounds. If calcium
hydroxide is not taken up by pozzolans it remains as a soluble material subject to
sulphation and carbonation reactions which weaken the concrete. The reactions taking
place during cement hydration can be summarized as:
Portland Cement + H2O ----------> Calcium Silicate Hydrates (CSH) + Ca(OH)2 (CH)
H2O Pozzolan + CH ----------------->Dicalcium aluminosilicate hydrate (C2ASH8) + CSH
The reactivity of a pozzolanic material is measured by the Chappelle Test, a measure
of the ability of the pozzolan to react with the calcium hydroxide. Typical pozzolanic
reactivities for various pozzolanic materials are presented in Table 18-2.
TABLE 18-2 POZZOLANIC REACTIVITIES (CHAPPELLE TEST)
Whitemud Resources Inc. – Gollier Creek Kaolin Project
Material Pozzolanic Reactivity
mg Ca(OH)2 per gram Blast Furnace Slag 40
Silica Fume 427 Pulverized Fly Ash 875
Metakaolin 1050

SCOTT WILSON RPA www.scottwilson.com www.scottwilsonmining.com
18-27
Supplementary cementitious materials include fly ash, ground granulated blast
furnace slag (GGBFS), silica fume (SF), metakaolin (MK), and natural pozzolans (NP)
such as diatomaceous earth, rice husk ash, volcanic ash or calcined shale. Fly ash,
generally referred to as pulverized fly ash (PFA) is the dominant SCM material in North
America, followed by granulated slag. Silica fume and metakaolin are specialty products
at present, with natural pozzolan material use being very limited in North America.
The use of metakaolin in Portland cement offers a number of technical and economic
advantages to cement producers and to ready-mix concrete suppliers (Bickley, 2006).
Key advantages include the following:
• Replaces a portion of the Portland cement (PC) in the mix. The level of replacement is a function of the nature of the cement mix constituents, the heat of reaction to form calcium silicate hydrates and the reaction time. Replacement ratios up to 20% are possible,
• Reduces green house gas emissions in comparison to PC manufacture due to
lower calcination temperatures (reduced fuel requirement/tonne production) and no CO2 generation from calcination of carbonate materials,
• Allows for higher addition rates of fly ash or slag in concrete mixes, thus
reducing overall cement requirements, • Reduces overall cost of concrete mix, • Produces significant pore refinement in concrete, thus reducing the diffusion
rate of harmful ions such as chlorides in concrete, • Enhances several mechanical properties of concretes: early-age compressive
strength and flexural strength, • Enhances concrete durability properties of concretes: resistance to chemical
attack, reduced ASR expansion, improved sulphate resistance, improved freeze/thaw resistance.
PFA is a low cost material and is used extensively in the Canada and the U.S., either
as an interground product with cement clinker or as an additive in ready-mix concrete.
PFA is a product of coal combustion in electric utility boilers and the quality of the PFA
is dependent upon the properties of the coal used by the utility. As a result, not all PFA

SCOTT WILSON RPA www.scottwilson.com www.scottwilsonmining.com
18-28
can be used as an SCM. In Canada, most of the fly ash potentially usable as SCMs is
produced in Alberta, Saskatchewan and Ontario and is very low cost.
Blast furnace slag is the second largest volume SCM. Its use tends to be restricted to
regions with major primary steel plants such as Ontario and the Great Lakes basin of the
United States.
Silica fume is a by-product for the production of silicon metal and ferrosilicon. Silica
fume is produced in Canada only in Quebec and at only a few locations in the eastern
United States. Silica fume is considered as a specialty SCM and is relatively high priced
(up to 3 times the price of cement). Its use is widely distributed, with much of the silica
fume being used in blended hydraulic cements rather than added to ready-mix concrete.
Metakaolin is currently considered as a specialty SCM. It is produced by seven
companies in the southeastern United States, of which four are considered to be
significant producers. Current Canadian consumption of MK is restricted to low volume
specialty markets.
Natural pozzolans such as diatomaceous earth, volcanic tuffs and zeolite find limited
market application in specialty markets.
Typical chemical and physical properties of some pozzolanic materials are detailed in
Table 18-3.

SCOTT WILSON RPA www.scottwilson.com www.scottwilsonmining.com
18-29
TABLE 18-3 TYPICAL CHEMICAL AND PHYSICAL PROPERTIES OF SELECTED POZZOLANS
Whitemud Resources Inc. – Gollier Creek Kaolin Project
Fly Ash Property Class F Class C
Slag Silica Fume
Metakaolin
SiO2 % 52 35 35 90 53 Al2O3 % 23 18 12 0.4 43 Fe2O3 % 11 6 1.0 0.4 0.5 CaO % 5 21 40 1.6 0.1 SO3 % 0.8 4.1 9 0.4 0.1 Na2O % 1.0 5.8 0.3 0.5 0.05 K2O % 2.0 0.7 0.4 2.2 0.4 Total Na eq. alkali %
2.2 6.3 0.6 1.9 0.3
Loss on Ignition % 2.8 0.5 1.0 3.0 0.7 Specific Surface, m2/kg
420 420 400 20,000 1,900
Relative Density 2.38 2.65 2.94 2.40 2.50 Source: PCA, 2002
A study of the use of SCMs in Canada prepared in 2003 by CANMET gave the
following estimates of SCM use in Canada in 2001 (Table 18-4):
TABLE 18-4 ESTIMATED SCM USE IN CANADA – 2001 (TONNES) Whitemud Resources Inc. – Gollier Creek Kaolin Project
Application Fly Ash Slag Silica Fume Metakaolin
Ready-mix Concretes
449,350 216,000 3,350 n.a.
Blended Cements
10,150 11,200 19,390 < 100
Source: Bouzoubaâ and Fournier, 2003
Available data on U.S. consumption of SCMs in cement production show the
following for 2003 and 2004 (Table 18-5):

SCOTT WILSON RPA www.scottwilson.com www.scottwilsonmining.com
18-30
TABLE 18-5 U.S. CONSUMPTION OF SCMS IN CEMENT PRODUCTION (‘000 TONNES)
Whitemud Resources Inc. – Gollier Creek Kaolin Project 2003 2004 Material
In Clinker In Cement In Clinker In Cement Fly Ash 2,250 39 2,890 77 Other ash, incl. bottom ash 1,100 - 1,050 - Granulated blast furnace slag 17 333 104 345 Other blast furnace slag 214 - 189 - Steel slag 448 - 401 - Other slags 113 - 53 - Natural rock pozzolans - 25 - 6 Other pozzolans 129 49 114 19 Source: U.S.G.S. Minerals Yearbook, Cement, 2004
Metakaolin demand by market segment and geographic region is described more fully
in the following sections.
METAKAOLIN MARKETS Market estimates of the demand and price for metakaolin for major market
applications in Canada and the United States are based on the following:
• Independent analyses of the market demand for metakaolin in Canada and the United States prepared for WRI. Reports have been prepared for the following specific markets:
1. Canadian oilfield cement market, 2. Canadian ready-mix concrete and Portland cement markets, 3. U.S. oilfield cement market, 4. U.S. ready-mix concrete and Portland cement markets.
• WRI internal market research, including detailed discussions with major potential metakaolin consumers in Canada and the United States respecting contract volumes and product pricing.
• Third-party market research reports describing the markets and economics for
metakaolin use in selected cement and concrete applications.

SCOTT WILSON RPA www.scottwilson.com www.scottwilsonmining.com
18-31
OILFIELD CEMENT MARKET Oilfield cements are used to seal the annulus between the well casing and the rock or
in the open hole below the casing string. The cement acts to restrict fluid movement
between formations and to bond and support the casing. In addition to isolating zones of
oil, gas and water, cements also aid in:
1. Protecting the casing from corrosion 2. Preventing blowouts by quickly forming a seal 3. Protecting the casing from shock loads in deeper drilling 4. Sealing off zones of lost circulation 5. Repair of casing leaks 6. Water shut-off 7. Well abandonment
In Canada, the use of oil well cements is governed by various provincial regulations,
with EUB Directives 009 and 020 of the Alberta Energy and Utilities Board (EUB)
taking the lead. Regulations in British Columbia and Saskatchewan are modeled after the
Alberta regulations. In the United States, the regulations of the Texas Railroad
Commission govern the use of oil well cements and cement additives.
Key regulatory factors governing the use of cement in oilfield applications in Canada
are:
• Surface Casing No additives or fillers permitted which reduce the compressive strength of the cement. Reactive pozzolans permitted provided the compressive strength of the mix is equal to or greater than that of Class G cement plus 2% CaCl2
• Production Intermediate and Liner Casing
Fillers and additives only permitted if compressive strength of mix at least 3,500 kPa after curing at 48 hours at the temperature of the uppermost hydrocarbon bearing zone
• Abandonment Wells
Class G cement specified. Cement to be pressure tested at stabilized pressure of 7,000 kPa for 10 minutes

SCOTT WILSON RPA www.scottwilson.com www.scottwilsonmining.com
18-32
Oilfield service companies typically use binary or ternary mixes of Portland cement,
fly ash or other pozzolan and silica fume in oilfield cementing. The objective is to
produce a mix design that maximizes the use of pozzolan on a cost and yield basis to
provide the maximum compressive strength and impermeability in the shortest set time to
meet the functional requirement of the specific job.
Currently, the high level of construction and oil and gas well drilling activity in
western Canada, and especially Alberta, has resulted in shortages of cement. Cement
producers have favoured production of Type 10 and Class G cements over Type 30 (High
Early Strength cement) as these Type 10 and Class G cements can be produced at a
considerably faster rate (70 t/hr vs. 30 t/hr) than Type 30 cement. Thus, pozzolanic
materials which can contribute to high early strength development at minimal cost are
highly favoured.
There are two cement manufacturers in Alberta – Lehigh Inland Cement in Edmonton
and Lafarge Canada in Exshaw. As of 2004, these plants had a clinker production
capacity of 2.291 million tonnes and a grinding capacity of 2.710 million tonnes. Total
production from the two plants was approximately 2 million tonnes in 2005, which
essentially represents 100% clinker capacity utilization given normal maintenance
downtime. British Columbia has two cement producers with three plants: Lafarge Canada
in Kamloops and Richmond and Lehigh Western Cement in Delta. In 2004, the combined
clinker capacity of the plants was 2.660 million tonnes, while combined grinding capacity
was 2.679 million tonnes. There is no cement production in Saskatchewan or Manitoba.
In Alberta, both Lafarge and Lehigh produce Type 10, Class G and Type 30 cement
for the oilfield service market. A study commissioned by WRI (Fulton, 2006) estimates
current oilfield demand for cement in Alberta to be 825,000 tonnes, or 41.25% of 2005
cement production. The two largest companies accounted for an estimated 65% of total;
demand in 2005 (Fulton, 2006).
SCOTT WILSON RPA www.scottwilson.com www.scottwilsonmining.com
18-33
Out of the total 825,000 tonnes for oilfield service, approximately 250,000 tonnes
were used for service casing purposes and 575,000 tonnes for production intermediate,
liner casing, and well abandonment purposes in 2005.
Supply and Demand – Pozzolans
Fly Ash
The two primary pozzolans used in oil field cements in western Canada are fly ash
and silica fume. Fly ash is a very low cost pozzolanic material derived from coal
combustion. Fly ash in Portland cement contributes to compressive strength development
and reduced porosity. Both Type F and Type C fly ash are available in western Canada
from the major power utilities. There are no supply constraints on fly ash. Fly ash is
currently priced at approximately $65/tonne in central Alberta.
The current (2006) estimated consumption of fly ash in oilfield cements is
approximately 115,000 tonnes, with the two largest users accounting for an estimated
56% of demand in 2005 (Fulton, 2006).
Silica Fume
Silica fume is a by-product recovered from the production of silicon metal or
ferrosilicon. All Canadian production of silica fume is in Quebec at Becancour. Teck
Cominco Ltd. (Teck Cominco) in Trail, B.C., produces a product called XL fume, which
is chemically similar to silica fume and meets the CSA and ASTM standards for silica
fume. Silica fume use in concrete assists in early strength development and significantly
reduces porosity. Silica fume must conform to CSA Standard A3001-03 and conform to
ASTM C1240.
Silica fume from Quebec is distributed in western Canada by Elkon Products of
Vancouver. U.S. produced silica fume is available from Target Products Ltd, while
Cementec Industries distributes Teck Cominco’s XL Fume product. Silica fume use is
mainly restricted to lightweight cement formulations. The current price of silica fume in
central Alberta is approximately $450/tonne (Fulton, 2006).

SCOTT WILSON RPA www.scottwilson.com www.scottwilsonmining.com
18-34
The estimated consumption of silica fume in the western Canadian oilfield service
business was 25,000 tonnes in 2005, with the two largest consumers accounting for 40%
of total demand (Fulton, 2006).
Metakaolin
There is no current consumption of metakaolin in the oilfield service business in
western Canada. Metakaolin is produced in the United States by BASF Catalysts, LLC
(previously Engelhard Corporation), Thiele Kaolin Company, Burgess Pigment
Company, J.M. Huber Company, Grace Davison div. of W.R. Grace Co., and Imerys.
ISG Resources, previously a distributor, recently purchased the CE Minerals metakaolin
production facilities. Advanced Cement Technologies is a major distributor of metakaolin
in western U.S. markets. Advanced Cement sources its material from Southeastern Clay
in Aiken. S.C. Metakaolin has a current indicated price of approximately $600/tonne in
western Canada.
Metakaolin Demand – Oilfield Service Market, Western Canada
Pozzolans are used in oilfield cement applications to achieve the following benefits:
• Lower cost • Lighter weight (specific gravity and water requirement) • Higher yield (more m3 slurry/tonne material)
Metakaolin and other pozzolanic materials are utilized based on the pozzolanic
reactivity index, a measure of the quantity of calcium hydroxide that will react with the
pozzolan.
Using the pozzolanic reactivity index, it is possible to calculate the optimum amount
of pozzolan to react with a given amount of cement to consume all of the calcium
hydroxide. Assuming 25% by weight initial calcium hydroxide, the results show a
cement reduction of 32.3% for silica fume, 22.2% for fly ash and 17.6% for metakaolin.
In practice, fly ash is generally substituted at a rate of 40% by weight for Portland cement
and silica fume at a rate of 10% to 25% by weight for oilfield cements.

SCOTT WILSON RPA www.scottwilson.com www.scottwilsonmining.com
18-35
An analysis of the physical properties and costs of various oilfield cements and
pozzolans in terms of cost/m3 shows the following (Table 18-6):
TABLE 18-6 COST-PERFORMANCE SUMMARY FOR CEMENTITIOUS MATERIALS IN OILFIELD CEMENTS
Whitemud Resources Inc. – Gollier Creek Kaolin Project
Material Cost/t ($)
Optimum Water Requirement2
(m3/t)
Specific Gravity
Absolute Volume (m3/t)
Yield (m3/t)
Cost/Yield ($/m3)
Type 10 cement 180 0.46 3.14 0.3185 0.78 231 Type 30 cement 195 0.56 3.14 0.3185 0.88 222 Class g cement 190 0.44 3.14 0.3185 0.76 251 Fly ash 65 0.40 2.0 0.50 0.90 72 Silica fume 450 3.60 2.2 0.455 4.06 111 Metakaolin1 225 2.70 2.50 0.40 3.10 73 1 based on assumed Whitemud price 2 amount required to achieve 11 BC’s (Beardon Consistency Units) after 20 minutes stirring Source: Fulton, 2006
Assuming a 20% by weight replacement ratio, the relative costs for cement mixes are
(Table 18-7):
TABLE 18-7 COST COMPARISON OF CEMENT MIX DESIGNS (20% WT REPLACEMENT OF CEMENT)
Whitemud Resources Inc. – Gollier Creek Kaolin Project
Pozzolan in 80/20 Type 10 Cement Blend by Weight
Cost ($/t) of Blend
Water Requirement
(m3/t)
Density of Slurry (kg/m3)
Slurry Yield (m3/t)
Cost/Slurry Yield ($/m3)
Type 10 only 180 0.46 1872 0.78 231 Fly ash 157 0.45 1790 0.81 194 Silica fume 234 1.09 1451 1.44 163 Metakaolin 189 0.93 1532 1.26 151 Source: Fulton, 2006
These data show that metakaolin has a very high potential to displace silica fume
and/or fly ash in oilfield cement applications. Based on current consumption rates for
pozzolans, and assuming equivalent performance, the estimated Canadian market demand
for metakaolin in down-hole cementing applications is 140,000 tonnes, based on 100%

SCOTT WILSON RPA www.scottwilson.com www.scottwilsonmining.com
18-36
substitution of silica fume and fly ash by metakaolin. Surface casing applications would
add an additional 56,000 tonnes of demand, assuming a 20% cement replacement ratio
and compressive strength development equal to Class G plus 2% CaCl2 (Fulton, 2006).
WRI has received letters of intent and provisional purchase orders from two oil well
service companies in western Canada. Demand from these two companies is projected to
exceed 30,000 tonnes by the end of 2010.
Metakaolin Demand – Western U.S. Oilfield Service Market
WRI commissioned CSI Technologies Inc. (“CSI”) to prepare a report on the demand
for metakaolin in the U.S. oilfield service market. The report focused on the potential
demand for metakaolin within the Western U.S. market. CSI has based its projections of
metakaolin demand on an analysis of rig counts and typical utilization levels of cement in
wells. The results of the CSI analysis show the following (Table 18-8):
TABLE 18-8 U.S. OILFIELD CEMENT DEMAND (‘000 TONNES)
Whitemud Resources Inc. – Gollier Creek Kaolin Project
Area 1994 1999 2004 2006 2009 2014 Total U.S. 1,905 1,597 3,084 3,339 3,720 4,318 Eastern U.S. 265 Western U.S. 1,158 Gulf of Mexico -water
240
Gulf of Mexico - Land
1,677
Source: CSI Technologies Inc.
The market area most readily available to WRI is the western U.S. Access to the on-
shore segment of the Gulf of Mexico market will be a function of transportation costs
from Saskatchewan. Penetration of the offshore Gulf of Mexico market may require
development of strategic partnerships with oilfield service companies specializing in this
market.

SCOTT WILSON RPA www.scottwilson.com www.scottwilsonmining.com
18-37
As in Canada, the oilfield service companies provide a full range of services from
design of the cementing system through blending, mixing and placement. Fly ash and
silica fume are the primary supplementary cementitious materials used in oil field
cements. The estimated use of SCMs in U.S. oilfield applications in 2006 is
approximately 205,000 tonnes of fly ash and 16,300 tonnes of silica fume (CSI
Technologies, 2006).
Much of the fly ash consumption in oilfield cements is in the western U.S. and on-
shore Gulf of Mexico. These two regions are estimated to account for 34.7% and 50.2%,
respectively, of fly ash demand. Current prices for fly ash are in the range of $US 66 -
$US 89/tonne and $US 1,000 to $1,166/tonne for silica fume for use in oilfield cements.
Oilfield cements are currently priced at $US 110 - $US 137/tonne, FOB origin.
CSI Technologies has projected that metakaolin could immediately replace almost all
of the silica fume used in oilfield cements and as much as 20% of the fly ash. Based on
current levels of demand for these materials in the western U.S. and on-shore Gulf of
Mexico markets, the immediate market potential for metakaolin as a cement additive is
estimated by CSI at approximately 36,000 tonnes.
Analysis by CSI Technologies indicates metakaolin has significant potential in
oilfield cement applications as a cement replacement and in the form of cement-
metakaolin blends. CSI estimates a demand of 54,500 tonnes metakaolin as a substitute
for cement in the western U.S. market and a further demand for metakaolin of 47,600
tonnes in lightweight cement-metakaolin blends. In this regard, a product matching the
performance of TXI lightweight cement would be particularly attractive to the market.
Based on the analysis conducted by CSI Technologies, total demand for metakaolin in
U.S. oilfield cement applications is estimated at approximately 138,000 tonnes at 2006
drill rig activity rates.
Development of the U.S. oilfield cement market will require the following:

SCOTT WILSON RPA www.scottwilson.com www.scottwilsonmining.com
18-38
• Obtaining Texas Railroad Commission approval for use of metakaolin-cement blends. This is a responsibility of the well cementer, but technical assistance from WRI in developing engineering data may be required.
• Development of strategic alliances with cement manufacturers and oilfield
service companies to provide lightweight metakaolin-cement blends and access to the off-shore Gulf of Mexico market.
CONSTRUCTION CEMENT AND CONCRETE MARKET
Metakaolin is used in construction cement and concrete in two forms – as an
interground product in blended cement produced at the cement plant, and as an ingredient
used in a concrete batch at a ready-mix batch plant. Blended cements are typically binary
or ternary blends designed to achieve specific strength, set time and finishing properties.
The use of blended cements is typically specified by the structural engineer or contracting
authority. Major applications of blended cements are in high rise office construction,
exterior architectural concrete fabrications, elevated expressways, parking garages, bridge
decks and piers, and other specialized civil construction. These applications are generally
categorized as High Performance Concrete (HPC) applications. Cements for HPC
applications typically require testing and certification as a contractual requirement,
especially for major public works projects.
Ready-mix concrete blends are batched at the ready-mix plant. Ready-mix plants do
not have as much control over the mixing process as do the cement plants. Accordingly,
ready-mix plants require batch materials to be easily handled and mixed. Ready-mix
plants generally produce standard strength mix designs and seek to minimize the use of
cement in the mix. Accordingly, materials which can effectively replace cement and can
be batched and mixed without additional costs are highly desired.
Canada
Table 18-9 details estimates of Canadian consumption of SCMs in concrete and in
blended cements for the years 2000, 2001 and 2002. Table 18-10 details estimated
consumption of specialty SCM-cement blends in Canada, while Table 18-11 details
estimated use of SCMs in blended cements and consumption of blended cements by
application. As can be seen, SCM use as a separate ingredient is considerably higher than

SCOTT WILSON RPA www.scottwilson.com www.scottwilsonmining.com
18-39
SCM use in blended cements. This is essentially because blended cement compositions
tend to focus on high performance concrete markets, while the ready-mix market is a
lower cost, volume oriented business. The use of SCMs in specialty applications, outside
of the mining industry, is limited. Mining industry applications are primarily for backfill
and shotcrete. Low cost and performance govern the use of SCMs in these applications.
TABLE 18-9 SCM USE IN CANADA AS A SEPARATE INGREDIENT (TONNES)
Whitemud Resources Inc. – Gollier Creek Kaolin Project
Application Type of SCM 2000 2001 2002 % Cement Replacement
Fly Ash 165,100 165,700 167,000 10% - 25% Residential Slag 36,000 36,000 36,000 15% - 40%
Fly Ash 238,700 236,000 228,000 Up to 20% Commercial/Industrial /Institutional Slag 144,000 144,000 144,000 15% - 40%
Fly Ash 46,300 46,500 47,600 10% - 25% Slag 36,000 36,000 36,000 15% - 40%
Infrastructure
Silica Fume 3,100 3,100 3,100 5% - 12%
Fly Ash 1,100 1,150 1,210 10% - 20% Special Silica Fume 250 250 250 7% - 12%
Fly Ash 451,200 449,350 443,810 Slag 216,000 216,000 216,000
Total
Silica Fume 3,350 3,350 3.350
Source: Bouzoubaâ and Fournier, 2003
TABLE 18-10 SPECIALTY SCM APPLICATIONS IN CANADA (TONNES)
Whitemud Resources Inc. – Gollier Creek Kaolin Project
Application Type of SCM 2000 2001 Fly ash 1,200 1,220 Slag 25 25
Grouts, mortars & repair blends
Silica Fume 150 150
Fly ash 60,000 60,000 Slag 120,000 120,000
Mining
Silica Fume 2,500 2,500
Fly ash 64,100 64,100 Slag 120,025 120,025
Total
Silica Fume 14,650 14,650 Source: Bouzoubaâ and Fournier, 2003

SCOTT WILSON RPA www.scottwilson.com www.scottwilsonmining.com
18-40
TABLE 18-11 BLENDED CEMENT PRODUCTION AND CONSUMPTION IN CANADA (TONNES)
Whitemud Resources Inc. – Gollier Creek Kaolin Project
SCMs Used in Blended Cements 2000 2001 2002 Fly Ash ~5,250 ~10,150 6,000
Blast Furnace Slag 4,000 11,200 16,000 Silica Fume 16,910 19,390 22,114
Blended Cement Use by Application
2001 2002 Main type of SCM used in blended cement
HPC (bridge decks, bridge elements, parking garages, marine concrete, high-rise)
130,000 138,500 SF
Shotcrete & RCC 42,000 43,500 SF
Other (precast, cement board, sidewalks)
14,000 34,500 SF
HPC (highway pavements)
40,000 60,000 Ternary blends
32,000 Fly ash & GGBFS Mining industry, rural areas 25,000 25,000 Ternary blends
Source: Bouzoubaâ and Fournier, 2003
SCMs are used in cement and concrete to improve performance and/or reduce costs.
For most applications, cost reduction is the key driver of demand. This accounts for the
dominance of fly ash and slag use in concrete. These materials are lower cost than
Portland cement and can substitute for Portland cement at relatively high levels, thus
reducing the overall cost of the cementitious component of the concrete mix. A 2002
study by NLK Consultants Inc. (NLK) prepared for EcoSmart indicated that 90% of
concrete used in western Canada contained fly ash (NLK, 2002). Furthermore, the report
indicated the following:
• Approximately 25% - 30% of concrete used in western Canada has a compressive strength requirement of 30 MPa or greater.
• 90% of concrete in western Canada uses fly ash. • Direct substitution of metakaolin for silica fume in high strength concretes is
possible, but demand for metakaolin would be limited.

SCOTT WILSON RPA www.scottwilson.com www.scottwilsonmining.com
18-41
• Metakaolin can be an attractive cementitious material in concretes provided it is priced at or near the cost of Portland cement. At this pricing level, partial replacement of Portland cement with metakaolin and fly ash can achieve meaningful reductions in overall concrete costs.
• Ternary blends incorporating PC-FA-MK at MK addition levels of 15%
replacement of PC have equivalent compressive strengths to binary PC-FA mixes with 40% FA (Bai, 2001).
• The western Canadian concrete market was approximately 5 million m3 in
2002. • Portland cement costs approximately $130/tonne in western Canada for non-
oilfield applications.
Based on these data, NLK projected a potential market demand in western Canada
(British Columbia, Alberta, Saskatchewan) of approximately 200,000 tonnes per year of
MK assuming a 60% PC:25% FA:15% MK ternary concrete mix would meet most
concrete requirements.
WRI contracted John A. Bickley, P. Eng., a well-known consultant specializing in the
construction materials and cement industry, to conduct an analysis of the demand for
metakaolin in the Canadian construction cement and concrete market. Bickley reported
the 2004 Canadian demand for concrete as follows (Table 18-12):

SCOTT WILSON RPA www.scottwilson.com www.scottwilsonmining.com
18-42
TABLE 18-12 CANADIAN CONCRETE MARKET – 2004 (M3) Whitemud Resources Inc. – Gollier Creek Kaolin Project
Ready-Mix Province
Total Residential Pre-cast Concrete
Products Total
PEI NL NB NS
1,870,000 260,000 150,000 100,000 2,120,000
Quebec 5,800,000 1,856,000 Ontario 9,940,000 3,180,000 977,250 1,490,000 18,207,250Manitoba 280,000 97,340 42,500 35,000 357,500Saskatchewan 420,000 167,500 8,750 23,750 452,500Alberta 4,030,000 2,015,000 187,500 187,500 4,405,000British Columbia 3,280,000 1,600,000 100,000 62,500 3,442,500Total 25,600,000 9,175,840 1,466,000 1,989,750 28,984,750
Source: J.A. Bickley, 2006
The results of the Bickley study indicate the following:
• The Canadian market for ready-mix concrete in 2004 was 25.6 million m3. • Ready-mix concrete used in residential applications in Canada totalled 9.176
million m3 in 2004. • Metakaolin can replace between 10% and 20% of cement in ready-mix
concrete. • Metakaolin has equivalent performance to silica fume and can replace 100%
of the silica fume used in concrete. • Metakaolin can replace silica fume used in concretes for Exposure Classes C1
and A1. • Metakaolin can be used in HVFA concrete with good effect. • Demand for metakaolin for use in concrete markets from Quebec to British
Columbia is estimated to be 60,000 – 70,000 tonnes in Year 1 and 440,000 to 510,000 tonnes in Year 10 based on a typical mix design using 40 kg metakaolin per cubic metre concrete.

SCOTT WILSON RPA www.scottwilson.com www.scottwilsonmining.com
18-43
United States
WRI is well positioned to supply metakaolin to the Pacific Northwest, Plains and
Midwest regions of the United States. These markets are within 1,000 miles of WRI’s
Gollier Creek plant and can be serviced at competitive transportation costs (Figure 18-9).
FIGURE 18-9 U.S. TARGET MARKET REGION
Data on Portland cement consumption by state for 2004 and 2005 for the defined
market area show the following (Table 18-13, Figure 18-10):

SCOTT WILSON RPA www.scottwilson.com www.scottwilsonmining.com
18-44
TABLE 18-13 U.S. REGIONAL PORTLAND CEMENT SHIPMENTS – 2004 (‘000 TONNES)
Whitemud Resources Inc. – Gollier Creek Kaolin Project
State Ready-Mix Concrete
Concrete Products
Contractors Total1
Illinois 2,280 373 113 3,939 Minnesota 1,605 (est) 228 (est) 104 (est) 2,077 Wisconsin 1,785 (est) 254 (est) 115 (est) 2,309 Montana, Idaho, Nevada, Utah 2,590 238 116 3,245 Oregon & Washington 1,960 390 178 2,690 Iowa, Nebraska, S. Dakota, N. Dakota
3,660 589 358 4,802
Kansas 1,650 131 322 2,222 Colorado & Wyoming 2,170 314 179 2,786 Total 17,700 2,517 1,485 24,070 Notes. est. = estimate 1 includes uses not specified Source: U.S.G.S. Minerals Yearbook, Cement, 2004

Illinois
4,500
Nearest-plant U.S. Portland Cement Markets by State2005
Million Metric Tons
2,500
3,000
3,500
4,000
500
1,000
1,500
2,000
0
Mic
hig
an
Mis
souri
Colo
rado
Wis
consin
Okla
hom
a
Iow
a
Min
nesota
India
na
Washin
gto
n
Wyom
ing
South
Dakota
Idaho
Nebra
ska
Kansas
Nort
hD
akota
Monta
na
January 2008 Source: Whitemud Resources Inc., 2006.
Whitemud Kaolin Project
2005 U.S. Regional Market
Whitemud Resources Inc.
Saskatchewan, Canada
Figure 18-10
18-4
5
SC
OT
TW
ILS
ON
RP
Aw
ww
.scottw
ilson
.com
ww
w.sco
ttwilso
nm
inin
g.co
m

SCOTT WILSON RPA www.scottwilson.com www.scottwilsonmining.com
18-46
CTL was contracted by WRI to conduct an analysis of the U.S. cement market and
provide an update of market developments through Q2, 2006. CTL reported that Portland
cement consumption was up 12% in Q2/06 versus Q2/05. Total U.S. Portland cement
consumption was approximately 121 million tonnes in 2005 (Figure 18-11). Demand
growth on a regional basis is illustrated in Figure 18-12.

U.S. Portland Cement Consumption2000 - 2005
Million Metric Tons
2000 2005
125
2004200320022001
100
105
110
115
120
90
95
January 2008 Source: Whitemud Resources Inc., 2006.
Whitemud Kaolin Project
U.S. Cement Consumption
Whitemud Resources Inc.
Saskatchewan, Canada
Figure 18-11
18-4
7
SC
OT
TW
ILS
ON
RP
Aw
ww
.scottw
ilson
.com
ww
w.sco
ttwilso
nm
inin
g.co
m

U.S. Portland Cement Consumption2000 - 2005
Million Metric Tons
NewEngland
EastSouth
Central
30
SouthAtlantic
WestNorth
Central
EastNorth
Central
MiddleAtlantic
5
10
15
20
25
0
WestSouth
Central
PacificMountain
Legend:
2000 2001 2002 2003 2004 2005
January 2008 Source: Whitemud Resources Inc., 2006.
Whitemud Kaolin Project
Regional Demand GrowthCement Consumption
Whitemud Resources Inc.
Saskatchewan, Canada
Figure 18-12
18-4
8
SC
OT
TW
ILS
ON
RP
Aw
ww
.scottw
ilson
.com
ww
w.sco
ttwilso
nm
inin
g.co
m

SCOTT WILSON RPA www.scottwilson.com www.scottwilsonmining.com
18-49
Consumption in 2006 is projected to decline slightly due to a decline in housing
starts. Non-residential construction activity, particularly highways, may offset some of
the decline. On a regional basis, CTL estimated that WRI would be able to competitively
access markets within a 1,000 mile radius of the Gollier Creek plant. This area extends
from Washington and Oregon in the Pacific Northwest south to northern Texas and east
to Michigan. The Mid-west region is regarded as the primary target market area.
CTL classified WRI’s market opportunities into three categories:
• High Performance
Markets characterized by high price, low volume applications such as high-strength concrete in columns and shear walls of high rise buildings and low permeability concrete in bridge decks;
• Enhanced Performance
Markets characterized by a requirement for enhanced durability at moderate cost increase to conventional concretes. These markets are value priced and offer significant volume potential. Typical examples include applications with enhanced resistance to chloride ion permeability and ASR, self-compacting concretes, concrete paving, and concretes combining improved durability with enhanced finishing characteristics;
• Mainstream Applications
These applications are low price but have substantial volume. Metakaolin use in these applications reduces the overall cost of the cementitious mix while improving finishability. Major target applications include floors, walls and exterior flatwork for both commercial and residential markets.
Overall, CTL concluded that the immediate U.S market available to WRI could be up
to 300,000 tonnes per year of metakaolin, with a potential market demand exceeding 2.5
million tonnes per year.
KAOLIN MARKETS WRI is anticipating sales of kaolin as part of its product mix. Kaolin will be sold on
an opportunistic basis as it is the intermediate product between the raw kaolinized
sediment feed ore and the calcined metakaolin. The proposed production process will

SCOTT WILSON RPA www.scottwilson.com www.scottwilsonmining.com
18-50
recover kaolin in the form of air floated kaolin. This product is used in the manufacture of
roofing shingle granules, as an inert filler in rubber and asphalt compositions, as a source
of alumina (and silica) in the manufacture of fiberglass, ceramics (sanitaryware, tiles),
cement, brick, and several other applications. Depending on the source material, air
floated kaolin may be extremely pure with very low levels of grit (micron size silica
quartz, feldspar and micas) or contain relatively high percentages of grit. Air floated
kaolin with relatively high percentages of grit is not suitable for use in paper, plastics,
paint and rubber applications.
Air floated kaolin, especially for relatively low quality material, is low priced and
transportation sensitive. Major regional markets for the kaolin are anticipated to be
roofing granules, refractory brick manufacture and fiberglass. Smaller scale opportunities
may be available in filler and other applications.
WRI has conducted an extensive analysis of the available markets and has received
letters of intent and/or expression of interest from a number of potential Canadian and
U.S. customers. Currently identified markets total approximately 25,000 tonnes of
product, which is WRI’s target product volume.
REGULATORY FACTORS AFFECTING MARKET Metakaolin is classed as a natural pozzolanic material and its specifications and use in
cement are governed by CSA Specification A3001-03 (Class N pozzolan) in Canada and
ASTM Standard C618-03 (Standard Specification for Coal Fly Ash and Raw or Calcined
Natural Pozzolans for Use as a Mineral Admixture in Concrete). In addition to meeting
these specifications, the use of metakaolin in ready-mix concrete and blended cements
may be controlled by various provincial and state authorities. This is especially true for
major public works projects where the contracting authority must approve materials prior
to use.
Metakaolin has been approved for use in concrete applications by the Departments of
Transport of New York, Illinois, Florida and California. Approval for use in other state

SCOTT WILSON RPA www.scottwilson.com www.scottwilsonmining.com
18-51
highway construction projects will be required to expand the market. Approvals for use
of metakaolin in provincial highway construction projects will also be required. This will
necessitate testing of various mix designs to provide sufficient engineering data to
confirm the physical, mechanical and chemical properties of metakaolin use. Many of the
pertinent data require substantial time to acquire as tests are of long duration.
It is anticipated that regulatory approvals for the use of metakaolin in oilwell
cementing applications will be secured by the oilfield service companies, as is current
practice with other cementing materials. Technical assistance from WRI to develop
appropriate engineering data may be required.
The cement industry is a significant contributor to greenhouse gas (GhG) generation
in North America. In the United States, the cement industry accounts for approximately
3.7% of total combustion related industrial GhG emissions in 2001 (U.S. EPA, 2005). On
average, each tonne of cement production results in approximately 0.97 tonnes of CO2
emissions resulting from fuel combustion and from breakdown of carbonates during
calcination. The use of metakaolin can considerably reduce CO2 generation in cement
production as metakaolin is calcined at a much lower temperature, resulting in less fuel
consumption. In addition, there are no carbonates in kaolin which could contribute
additional CO2 during the calcining process. The net reduction in CO2 generation with
metakaolin compared to Portland cement is approximately 55% on a tonne equivalent
basis. Thus, substitution of Portland cement by metakaolin can significantly reduce the
cement industry’s net GhG generation. As increasingly stringent restrictions on GhG
emissions are put in place, it may be anticipated that cement producers will seek to meet
the reduced limits by substituting metakaolin for Portland cement.
COMPETITION Metakaolin is produced by four companies in the United States. All current
production is based in the southeast U.S. in either Georgia or South Carolina. The four
current metakaolin producers are:

SCOTT WILSON RPA www.scottwilson.com www.scottwilsonmining.com
18-52
• BASF Catalysts LLC (formerly Engelhard Corporation)
Brand name is MetaMax. Produced at Sandersville, Ga. Production capacity unknown. Product focus is on HPC and architectural concrete applications. Integrated kaolin producer with mines and processing plants focused on paper applications. Believed to be the largest metakaolin producer in the United States.
• Thiele Kaolin Company
Brand name is Kaorock. Produced at Sandersville, Ga. Production capacity unknown. Product focus is on HPC, architectural concretes, mortars and gunning mixes. Integrated kaolin producer with mines and processing plants focused on paper applications. Relatively recent entrant into metakaolin market for construction related applications.
• ISG Resources (now Headwaters Resources)
Brand name is CEMax. Processes crude metakaolin produced by CE Minerals, a subsidiary of Imerys inc., at Sandersville, Ga. Previously produced metakaolin at plant in Ione, Ca. Markets metakaolin across full range of applications. (Note: Imerys produces and markets the MetaStar line of metakaolin products in the U.K.) Headwaters Resources is the largest marketer of coal combustion products (fly ash) in the United States. Focus of the company is on sale of fly ash. Metakaolin is a very small segment of the business.
• Advanced Cement Technologies
Brand name is PowerPozz. Markets metakaolin produced under contract by Grace Davison, Natka Clay division in Aiken, S.C. The Grace product is called MK 50 and is sold by W.R. Grace Construction Products. ACT maintains a supply terminal in Stockton, Ca. Markets metakaolin across full range of applications. Believed to be the second largest marketer of metakaolin in the United States.
No data are available on the production capacity or sales of any of the producers.
Both BASF and Thiele are fully integrated kaolin mining and production companies and
produce a wide range of kaolin products, including calcined kaolin. Metakaolin
production is believed to be a very small portion of the sales of both companies. ISG
Resources and Advanced Cement Technologies concentrate on the marketing of cement
additives and metakaolin is considered to be an important part of the product mix of each
company.

SCOTT WILSON RPA www.scottwilson.com www.scottwilsonmining.com
18-53
BASF and Advanced Cement Technologies are considered to be the most significant
participants in the metakaolin market. Each company has a well developed web site
detailing the properties and uses of metakaolin, with a considerable amount of technical
data available. Both companies have been active in the metakaolin market since at least
the mid-1990s.
PRICING Metakaolin is currently a high priced specialty product. Typical product prices range
from US$400/tonne to in excess of US$ 600/tonne. The high price of metakaolin has
precluded its widespread use. WRI intends to price its metakaolin product at levels
competitive with Portland cement, adjusted for the specific performance attributes of the
metakaolin in each target market application. Product will be sold on a delivered cost
basis. Market research analysis by WRI and its consultants indicates that this pricing
strategy should lead to rapid market penetration and a significant increase in metakaolin
use in all target markets.
MARKET SUMMARY Independent market research conducted by WRI has identified significant Canadian
and U.S. markets for WRI’s metakaolin products. These markets are conservatively
estimated to initially exceed 600,000 tonnes and could exceed 3.2 million tonnes within
10 years given a well developed technical development and marketing program.
WRI has received initial purchase orders and letters of intent and/or expressions of
interest for over 160,000 tonnes per annum of metakaolin (Table 18-14). Anticipated
future purchase commitments from identified markets exceed 575,000 tonnes per annum
within the next 6 – 8 years. Expansion of the customer base beyond this level to reach full
production capacity of 700,000 tonnes metakaolin per year is believed to be reasonable
and achievable.

SCOTT WILSON RPA www.scottwilson.com www.scottwilsonmining.com
18-54
TABLE 18-14 WRI INITIAL SALES COMMITMENTS (TONNES, ANNUALIZED THROUGH 2008)
Whitemud Resources Inc. – Gollier Creek Kaolin Project Market Application Market Area
Oilfield Cements Ready-Mix Concrete Canada 45,000 50,600 United States 15,000 50,000 Total 60,000 100,600
Markets for approximately 25,000 tpa of raw kaolin have been identified, with strong
customer interest expressed.
Achievement of the projected sales volume will be dependent upon WRI providing
consistent product quality and undertaking extensive education and testing programs
related to the use of metakaolin with cement and ready-mix concrete companies,
consulting engineers and concrete specifiers, and regulatory agencies.
ENVIRONMENTAL CONSIDERATIONS
WRI submitted a Project Proposal on April 19, 2006 for its Gollier Creek Project to
the Environmental Assessment Branch of Saskatchewan Environment for environmental
assessment approvals for the Project under the Saskatchewan Environmental Assessment
Act and the Canada-Saskatchewan Agreement on Assessment Cooperation. The Project
Proposal covered development of a mine and processing plant for Phase I of the Project.
Approval of the Project was received from Saskatchewan Environment on July 24, 2006.
This approval also constituted approval by Environment Canada under the terms of the
Saskatchewan-Canada Agreement.
No legacy environmental liabilities associated with the project site have been
identified. The properties are entirely farmland and rangeland, and have never been
subject to industrial development.

SCOTT WILSON RPA www.scottwilson.com www.scottwilsonmining.com
18-55
No significant conditions are attached to the approval. Additional studies related to
endangered plant and animal species, surface drainage, heritage resources,
decommissioning and reclamation plans, and quarry impacts on groundwater are
underway to clarify specific issues. However, the project development schedule will not
be affected by the timing of completion of the studies. Alternative mitigation measures to
protect the leopard frog population in the Gollier Creek valley have been agreed upon.
These measures will prevent seasonal migration of the frogs into the quarry area and
permit year-round extraction and rehabilitation of the pit.
The major environmental and socio-economic impacts identified in the study and the
proposed mitigation measures are summarized in Table 18-15. Amendments to the
Assessment Approval will be required when the Project proceeds to Phase 2 and
eventually to its maximum projected capacity of 700,000 tonnes per year metakaolin.
Assessment approval for the expanded scope of the Project is anticipated to be received
in due course.
PERMITTING The following actions and permits are anticipated to be required prior to
commencement of operations:
• Quarrying Lease under the Crown Minerals Act, • Approval by Saskatchewan Watershed Authority respecting surface and
groundwater impacts, • Permits under the Heritage Resources Act, if required (believed unlikely at
present), • Permit to construct works (land disturbance, tailings disposal in quarry, site
monitoring systems) under the Environmental Management and Protection Act,
• Permit to operate works under the Environmental Management and Protection Act,
• Zoning approval and servicing agreements (roads, fire protection, domestic water, etc.) from municipality,
• Roads Partnership Agreement with Saskatchewan Department of Transportation for excess load operating permit,
• Permit for industrial water use from Saskatchewan Watershed Authority, • Building permit from municipality, and

SCOTT WILSON RPA www.scottwilson.com www.scottwilsonmining.com
18-56
• Quarry design approval under Mines Regulations of Saskatchewan Occupational Health and Safety Act.
All required permits have been received in time and there are no outstanding permits
or environmental issues affecting commercial start-up of the process plant or mining
operations.
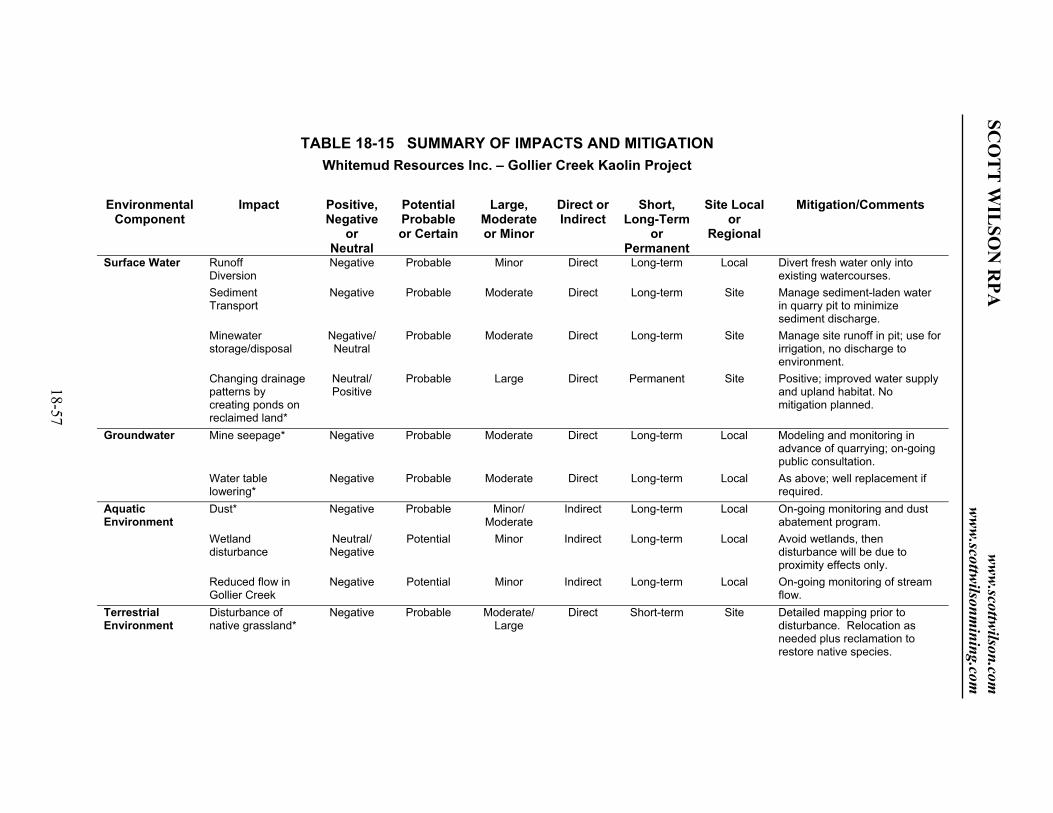
TABLE 18-15 SUMMARY OF IMPACTS AND MITIGATIONWhitemud Resources Inc. – Gollier Creek Kaolin Project
Environmental Component
Impact Positive, Negative
orNeutral
PotentialProbableor Certain
Large,Moderate or Minor
Direct or Indirect
Short,Long-Term
orPermanent
Site Local or
Regional
Mitigation/Comments
Surface Water RunoffDiversion
Negative Probable Minor Direct Long-term Local Divert fresh water only into existing watercourses.
Sediment Transport
Negative Probable Moderate Direct Long-term Site Manage sediment-laden water in quarry pit to minimize sediment discharge.
Minewater storage/disposal
Negative/Neutral
Probable Moderate Direct Long-term Site Manage site runoff in pit; use for irrigation, no discharge to environment.
Changing drainage patterns by creating ponds on reclaimed land*
Neutral/ Positive
Probable Large Direct Permanent Site Positive; improved water supply and upland habitat. No mitigation planned.
Groundwater Mine seepage* Negative Probable Moderate Direct Long-term Local Modeling and monitoring in advance of quarrying; on-going public consultation.
Water table lowering*
Negative Probable Moderate Direct Long-term Local As above; well replacement if required.
Aquatic Environment
Dust* Negative Probable Minor/ Moderate
Indirect Long-term Local On-going monitoring and dust abatement program.
Wetland disturbance
Neutral/ Negative
Potential Minor Indirect Long-term Local Avoid wetlands, then disturbance will be due to proximity effects only.
Reduced flow in Gollier Creek
Negative Potential Minor Indirect Long-term Local On-going monitoring of stream flow.
Terrestrial Environment
Disturbance of native grassland*
Negative Probable Moderate/ Large
Direct Short-term Site Detailed mapping prior to disturbance. Relocation as needed plus reclamation to restore native species.
SCO
TT
WIL
SON
RPA
www.scottwilson.com
www.scottwilsonm
ining.com
18-57

Environmental Component
Impact Positive, Negative
orNeutral
PotentialProbableor Certain
Large,Moderate or Minor
Direct or Indirect
Short,Long-Term
orPermanent
Site Local or
Regional
Mitigation/Comments
Introduction of non-native species
Negative Potential Minor/ Moderate
Indirect Long-term Site Best practices for reclamation.
Disturbance of cultivated land*
Neutral Certain Major/Large Direct Permanent Site Best practices for reclamation to return land to agricultural production.
Disturbance of rare plants*
Negative Potential Moderate Direct Short-term Site Relocation and reclamation as required.
Wildlife Disturbance of sensitive wildlife habitat; disturbance of native animals*
Negative Probable Major Large/Moderate
Direct Long-term Site Detailed studies currently under way. Adjust operations to minimize disturbance. Reclaim to restore habitat at earliest possible date.
Disturbance to migratory birds
Negative Potential Minor/ Moderate
Indirect Long-term Local Detailed inventory prior to quarry and plant startup. Avoidance of sensitive nesting areas and times.
Disturbance of leopard frog habitat
Negative Potential Minor Indirect Short-term Local Avoidance of critical habitat. On-going monitoring.
Disturbance of native animals
Negative Probable Minor Indirect Long-term Local Avoidance of critical habitat; progressive reclamation to minimize period of disturbance.
Air Quality Dust and particulates*
Negative Certain Moderate Direct Long-term Local Best abatement practices in quarry and plant.
CO2 and GHG* Neutral/ Positive
Certain Moderate Direct Long-term Regional Significant GHG reduction for equivalent cement production.
Land Use Modification of topography of quarried land*
Neutral Certain Major/Large Direct Permanent Site None planned beyond routine reclamation.
Disturbance of cultivated land*
Neutral Certain Major/Large Direct Permanent Site Minimize active quarry footprint. Reclaim to support agricultural use as soon as practicable after quarrying.
HeritageResources
Paleontological Resources
Negative/Neutral
Unlikely Minor Direct Permanent Site None planned.
SCO
TT
WIL
SON
RPA
www.scottwilson.com
www.scottwilsonm
ining.com
18-58

Environmental Component
Impact Positive, Negative
orNeutral
PotentialProbableor Certain
Large,Moderate or Minor
Direct or Indirect
Short,Long-Term
orPermanent
Site Local or
Regional
Mitigation/Comments
Archaeological Resources
Negative Potential Minor/ Moderate
Direct Permanent Site Detailed mapping prior to disturbance. Treatment as required in accordance with Saskatchewan regulations.
Historical Resources
Neutral Unlikely Minor Direct Permanent Site None planned.
Socio-Economic Labour Market* Positive Certain Major/Large Direct Long-term Local/ Regional
On-going consultations with community.
Local and regional institutions*
Positive Probable Moderate Indirect Long-term Local/ Regional
On-going consultations with community.
Local and regional businesses*
Positive Certain Moderate Direct Long-term Local/ Regional
On-going consultations with community.
Transportation infrastructure*
Neutral/ Positive
Certain Minor/ Moderate
Direct Long-term Local/ Regional
On-going consultations and agreement with municipalities and Province of Saskatchewan.
*Denotes impacts that are judged to be significant
Source: Clifton, (2006)
SCO
TT
WIL
SON
RPA
www.scottwilson.com
www.scottwilsonm
ining.com
18-59

SCOTT WILSON RPA www.scottwilson.com www.scottwilsonmining.com
18-60
CAPITAL AND OPERATING COST ESTIMATES
CAPITAL COSTS Capital cost estimates have been prepared based on estimates for fixed plant and
equipment developed by Hatch Energy (Hatch). The plant capital cost estimates exclude
items such as owners costs, final commissioning and vendor support and permit costs are
excluded. WRI has provided estimates for pre-commercialization start-up costs, pre-
stripping costs, infrastructure costs and associated items. Phase I cost estimates from
Hatch Optima are at the Class IV level of detail (accuracy of +30%/-15%) and are
suitable for pre-feasibility study purposes. Cost estimates are current as of Q3, 2006. Cost
estimates have not been adjusted for the recent reduction in provincial sales tax from 7%
to 5%. Phase II capital cost estimates are at the Class V level of detail (accuracy +50%/-
30%). Hatch has assumed a doubling of the combined Phase I and Phase II costs for
expansion of the plant to its ultimate capacity of 700,000 tonnes per annum metakaolin.
Total estimated capital costs for the Phase 1 are $54.564 million. Capital costs
associated with plant expansion for Phase II are estimated at $18.645 million. Hatch
provided a preliminary estimate of $73.209 million for doubling the capacity of the plant
to its ultimate capacity.
WRI has estimated infrastructure costs of $1.0 million for installation of the gas line
and $1.0 million for plant start-up costs prior to achieving commercial production. The
pre-stripping and plant start-up costs are treated as Canadian Exploration Expense (CEE)
for income tax purposes. An allowance of $0.8 million has been provided for
contingencies associated with infrastructure requirements. Pre-stripping costs of $2.46
million are incorporated in the Year 1 mining costs in the financial analysis.
Sustaining capital is estimated at $1.0 million per year for process plant requirements.
A Cat 966 front end loader used for recovering crushed ore in the ore storage building
and for coal handling is replaced after five years. A second loader is required when plant
capacity is increased to 700,000 tonnes metakaolin. Loaders are replaced at the end of
their expected service life.

SCOTT WILSON RPA www.scottwilson.com www.scottwilsonmining.com
18-61
Scott Wilson RPA has reviewed the capital cost estimates and assumptions and is of
the opinion that they are reasonable. Scott Wilson RPA is of the opinion that the level of
accuracy of the estimates is sufficient to enable their use in a discounted cash flow
financial analysis at the pre-feasibility study level of detail.
Tables 18-16 and 18-17 detail the estimated plant capital costs for Phase I and Phase
II. Details of the Hatch capital cost estimate are provided in Appendix 3.

SCOTT WILSON RPA www.scottwilson.com www.scottwilsonmining.com
18-62
TABLE 18-16 PROCESS PLANT CAPITAL COST ESTIMATE – PHASE I
Whitemud Resources Inc. – Gollier Creek Kaolin Project
Description Equipment C$‘000
Materials C$‘000
Subcontract C$‘000
Labour C$‘000
Total C$‘000
Engineering 4,522 Packaged Units 8,694.4 303.7 2,075 8,750.2 Compressors &
Drives 41.0 9.4 13.6 63.9
Pumps & Drives 163.5 126.8 139.0 429.3 Storage Tanks 77.3 6.2 11.4 94.8
Special Equipment 3,720.6 341.4 1,323.4 5,385.4 Miscellaneous 46.4 12.1 30.7 89.1
Site Work/Site Prep. 155.3 97.7 2,444.6 88.4 2,796.9 Instrumentation &
Controls 509.0 62.5 183.0 754.5
Electrical 744.3 900.6 5.8 1,844.6 3,495.2 Process Piping 23.1 207.2 24.6 202.9 457.8 Structural Steel 2,528.5 90.3 1,571.8 4,190.6
Buildings & Components
571.1 60.2 3,624.1 240.5 4,495.9
Other Direct Field Costs
200.0 5.0 1,615.0 135.0 1,955.6
Concrete & Foundations
731.7 10.4 2,941.3 9.2 3,692.6
Field Construction Management
1,160.0 1,160.0
Insulation 19.4 183.7 203.2 Taxes & Duties 102.5 102.5
Painting & Surface Treatment
63.9 63.9
Fire Protection 10.3 2.2 12.5 Other Direct Field
Costs 168.1 1,046.0 112.4 1,326.5
Indirect Field Costs 180.0 180.0 Field Construction
Management 283.1 283.1
Taxes & Duties 466.2 159.4 Sub-Total 15,477.4 4,863.5 15,703.2 8,031.7 44,075.8 + Total tax1 1,062.6 331.6 1,394.3
+20% Contingency 3,308.0 1,039.0 3,140.7 1,606.3 9,094.0 TOTAL 19,848.0 6,234.2 18,843.9 9,638.0 54,564.1
1 based on 7% Provincial Sales tax Note: Data are rounded and may not add

SCOTT WILSON RPA www.scottwilson.com www.scottwilsonmining.com
18-63
TABLE 18-17 PROCESS PLANT CAPITAL COST ESTIMATE – PHASE II Whitemud Resources Inc. – Gollier Creek Kaolin Project
Description Equipment
C$‘000 Materials
C$‘000 Subcontract
C$‘000 Labour C$‘000
Total C$‘000
Engineering 1,872
Packaged Units 6,825.0 254.1 1,671.1 8,750.2
Special Equipment 54.6 77.1 210.2 341.8
Miscellaneous 47.3 12.3 31.3 90.9
Site Work/Site Prep. 22.4 22.4
Instrumentation & Controls
51.7 7.3 45.7 104.7
Electrical 80.9 156.3 322.5 559.7
Process Piping 62.0 37.5 29.2 128.6
Structural Steel 333.4 191.0 524.5
Buildings & Components 26.3 285.5 88.2 399.9
Concrete & Foundations 202.9 202.9
Field Construction Management
1,160.0 1,160.0
Insulation 17.5 165.5 183.0
Taxes & Duties 102.5 102.5
Other Direct Field Costs 70.5 403.5 21.3 495.3
Indirect Field Costs 60.0 60.0
Field Construction Management
456.8 456.8
Taxes & Duties 159.4 159.4
Sub-Total 7,059.4 1,016.8 3,499.9 2,775.9 14,352.1
+ Total tax1 494.2 69.9 564.1
+25% Contingency 1,888.4 271.7 875.0 694.0 3,729.0
TOTAL 9,442.0 1,385.4 4,374.9 3,469.9 18,645.1
1 based on 7% Provincial Sales tax Note: Data are rounded and may not add

SCOTT WILSON RPA www.scottwilson.com www.scottwilsonmining.com
18-64
OPERATING COSTS WRI intends to conduct stripping, mining and mine rehabilitation operations under
contract. Two major contracts are planned – one for stripping and site rehabilitation and
one for mining. Scott Wilson RPA has prepared estimates of stripping, mining and
rehabilitation costs assuming contract operations. The cost estimates are based on the
mine production schedule summarized in Table 18-1 and incorporate reasonable
assumptions regarding haul distances, equipment cycle times, equipment productivity and
availability, fuel costs and other operating costs. Depreciation charges for contractor-
owned equipment are assumed to be spread over the useful life of the equipment and are
based on current capital costs for the selected equipment.
Operating costs for the process plant have been developed on the following basis:
• Mass and energy balances as provided by WRI and reviewed and verified by Consultec,
• Labour staffing and wages as detailed by WRI, • Unit energy costs as provided by WRI , • Consumables, maintenance and service contractor costs as provided by WRI, • Distribution costs as provided by WRI • General and administrative costs as provided by WRI.
Scott Wilson RPA has reviewed the cost estimates and assumptions used in
developing the estimates and is of the opinion that they are reasonable and appropriate for
a pre-feasibility study level of detail. Appendix 4 provides full details of the process
mass and energy balance calculations and operating cost assumptions.
MINE OPERATING COSTS
Mine operating costs include all costs associated with stripping, mining and ore
haulage, tailings handling and rehabilitation. These operations will be contracted out.
Mining costs are based on a fleet comprising Hitachi EX 1200 excavators (2), Cat 988
front end loaders (2), Cat 773 haul trucks (6), Cat D8R dozer (2) and Cat 14H grader (1).
It is assumed that the contractor will charge a start-up mobilization cost and will provide
its own maintenance shops, service and fuelling vehicles.

SCOTT WILSON RPA www.scottwilson.com www.scottwilsonmining.com
18-65
Mine operating costs are based on a 2 shift/day, 5 day per week operation. This
schedule is sufficient to handle the projected annual tonnages of overburden, ore and
tailings. Process plant staff are responsible for haulage of tailings from the plant to the pit
during the night shift. The costs for this work are included in plant operating costs.
Estimated life-of-mine costs for mining operations are detailed in Table 18-18:
TABLE 18-18 LIFE-OF-MINE MINING COSTS
Whitemud Resources Inc. – Gollier Creek Kaolin Project
Contract & Operation Total Tonnes Moved Unit Cost ($/tonne moved) Overburden Contract: 71,744,962
Stripping 0.42 O/B Haulage 0.35
Haul Road maintenance 0.05 Labour 0.85
Contractor O/H & Profit 0.35 Total 2.02
Kaolin Mining Contract: 52,863,143 Loading 0.41 Haulage 0.44
Haul Road maintenance 0.05 Dewatering, General Mine &
Shops
0.24 Labour 1.51
Contractor O/H & Profit 0.55 Total 3.20
Tailings Handling: 29,354,650 Loading 0.18 Haulage 0.34
Placement 0.38 Labour 0.93
Contractor O/H & Profit 0.38 Total 2.23
Reclamation Costs 3,759,058 0.85
Crown royalties on mine production are $0.05 per tonne ore (equivalent to
$0.15/tonne product sold).

SCOTT WILSON RPA www.scottwilson.com www.scottwilsonmining.com
18-66
PROCESS PLANT COSTS Process plant costs are based on the projected unit energy consumption and unit
energy costs developed from the energy balance calculations developed by Consultec and
WRI; projected run-of-mine feed, product recoveries developed by WRI and Consultec,
labour requirements as developed by WRI, and general and administrative costs as
developed by WRI. Scott Wilson RPA has reviewed all of the assumptions underlying the
operating costs and believes them to be reasonable. Major operating costs are
summarized below.
Energy
Energy costs are based on current rates for electric power, natural gas and coal from
SaskPower, SaskEnergy and Luscar Coal. Projected unit energy consumption for Phase I
and Phase II is:
Phase I Phase II Electricity: Demand 1,400 KVA 2,125 KVA Consumption: Dry kaolin production 7.7 kWh/t 6.6 kWh/t Metakaolin production 35.4 kWh/t 36 kWh/t Natural Gas: Dry kaolin production 1.3GJ/t 0.04 GJ/t Maximum gas consumption: 31.65GJ/hr 31.65 GJ/hr Coal: Dry kaolin production 0 1.3192 GJ/t Metakaolin production 2.79 GJ/t 2.13 GJ/t Maximum coal consumption 63.3 GJ/hr 63.3 GJ/hr
Energy costs are based on quotations from suppliers. Current (2006) rates are:
Electricity: Demand: first 50 KVA $0
Balance $12.62/KVA/month Monthly admin. Charge $38.50
Consumption: $0.0831 first 14,000 kWh/month $0.0344/kWh/month on balance

SCOTT WILSON RPA www.scottwilson.com www.scottwilsonmining.com
18-67
Natural gas: Demand: $7.2835/GJ of maximum daily demand in month Consumption: $7.30/GJ
Coal: $2.82/GJ delivered based on LHV of 16.25 GJ/t
Over the life of the Project, total energy costs are projected to average $12.65/tonne
product expressed in constant 2006 dollars.
Labour
WRI has based its process plant labour requirements on the experience that
management has in operating cement plants. The management philosophy is to operate
the plant with minimal staff that will have been cross-trained on multiple job functions
and the use of process automation as much as possible for direct control of plant
functions.
WRI intends to utilize outside contractors and consultants for major equipment
maintenance, engineering support, building services and site services such as janitorial,
snow clearing, landscaping, etc.
The process plant will operate on a 24 hour, 3 shift per day, 7 day per week basis.
Projected labour requirements for Phase I and Phase II are detailed below:
Plant Manager 1 Asst. Plant Manager 1 Production Manager 1 Sustainability Manager 1 Maintenance Manager 1 Administration Supervisor 1 Lead Operators 4 Process Operators 5 Maintenance Mechanics 2 Electro-technicians 2 Loader Operators 4 Packing & Shipping 1 (3 in Phase II) Lab. Technician 1 Office clerk 1 Total 26 (28 in Phase II)

SCOTT WILSON RPA www.scottwilson.com www.scottwilsonmining.com
18-68
The organizational structure for the plant staff is illustrated in Figure 18-13. Key
staff, such as the Plant Manager, have already been hired. Wage rates for staff are based
on current salary levels in southern Saskatchewan and are competitive with other major
industries in the region such as the coal mines and potash mines. Life-of-mine average
wage costs are projected to be $4.90/tonne product in constant 2006 dollars.
Maintenance & Repairs
Maintenance and repair costs are based on WRI management experience in operating
similar sized cement plants. The estimated costs include provision for repair of refractory
brick work in the rotary kiln. Significant kiln rebuild costs in excess of normal
maintenance are incorporated into sustaining capital costs. Life-of-project maintenance &
repair costs are estimated at $2.13/t production in constant 2006 dollars.
Other Costs
Other costs include plant contract services, plant consultants, plant G&A costs,
property taxes, plant loader costs, water and plant vehicles. These costs have been
estimated by WRI. Scott Wilson RPA has reviewed the costs for reasonableness. In total,
life-of-project costs for these items total $2.32/tonne production in constant 2006 dollars.
Total plant operating costs are estimated to average $21.96/tonne production over the
life of the Project in constant 2006 dollars.

PlantManager
Production/Process Mgr.
Mine ManagerAsst. Plant Mgr.
SustainabilityManager
AdministrationSupervisor
Office ClerkProcessOperators (9)
MaintenanceManager
PlantMechanics (2)
Electro-Technicians (2)
MaintenanceContractors
Packers &Shippers (3)
Lead Process Operators(1 per shift)
Lab/Field Operators(1 per shift)
Mobile EquipmentOperators (4)(1 per shift)
Plant Loader &Heavy Haul Truck
MiningContractors
January 2008 Source: Whitemud Resources Inc., 2006.
Whitemud Kaolin Project
Plant Organization Chart
Whitemud Resources Inc.
Saskatchewan, Canada
Figure 18-13
18-6
9
SC
OT
TW
ILS
ON
RP
Aw
ww
.scottw
ilson
.com
ww
w.sco
ttwilso
nm
inin
g.co
m

SCOTT WILSON RPA www.scottwilson.com www.scottwilsonmining.com
18-70
Distribution Costs
Product distribution costs are based on WRI’s estimates of the share of product
shipments to major markets by transport mode. WRI has received quotations for road and
rail transport of metakaolin for each location. In addition, WRI will enter into a long-term
service contract with a major transport company to provide haulage and transload
services for rail shipments. Based on the estimated distribution of product shipment by
destination and mode of shipment, average distribution costs are estimated to be
$71.49/tonne product over the life of the Project in constant 2006 dollars.
Head Office General & Administration Costs
WRI’s head office will be located in Calgary, AB. This office will be responsible for
all senior management, finance and accounting, engineering, geology and exploration,
product development, sales and marketing, information technology, human resources
management and government relations functions.
Head office costs have been estimated by WRI and have been reviewed by Scott
Wilson RPA for reasonableness. Head office costs increase over time to accommodate
the increased scope of operations and requirements for additional sales and marketing,
product development and financial and human resources management. Life-of-project
general and administrative costs are estimated at $6.67 per tonne product in constant
2006 dollars.
Operating Cost Summary
Total average life-of-project operating costs are summarized in Table 18-19.

SCOTT WILSON RPA www.scottwilson.com www.scottwilsonmining.com
18-71
TABLE 18-19 TOTAL AVERAGE OPERATING COSTS (LIFE OF MINE BASIS)
Whitemud Resources Inc. – Gollier Creek Kaolin Project
Cost Area $/tonne Product Mining & reclamation 25.15 Production royalties 0.15 Process Plant 21.96 H.O. General & Admin. 6.67 Distribution 71.49 Total Costs 125.42
REVENUES
WRI is planning to sell product on an FOB destination basis. WRI has developed a
marketing strategy based on competitive pricing of metakaolin versus Portland cement.
Product will be priced to maximize the use of metakaolin consistent with the economic
and performance benefits consumers can achieve when replacing Portland cement with
metakaolin. Kaolin will be priced to be competitive with alternative materials in the
selected target markets.
Scott Wilson RPA has reviewed the pricing assumptions provided by WRI and has
conducted independent analysis of the pricing assumptions. Scott Wilson RPA has relied
upon the marketing analysis developed by WRI and their marketing consultants in
developing the economic evaluation of the Project.
Under current pricing assumptions, the life-of-project average delivered cost of
product is estimated to be $209.45 per tonne. Based on this pricing assumption, the
average life-of-mine pre-tax margin is estimated to be $84.03 per tonne product.
INCOME TAXES
Income taxes payable are estimated at a 33.3% combined Federal and Provincial
(Saskatchewan and Alberta) rate on taxable income. Taxable income is reduced in the
early years of the Project through application of the provisions of the Income Tax Act
related to Canadian Exploration Expense (CEE), accelerated Capital Cost Allowance and
standard Capital Cost Allowance. The detailed income tax calculations used in the

SCOTT WILSON RPA www.scottwilson.com www.scottwilsonmining.com
18-72
financial analysis have been prepared by WRI in conjunction with WRI’s tax advisors,
Ernst & Young. Scott Wilson RPA has relied on these tax calculations in preparing the
financial analysis of the Project.
ECONOMIC ANALYSIS
The economic viability of the Project has been evaluated by conventional discounted
cash flow (DCF) analysis. This is the most commonly used procedure for determining the
economic merit of mining ventures.
The Base Case evaluation has been performed on the basis of contract mining, a mine
life of approximately 25.4 years and metakaolin production increasing from 175,000 per
annum in Phase I to 350,000 tonnes in Phase II and 700,000 tonnes when the plant is
doubled in size. This case is assessed under financing assumptions of 100% equity.
Variance analyses are provided for Net Present Value (NPV) at a discount rate of
10% per annum as the capital costs, operating costs, distribution costs and revenues are
varied from their estimated values over a range from minus 25% to plus 25%.
BASIS FOR EVALUATION The application of DCF analysis requires that reasoned estimates be prepared of all
the elements of revenue and expenditure associated with the development and subsequent
operation of the Project, including development and production schedules. These
elements have been discussed in preceding sections of this report and are summarized
below.
CASH REVENUE
Revenue calculations are based on assumed product prices for each market segment
and region. Product volumes by market segment and region are estimated based on
current purchase orders and letters of intent from customers, and projected market
development activity. Discounts have been allowed for initial sales as per the current

SCOTT WILSON RPA www.scottwilson.com www.scottwilsonmining.com
18-73
letters of intent. Sales denominated in US$ have been converted to C$ at an exchange rate
of 1.13.
The life-of-mine average revenue is projected to be $209.45/tonne product (combined
metakaolin and kaolin).
CAPITAL COSTS
Capital costs for the process plant are based on the estimates developed by Hatch.
Capital costs for Phase I are estimated at $54.564 million. Capital costs for expansion in
Phase II are estimated at $18.645 million. Costs for plant expansion to reach the projected
ultimate production capacity are estimated at $146.418 million.
Infrastructure and pre-production costs associated with mine preparation and plant
start-up have been estimated by WRI. These costs are estimated at $1.80 million for
infrastructure and $3.46 million for pre-stripping and plant start-up costs.
Capital costs have been distributed based on amount currently committed for
equipment deposits and the projected construction schedule, including an allowance for
deferral of expenditures for construction hold-backs.
Sustaining capital provides for annual expenditures of $1.0 million for plant
equipment and periodic replacement of the plant loaders. Working capital required to
cover accounts payable pending receipt of revenues is calculated as total direct operating
costs over a 60 day period. This amount changes from year to year and the balance
recovered in the final year.
Sustaining capital of $1.0 million per year is assumed for replacement of major plant
and machinery. Capital costs associated with periodic replacement of the plant loaders are
also included.

SCOTT WILSON RPA www.scottwilson.com www.scottwilsonmining.com
18-74
OPERATING COSTS The average unit costs for contract mining operations are estimated at $3.20/tonne of
run-of-mine ore, $2.02/t overburden moved and $2.23/tonne tailings moved. Reclamation
costs are estimated at $0.85/tonne moved. Total life-of-mine costs are estimated at
$25.15/tonne product.
Average processing costs are estimated at $21.96/tonne product. Distribution costs
are estimated at $71.49 per tonne product.
General and administrative costs are estimated to average $6.67/tonne product over
the life of the Project.
INCOME TAXES
Income taxes are calculated based on estimates prepared by WRI and Ernst& Young,
WRI’s tax advisors. Taxes are based on the anticipated combined Federal, Saskatchewan
and Alberta tax rate. This is estimated at 33.3% of taxable income at current rates. Capital
cost allowances incorporating both accelerated and standard rates and Canadian
exploration expense deductions have been calculated by WRI based on the projected
capital spending schedule and asset pool classification of plant and equipment. Capital
cost allowances are used to the extent possible to reduce taxable income. Income taxes
become payable in Year 7 of operations under the Base Case assumptions.
DISCOUNT RATE
A discount rate of 10% has been used for the Base Case evaluation. Cash flows have
been discounted at the half-year rather than end of year to account for the timing in
payment of capital and operating costs and receipt of revenues. CASH FLOW
Table 18-20 details the summary annualized cash flow forecast for the Project.

All In ('000's) Year 0 Year 1 Year 2 Year 3 Year 4 Year 5 Year 6 Year 7 Year 8 Year 9 Year 10 Years11-26
Sales Volumes - 12 145 200 300 375 550 725 725 725 725 11,097
Net Revenue 2,396$ 28,160$ 40,079$ 60,681$ 78,420$ 115,911$ 152,090$ 152,090$ 152,090$ 152,090$ 2,329,132$
Contractor Mob/Demob Costs 853$ Kaolin Mine Operating Cost 1,582$ 3,081$ 3,409$ 4,002$ 4,412$ 5,664$ 6,812$ 6,862$ 6,843$ 7,481$ 118,295$ O/B Contract Cost 1,785$ 1,804$ 2,146$ 2,830$ 3,377$ 3,639$ 3,999$ 4,878$ 8,297$ 11,488$ 100,928$ Tailings Handling Cost 166$ 560$ 761$ 1,133$ 1,402$ 2,070$ 2,684$ 2,758$ 2,805$ 2,831$ 48,187$ Operating Costs
Total Mining 1,073$ 5,446$ 6,317$ 7,964$ 9,191$ 11,373$ 13,495$ 14,499$ 17,946$ 21,800$ 267,409$ Plant Operating -$ 492$ 6,046$ 7,109$ 7,225$ 8,395$ 11,996$ 15,414$ 15,419$ 15,417$ 15,411$ 236,792$ Distribution -$ 858$ 10,365$ 14,296$ 21,444$ 26,805$ 39,314$ 51,823$ 51,823$ 51,823$ 51,823$ 793,422$ Crown Royalty -$ 2$ 22$ 30$ 45$ 56$ 83$ 109$ 109$ 109$ 109$ 1,665$ Selling, General and Administration -$ 1,918$ 2,298$ 2,393$ 2,450$ 2,656$ 2,897$ 4,456$ 4,456$ 4,456$ 4,456$ 71,125$ Project Reclamation Cost 12,039$
Total Operating Costs 4,343$ 24,177$ 30,145$ 39,129$ 47,104$ 65,662$ 85,297$ 86,305$ 89,750$ 93,598$ 1,382,452$ Operating Cash Flow (1,947)$ 3,984$ 9,934$ 21,552$ 31,316$ 50,249$ 66,793$ 65,785$ 62,340$ 58,492$ 946,681$
Capital Plant (Expansion and Sustaining) 10,000$ 39,714$ 9,000$ 15,000$ 4,645$ 35,000$ 35,700$ 4,000$ 1,000$ 1,350$ 1,350$ 17,100$ Plant and Mine Start Up Costs 5,775$ Change in Working Capital 1,207$ 2,386$ 964$ 1,465$ 1,275$ 3,007$ 2,967$ 166$ 566$ 633$ (14,636)$ Total Capital 10,000$ 46,696$ 11,386$ 15,964$ 6,110$ 36,275$ 38,707$ 6,967$ 1,166$ 1,916$ 1,983$ 2,464$
Cash Flow (Pre Tax) (10,000)$ (48,643)$ (7,402)$ (6,030)$ 15,442$ (4,959)$ 11,542$ 59,826$ 64,619$ 60,424$ 56,510$ 944,216$
Income Tax -$ -$ -$ -$ -$ -$ -$ 11,095$ 20,943$ 19,939$ 18,751$ 308,160$ Net Cash Flow After Tax (10,000)$ (48,643)$ (7,402)$ (6,030)$ 15,442$ (4,959)$ 11,542$ 48,731$ 43,676$ 40,485$ 37,759$ 636,056$
Before Tax After TaxIRR @ 10% 28% 24%NPV @ 10% 227,710,381$ 141,154,478$
SCO
TT
WIL
SON
RPA
www.scottwilson.com
www.scottwilsonm
ining.com
18-75
TABLE 18-20 ANNUALIZED CASH FLOW FORECAST

SCOTT WILSON RPA www.scottwilson.com www.scottwilsonmining.com
18-76
RESULTS OF EVALUATION The results of the DCF evaluation are summarized in Table 18-21.
TABLE 18-21 RESULTS OF DCF EVALUATION - BASE CASE
Whitemud Resources Inc. – Gollier Creek Kaolin Project
Cash Flow Basis (incl. working
capital)
NPV @ 10%
($ M)
Internal Rate of Return (IRR)
%
Payback Period
(Years) Pre-Tax 227.71 28 7 After-Tax 141.15 24 8
VARIANCE ANALYSIS
The sensitivity of the Project cash flows to variations in capital costs, total operating
costs, distribution costs and product revenues was tested by varying those parameters
over a range from -25% to +25% of the estimated values. The effects on pre-tax and
after-tax NPV and Internal Rate of Return are illustrated in Figures 18-14 through 18-17.
The sensitivity analyses demonstrate that the Net Present Value and return on
investment of the Project are most sensitive to changes in revenue and least sensitive to
changes in capital costs. Variations in total direct operating costs and product distribution
costs have intermediate impacts on Net Present Value and return on investment.
The impact of changes in the discount rate used in the financial analysis is illustrated
in Figure 18-18.

Sensitivity of Pre-tax NPV
$0.00
$50.00
$100.00
$150.00
$200.00
$250.00
$300.00
$350.00
$400.00
$450.00
$500.00
-25% -20% -15% -10% -5% 0% 5% 10% 15% 20% 25%
Percent Change from Base Case
Pre
-Tax
NP
V$M
M
Revenue
Capital Cost
Total Operating Cost
Distribution Cost
10% Discount Rate
January 2008 Source: Whitemud Resources Inc., 2006.
Whitemud Kaolin Project
Sensitivity of Pre-tax NPV10% Discount Rate
Whitemud Resources Inc.
Saskatchewan, Canada
Figure 18-14
18-7
7
SC
OT
TW
ILS
ON
RP
Aw
ww
.scottw
ilson
.com
ww
w.sco
ttwilso
nm
inin
g.co
m

Sensitivity of After-tax NPV
-$50.00
$0.00
$50.00
$100.00
$150.00
$200.00
$250.00
$300.00
$350.00
-25% -20% -15% -10% -5% 0% 5% 10% 15% 20% 25%
Percent Change from Base Case
Aft
er-
tax
NP
V$M
M
Revenue
Capital Cost
Total Operating Cost
Distribution Cost
10% Discount rate
January 2008 Source: Whitemud Resources Inc., 2006.
Whitemud Kaolin Project
Sensitivity of After-tax NPV10% Discount Rate
Whitemud Resources Inc.
Saskatchewan, Canada
Figure 18-15
18-7
8
SC
OT
TW
ILS
ON
RP
Aw
ww
.scottw
ilson
.com
ww
w.sco
ttwilso
nm
inin
g.co
m

Sensitivity of Pre-tax IRR
0%
5%
10%
15%
20%
25%
30%
35%
40%
45%
-25% -20% -15% -10% -5% 0% 5% 10% 15% 20% 25%
Percent Change from Base Case
Pre
-tax
Inte
rnalR
ate
of
Retu
rn(I
RR
)
Revenue
Capital Cost
Total Operating Cost
Distribution Cost
January 2008 Source: Whitemud Resources Inc., 2006.
Whitemud Kaolin Project
Sensitivity of Pre-tax IRR
Whitemud Resources Inc.
Saskatchewan, Canada
Figure 18-16
18-7
9
SC
OT
TW
ILS
ON
RP
Aw
ww
.scottw
ilson
.com
ww
w.sco
ttwilso
nm
inin
g.co
m

Sensitivity of After-tax IRR
0%
5%
10%
15%
20%
25%
30%
35%
40%
-25% -20% -15% -10% -5% 0% 5% 10% 15% 20% 25%
Percent Change from Base Case
Aft
er-
tax
Inte
rnalR
ate
of
Retu
rn(I
RR
)
Revenue
Capital Cost
Total Operating Cost
Distribution Cost
January 2008 Source: Whitemud Resources Inc., 2006.
Whitemud Kaolin Project
Sensitivity of After-tax IRR
Whitemud Resources Inc.
Saskatchewan, Canada
Figure 18-17
18-8
0
SC
OT
TW
ILS
ON
RP
Aw
ww
.scottw
ilson
.com
ww
w.sco
ttwilso
nm
inin
g.co
m

Project Sensitivity to Discount Rate
$0.00
$50.00
$100.00
$150.00
$200.00
$250.00
$300.00
$350.00
$400.00
20.0% 17.5% 15.0% 12.5% 10.0% 7.5%
Discount Rate
Net
Pre
sen
tV
alu
e($
MM
)
Pre-Tax NPV
After-tax NPV
Base Case
January 2008 Source: Whitemud Resources Inc., 2006.
Whitemud Kaolin Project
Project Sensitivity toDiscount Rate
Whitemud Resources Inc.
Saskatchewan, Canada
Figure 18-18
18-8
1
SC
OT
TW
ILS
ON
RP
Aw
ww
.scottw
ilson
.com
ww
w.sco
ttwilso
nm
inin
g.co
m

SCOTT WILSON RPA www.scottwilson.com www.scottwilsonmining.com
19-1
19 INTERPRETATION AND CONCLUSIONS WRI holds a 100% interest in quarry leases totalling 9,405.26 ha in southern
Saskatchewan, plus an additional 2,027.94 ha held in the form of a Quarry Prospecting
Permit. WRI’s mineral properties are in six major blocks, viz., Gollier Creek, Wood
Mountain, Waverly, Project 12, Eastend, and QPP 144. The Gollier Creek deposit,
centered on 17-05-02 W3M and 18-05-02 W3M is the area of prime interest at present.
The Gollier Creek deposit held by WRI consists of kaolinized sediments containing
quartz sand, feldspars, and mica cemented by kaolinite, and trace amounts of illite and
smectite clays. The deposit is hosted in the Whitemud Formation and outcrops along the
edge of the Gollier Creek valley. The deposit is overlain by the Ravenscrag Formation
and glacial till. The top of the Whitemud Formation is demarcated by the presence of a
lignite band immediately above, which represents the lowermost interval of the
Ravenscrag Formation.
The available evidence suggests the source rock of kaolinized sediments of the
Whitemud Formation originated some distance from the site of deposition, but was
transported in largely unaltered condition. Kaolinization of the sediments is interpreted
as taking place largely in-situ.
The kaolinized sediments of the Whitemud Formation range in colour from white to
off-white/grey to yellowish-greenish, and finally to greenish grey. The Eastend
Formation, which also consists of partly kaolinized sediments, is transitional to the
lowermost portions of the Whitemud Formation and is marked by the transition to a
greenish grey colour. The colour distinctions in the Whitemud Formation allow for clear
demarcation of the highly kaolinized portion of the deposit. The average thickness of the
highly kaolinized sections of the Whitemud Formation is approximately seven metres.
Analysis of samples from the highly kaolinized section of the Whitemud Formation
indicates the sediments are composed of kaolinite, quartz, feldspars, micas, chlorite,

SCOTT WILSON RPA www.scottwilson.com www.scottwilsonmining.com
19-2
oxides, amphiboles, and trace amounts of smectite and illite clays. Kaolinite accounts for
approximately 20% to as high as 60% of the mineral mass, with a typical average of
approximately 40%. Particle size analysis of the kaolinized sediments indicates an
average of approximately 40% minus 44 microns (-325 mesh). The indicated in-situ bulk
specific gravity of the kaolinized sediments is 2.01 tonnes per cubic metre.
Extensive exploration and drilling work in the 1980s has provided an excellent drill
hole database for the Gollier Creek property. The available drill data have been
supplemented by drilling and core sampling in 2006 and 2007 by WRI to provide
additional geological, mineralogical, and particle size data. Geologic modelling of the
Gollier Creek deposit yields estimated total Measured and Indicated Resources of
163.1 million tonnes grading 41.05% -44 micron material, based on a constraint of a 3:1
waste:ore strip ratio and a constraint of a 50 metre setback from top of the Gollier Creek
valley. Five mineralized areas within the Gollier Creek area are identified. These are:
West Pit 52.9 MM t grading 40.8% Measured
W. Extension of West Pit 29.1 MM t grading 45.1% Measured
N Extension of West Pit 27.8 MM t grading 37.8% Indicated
Elm Springs Deposit 23.5 MM t grading 43.0% Measured
North Pit 13.2 MM t grading 36.8% Measured
East Bridge Pit 8.6 MM t grading 40.3% Measured
East Pit 8.0 MM t grading 41.4% Measured
A pre-feasibility level economic and financial analysis of developing the West Pit
allows classification of the resources in this area as Proven Reserves. The estimated
Proven Reserves are sufficient for 25.4 years of production, assuming the production
schedule detailed in Item 18 of this report. A mine plan has been developed to match the
proposed production rate.
Geological and particle size data are insufficient to permit development of resource
estimates for most of the balance of WRI’s property holdings. However, data is sufficient

SCOTT WILSON RPA www.scottwilson.com www.scottwilsonmining.com
19-3
for portions of the Wood Mountain and Project 12 areas to permit development of
resource estimates. Estimated Inferred Resources for selected portions of the Wood
Mountain and Project 12 areas are:
Wood Mountain 8.83 million tonnes grading 30% -44 micron material
Project 12 62.46 million tonnes grading 30% -44 micron material
WRI is proposing to mine and process the kaolinized sediments of the Gollier Creek
deposit to produce metakaolin, a high performance pozzolanic material, and raw kaolin.
Test work on production of metakaolin indicates the material will perform equivalently to
competitive metakaolin products currently on the market. Major target markets for the
metakaolin include oilfield cements, ready-mix concretes, and blended cements.
WRI has constructed a mine and plant with an initial production capacity of 200,000
tpa metakaolin and kaolin, with provision for expansion of the plant to 350,000 tpa
metakaolin and 25,000 tpa kaolin within three years. Twinning of this production facility
would increase capacity to 700,000 tpa metakaolin and 25,000 tpa kaolin by Year 7 of
operations. The current estimated completion cost of the plant is $46.0 million, a
reduction of 15.7% from the original estimate. Expansion of the plant is estimated to
require an additional $18.645 million for a total investment of $73.209 million. A second
plant is estimated to cost approximately the same amount.
WRI has conducted independent research of the proposed markets and has identified
a market potential in excess of 700,000 tpa. WRI has secured initial letters of intent and
provisional purchase orders for approximately 160,000 tpa of metakaolin. Kaolin would
be sold on an opportunistic basis to make up for any shortfalls in metakaolin sales. It is
anticipated the maximum level of raw kaolin sales would be 25,000 tpa.
WRI has received environmental approval for the proposed mine and processing plant
and is currently commissioning the process plant. Commercial production from the plant
is anticipated to begin in late February or early March, 2008.

SCOTT WILSON RPA www.scottwilson.com www.scottwilsonmining.com
19-4
An analysis of operating costs for both the mine and process plant indicates total
mining, processing and general and administrative costs, exclusive of product distribution
costs, will approximate $53.93 per tonne product over the life of the mine. The average
life-of-mine pre-tax margin is estimated to be $84.03 per tonne product in constant 2006
dollars.
Discounted cash flow analysis of the Project, based on reasonable assumptions
regarding sales revenue, product distribution costs and the estimated capital and operating
costs, yields a Base Case NPV of $227.71 million and an IRR of 28% on a pre-tax basis.
On an after-tax basis, the indicated NPV is $141.15 million and the IRR is 24%.
A sensitivity analysis for varying revenues, capital costs, total operating costs and
distribution costs from -25% to +25% of the Base Case indicates the Project is most
sensitive to changes in revenue and least sensitive to changes in capital costs.

SCOTT WILSON RPA www.scottwilson.com www.scottwilsonmining.com
20-1
20 RECOMMENDATIONS AND BUDGET The following recommendations are based on the results of the 2007 drill program
and progress in advancing construction and operation of the process plant:
1. Undertake an analysis of capital and operating costs for transport alternatives for ore from the east side of Gollier Creek to the processing plant. Alternatives to include truck haul and conveyor transport.
2. Complete a feasibility study of developing the resource on the east side of
Gollier Creek to extend the life of the Project.
3. Drill additional holes in the N Extension West Pit area to increase the confidence in the resource estimate from Indicated to Measured.
4. Complete a feasibility study for development of an expanded West Pit to
allow for increased metakaolin production. 5. Conduct additional test work on the properties of cement and concrete mixes
incorporating various addition rates of metakaolin, fly ash, and silica fume. The focus should be placed on determining the strength and other properties of ternary blends of cement, fly ash, and metakaolin.
6. Continue test work to develop additional data respecting the performance of
WRI’s metakaolin product in target cement and concrete applications. 7. Initiate project development to mine and process quantities of test product for
delivery to customers as part of a market development program. 8. Complete a feasibility study for the full project development based on initial
results of test production.
WRI has completed many of the recommendations detailed in the 2006 report. It is
anticipated that the remaining recommendations detailed in the 2006 report will be
completed in 2008.
BUDGET The indicated budget to implement the recommendations detailed above is provided
in Table 20-1.

SCOTT WILSON RPA www.scottwilson.com www.scottwilsonmining.com
20-2
TABLE 20-1 RECOMMENDED BUDGET Whitemud Resources Inc. – Gollier Creek Kaolin Project
Recommendation Estimated Cost ($) Contingencies 1. Undertake an analysis of capital and operating costs for transport alternatives for ore from the east side of Gollier Creek to the processing plant. Alternatives to include truck haul and conveyor transport
$30,000 - $80,000 None
2. Complete a feasibility study of developing the resource on the east side of Gollier Creek to extend the life of the Project.
$50,000 - $150,000 Dependent upon positive results for Recommendation 2
3. Drill additional holes in the N. Extension West Pit area to increase the confidence in the resource estimate from Indicated to Measured.
$10,000 - $15,000 None
4. Conduct additional test work on the properties of cement and concrete mixes incorporating various addition rates of metakaolin, fly ash, and silica fume. The focus should be placed on determining the strength and other properties of ternary blends of cement, fly ash and metakaolin.
$20,000 - $60,000 per year, ongoing
None. Considered as part of normal product development and testing during Phase 1 of project development (Recommendation 6)
5. Continue test work to develop additional data respecting the performance of WRI’s metakaolin product in target cement and concrete applications.
$20,000 - $60,000 per year, ongoing
None. Considered as part of normal product development and testing during Phase 1 of project development (Recommendation 6)
6. Initiate project development to mine and process quantities of test product for delivery to customers as part of a market development program
$54.56 million None. Phase 1 of project development
7. Complete a Feasibility Study for the full project development based on initial results of test production
$200,000 - $500,000 Dependent upon positive results for Recommendation 6 – successful operation of Demonstration Plant (Phase 1)

SCOTT WILSON RPA www.scottwilson.com www.scottwilsonmining.com
21-1
21 REFERENCES Bai, J., et al., 2000: Strength development in concrete incorporating PFA and metakaolin;
Magazine of concrete research, Vol. 52, No. 3, pp. 153-162; University of Glamorgan.
Bickley, J.A., 2006: Canadian metakaolin market study for Whitemud Resources Inc.;
confidential report. Bouzoubaâ, N., and Fournier, B., 2003: Current situation of SCMs in Canada; Materials
Technology Laboratory Report MTL 2003-4(TR), Canada Centre for Minerals Technology, Natural resources Canada, Ottawa, Ont.
Braman, D.R., Sweet, A.R., and Lerbekmo, J.F., 1999: Upper Cretaceous-lower Tertiary
lithostratigraphic relationships of three cores from Alberta, Saskatchewan and Manitoba, Canada; Can. Journal of Earth Science, Vol. 36, P. 669 – 683.
Byers, P.N., 1969: Mineralogy and the origin of the upper eastend and Whitemud
Formations of south-central and southwestern Saskatchewan and southeastern Alberta; Canadian Journal of earth Sciences, Vol. 6, pp. 317-334
Christodoulou, G., 2000: A Comparative Study of the Effects of Silica Fume, Metakaolin
and PFA on the Air Content of fresh Concrete; SCI Lecture Papers series, Society of Chemical Industry, 17 pp., sourced at http://www.soci.org
Clifton Associates Ltd., 2006: Project Proposal, Old Post Quarry & Processing Plant Near
Wood Mountain, SK; File R3762, 19 April 2006; prepared for Whitemud Resources Inc.
Consultec Ltd., 2006: Whitemud Resources Inc. Metakaolin Plant, Wood Mountain, SK.
2006 NI 43-101 Technical Report; prepared for Whitemud resources Inc. CSI Technologies Inc., 2006: U.S. oilwell cement market assessment; confidential report
prepared for Whitemud Resources Inc. CTL Group, 2006: Technical and marketing evaluation of Whitemud metakaolin for the
U.S. concrete industry; confidential report prepared for Whitemud Resources Inc. Ekaton Resources Limited, 1989: Characterization of portion of Whitemud kaolinized
sediments at Eastend and Gollier Creek (Wood Mountain), SK; November, 1989. Fraser, F.J., McLearn, F.H., Russell, L.S., Warren, P.S. and Wickenden, R.T.D., 1935:
Geology of southern Saskatchewan; Canada department of Mines, Geological Survey Memoir 176, 176 p., map 276A and sections

SCOTT WILSON RPA www.scottwilson.com www.scottwilsonmining.com
21-2
Fulton, R.G., 2006: Current olilfiled cementing practices and the use of pozzolanic materials as a substitute for Portland cement in oilfield cements in western Canada; confidential report prepared for Whitemud Resources Inc.
GPW & Associates, Undated: Preliminary Feasibility Study, Wood Mountain Kaolin
Plant; confidential report prepared for Ekaton Energy Limited. Granizo, M.L., Blanco-Varela, M.T., and Palomo, A., 2000: Influence of the starting
kaolin on alkali-activated materials based on metakaolin. Study of the reaction parameters by isothermal conduction calorimetery; Journal of Materials science, Vol. 35, PP. 6309 - 6315
Hanle, L.J., Jayaraman, K.R., and Smith, J.S., 2005: CO2 emissions profile of the U.S.
cement industry; U.S. Environmental Protection Agency, Washington, D.C. Harper, G., 1999: Kaolin resources and Development Opportunities in Canada and
Report on Field Work in 1998; Minfocus International Inc., Report No. 98141, Toronto, Ont.
Hatch Energy, 2006: Wood Mountain Metakaolin Project, Prefeasibility Estimate, project
No. H/323802; prepared for Whitemud Resources Inc. Hudson, J., 1988: Kaolinized Sand Exploration in Southern Saskatchewan; report
prepared for Ekaton Industries Inc. Master, P.P. 1985: Kaolinized Sediments of the Whitemud Formation at Wood Mountain,
Saskatchewan. Report on work completed 1985 & 1985, Prospecting permits 1 to 9, Prospecting Permits 12 & 13; Ekaton Energy Limited, Calgary, AB.
Master, P.P., 1987: Evolution and geology of kaolinized sediments, Wood Mountain,
Saskatchewan, in Economic Minerals of Saskatchewan, Special Publication No. 8, p. 166 – 181; C.F. Riley and L.W. Vigrass eds.; Saskatchewan Geological Society, Regina, SK.
Master, P.P., 1988: Report on Phase I Exploration Drilling Program and Grade
Determination, Kaolin Project, Wood Mountain, SK and Eastend, SK; Ekaton Industries Inc., Calgary, AB, July, 1988
Murray. H.H. and Rhoden, N., 1999: Final Report for Minfocus International Inc. on
Kaolin Samples, March, 1999; prepared for Minfocus international Inc. NLK Consultants Inc., 2002: EcoSmart Concrete Project – metakaolin pre-feasibility
Study; NLK Report EA2860; Eco-Smart Concrete, Vancouver, B.C. Sample, J., 1987: Report concerning excavation of a test pit and stockpiling of bulk
samples of kaolinized sediments, Kaolin project, South Gollier Creek area, Wood Mountain, SK; Ekaton Industries Inc., December, 1987.

SCOTT WILSON RPA www.scottwilson.com www.scottwilsonmining.com
21-3
Sample, J., 1988: Report Concerning Kaolin exploration in southern Saskatchewan; prepared for Ekaton Industries Inc., July, 1988.
Sample, J., 1988: Report on work completed during August, 1988 on Ekaton Industries
Inc. Prospecting Permit No. 1, Wood Mountain kaolin project, September, 1988. Sample, J., 1986: report on work completed 1985 on Prospecting permit #16 at Wood
Mountain, SK by Ekaton Industries Inc., Nov., 1986. Sample, J., 1988: report of work completed during August, 1988 on Prospecting Permit
#19, Wood Mountain Kaolin Project; prepared for Ekaton Industries Inc., Sept., 1988. Sample, J., 1988: Report of work completed during August, 1988 on Prospecting Permit
No. 20, Wood Mountain Kaolin Project, prepared for Ekaton Industries Inc., Sept., 1988.
Sample, J., 1988: Report of work completed during August, 1988 on Prospecting Permit
No. 22, Wood Mountain Kaolin Project, prepared for Ekaton Industries Inc., Sept., 1988.
Sample, J., 1992: Report of Work Completed during 1992 on Prospecting Permit No.
110, Wood Mountain Kaolin Project; prepared for Kaolin Industries Ltd., Nov., 1992. Spot, M. de, and Wojtarowicz, M., 2003: Metakaolin Study - Pre-feasibility review of the
potential for developing metakaolin from oil sands operations for use in concrete; Eco-Smart Concrete Project, Eco-Smart Concrete, Vancouver, B.C.
U.S.G.S., Cement chapter in Minerals Yearbook, various years; U.S. Geological Survey,
Department of Interior, Washington, D.C. Whitaker, S.H., 1965: Geology of the Wood Mountain area (72G), unpublished Ph.D.
thesis, University of Illinois, Urbana, Ill. Wood, A., 1988: Report on Phase I pilot plant, Regina, Wood Mountain, SK; prepared
for Ekaton Industries Inc.

SCOTT WILSON RPA www.scottwilson.com www.scottwilsonmining.com
22-1
22 SIGNATURE PAGE This report titled “Technical Report on Gollier Creek Kaolin Project, Wood
Mountain, Saskatchewan”, prepared for Whitemud Resources Inc., dated January 30,
2008, was prepared and signed by the following author:
(Signed & Sealed) Dated at Toronto, Ontario January 30, 2008 Donald H. Hains, P.Geo. Associate Geologist

SCOTT WILSON RPA www.scottwilson.com www.scottwilsonmining.com
23-1
23 CERTIFICATE OF QUALIFICATIONS DONALD H. HAINS
I, Donald H. Hains, P.Geo., as an author of this report entitled “Technical Report on Gollier Creek Kaolin Project, Wood Mountain, Saskatchewan” prepared for Whitemud Resources Inc., dated January 30, 2008, do hereby certify that:
1. I am Associate Consultant, Industrial Minerals with Scott Wilson Roscoe Postle
Associates Inc. of Suite 501, 55 University Ave Toronto, ON, M5J 2H7. 2. I am a graduate of Queen’s University, Kingston, Ontario in 1974 with a Hon. B.A.
degree in chemistry. I am a graduate of Dalhousie University, Halifax, N.S. in 1976 with a Master of Business Administration specializing in finance and marketing
3. I am registered as a Professional Geoscientist in the Province of Ontario (Reg.#
0494). I have worked as a geoscientist for a total of thirty years since my graduation. My relevant experience for the purpose of the Technical Report is:
• Assessment of Arborg kaolin deposit, Arborg, Manitoba, 1994 • Review of kaolin deposits, James Bay basin area, Ontario, 1998 • Review of kaolin deposit, Sparta, Georgia, USA, 2001 • Review of kaolin deposit, New Mexico, USA, 2006 • Various cement raw materials studies, Canada and United States, 1995 –
2006 • Research scientist, Fiberglas Canada Ltd. and Domtar Construction
Materials, 1979 – 1981 and 1989 - 1990 4. I have read the definition of "qualified person" set out in National Instrument 43-101
(NI43-101) and certify that by reason of my education, affiliation with a professional association (as defined in NI43-101) and past relevant work experience, I fulfill the requirements to be a "qualified person" for the purposes of NI43-101.
5. I visited the Gollier Creek property on November 25/26, 2005, August 8, 2006 and
December 17, 2007. 6. I am responsible for overall preparation of the Technical Report. 7. I am independent of the Issuer applying the test set out in Section 1.4 of National
Instrument 43-101. 8. I have had no prior involvement with the property that is the subject of the Technical
Report. 9. I have read National Instrument 43-101, and the Technical Report has been prepared
in compliance with National Instrument 43-101 and Form 43-101F1.

SCOTT WILSON RPA www.scottwilson.com www.scottwilsonmining.com
23-2
10. To the best of my knowledge, information, and belief, the Technical Report contains all scientific and technical information that is required to be disclosed to make the technical report not misleading. Dated this 30th day of January, 2008 (Signed & Sealed) Donald H. Hains, P.Geo.
SCOTT WILSON RPA www.scottwilson.com www.scottwilsonmining.com
24-1
24 APPENDICES (VOLUME 2) APPENDIX 1 PARTICLE SIZE ANALYSIS APPENDIX 2 TEST WORK BY CTL GROUP APPENDIX 3 PRE-FEASIBILITY ESTIMATE, HATCH ENERGY FOR WHITEMUD RESOURCES INC., OCTOBER 2006 APPENDIX 4 METAKAOLIN PLANT, WOOD MOUNTAIN, SASKATCHEWAN, NI 43-101 TECHNICAL REPORT PREPARED BY CONSULTEC LTD., OCTOBER 20, 2006 APPENDIX 5 2007 DRILL DATA APPENDIX 6 DECEMBER 2007 SITE VISIT PHOTOS


![Introduction to Whitemud[1]](https://img.pdfslide.us/doc/110x75/577ce4a71a28abf1038eda7c/introduction-to-whitemud1.jpg)