Embed Size (px)
Citation preview
P E T R O L E U M E N G I N E E R I N G D E P A R T M E N T
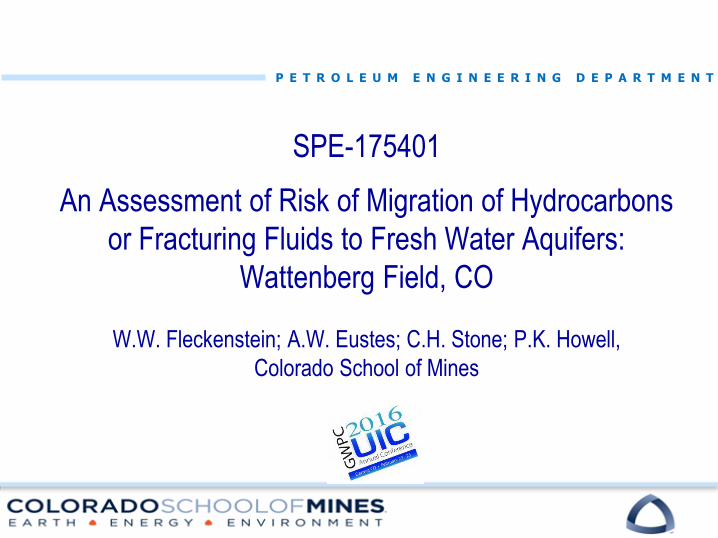
SPE-175401
An Assessment of Risk of Migration of Hydrocarbons
or Fracturing Fluids to Fresh Water Aquifers:
Wattenberg Field, CO
W.W. Fleckenstein; A.W. Eustes; C.H. Stone; P.K. Howell,
Colorado School of Mines
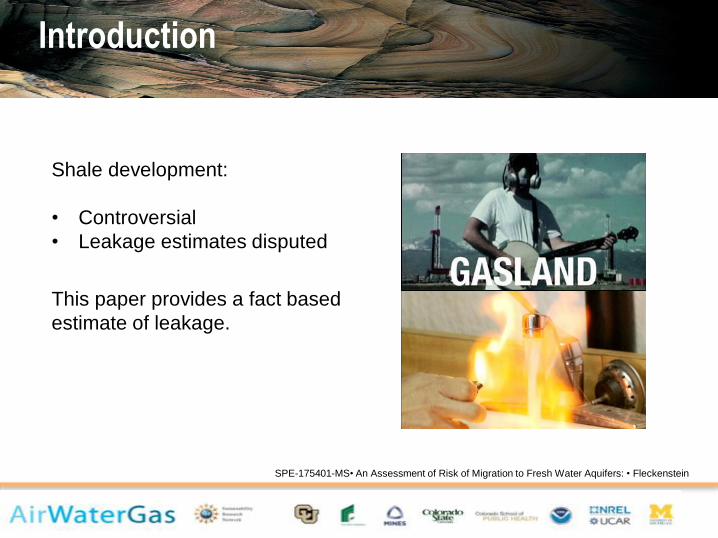
Shale development:
• Controversial
• Leakage estimates disputed
This paper provides a fact based
estimate of leakage.
Slide 2
SPE-175401-MS• An Assessment of Risk of Migration to Fresh Water Aquifers: • Fleckenstein
Introduction
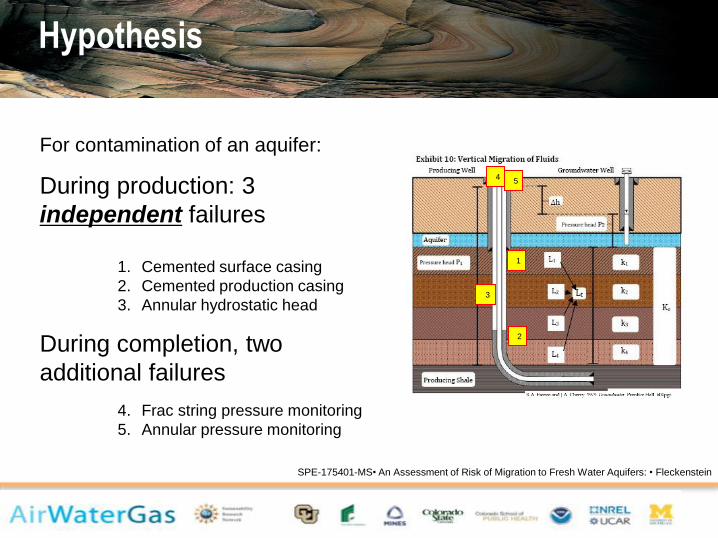
For contamination of an aquifer:
During production: 3
independent failures
1. Cemented surface casing
2. Cemented production casing
3. Annular hydrostatic head
During completion, two
additional failures
4. Frac string pressure monitoring
5. Annular pressure monitoring
Slide 3
SPE-175401-MS• An Assessment of Risk of Migration to Fresh Water Aquifers: • Fleckenstein
1
2
3
45
Hypothesis
Slide 4
SPE-175401-MS• An Assessment of Risk of Migration to Fresh Water Aquifers: • Fleckenstein
1
2
3
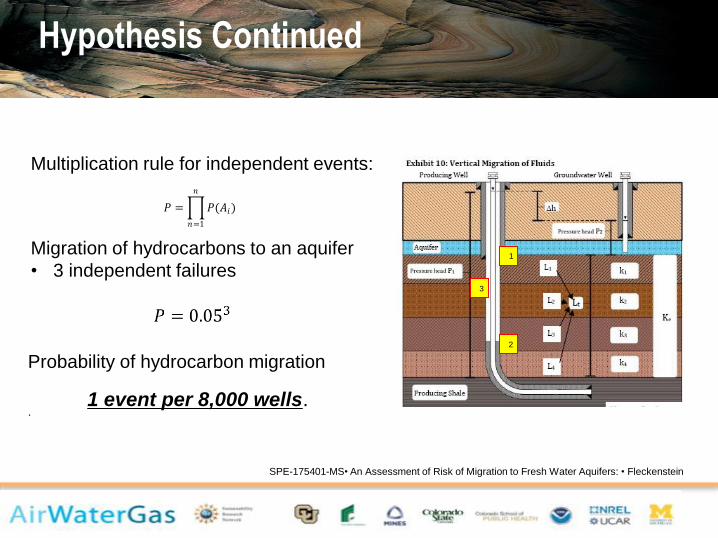
Multiplication rule for independent events:
𝑃 = 𝑃(𝐴𝑖
𝑛
𝑛=1
)
Migration of hydrocarbons to an aquifer
• 3 independent failures
Probability of hydrocarbon migration
1 event per 8,000 wells..
Hypothesis Continued
Slide 5
SPE-175401-MS• An Assessment of Risk of Migration to Fresh Water Aquifers: • Fleckenstein
1
2
3
4
5
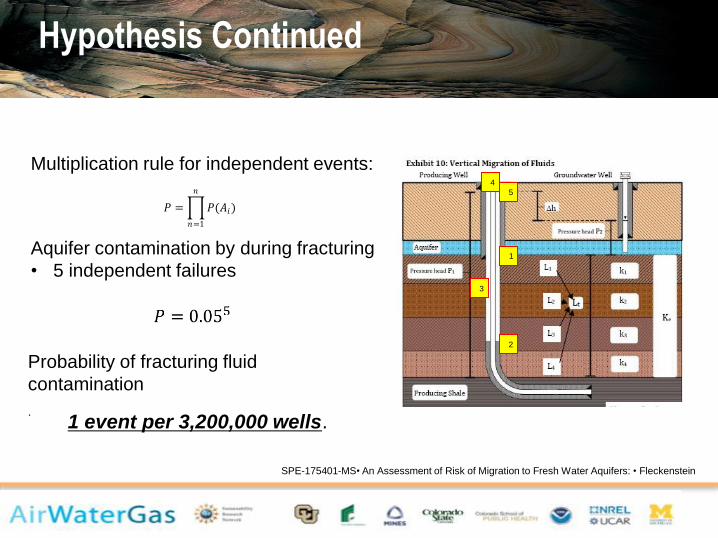
Multiplication rule for independent events:
𝑃 = 𝑃(𝐴𝑖
𝑛
𝑛=1
)
Aquifer contamination by during fracturing
• 5 independent failures
Probability of fracturing fluid
contamination
1 event per 3,200,000 wells..
Hypothesis Continued
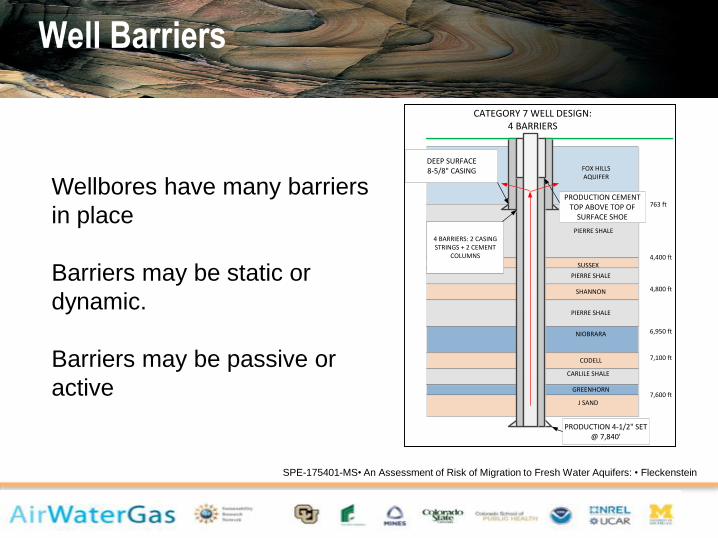
Wellbores have many barriers
in place
Barriers may be static or
dynamic.
Barriers may be passive or
active
Slide 6
SPE-175401-MS• An Assessment of Risk of Migration to Fresh Water Aquifers: • Fleckenstein
DEEP SURFACE 8-5/8" CASING
PRODUCTION 4-1/2" SET @ 7,840'
CATEGORY 7 WELL DESIGN: 4 BARRIERS
763 ft
4,400 ft
4,800 ft
6,950 ft
7,100 ft
7,600 ft
FOX HILLS AQUIFER
PIERRE SHALE
SUSSEX
SHANNON
NIOBRARA
CODELL
CARLILE SHALE
GREENHORN
J SAND
PIERRE SHALE
PIERRE SHALE
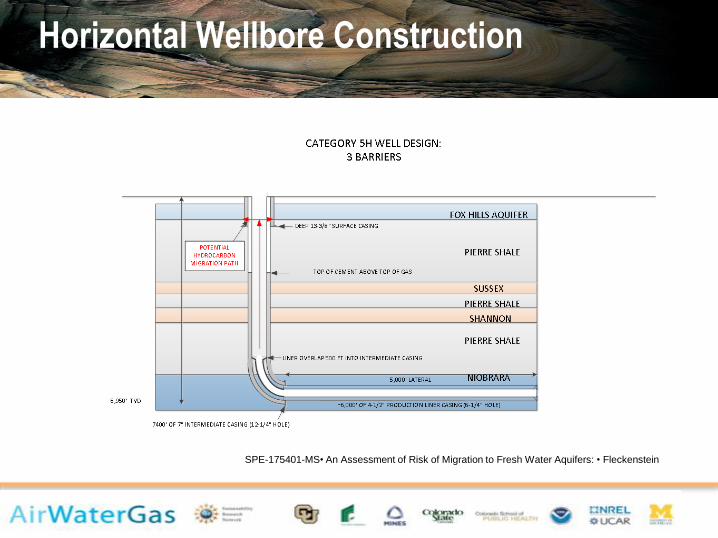
4 BARRIERS: 2 CASING STRINGS + 2 CEMENT
COLUMNS
PRODUCTION CEMENT TOP ABOVE TOP OF
SURFACE SHOE
Well Barriers
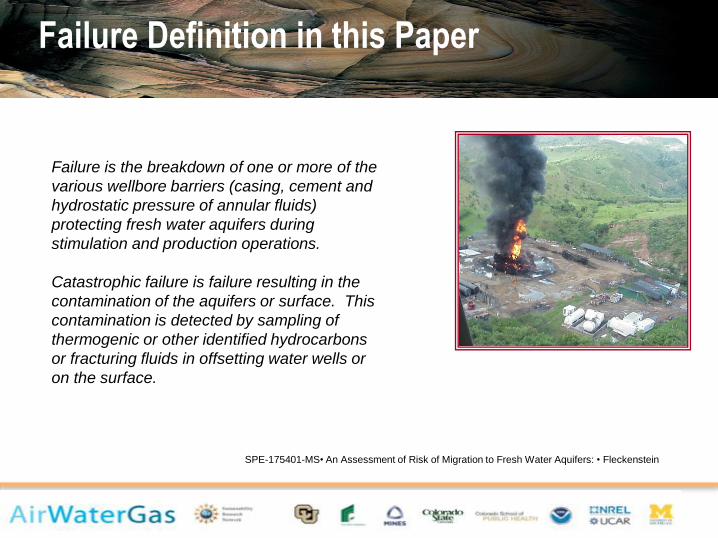
Failure is the breakdown of one or more of the
various wellbore barriers (casing, cement and
hydrostatic pressure of annular fluids)
protecting fresh water aquifers during
stimulation and production operations.
Catastrophic failure is failure resulting in the
contamination of the aquifers or surface. This
contamination is detected by sampling of
thermogenic or other identified hydrocarbons
or fracturing fluids in offsetting water wells or
on the surface.
Slide 7
SPE-175401-MS• An Assessment of Risk of Migration to Fresh Water Aquifers: • Fleckenstein
Failure Definition in this Paper
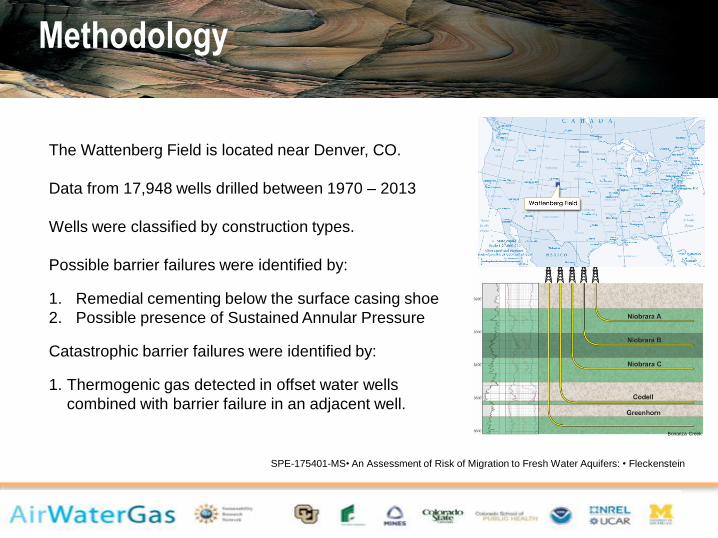
The Wattenberg Field is located near Denver, CO.
Data from 17,948 wells drilled between 1970 – 2013
Wells were classified by construction types.
Possible barrier failures were identified by:
1. Remedial cementing below the surface casing shoe
2. Possible presence of Sustained Annular Pressure
Catastrophic barrier failures were identified by:
1. Thermogenic gas detected in offset water wells
combined with barrier failure in an adjacent well.
Slide 8
SPE-175401-MS• An Assessment of Risk of Migration to Fresh Water Aquifers: • Fleckenstein
Bonanza Creek
Methodology
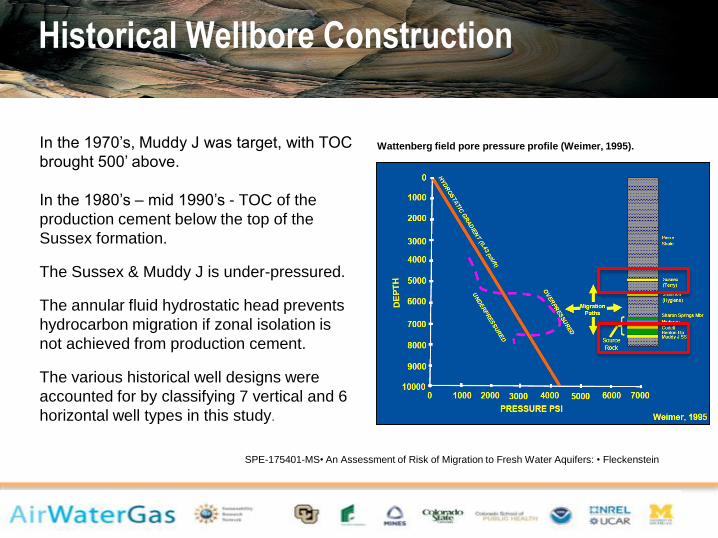
In the 1970’s, Muddy J was target, with TOC
brought 500’ above.
In the 1980’s – mid 1990’s - TOC of the
production cement below the top of the
Sussex formation.
The Sussex & Muddy J is under-pressured.
The annular fluid hydrostatic head prevents
hydrocarbon migration if zonal isolation is
not achieved from production cement.
The various historical well designs were
accounted for by classifying 7 vertical and 6
horizontal well types in this study.
Slide 9
SPE-175401-MS• An Assessment of Risk of Migration to Fresh Water Aquifers: • Fleckenstein
Wattenberg field pore pressure profile (Weimer, 1995).
Historical Wellbore Construction
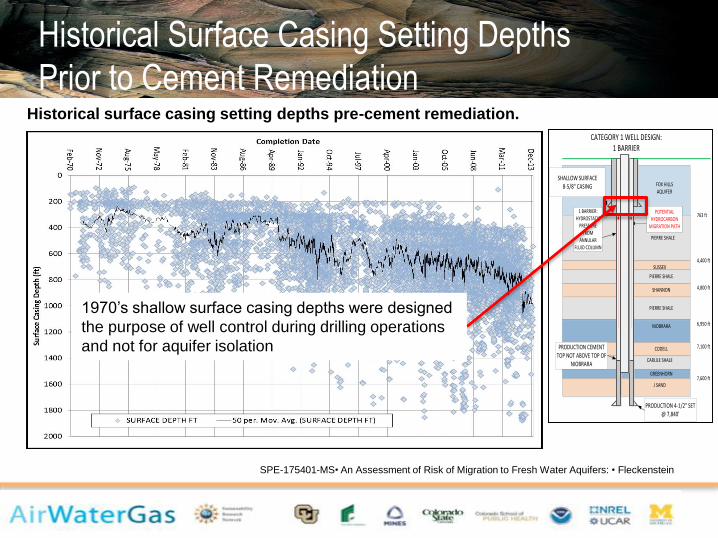
Historical surface casing setting depths pre-cement remediation.
SHALLOW SURFACE 8-5/8" CASING
PRODUCTION 4-1/2" SET @ 7,840'
CATEGORY 1 WELL DESIGN: 1 BARRIER
763 ft
4,400 ft
4,800 ft
6,950 ft
7,100 ft
7,600 ft
FOX HILLS AQUIFER
PIERRE SHALE
SUSSEX
SHANNON
NIOBRARA
CODELL
CARLILE SHALE
GREENHORN
J SAND
PIERRE SHALE
PIERRE SHALE
1 BARRIER: HYDROSTATIC
PRESSURE FROM
ANNULAR FLUID COLUMN
PRODUCTION CEMENT TOP NOT ABOVE TOP OF
NIOBRARA
POTENTIAL HYDROCARBON
MIGRATION PATH
Slide 10
SPE-175401-MS• An Assessment of Risk of Migration to Fresh Water Aquifers: • Fleckenstein
1970’s shallow surface casing depths were designed
the purpose of well control during drilling operations
and not for aquifer isolation
Historical Surface Casing Setting Depths
Prior to Cement Remediation
SHALLOW SURFACE 8-5/8" CASING
PRODUCTION 4-1/2" SET @ 7,840'
CATEGORY 1 WELL DESIGN: 1 BARRIER
763 ft
4,400 ft
4,800 ft
6,950 ft
7,100 ft
7,600 ft
FOX HILLS AQUIFER
PIERRE SHALE
SUSSEX
SHANNON
NIOBRARA
CODELL
CARLILE SHALE
GREENHORN
J SAND
PIERRE SHALE
PIERRE SHALE
1 BARRIER: HYDROSTATIC
PRESSURE FROM
ANNULAR FLUID COLUMN
PRODUCTION CEMENT TOP NOT ABOVE TOP OF
NIOBRARA
POTENTIAL HYDROCARBON
MIGRATION PATH
Historical Wellbore Construction
Slide 11
SPE-175401-MS• An Assessment of Risk of Migration to Fresh Water Aquifers: • Fleckenstein
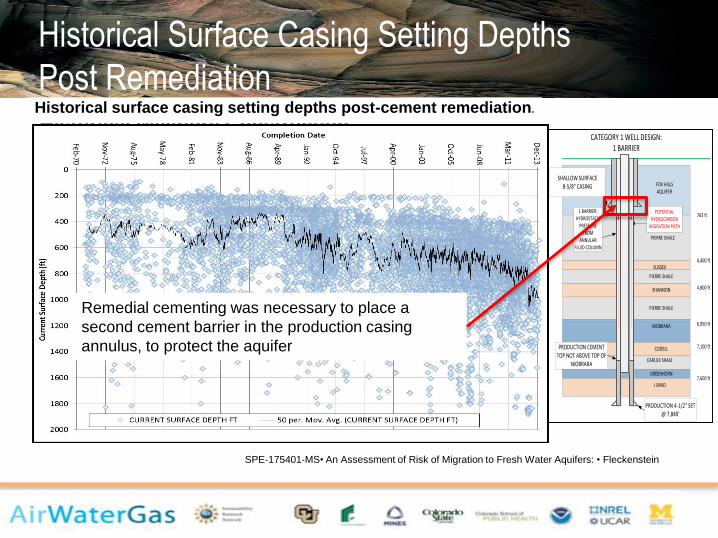
Historical surface casing setting depths post-cement remediation.
Remedial cementing was necessary to place a
second cement barrier in the production casing
annulus, to protect the aquifer
Historical Surface Casing Setting Depths
Post Remediation
SHALLOW SURFACE 8-5/8" CASING
PRODUCTION 4-1/2" SET @ 7,840'
CATEGORY 2 WELL DESIGN: 1 BARRIER
763 ft
4,400 ft
4,800 ft
6,950 ft
7,100 ft
7,600 ft
FOX HILLS AQUIFER
PIERRE SHALE
SUSSEX
SHANNON
NIOBRARA
CODELL
CARLILE SHALE
GREENHORN
J SAND
PIERRE SHALE
PIERRE SHALE
1 BARRIER: HYDROSTATIC
PRESSURE FROM
ANNULAR FLUID COLUMN
PRODUCTION CEMENT TOP NOT ABOVE TOP OF
SUSSEX
POTENTIAL HYDROCARBON
MIGRATION PATH
Slide 12
SPE-175401-MS• An Assessment of Risk of Migration to Fresh Water Aquifers: • Fleckenstein
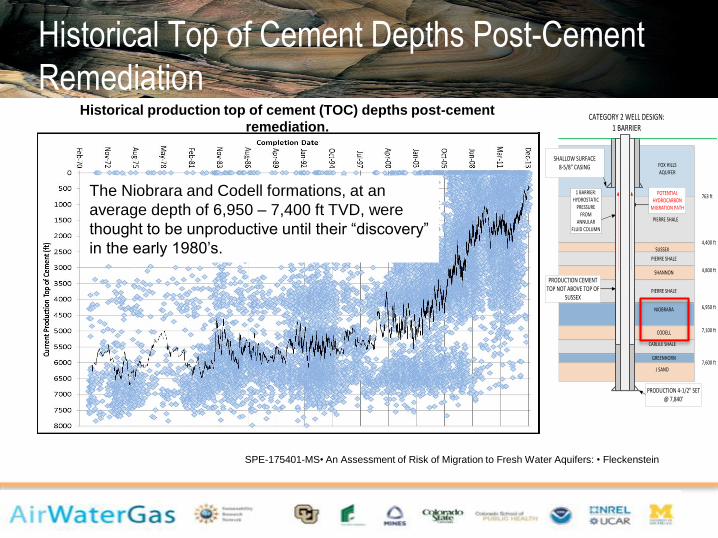
Historical production top of cement (TOC) depths post-cement
remediation.
The Niobrara and Codell formations, at an
average depth of 6,950 – 7,400 ft TVD, were
thought to be unproductive until their “discovery”
in the early 1980’s.
Historical Top of Cement Depths Post-Cement
Remediation
DEEP SURFACE 8-5/8" CASING
PRODUCTION 4-1/2" SET @ 7,840'
CATEGORY 6 WELL DESIGN: 3 BARRIERS
763 ft
4,400 ft
4,800 ft
6,950 ft
7,100 ft
7,600 ft
FOX HILLS AQUIFER
PIERRE SHALE
SUSSEX
SHANNON
NIOBRARA
CODELL
CARLILE SHALE
GREENHORN
J SAND
PIERRE SHALE
PIERRE SHALE
3 BARRIERS: PRODUCTION CASING +
SURFACE CASING + CEMENT COLUMN
PRODUCTION CEMENT TOP ABOVE TOP OF
SUSSEX
POTENTIAL HYDROCARBON
MIGRATION PATH
Historical Wellbore Construction
Slide 13
SPE-175401-MS• An Assessment of Risk of Migration to Fresh Water Aquifers: • Fleckenstein
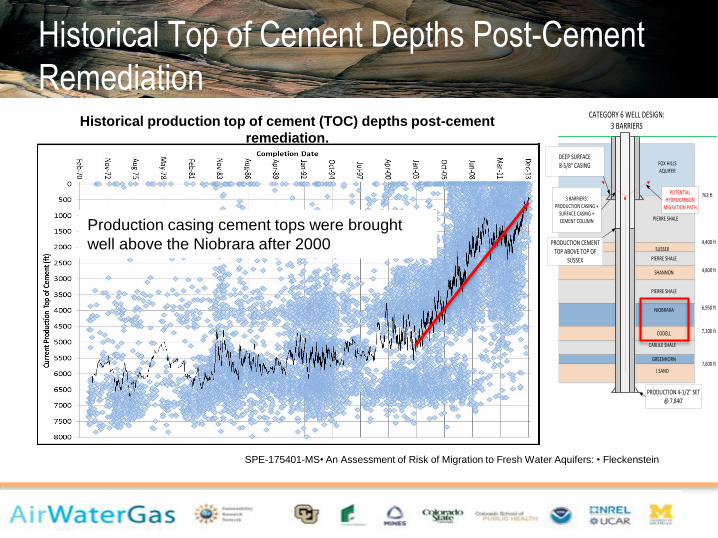
Historical production top of cement (TOC) depths post-cement
remediation.
Production casing cement tops were brought
well above the Niobrara after 2000
Historical Top of Cement Depths Post-Cement
Remediation
Slide 14
SPE-175401-MS• An Assessment of Risk of Migration to Fresh Water Aquifers: • Fleckenstein
Horizontal Wellbore Construction
Slide 15
SPE-175401-MS• An Assessment of Risk of Migration to Fresh Water Aquifers: • Fleckenstein
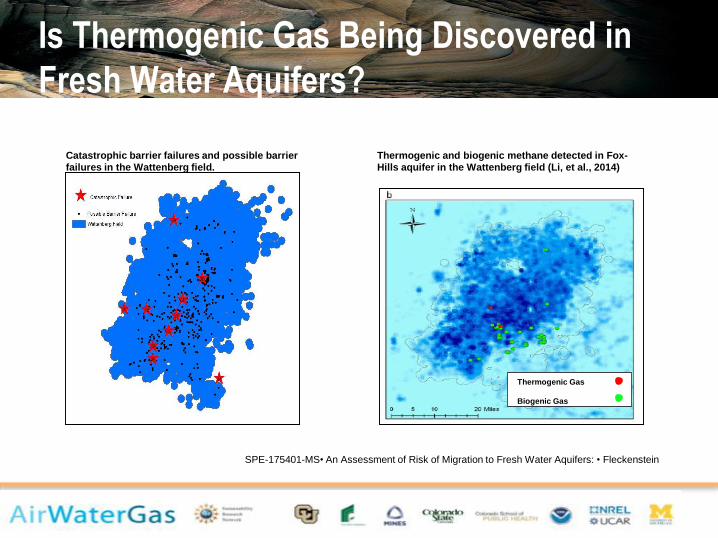
Thermogenic and biogenic methane detected in Fox-
Hills aquifer in the Wattenberg field (Li, et al., 2014)
Thermogenic Gas
Biogenic Gas
Catastrophic barrier failures and possible barrier
failures in the Wattenberg field.
Is Thermogenic Gas Being Discovered in
Fresh Water Aquifers?
Slide 16
SPE-175401-MS• An Assessment of Risk of Migration to Fresh Water Aquifers: • Fleckenstein
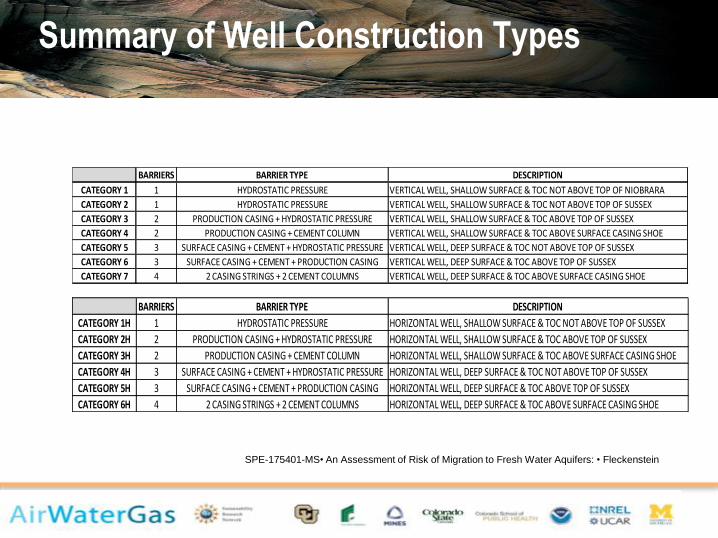
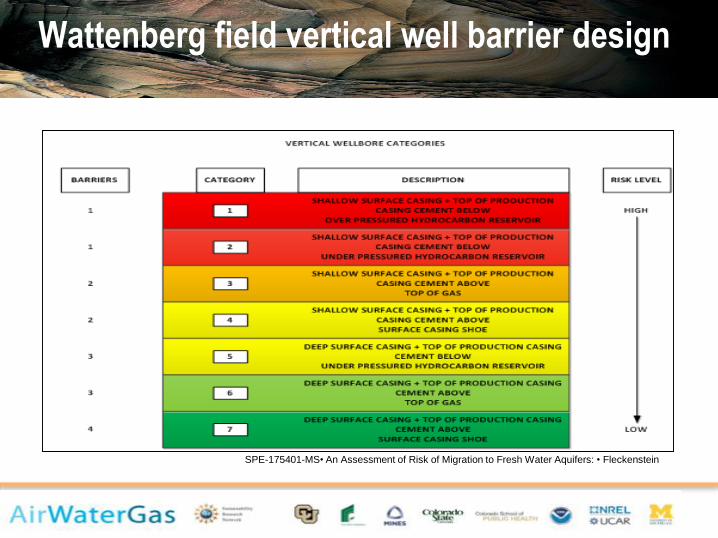
BARRIERS BARRIER TYPE DESCRIPTION
CATEGORY 1 1 HYDROSTATIC PRESSURE VERTICAL WELL, SHALLOW SURFACE & TOC NOT ABOVE TOP OF NIOBRARA
CATEGORY 2 1 HYDROSTATIC PRESSURE VERTICAL WELL, SHALLOW SURFACE & TOC NOT ABOVE TOP OF SUSSEX
CATEGORY 3 2 PRODUCTION CASING + HYDROSTATIC PRESSURE VERTICAL WELL, SHALLOW SURFACE & TOC ABOVE TOP OF SUSSEX
CATEGORY 4 2 PRODUCTION CASING + CEMENT COLUMN VERTICAL WELL, SHALLOW SURFACE & TOC ABOVE SURFACE CASING SHOE
CATEGORY 5 3 SURFACE CASING + CEMENT + HYDROSTATIC PRESSURE VERTICAL WELL, DEEP SURFACE & TOC NOT ABOVE TOP OF SUSSEX
CATEGORY 6 3 SURFACE CASING + CEMENT + PRODUCTION CASING VERTICAL WELL, DEEP SURFACE & TOC ABOVE TOP OF SUSSEX
CATEGORY 7 4 2 CASING STRINGS + 2 CEMENT COLUMNS VERTICAL WELL, DEEP SURFACE & TOC ABOVE SURFACE CASING SHOE
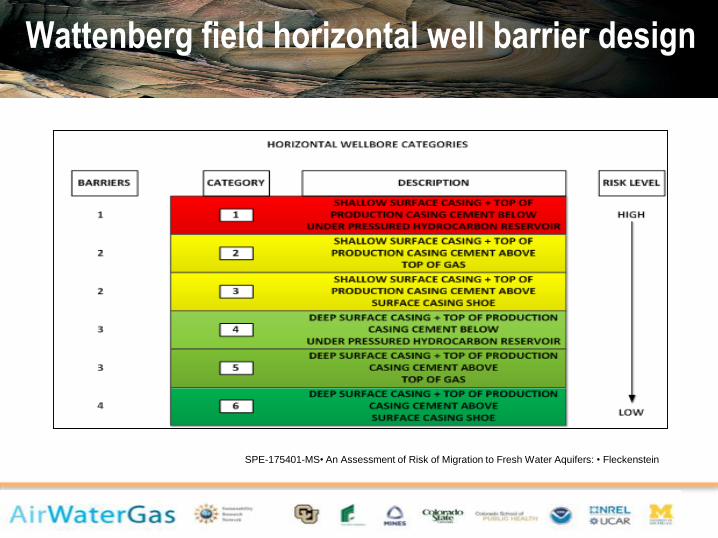
BARRIERS BARRIER TYPE DESCRIPTION
CATEGORY 1H 1 HYDROSTATIC PRESSURE HORIZONTAL WELL, SHALLOW SURFACE & TOC NOT ABOVE TOP OF SUSSEX
CATEGORY 2H 2 PRODUCTION CASING + HYDROSTATIC PRESSURE HORIZONTAL WELL, SHALLOW SURFACE & TOC ABOVE TOP OF SUSSEX
CATEGORY 3H 2 PRODUCTION CASING + CEMENT COLUMN HORIZONTAL WELL, SHALLOW SURFACE & TOC ABOVE SURFACE CASING SHOE
CATEGORY 4H 3 SURFACE CASING + CEMENT + HYDROSTATIC PRESSURE HORIZONTAL WELL, DEEP SURFACE & TOC NOT ABOVE TOP OF SUSSEX
CATEGORY 5H 3 SURFACE CASING + CEMENT + PRODUCTION CASING HORIZONTAL WELL, DEEP SURFACE & TOC ABOVE TOP OF SUSSEX
CATEGORY 6H 4 2 CASING STRINGS + 2 CEMENT COLUMNS HORIZONTAL WELL, DEEP SURFACE & TOC ABOVE SURFACE CASING SHOE
Summary of Well Construction Types
Slide 17
SPE-175401-MS• An Assessment of Risk of Migration to Fresh Water Aquifers: • Fleckenstein
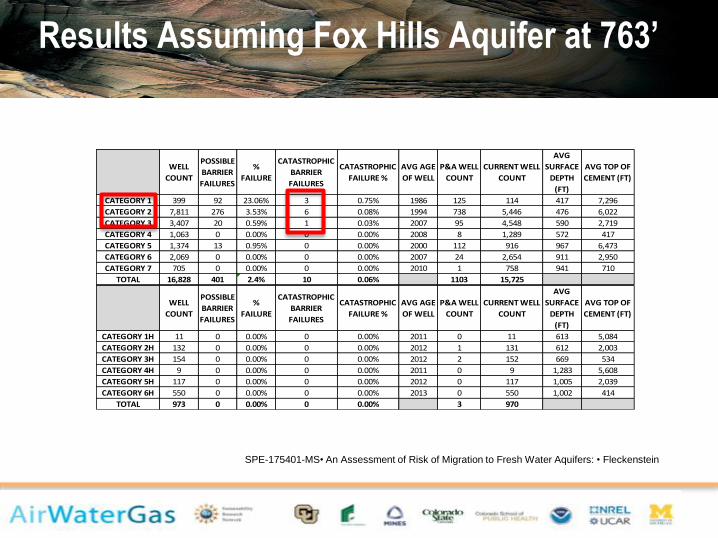
WELL
COUNT
POSSIBLE
BARRIER
FAILURES
%
FAILURE
CATASTROPHIC
BARRIER
FAILURES
CATASTROPHIC
FAILURE %
AVG AGE
OF WELL
P&A WELL
COUNT
CURRENT WELL
COUNT
AVG
SURFACE
DEPTH
(FT)
AVG TOP OF
CEMENT (FT)
CATEGORY 1 399 92 23.06% 3 0.75% 1986 125 114 417 7,296
CATEGORY 2 7,811 276 3.53% 6 0.08% 1994 738 5,446 476 6,022
CATEGORY 3 3,407 20 0.59% 1 0.03% 2007 95 4,548 590 2,719
CATEGORY 4 1,063 0 0.00% 0 0.00% 2008 8 1,289 572 417
CATEGORY 5 1,374 13 0.95% 0 0.00% 2000 112 916 967 6,473
CATEGORY 6 2,069 0 0.00% 0 0.00% 2007 24 2,654 911 2,950
CATEGORY 7 705 0 0.00% 0 0.00% 2010 1 758 941 710
TOTAL 16,828 401 2.4% 10 0.06% 1103 15,725
WELL
COUNT
POSSIBLE
BARRIER
FAILURES
%
FAILURE
CATASTROPHIC
BARRIER
FAILURES
CATASTROPHIC
FAILURE %
AVG AGE
OF WELL
P&A WELL
COUNT
CURRENT WELL
COUNT
AVG
SURFACE
DEPTH
(FT)
AVG TOP OF
CEMENT (FT)
CATEGORY 1H 11 0 0.00% 0 0.00% 2011 0 11 613 5,084
CATEGORY 2H 132 0 0.00% 0 0.00% 2012 1 131 612 2,003
CATEGORY 3H 154 0 0.00% 0 0.00% 2012 2 152 669 534
CATEGORY 4H 9 0 0.00% 0 0.00% 2011 0 9 1,283 5,608
CATEGORY 5H 117 0 0.00% 0 0.00% 2012 0 117 1,005 2,039
CATEGORY 6H 550 0 0.00% 0 0.00% 2013 0 550 1,002 414
TOTAL 973 0 0.00% 0 0.00% 3 970
Results Assuming Fox Hills Aquifer at 763’
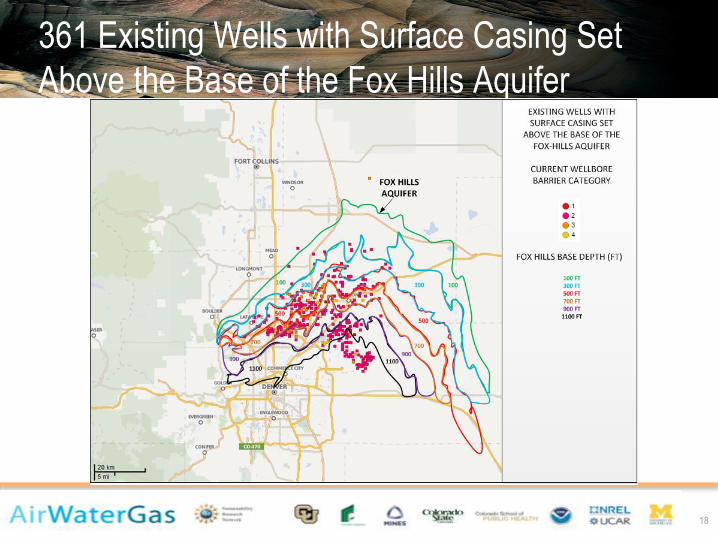
361 Existing Wells with Surface Casing Set
Above the Base of the Fox Hills Aquifer
18
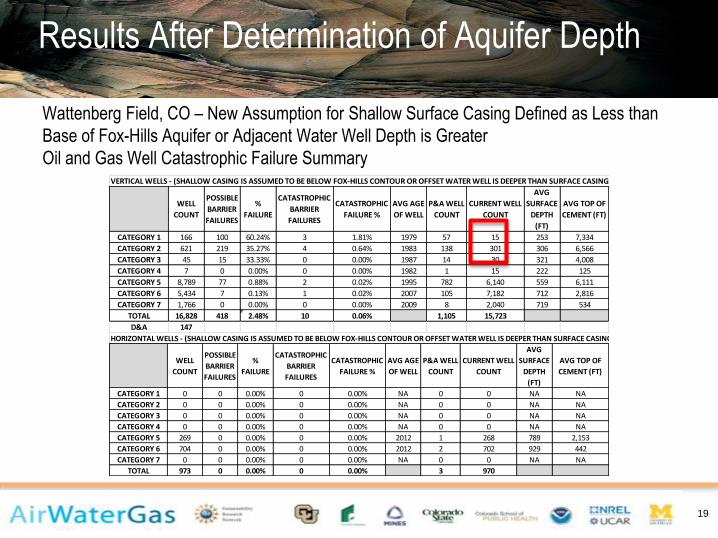
Results After Determination of Aquifer Depth
19
VERTICAL WELLS - (SHALLOW CASING IS ASSUMED TO BE BELOW FOX-HILLS CONTOUR OR OFFSET WATER WELL IS DEEPER THAN SURFACE CASING)
WELL
COUNT
POSSIBLE
BARRIER
FAILURES
%
FAILURE
CATASTROPHIC
BARRIER
FAILURES
CATASTROPHIC
FAILURE %
AVG AGE
OF WELL
P&A WELL
COUNT
CURRENT WELL
COUNT
AVG
SURFACE
DEPTH
(FT)
AVG TOP OF
CEMENT (FT)
CATEGORY 1 166 100 60.24% 3 1.81% 1979 57 15 253 7,334
CATEGORY 2 621 219 35.27% 4 0.64% 1983 138 301 306 6,566
CATEGORY 3 45 15 33.33% 0 0.00% 1987 14 30 321 4,008
CATEGORY 4 7 0 0.00% 0 0.00% 1982 1 15 222 125
CATEGORY 5 8,789 77 0.88% 2 0.02% 1995 782 6,140 559 6,111
CATEGORY 6 5,434 7 0.13% 1 0.02% 2007 105 7,182 712 2,816
CATEGORY 7 1,766 0 0.00% 0 0.00% 2009 8 2,040 719 534
TOTAL 16,828 418 2.48% 10 0.06% 1,105 15,723
D&A 147
HORIZONTAL WELLS - (SHALLOW CASING IS ASSUMED TO BE BELOW FOX-HILLS CONTOUR OR OFFSET WATER WELL IS DEEPER THAN SURFACE CASING)
WELL
COUNT
POSSIBLE
BARRIER
FAILURES
%
FAILURE
CATASTROPHIC
BARRIER
FAILURES
CATASTROPHIC
FAILURE %
AVG AGE
OF WELL
P&A WELL
COUNT
CURRENT WELL
COUNT
AVG
SURFACE
DEPTH
(FT)
AVG TOP OF
CEMENT (FT)
CATEGORY 1 0 0 0.00% 0 0.00% NA 0 0 NA NA
CATEGORY 2 0 0 0.00% 0 0.00% NA 0 0 NA NA
CATEGORY 3 0 0 0.00% 0 0.00% NA 0 0 NA NA
CATEGORY 4 0 0 0.00% 0 0.00% NA 0 0 NA NA
CATEGORY 5 269 0 0.00% 0 0.00% 2012 1 268 789 2,153
CATEGORY 6 704 0 0.00% 0 0.00% 2012 2 702 929 442
CATEGORY 7 0 0 0.00% 0 0.00% NA 0 0 NA NA
TOTAL 973 0 0.00% 0 0.00% 3 970
Wattenberg Field, CO – New Assumption for Shallow Surface Casing Defined as Less than
Base of Fox-Hills Aquifer or Adjacent Water Well Depth is Greater
Oil and Gas Well Catastrophic Failure Summary
Slide 20
SPE-175401-MS• An Assessment of Risk of Migration to Fresh Water Aquifers: • Fleckenstein
Wattenberg field vertical well barrier design
Slide 21
SPE-175401-MS• An Assessment of Risk of Migration to Fresh Water Aquifers: • Fleckenstein
Wattenberg field horizontal well barrier design
1. No evidence of aquifer contamination by stimulation operations through
wellbores was discovered in the Wattenberg Field.
2. A total of 10 wells of the 17,948 wells in the study area exhibited signs of
hydrocarbon migration to fresh water aquifers.
3. Migration of hydrocarbons into aquifers was found to primarily be associated
with older wells, with surface casing which was not extended through
aquifers.
4. The probability of hydrocarbon migration correlated to the age of the well.
Older wells had less robust construction standards; and, the barriers
preventing migration were not as redundant.
Slide 22
SPE-175401-MS• An Assessment of Risk of Migration to Fresh Water Aquifers: • Fleckenstein
Conclusions
Conclusions
5. Probability of failure of one or more barriers in all vertical wells without
hydrocarbon migration was determined to be 2.4%.
6. Probability of hydrocarbon migration due to one or more barrier failures in all
vertical wells was determined to be 0.06%. Well constructed wells have a
documented migration occurring in every 0.02% of the wells.
7. No evidence of failures of one or more barriers was detected in horizontal
wells for shale development.
8. No evidence of hydrocarbon migration was found in horizontal wells used
for shale development.
Slide 23
SPE-175401-MS• An Assessment of Risk of Migration to Fresh Water Aquifers: • Fleckenstein
Conclusions
The authors acknowledge the support of the Colorado School of Mines
Petroleum Engineering Department. We are also grateful for the efforts of Jan
Mosnes - CSM, Troy Burke – University of Colorado-Boulder, and Stuart
Ellsworth – COGCC, in support of this paper. This research is supported by the
AirWaterGas Sustainability Research Network funded by the National Science
Foundation under Grant No. CBET-1240584. Any opinion, findings, and
conclusions or recommendations expressed in this paper are those of the
authors and do not necessarily reflect the views of the United States National
Science Foundation.
Slide 24
Acknowledgements
Thank You
Questions?