Embed Size (px)
Citation preview
SPE 141420
Determination of Anhydrite in Reservoirs for EOR Jose L Lopez-Salinas, George J Hirasaki and Clarence A Miller / SPE, Rice University
Copyright 2011, Society of Petroleum Engineers This paper was prepared for presentation at the SPE International Symposium on Oilfield Chemistry held in The Woodlands, Texas, USA, 11–13 April 2011. This paper was selected for presentation by an SPE program committee following review of information contained in an abstract submitted by the author(s). Contents of the paper have not been reviewed by the Society of Petroleum Engineers and are subject to correction by the author(s). The material does not necessarily reflect any position of the Society of Petroleum Engineers, its officers, or members. Electronic reproduction, distribution, or storage of any part of this paper without the written consent of the Society of Petroleum Engineers is prohibited. Permission to reproduce in print is restricted to an abstract of not more than 300 words; illustrations may not be copied. The abstract must contain conspicuous acknowledgment of SPE copyright.
Abstract
Alkali in surfactant flooding can sequester divalent ions and reduce surfactant adsorption. When the alkali is
sodium carbonate and anhydrite (or gypsum) is present, the anhydrite will dissolve and precipitate as calcium carbonate. An
anhydrite level of only 0.1% in the rock is enough to retard the breakthrough of a 1% sodium carbonate solution by
approximately 0.7 pore volume, which would greatly reduce effectiveness of a process having surfactants sensitive to
divalent ions. Different alkalis will also react with anhydrite.
A methodology is presented to estimate the amount, if any, of anhydrite present in the reservoir. The method is
based on brine software analysis of produced water compositions and inductively coupled plasma (ICP) analysis of core
samples. X-ray powder diffraction (XRD) can detect anhydrite when it is abundant, but will not be able to detect the low
amounts that can still be harmful to chemical EOR.
Produced water and core samples were analyzed from a high-temperature, high-salinity carbonate reservoir, which is
a candidate for surfactant EOR. Ten water analyses were obtained from ten wells in five formations. The formation brines
ranged from 3-to-20% of TDS. The reservoir rock was mostly dolomite, and reservoir temperature was about 120°C. The
saturation index calculated for all formation waters at high salinity (higher than sea water) was positive, indicating over
saturation with anhydrite. The saturation index was calculated with ScaleChem for high salinity and PHREEQC, which is
limited to lower salinity. The elemental composition of rock samples dissolved in acid was determined by ICP. The mass
percent of anhydrite was computed from the elemental analysis.
When these methods were applied to the dolomite reservoir of interest, they strongly indicated that anhydrite was
present in sufficient amounts to preclude use of sodium carbonate in a surfactant recovery process.
Introduction
The advantages of the use of alkali in anionic surfactant formulations for EOR applications are well known. Previous
experiments have demonstrated gravity-driven enhanced recovery of oil when interfacial tensions are low following
spontaneous imbibition of such formulations into oil-wet carbonate rock Hirasaki (2004). Studies conducted by Seethepalli et
al (2004) have shown that the use of anionic surfactants in presence of sodium carbonate can not only reduce oil-brine
interfacial tension but also change wettability from oil wet to intermediate/water-wet conditions for carbonate surfaces (i.e.
limestone, marble, dolomite and calcite). In these previous studies, some common reasons to use sodium carbonate are listed:
The high pH produces natural surfactants in-situ by the reaction with the naphthenic acids in the crude oil. The carbonate
suppresses the concentration of calcium in the brine. Sodium carbonate reduces ion exchange, mineral dissolution, and
adsorption of anionic surfactants. The carbonate precipitates do not exacerbate permeability compared with silicates and
hydroxides. Moreover, sodium carbonate is inexpensive.
Presence of anhydrite is unfavorable in flooding with surfactants with low tolerance to divalent ions (e.g. calcium and
magnesium), Alkali in surfactant flooding sequesters divalent ions and reduces surfactant adsorption. When the alkali is
sodium carbonate and anhydrite or gypsum is present, the anhydrite will dissolve and precipitate as calcium carbonate.
Anhydrite or gypsum at a level of only 0.1% in dolomite rock with porosity of 23% is enough to retard the breakthrough of a
2 SPE 141420
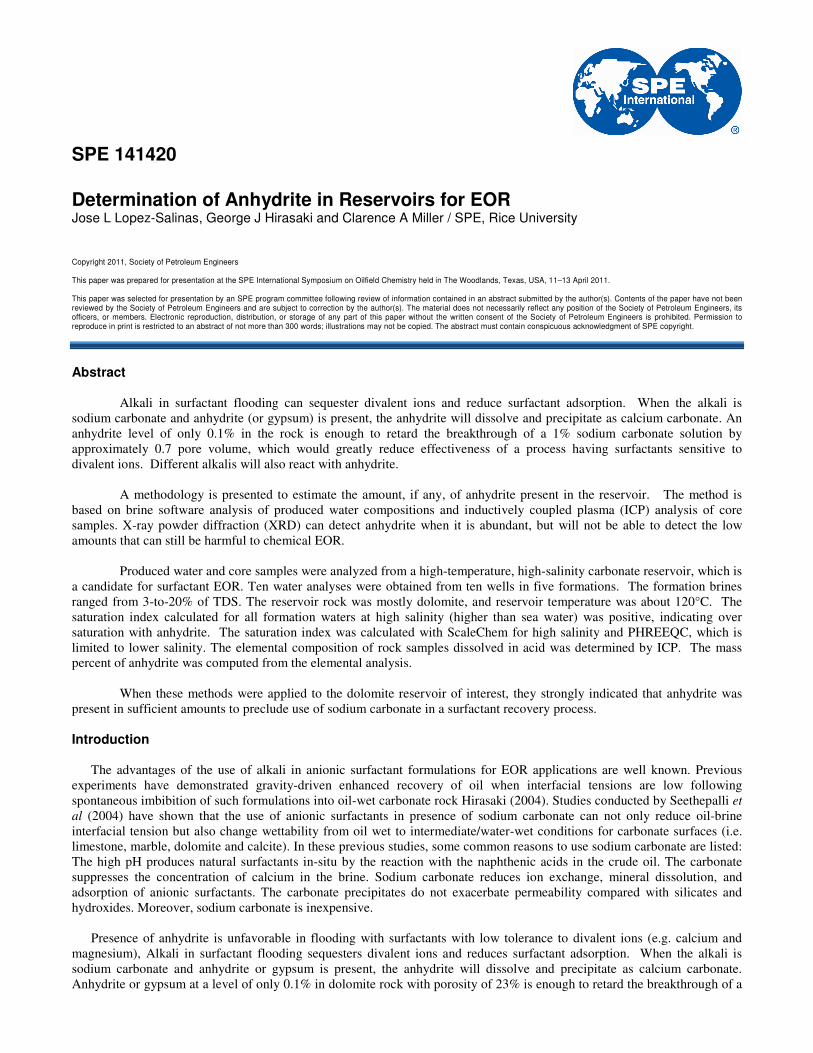
1% by mass sodium carbonate solution by 0.7 pore volume as indicated in fig 1 and fig 2. The analysis for fig.1 is consistent
with results reported by Liu (2008). Different alkalis will react as well with anhydrite.
The analysis of figs.1 and 2 is based on the assumption that anhydrite will consume the sodium carbonate, producing a
precipitate of calcium carbonate (Hirasaki, 2005 and 2006).
����� �� ����� ��� � 2 ������ ��� ����� ���� �� Equation 1
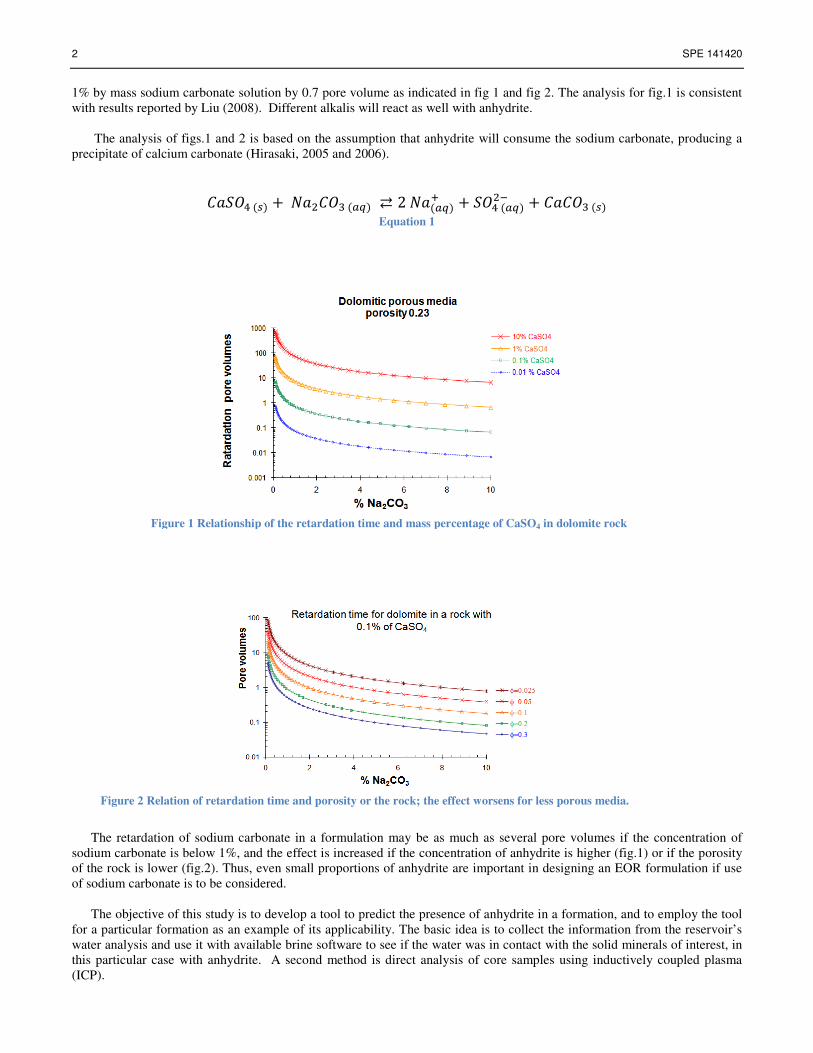
The retardation of sodium carbonate in a formulation may be as much as several pore volumes if the concentration of
sodium carbonate is below 1%, and the effect is increased if the concentration of anhydrite is higher (fig.1) or if the porosity
of the rock is lower (fig.2). Thus, even small proportions of anhydrite are important in designing an EOR formulation if use
of sodium carbonate is to be considered.
The objective of this study is to develop a tool to predict the presence of anhydrite in a formation, and to employ the tool
for a particular formation as an example of its applicability. The basic idea is to collect the information from the reservoir’s
water analysis and use it with available brine software to see if the water was in contact with the solid minerals of interest, in
this particular case with anhydrite. A second method is direct analysis of core samples using inductively coupled plasma
(ICP).
Figure 2 Relation of retardation time and porosity or the rock; the effect worsens for less porous media.
Figure 1 Relationship of the retardation time and mass percentage of CaSO4 in dolomite rock
SPE 141420 3
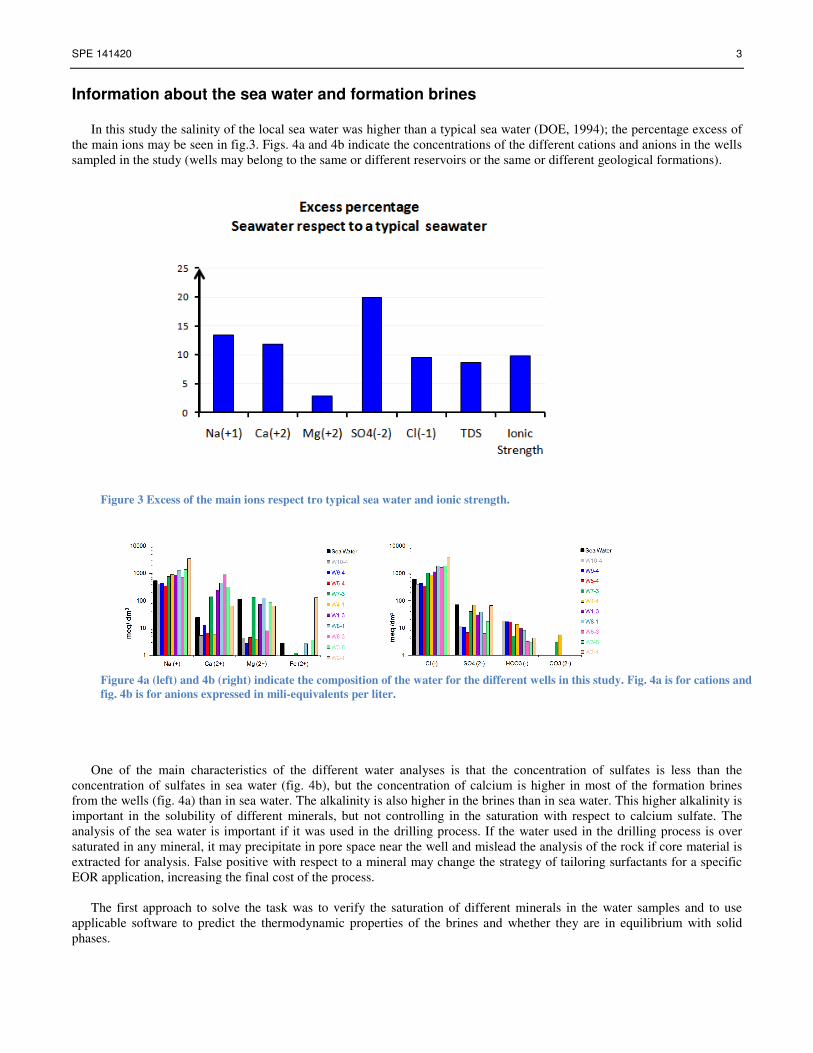
Information about the sea water and formation brines In this study the salinity of the local sea water was higher than a typical sea water (DOE, 1994); the percentage excess of
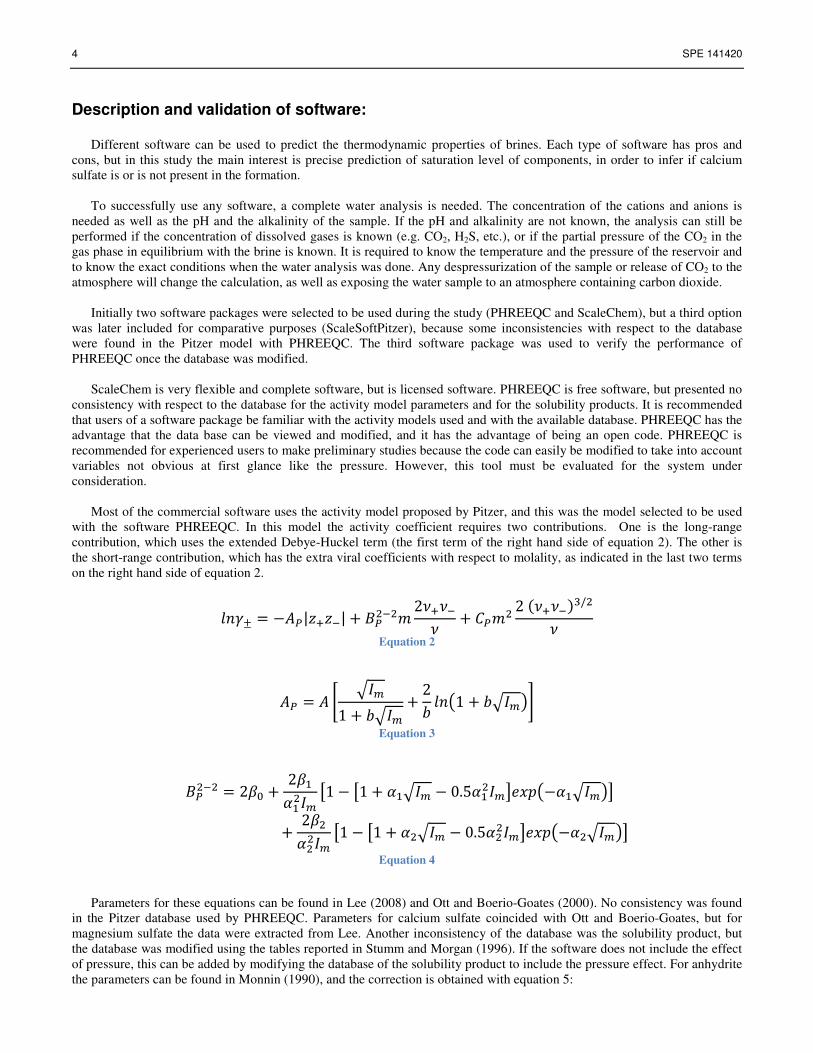
the main ions may be seen in fig.3. Figs. 4a and 4b indicate the concentrations of the different cations and anions in the wells
sampled in the study (wells may belong to the same or different reservoirs or the same or different geological formations).
One of the main characteristics of the different water analyses is that the concentration of sulfates is less than the
concentration of sulfates in sea water (fig. 4b), but the concentration of calcium is higher in most of the formation brines
from the wells (fig. 4a) than in sea water. The alkalinity is also higher in the brines than in sea water. This higher alkalinity is
important in the solubility of different minerals, but not controlling in the saturation with respect to calcium sulfate. The
analysis of the sea water is important if it was used in the drilling process. If the water used in the drilling process is over
saturated in any mineral, it may precipitate in pore space near the well and mislead the analysis of the rock if core material is
extracted for analysis. False positive with respect to a mineral may change the strategy of tailoring surfactants for a specific
EOR application, increasing the final cost of the process.
The first approach to solve the task was to verify the saturation of different minerals in the water samples and to use
applicable software to predict the thermodynamic properties of the brines and whether they are in equilibrium with solid
phases.
Figure 4a (left) and 4b (right) indicate the composition of the water for the different wells in this study. Fig. 4a is for cations and
fig. 4b is for anions expressed in mili-equivalents per liter.
Figure 3 Excess of the main ions respect tro typical sea water and ionic strength.
4 SPE 141420
Description and validation of software: Different software can be used to predict the thermodynamic properties of brines. Each type of software has pros and
cons, but in this study the main interest is precise prediction of saturation level of components, in order to infer if calcium
sulfate is or is not present in the formation.
To successfully use any software, a complete water analysis is needed. The concentration of the cations and anions is
needed as well as the pH and the alkalinity of the sample. If the pH and alkalinity are not known, the analysis can still be
performed if the concentration of dissolved gases is known (e.g. CO2, H2S, etc.), or if the partial pressure of the CO2 in the
gas phase in equilibrium with the brine is known. It is required to know the temperature and the pressure of the reservoir and
to know the exact conditions when the water analysis was done. Any despressurization of the sample or release of CO2 to the
atmosphere will change the calculation, as well as exposing the water sample to an atmosphere containing carbon dioxide.
Initially two software packages were selected to be used during the study (PHREEQC and ScaleChem), but a third option
was later included for comparative purposes (ScaleSoftPitzer), because some inconsistencies with respect to the database
were found in the Pitzer model with PHREEQC. The third software package was used to verify the performance of
PHREEQC once the database was modified.
ScaleChem is very flexible and complete software, but is licensed software. PHREEQC is free software, but presented no
consistency with respect to the database for the activity model parameters and for the solubility products. It is recommended
that users of a software package be familiar with the activity models used and with the available database. PHREEQC has the
advantage that the data base can be viewed and modified, and it has the advantage of being an open code. PHREEQC is
recommended for experienced users to make preliminary studies because the code can easily be modified to take into account
variables not obvious at first glance like the pressure. However, this tool must be evaluated for the system under
consideration.
Most of the commercial software uses the activity model proposed by Pitzer, and this was the model selected to be used
with the software PHREEQC. In this model the activity coefficient requires two contributions. One is the long-range
contribution, which uses the extended Debye-Huckel term (the first term of the right hand side of equation 2). The other is
the short-range contribution, which has the extra viral coefficients with respect to molality, as indicated in the last two terms
on the right hand side of equation 2.
���� � ���|����| ������2 � � ���� 2 � � � /�
Equation 2
�� � � " #$%1 '#$% 2
' ��(1 '#$%)* Equation 3
����� � 2+, 2+-.-�$% /1 � /1 .-#$% � 0.5.-�$%3456(�.-#$%)3 2+�.��$% /1 � /1 .�#$% � 0.5.��$%3456(�.�#$%)3
Equation 4
Parameters for these equations can be found in Lee (2008) and Ott and Boerio-Goates (2000). No consistency was found
in the Pitzer database used by PHREEQC. Parameters for calcium sulfate coincided with Ott and Boerio-Goates, but for
magnesium sulfate the data were extracted from Lee. Another inconsistency of the database was the solubility product, but
the database was modified using the tables reported in Stumm and Morgan (1996). If the software does not include the effect
of pressure, this can be added by modifying the database of the solubility product to include the pressure effect. For anhydrite
the parameters can be found in Monnin (1990), and the correction is obtained with equation 5:
SPE 141420 5
Equation 5
Three different tests were used to select the software packages for this study. The first test is to see if they agree with
experimental data in the trend of saturation temperature with respect to anhydrite in a process in which sulfate is removed
from sea water. Sea water is used in this initial simulation because we need to know whether we can inject sea water in the
proposed EOR process for the reservoir of interest without having precipitation of any salts. A second test is to verify if the
software can predict the solubility of calcium sulfate in deionized (DI) water at different temperatures. A third test is to
calculate the solubility of calcium sulfate in highly salty water (ca. 20% of NaCl). The results of these tests are presented in
figs. 5-7. All three of the above software packages predict more less the same results for water systems at low salinity (i.e.
salinity close or less than sea water), but differences can be found at high salinity (between sea water and 20% of sodium
chloride). For this reason a validation of the software was required.
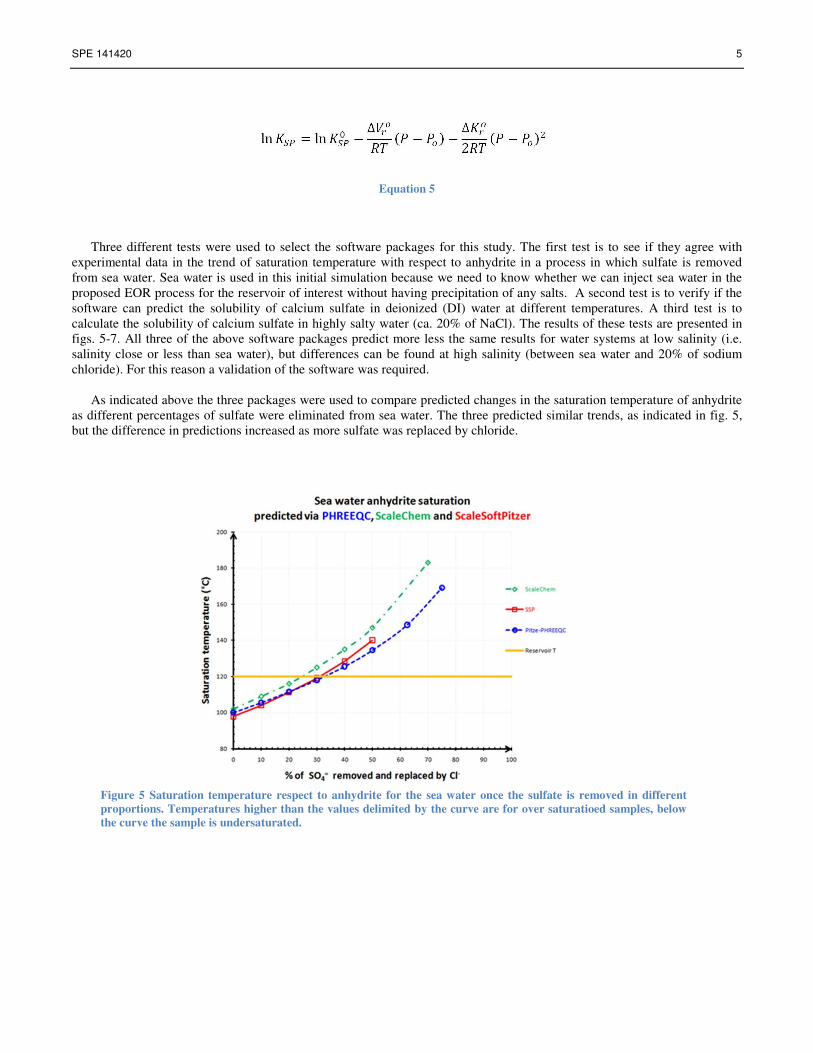
As indicated above the three packages were used to compare predicted changes in the saturation temperature of anhydrite
as different percentages of sulfate were eliminated from sea water. The three predicted similar trends, as indicated in fig. 5,
but the difference in predictions increased as more sulfate was replaced by chloride.
Figure 5 Saturation temperature respect to anhydrite for the sea water once the sulfate is removed in different
proportions. Temperatures higher than the values delimited by the curve are for over saturatioed samples, below
the curve the sample is undersaturated.
6 SPE 141420
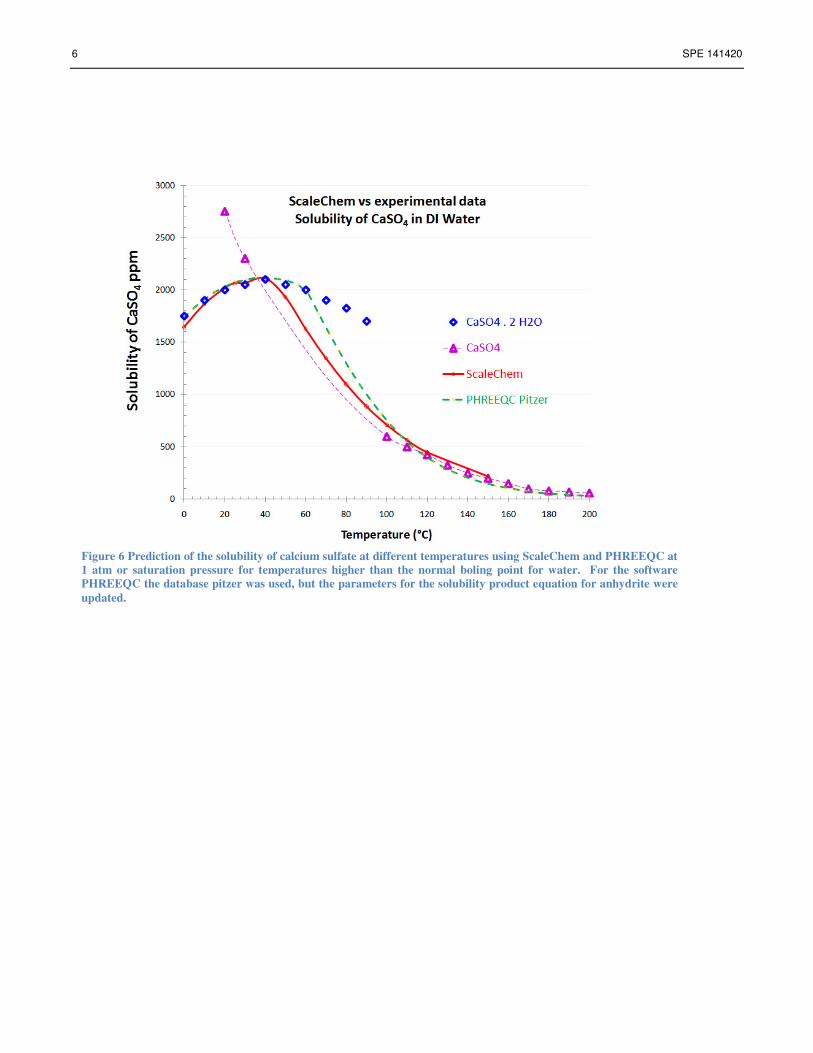
Figure 6 Prediction of the solubility of calcium sulfate at different temperatures using ScaleChem and PHREEQC at
1 atm or saturation pressure for temperatures higher than the normal boling point for water. For the software
PHREEQC the database pitzer was used, but the parameters for the solubility product equation for anhydrite were
updated.
SPE 141420 7
Fig. 6 indicates that the error in region between 50° and 100° is less when ScaleChem was used to predict anhydrite
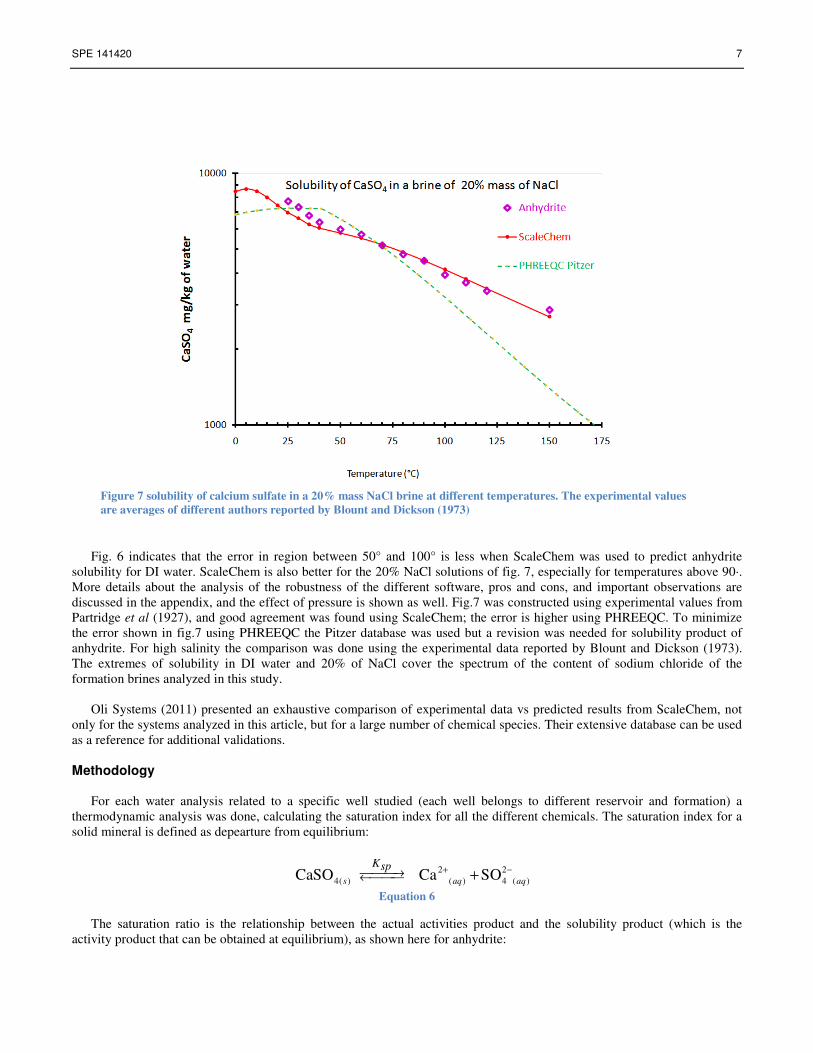
solubility for DI water. ScaleChem is also better for the 20% NaCl solutions of fig. 7, especially for temperatures above 90·.
More details about the analysis of the robustness of the different software, pros and cons, and important observations are
discussed in the appendix, and the effect of pressure is shown as well. Fig.7 was constructed using experimental values from
Partridge et al (1927), and good agreement was found using ScaleChem; the error is higher using PHREEQC. To minimize
the error shown in fig.7 using PHREEQC the Pitzer database was used but a revision was needed for solubility product of
anhydrite. For high salinity the comparison was done using the experimental data reported by Blount and Dickson (1973).
The extremes of solubility in DI water and 20% of NaCl cover the spectrum of the content of sodium chloride of the
formation brines analyzed in this study.
Oli Systems (2011) presented an exhaustive comparison of experimental data vs predicted results from ScaleChem, not
only for the systems analyzed in this article, but for a large number of chemical species. Their extensive database can be used
as a reference for additional validations.
Methodology
For each water analysis related to a specific well studied (each well belongs to different reservoir and formation) a
thermodynamic analysis was done, calculating the saturation index for all the different chemicals. The saturation index for a
solid mineral is defined as depearture from equilibrium:
2 2
4( ) ( ) 4 ( )CaSO Ca SO s aq aq
Ksp + −→← +
Equation 6
The saturation ratio is the relationship between the actual activities product and the solubility product (which is the
activity product that can be obtained at equilibrium), as shown here for anhydrite:
Figure 7 solubility of calcium sulfate in a 20% mass NaCl brine at different temperatures. The experimental values
are averages of different authors reported by Blount and Dickson (1973)
8 SPE 141420
+ −
=a aSR K2 2
4Ca SO
sp Equation 7
Then the saturation index is a logarithmic scale of the saturation ratio defined as:
10log ( )= SRSI
Equation 8
Using this definition of saturation index, a negative value will be obtained for under saturated brines, zero for saturated
brines and, and positive values for oversaturated brines. Saturation and oversaturation of a mineral may be an indicator of the
presence of that species in the formation.
After calculation of thermodynamic preoperties of the different water analysis, core materials from different wells were
analyzed using XRD and ICP to verify the predictions of the software. Additional tests were done to verify if nondestructive
tests to rock material are possible. The rock was contacted with brine without sulfates at high temperature to measure
solubilization of anhydrite via ICP.
Results
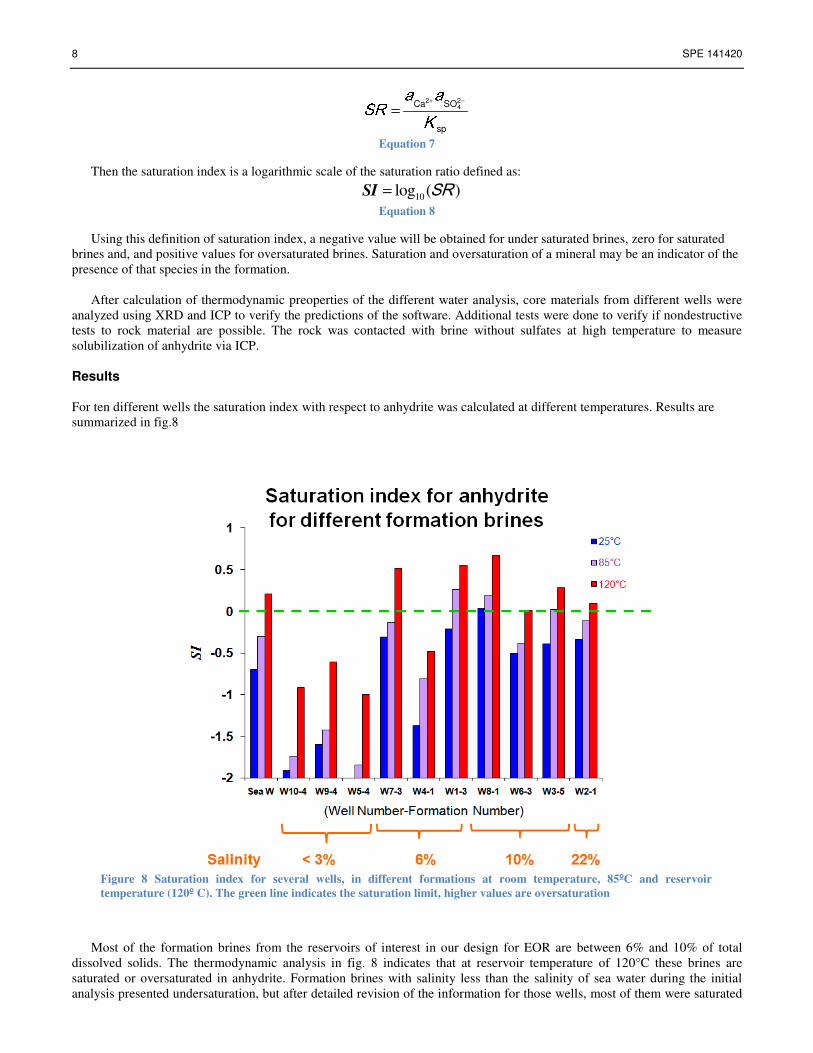
For ten different wells the saturation index with respect to anhydrite was calculated at different temperatures. Results are
summarized in fig.8
Most of the formation brines from the reservoirs of interest in our design for EOR are between 6% and 10% of total
dissolved solids. The thermodynamic analysis in fig. 8 indicates that at reservoir temperature of 120°C these brines are
saturated or oversaturated in anhydrite. Formation brines with salinity less than the salinity of sea water during the initial
analysis presented undersaturation, but after detailed revision of the information for those wells, most of them were saturated
Figure 8 Saturation index for several wells, in different formations at room temperature, 85ºC and reservoir
temperature (120º C). The green line indicates the saturation limit, higher values are oversaturation
SPE 141420 9
or close to saturation. However, the analysis was strongly dependent on the depth of those samples (i.e. the formation), and a
specific case is presented in the appendix (fig.A-19), where the salinity was low, but oversaturation existed.
The saturation index for most of the minerals is sensitive to the pH, anhydrite being an exception. The effect of the
pressure should be considered for very high pressures, especially those samples close to saturation. In our system the pressure
had a weak effect, no more that 4°C of difference in anhydrite saturation temperature for changes in pressure close to or
higher than the reservoir pressure.
Different experimental techniques can be used to detect the presence of anhydrite in the rock, but this can be a problem
when concentration of calcium sulfate is not high in the formation. To verify if anhydrite is one of the minerals present in the
formation, X-ray powder diffraction is one alternative, but this technique may fail if the concentration of the anhydrite is less
than 1%. Moreover, detection can be more difficult if the rock has more than three different minerals. Another technique
consists of weighing a sample of 2 g and contacting with 0.5 of DI water for 12 h. After separating the aqueous phase, one
precipitates the SO42-
of the dissolved anhydrite using BaCl2 and weighs the BaSO4 formed. However, the detection limit is
0.6 wt% in the sample, according with Paulict et al (2005). This value is not low enough for the method to detect all
anhydrite contents that could significantly affect alkali/surfactant EOR processes, as indicated in the earlier discussion of
figs. 1 and 2.
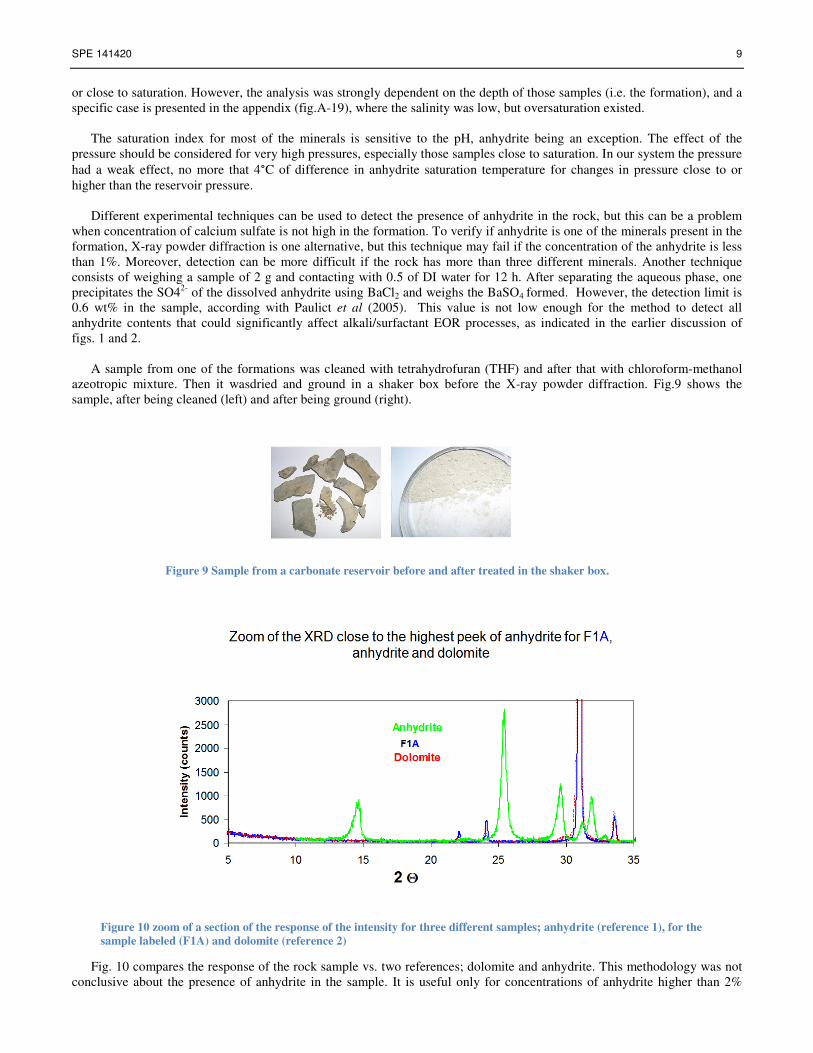
A sample from one of the formations was cleaned with tetrahydrofuran (THF) and after that with chloroform-methanol
azeotropic mixture. Then it wasdried and ground in a shaker box before the X-ray powder diffraction. Fig.9 shows the
sample, after being cleaned (left) and after being ground (right).
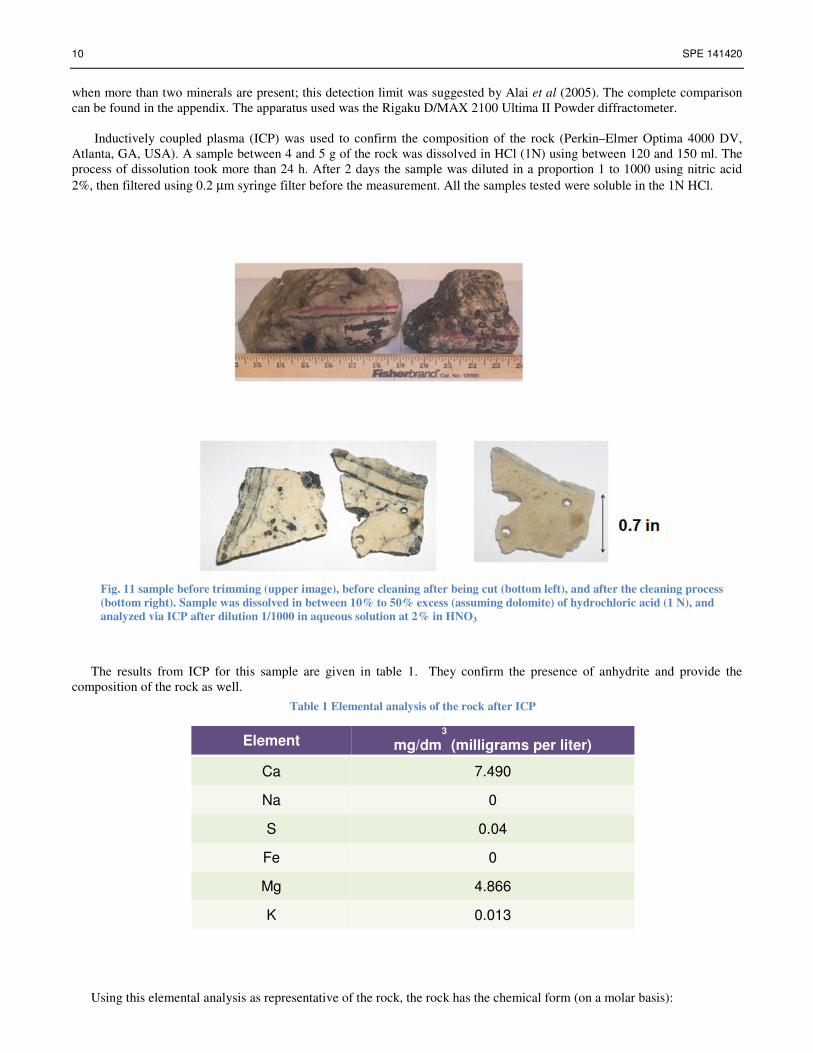
Fig. 10 compares the response of the rock sample vs. two references; dolomite and anhydrite. This methodology was not
conclusive about the presence of anhydrite in the sample. It is useful only for concentrations of anhydrite higher than 2%
Figure 10 zoom of a section of the response of the intensity for three different samples; anhydrite (reference 1), for the
sample labeled (F1A) and dolomite (reference 2)
Figure 9 Sample from a carbonate reservoir before and after treated in the shaker box.
10 SPE 141420
when more than two minerals are present; this detection limit was suggested by Alai et al (2005). The complete comparison
can be found in the appendix. The apparatus used was the Rigaku D/MAX 2100 Ultima II Powder diffractometer.
Inductively coupled plasma (ICP) was used to confirm the composition of the rock (Perkin–Elmer Optima 4000 DV,
Atlanta, GA, USA). A sample between 4 and 5 g of the rock was dissolved in HCl (1N) using between 120 and 150 ml. The
process of dissolution took more than 24 h. After 2 days the sample was diluted in a proportion 1 to 1000 using nitric acid
2%, then filtered using 0.2 µm syringe filter before the measurement. All the samples tested were soluble in the 1N HCl.
The results from ICP for this sample are given in table 1. They confirm the presence of anhydrite and provide the
composition of the rock as well.
Using this elemental analysis as representative of the rock, the rock has the chemical form (on a molar basis):
Table 1 Elemental analysis of the rock after ICP
Element mg/dm3
(milligrams per liter)
Ca 7.490
Na 0
S 0.04
Fe 0
Mg 4.866
K 0.013
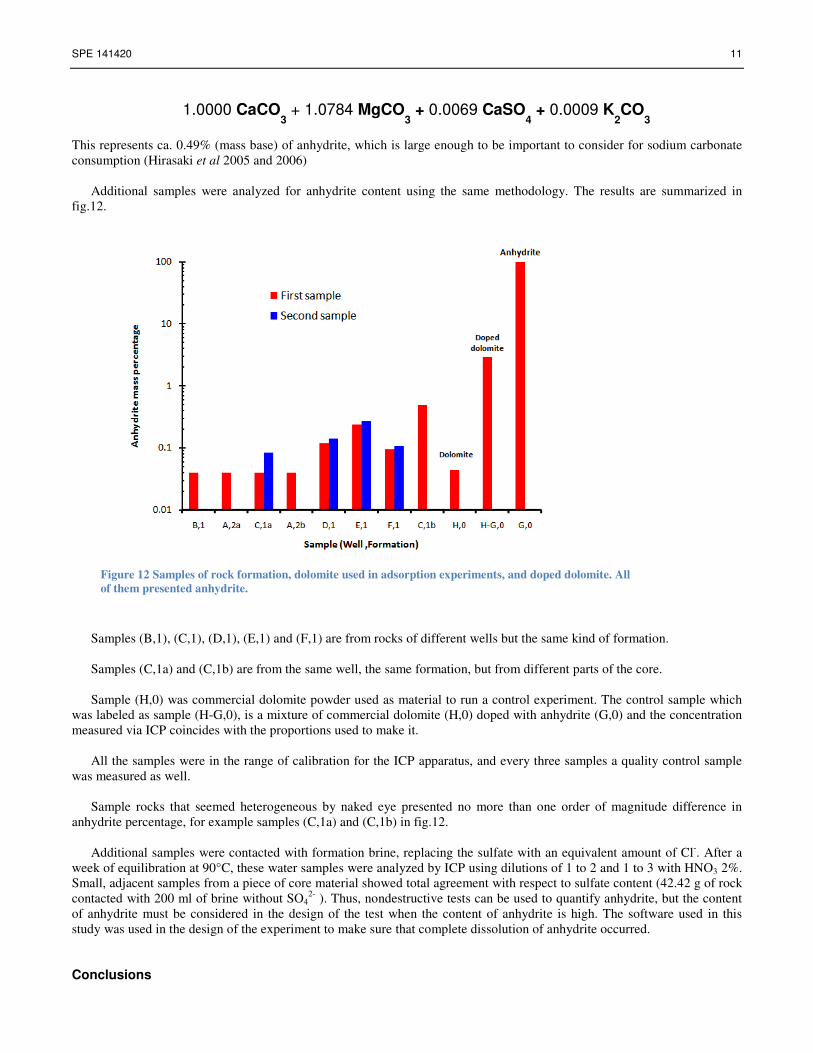
Fig. 11 sample before trimming (upper image), before cleaning after being cut (bottom left), and after the cleaning process
(bottom right). Sample was dissolved in between 10% to 50% excess (assuming dolomite) of hydrochloric acid (1 N), and
analyzed via ICP after dilution 1/1000 in aqueous solution at 2% in HNO3
SPE 141420 11
1.0000 CaCO3 + 1.0784 MgCO
3 + 0.0069 CaSO
4 + 0.0009 K
2CO
3
This represents ca. 0.49% (mass base) of anhydrite, which is large enough to be important to consider for sodium carbonate
consumption (Hirasaki et al 2005 and 2006)
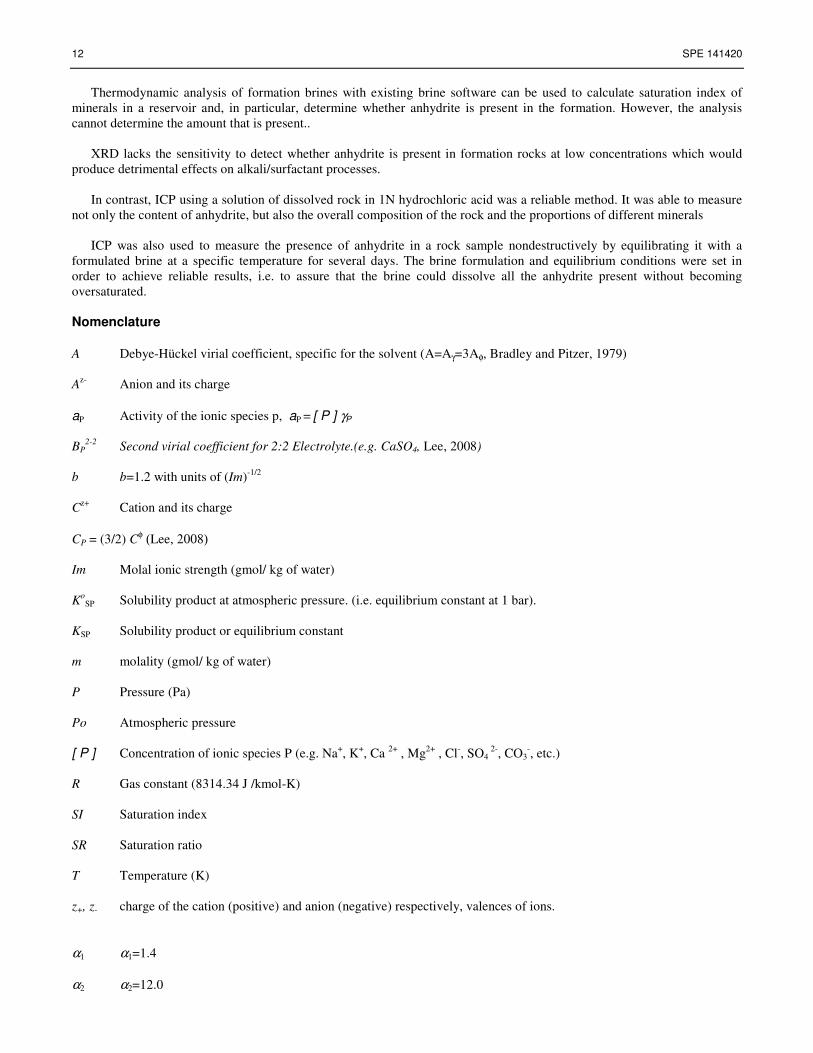
Additional samples were analyzed for anhydrite content using the same methodology. The results are summarized in
fig.12.
Samples (B,1), (C,1), (D,1), (E,1) and (F,1) are from rocks of different wells but the same kind of formation.
Samples (C,1a) and (C,1b) are from the same well, the same formation, but from different parts of the core.
Sample (H,0) was commercial dolomite powder used as material to run a control experiment. The control sample which
was labeled as sample (H-G,0), is a mixture of commercial dolomite (H,0) doped with anhydrite (G,0) and the concentration
measured via ICP coincides with the proportions used to make it.
All the samples were in the range of calibration for the ICP apparatus, and every three samples a quality control sample
was measured as well.
Sample rocks that seemed heterogeneous by naked eye presented no more than one order of magnitude difference in
anhydrite percentage, for example samples (C,1a) and (C,1b) in fig.12.
Additional samples were contacted with formation brine, replacing the sulfate with an equivalent amount of Cl-. After a
week of equilibration at 90°C, these water samples were analyzed by ICP using dilutions of 1 to 2 and 1 to 3 with HNO3 2%.
Small, adjacent samples from a piece of core material showed total agreement with respect to sulfate content (42.42 g of rock
contacted with 200 ml of brine without SO42-
). Thus, nondestructive tests can be used to quantify anhydrite, but the content
of anhydrite must be considered in the design of the test when the content of anhydrite is high. The software used in this
study was used in the design of the experiment to make sure that complete dissolution of anhydrite occurred.
Conclusions
Figure 12 Samples of rock formation, dolomite used in adsorption experiments, and doped dolomite. All
of them presented anhydrite.
12 SPE 141420
Thermodynamic analysis of formation brines with existing brine software can be used to calculate saturation index of
minerals in a reservoir and, in particular, determine whether anhydrite is present in the formation. However, the analysis
cannot determine the amount that is present..
XRD lacks the sensitivity to detect whether anhydrite is present in formation rocks at low concentrations which would
produce detrimental effects on alkali/surfactant processes.
In contrast, ICP using a solution of dissolved rock in 1N hydrochloric acid was a reliable method. It was able to measure
not only the content of anhydrite, but also the overall composition of the rock and the proportions of different minerals
ICP was also used to measure the presence of anhydrite in a rock sample nondestructively by equilibrating it with a
formulated brine at a specific temperature for several days. The brine formulation and equilibrium conditions were set in
order to achieve reliable results, i.e. to assure that the brine could dissolve all the anhydrite present without becoming
oversaturated.
Nomenclature
A Debye-Hückel virial coefficient, specific for the solvent (A=Aγ=3Aφ, Bradley and Pitzer, 1979)
Az-
Anion and its charge
aP Activity of the ionic species p, aP = [ P ] γP
BP2-2
Second virial coefficient for 2:2 Electrolyte.(e.g. CaSO4, Lee, 2008)
b b=1.2 with units of (Im)-1/2
Cz+
Cation and its charge
CP = (3/2) Cφ (Lee, 2008)
Im Molal ionic strength (gmol/ kg of water)
Ko
SP Solubility product at atmospheric pressure. (i.e. equilibrium constant at 1 bar).
KSP Solubility product or equilibrium constant
m molality (gmol/ kg of water)
P Pressure (Pa)
Po Atmospheric pressure
[ P ] Concentration of ionic species P (e.g. Na+, K
+, Ca
2+ , Mg
2+ , Cl
-, SO4
2-, CO3
-, etc.)
R Gas constant (8314.34 J /kmol-K)
SI Saturation index
SR Saturation ratio
T Temperature (K)
z+, z- charge of the cation (positive) and anion (negative) respectively, valences of ions.
α1 α1=1.4
α2 α2=12.0

SPE 141420 13
α α=2 (α1=α and α2=0 if the electrolyte is 1:1, 1:2 or 1:3)
β0 ,β1 ,β2 and Cφ are parameters specific to the ionic species
γ± Mean activity coefficient γ± = (γ+ν+γ-
ν− )
1/ν
∆V
0r The change of the standard partial molal volume for the mineral dissolution
∆Κ0r The change of the standard compressibility of the dissolution reaction
ν+ , ν- ( Cν+Aν- = ν+ C z+
+ ν- Az- ) Proportion of the cation and anion in the mineral or salt, ν+z+ + ν-z- = 0
Acknowledgments
PEMEX and IMP
Financial support from Tecnológico de Monterrey, Campus Monterrey Grant ( CAT-125)
Roberto Rocca Fellowship
Haiping and Dr. Mason Tomson from Brine Chemistry Consortium at Rice University
References Alai M, Sutton M, Carroll Susan A, “Evaporative Evolution of a Na-Cl-NO3-K-Ca-SO4-Mg-Si Brine at 95ºC: Experiments and Modeling
relevant to Yucca Mountain, Nevada, USA” Geochemical Transactions Vol 6, No.2 2005
Blount Charles W and Dickson Frank W “Gypsum-Anhydrite Equilibria in Systems CaSO4-H2O and CaSO4-NaCl-H2O” American
Minerologist, 58 (323-331) 1973
DOE (1994) Handbook of methods for the analysis of the various parameters of the carbon dioxide systems in sea water; version 2, A.G.
Dickson & C. Goyet, eds., ORNL/CDIAC-74
Haiping, Kan Amy, Zhang Ping, Yu Jie, Fan Chunfang, Tomson Mason B “Phase Stability of Calcium Sulfate in the System
NaCl/monoethylene glycol/water” SPE International Conference on Oilfield Scale, 26-27 May 2010, Aberdeen, UK
Hirasaki G.J. and Zhang D.L. Chemistry of Oil Recovery from fractured, Oil-wet, carbonate formations” SPE J (151-162) 2004
Hirasaki G.J, Miller C.A, Pope G.A. Surfactant Based Enhanced Oil Recovery and Foam Mobility Control. Semi Annual Technical Report,
2005. DE-FC26-03NT15406, DOE
Liu Shunhua “Alkaline Surfactant Polymer Enhanced Oil Recovery Process”, Rice University, Thesis 2008
Liu S., Li. R. , Miller C.A. and Hirasaki G.J. ASP Processes: Wide Range of Conditions for Good Recovery, SPE J, 2010
Lee Lloyd L. Molecular Thermodynamics of electrolyte Solutions, 2008
Monnin C. The influence of pressure on the activity coefficient of the solutes and on the solubility of minerals in systems Na-Ca-Cl-SO4-
H2O to 200°C and 1 kbar, and high NaCl concentration Geochimica et Cosmochimica Acta Vol.54, pp. 3265-3283
Oli Systems Support.olisystems.com/Documents/Validation Data Sets/PredSO4.xls, 2011
Ott J.B. and Boerio-Goates J, Chemical Thermodynamics: Advanced Applications. Academic Press, 2000
Partridge Everett P, White Alfred H “The solubility of calcium sulfate from 0 to 200º” JACS 51 (360-370) 1929
Paulick H, Herzig P, and Hoernes S 8. Data report: a comprehensive Geochemical, mineralogical, and Isotopic data set of variably altered
Dacitic volcanic rocks from the Subsurface of the pacmanus Hydrothermal field (odp leg 193)1 Barriga, F.J.A.S., Binns, R.A., Miller, D.J.,
and Herzig, P.M. (Eds.) Proceedings of the Ocean Drilling Program, Scientific Results Volume 193, 2005
Seethepalli A, Adibhatla B and Mohanty K. Wettability alteration during surfactant flooding of Carbonate Reservoirs. SPE/DOE
Fourteenth Symposium on Improved Oil Recovery held in Tulsa, Oklahoma, U.S.A., 17-21 April 2004. SPE 89323, 2004
Stumm, Werner and Morgan, James J. Aquatic Chemistry third edition, Wiley 1996
14 SPE 141420
Appendix A
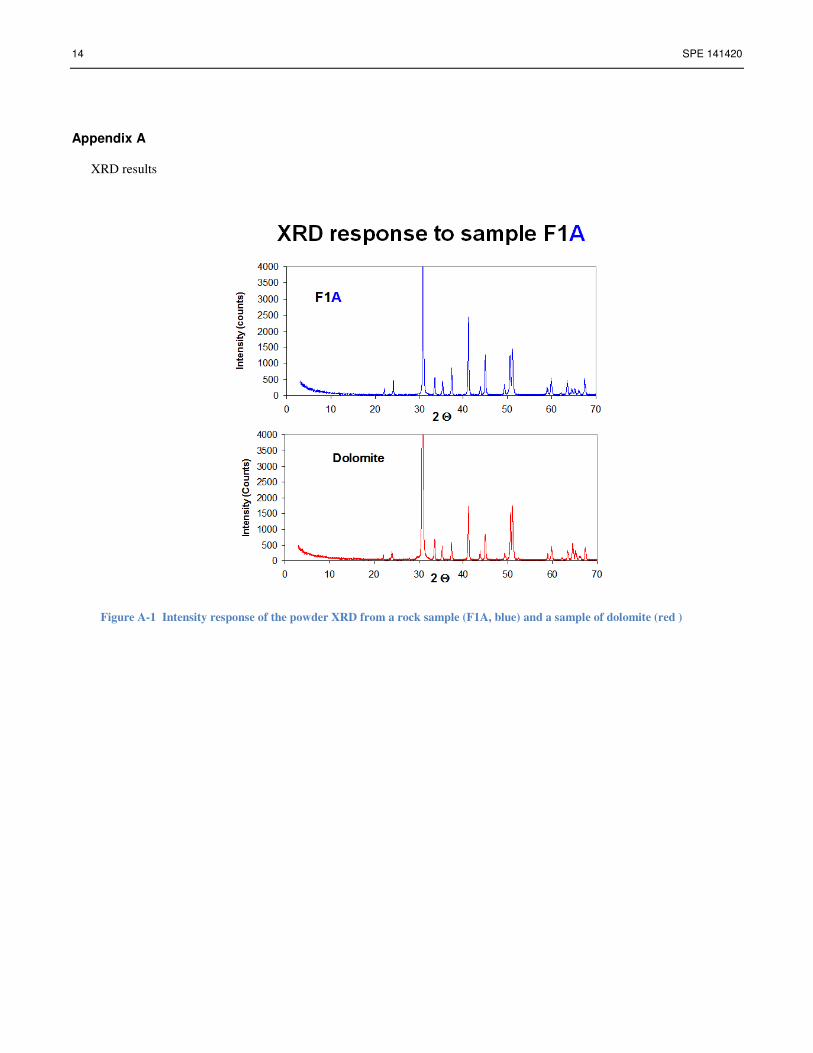
XRD results
Figure A-1 Intensity response of the powder XRD from a rock sample (F1A, blue) and a sample of dolomite (red )
SPE 141420 15
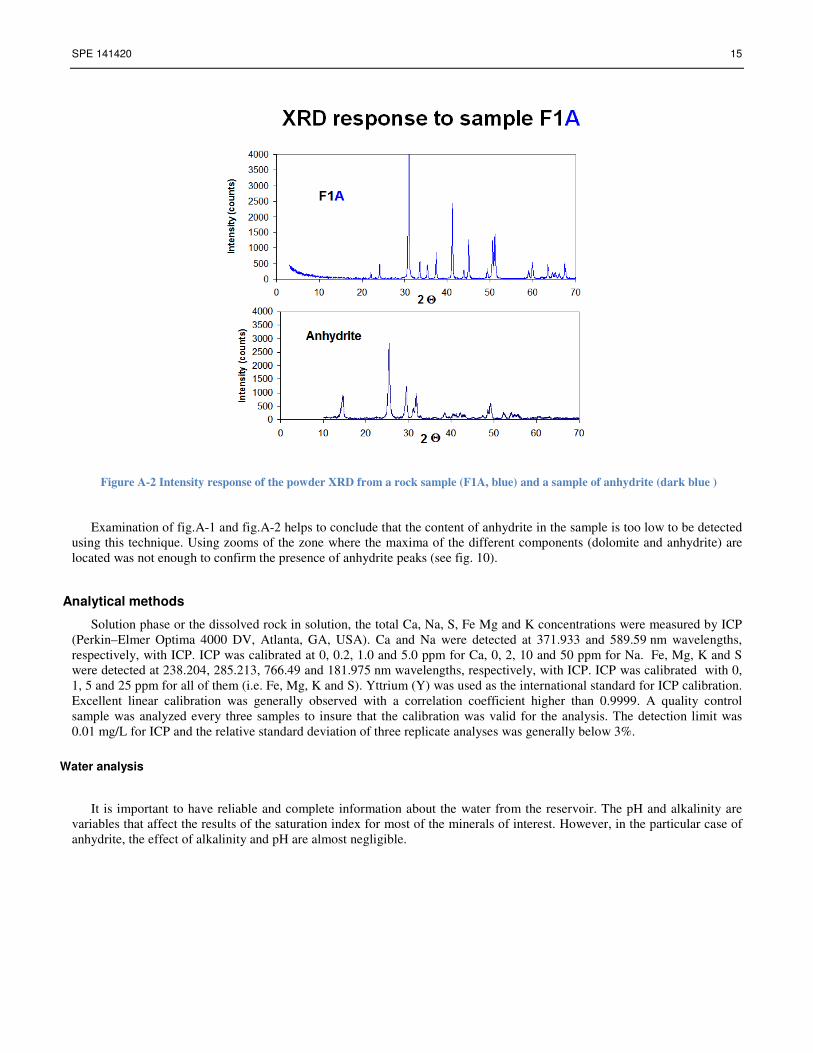
Examination of fig.A-1 and fig.A-2 helps to conclude that the content of anhydrite in the sample is too low to be detected
using this technique. Using zooms of the zone where the maxima of the different components (dolomite and anhydrite) are
located was not enough to confirm the presence of anhydrite peaks (see fig. 10).
Analytical methods
Solution phase or the dissolved rock in solution, the total Ca, Na, S, Fe Mg and K concentrations were measured by ICP
(Perkin–Elmer Optima 4000 DV, Atlanta, GA, USA). Ca and Na were detected at 371.933 and 589.59 nm wavelengths,
respectively, with ICP. ICP was calibrated at 0, 0.2, 1.0 and 5.0 ppm for Ca, 0, 2, 10 and 50 ppm for Na. Fe, Mg, K and S
were detected at 238.204, 285.213, 766.49 and 181.975 nm wavelengths, respectively, with ICP. ICP was calibrated with 0,
1, 5 and 25 ppm for all of them (i.e. Fe, Mg, K and S). Yttrium (Y) was used as the international standard for ICP calibration.
Excellent linear calibration was generally observed with a correlation coefficient higher than 0.9999. A quality control
sample was analyzed every three samples to insure that the calibration was valid for the analysis. The detection limit was
0.01 mg/L for ICP and the relative standard deviation of three replicate analyses was generally below 3%.
Water analysis
It is important to have reliable and complete information about the water from the reservoir. The pH and alkalinity are
variables that affect the results of the saturation index for most of the minerals of interest. However, in the particular case of
anhydrite, the effect of alkalinity and pH are almost negligible.
Figure A-2 Intensity response of the powder XRD from a rock sample (F1A, blue) and a sample of anhydrite (dark blue )
16 SPE 141420
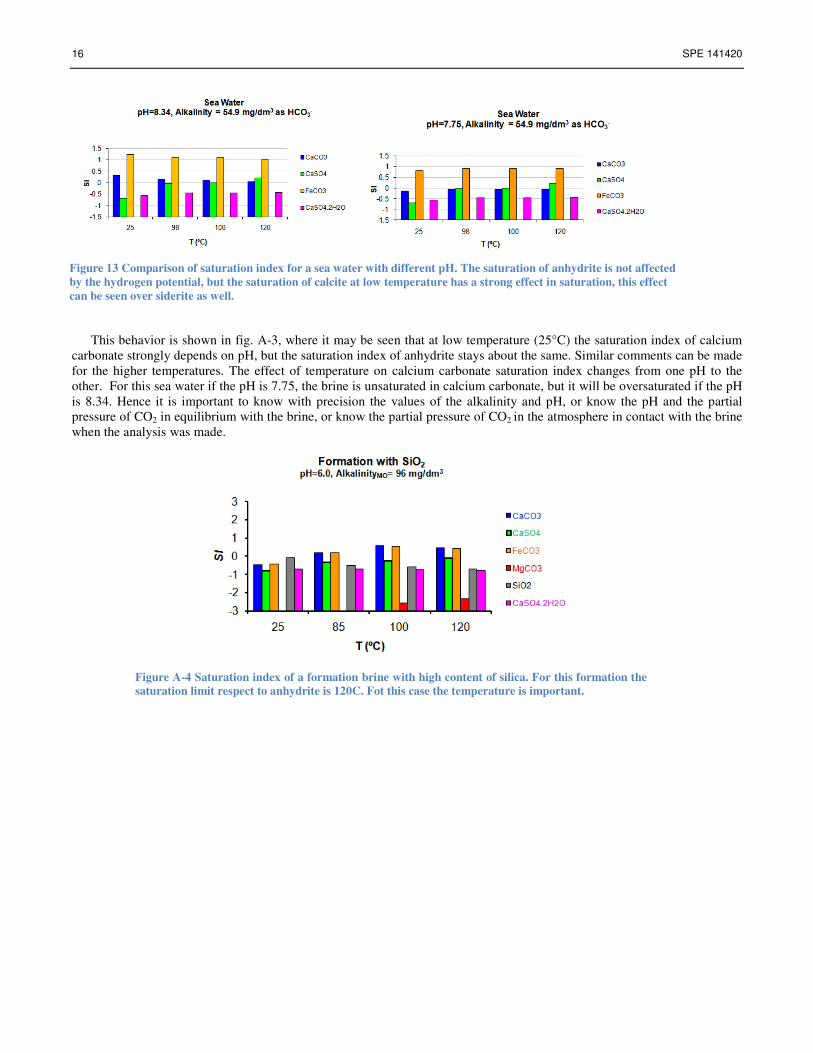
This behavior is shown in fig. A-3, where it may be seen that at low temperature (25°C) the saturation index of calcium
carbonate strongly depends on pH, but the saturation index of anhydrite stays about the same. Similar comments can be made
for the higher temperatures. The effect of temperature on calcium carbonate saturation index changes from one pH to the
other. For this sea water if the pH is 7.75, the brine is unsaturated in calcium carbonate, but it will be oversaturated if the pH
is 8.34. Hence it is important to know with precision the values of the alkalinity and pH, or know the pH and the partial
pressure of CO2 in equilibrium with the brine, or know the partial pressure of CO2 in the atmosphere in contact with the brine
when the analysis was made.
Figure A-4 Saturation index of a formation brine with high content of silica. For this formation the
saturation limit respect to anhydrite is 120C. Fot this case the temperature is important.
Figure 13 Comparison of saturation index for a sea water with different pH. The saturation of anhydrite is not affected
by the hydrogen potential, but the saturation of calcite at low temperature has a strong effect in saturation, this effect
can be seen over siderite as well.
SPE 141420 17
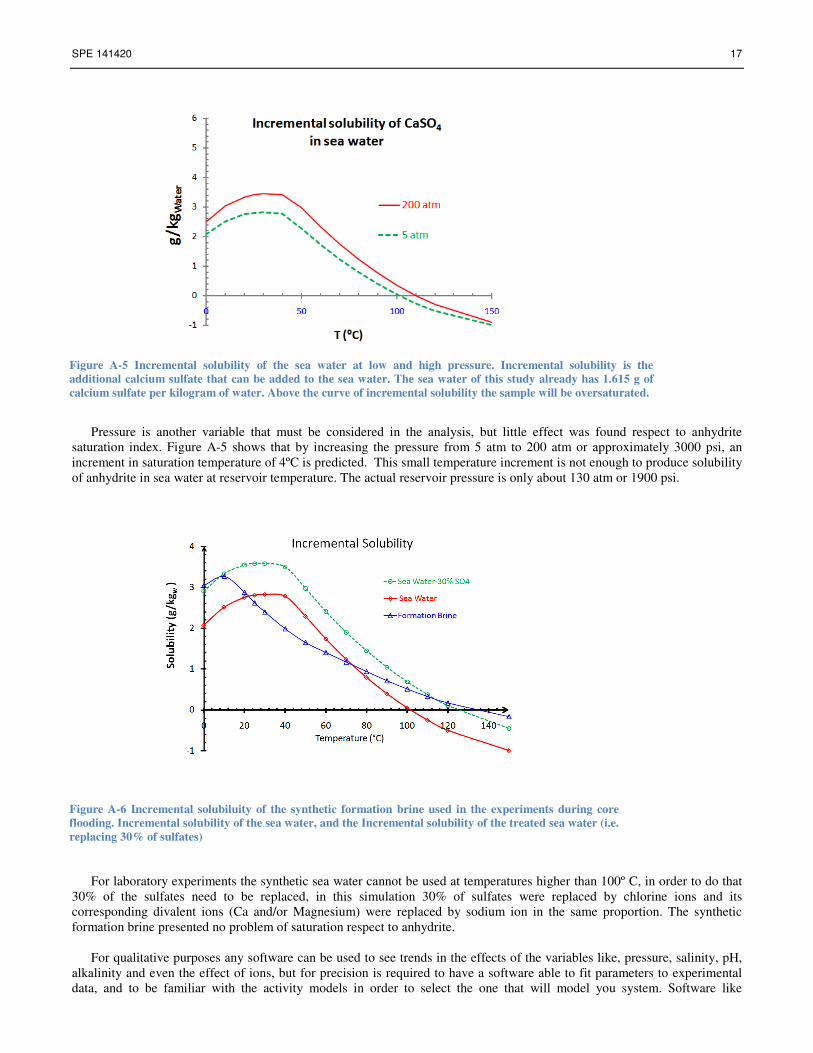
Pressure is another variable that must be considered in the analysis, but little effect was found respect to anhydrite
saturation index. Figure A-5 shows that by increasing the pressure from 5 atm to 200 atm or approximately 3000 psi, an
increment in saturation temperature of 4ºC is predicted. This small temperature increment is not enough to produce solubility
of anhydrite in sea water at reservoir temperature. The actual reservoir pressure is only about 130 atm or 1900 psi.
For laboratory experiments the synthetic sea water cannot be used at temperatures higher than 100º C, in order to do that
30% of the sulfates need to be replaced, in this simulation 30% of sulfates were replaced by chlorine ions and its
corresponding divalent ions (Ca and/or Magnesium) were replaced by sodium ion in the same proportion. The synthetic
formation brine presented no problem of saturation respect to anhydrite.
For qualitative purposes any software can be used to see trends in the effects of the variables like, pressure, salinity, pH,
alkalinity and even the effect of ions, but for precision is required to have a software able to fit parameters to experimental
data, and to be familiar with the activity models in order to select the one that will model you system. Software like
Figure A-6 Incremental solubiluity of the synthetic formation brine used in the experiments during core
flooding. Incremental solubility of the sea water, and the Incremental solubility of the treated sea water (i.e.
replacing 30% of sulfates)
Figure A-5 Incremental solubility of the sea water at low and high pressure. Incremental solubility is the
additional calcium sulfate that can be added to the sea water. The sea water of this study already has 1.615 g of
calcium sulfate per kilogram of water. Above the curve of incremental solubility the sample will be oversaturated.
18 SPE 141420
ScaleSoftPitzer has features that will let you analyze the effect of using scale inhibitors, but is limited for the Pitzer activity
model and was designed for special applications. PHREEQC is a free software and can be modified, but is recommended to
verify the database for the salts and minerals of interest, and it limited by the activity model which is the extended version of
Debye-Hückel that works at low salinity, it also has the database to use the Pitzer model, but its database is limited and can
not predict the concentration of ion pairs with the Pitzer model.
Jose Lopez-Salinas is a Ph D Graduate student in chemical and biomolecular engineering at Rice University. His research
interests include interfacial science, porous media and enhanced oil recovery. He holds MS degree from ITESM Campus
Monterrey, BS degree from Iniversidad Autonoma de Nuevo Leon, Mexico, both in Chemical Engineering. His is faculty at
Monterrey Tec. George J. Hirasaki had 26-year career with Shell Development and Shell Oil Companies before joining the
Chemical Engineering faculty at Rice University in 1993. He was the 1999 recipient of the Society of Core Analysts
Technical Achievement Award, and is a member of the National Academy of Engineers. He holds a BS degree in chemical
engineering from Lamar University and a PhD degree in chemical engineering from Rice University. He received the SPE
Lester Uren Award in 1989, and was named an improved Oil Recovery Pioneer at the 1998 SPE/DOR IOR Symposium.
Clarence A. Miller is Louis Calder Professor Emeritus of Chemical and Biomolecular Engineering at Rice University and a
former chairman of the department. Before coming to Rice University, he taught at Carnegie-Mellon University. He has been
a Visiting Scholar at Cambridge University, the University of Bayreuth (Germany), and the Delft University of Technology
(Netherlands). His research interests center on emulsions, microemulsions, and foams and their applications in detergency
enhanced oil recovery and aquifer remediation. He is coauthor of the book Interfacial Phenomena, the second edition of
which was recently published by CRC Press. He hold BS and PhD degrees from Rice University and the University of
Minnesota, both in chemical engineering.
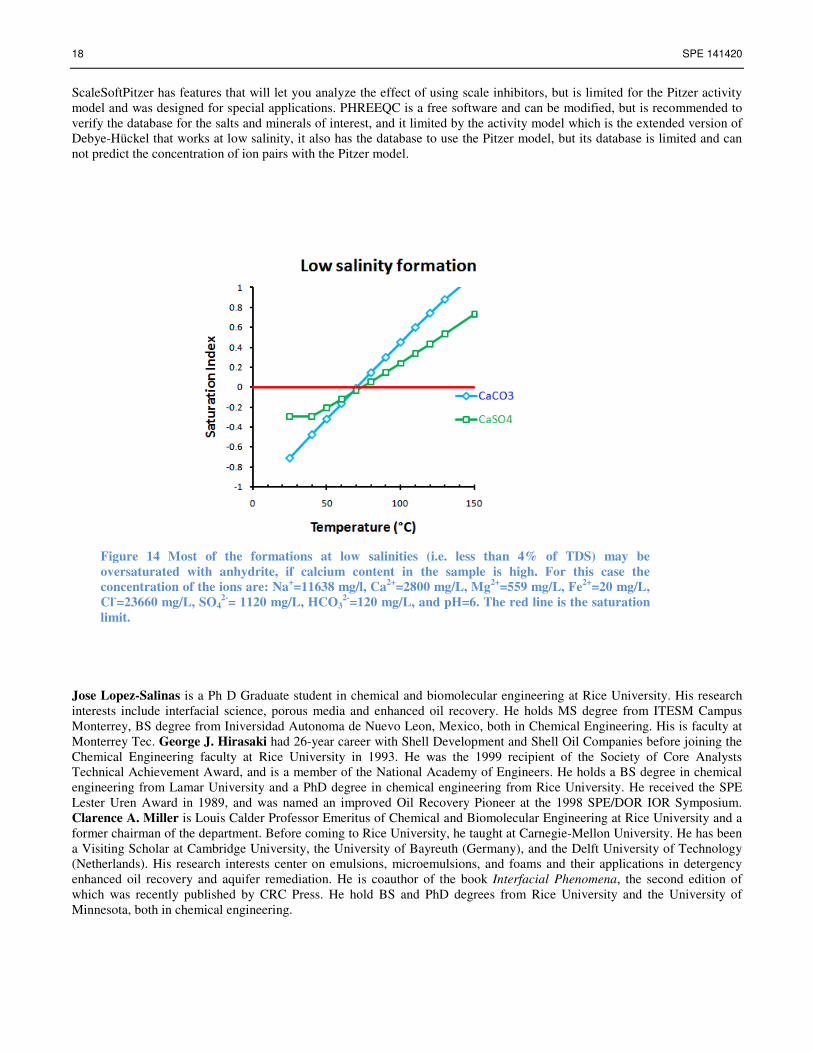
Figure 14 Most of the formations at low salinities (i.e. less than 4% of TDS) may be
oversaturated with anhydrite, if calcium content in the sample is high. For this case the
concentration of the ions are: Na+=11638 mg/l, Ca
2+=2800 mg/L, Mg
2+=559 mg/L, Fe
2+=20 mg/L,
Cl-=23660 mg/L, SO4
2-= 1120 mg/L, HCO3
2-=120 mg/L, and pH=6. The red line is the saturation
limit.