Embed Size (px)
Citation preview

American Mineralogist, Volume 73, pages 775-797, 1988
Hydrothermal phlogopite and anhydrite from the SH2 well, Sabatini Yolcanicdistrict, Latium, Italy: Fluid inclusions and mineral chemistry
H,q.nvnv E. Brr,xrNU.S. Geological Survey, 959 National Center, Reston, Virginia 22092,U.5.4.
Grusnppn Clv.lRnrrr,c,Centro di Studio per la Geologia dell'Italia Centrale del C.N.R., % Dipartimento di
Scienze della Terra, Universitd degli Studi di Roma "La Sapienza," 00185, Roma, Italy
BnNronrro Dn VrvoDipartimento di Geofisica e Vulcanologia, Largo S. Marcellino 10, 80138 Napoli, Italy
Fn-c,NcnscA. TpccnCentro di Studio per la Geologia dell'Italia Centrale del C.N.R., % Dipartimento di
Scienze della Terra, Universitd degli Studi di Roma "La Sapienza," 00185, Roma, Italy
AssrRAcr
The SH2 well(2498.7 m) was drilled vertically in 1982-1983 by an AGIP-ENEL JointVenture as an exploratory hole to assess the geothermal potential of the area north ofBracciano Lake, Latium, Italy, located in the Sabatini volcanic district. Drill-cutting sam-ples from a thermometamorphic-metasomatic zone (1 140-2498.7 m) contain hydrother-mal anhydrite + phlogopite (+ calcite + pyrite) and other authigenic volatile-rich phases.
Microthermometry of primary and secondary two-phase [vapor (V) + liquid (L)] andmultiphase (V + L * crystals) liquid-rich inclusions in anhydrite yields pressure-correctedtemperatures of homogenization (trapping temperatures) that range from 144 to 304'Cand that are generally coincident with measured in-hole temperatures. The fluids have avariable salinity from 0.5 to 14.0 wto/o NaCl equivalent and also contain Ca2+ at least.Rare liquid COr-bearing aqueous inclusions have been verified by laser Raman spectros-copy. Also, rare liquid hydrocarbons(?) have been observed. Clathrates have been observedupon freezing, and crushing studies reveal noncondensable gas at P > I atm in someinclusions. Euhedral to subhedral phlogopite crystals (-0.5 to -2 mm) commonly arezoned and contain solid inclusions ofanhydrite and apatite and two-phase (V * L) andmultiphase (V + L + crystals) fluid inclusions. Microthermometry of primary two-phaseinclusions yields pressure-corrected temperatures of homogenization (trapping tempera-tures) that range from 178 to 298 oC and are also generally coincident with in-hole mea-sured temperatures. Freezing studies show a variable fluid salinity (0.2-7.8 wto/o NaClequiv.); the fluid contains Ca2+ at least. If we assume that the current hydrologic regimeexisted during anhydrite and phlogopite formation, the pressure of formation ranged from- 148 to -220bars for phlogopite (1600--2500 m) and - 120 to -220bars for anhydrite(1300--2500 m). Hence, the phlogopite and other authigenic phases have crystallizedfrom a low P-2, volatile-rich, generally dilute, geothermal solution.
Detailed microprobe analyses of fluid inclusion-bearing phlogopites indicate that theyare nearly end member, Fer/(Fe, + Mg) : 0.02 to 0.1 and the t4tAl per I I oxygen equiv-alents varies from 1.0 to 1.35. F, BaO, and TiO, range from 2.4 to 5.0 wt0/0, 0 to 3.5 wt0/0,and 0.1 to 0.89 wt0/0, respectively, and an Fe2+-F avoidance is observed. Various cationsubstitutional schemes appear to be operative and are assessed. The dark zones are Fe-rich, but may have more or less F, BaO, or TiO, than the light zones. xRF-KEvEx analysisof eight anhydrite samples yield average values (ppm) of Sr: 5500, Ba : 1900, Rb : 250'Ce: 140, and La: 100.
The variation of fluid-inclusion salinities, the phlogopite zoning, and the chemical vari-ation of the anhydrite and phlogopite suggest that different fluids and/or episodic condi-tions were operative in this geothermal system.
0003404x/88/0708-0775$02.00 775

776 BELKIN ET AL.: HYDROTHERMAL PHLOGOPITE AND ANHYDRITE
Fig. l. Location ofthe SH2 well and the general features ofthe Sabatini volcanic district. A : scoria cones; B : explosivecraters; C : caldera rims; D : fault.
INrnolucrroN
The Sabatini volcanic district, located in northern La-tium, Italy, (Fig. l) has recently received considerableattention by the AGIP-ENEL Joint Venture (National Oiland Electricity Boards, respectively; ENEL as operator)for geothermal energy exploration. The initial targetareawas the Cesano-Baccano caldera that has the highest geo-thermal gradient (l0G-150'C/km; Calamai et al., 1975)ofthe region. From 1975 to date, l4 deep wells have beendrilled. Four ofthem produced a hot supersaturated chlo-ride-sulfate brine (200 oC, reservoir conditions) charac-terized by unusually high values of total dissolved salts(up to 400 g/L, postflash; flashing steam estimated to be20-25o/o of total floq Calamai et al., 1975). The difficul-ties inherent with the use ofhot brines for electricity pro-duction have prompted the search for lower-salinity geo-thermal fluids outside the Cesano-Baccano caldera.
The SH2 deep well (2498.7 m) wris drilled vertically in1982-1983 as an exploratory hole to assess the geother-mal potential of the area north of Bracciano Lake (Fig.l). The bottom temperature was 290 oC, but no exploit-able fluids were found (Calamai et al., 1985). Neverthe-less, the pervasive hydrothermal alteration described byCavarretta and Tecce (1987) is convincing evidence thatan extensive hydrothermal system must have existed inthe recent past. Extensive vein and pore-space fillings byhydrothermal minerals have effectively sealed the sys-tem. The lower 1630 m of the SH2 well is characterizedby the hydrothermal assemblage anhydrite + calcite +pyrite plus, at various levels, the addition of K-feldspar,garnet, vesuvianite, apatite, phlogopite, spinel, pyroxene,wollastonite, and the occurrence of uncommon, volatile-rich minerals such as wilkeite, cuspidine, harkerite, can-crinite, and reyerite (Cavarretta and Tecce, I 987). On the
basis of the various minerals recorded throughout theSH2 well, Cavarretta and Tecce (1987) have suggestedthat the ascending hydrothermal solutions were rich inSO, + CO, plus other volatiles (B, HD and that perhapsa shallow Ca-rich fluid was present. They also have de-bated the hypothesis that the brine was, in part, the resultof remobilization of sedimentary (Triassic) sulfates in alow-pressure environment. They have concluded that thehydrothermal solution and heat source was a magma ofpossible trachytic (or less differentiated) composition witha high volatile content that intruded in a subvolcanic en-vironment in the northern Bracciano Lake area.
The study of fluid inclusions in hydrothermal mineralsmay allow an evaluation of the fluid composition, tem-perature, and hydrology at the time of trapping, thus pro-viding information on the evolution of the geothermalsystems (e.g., Browne et al., 1976; Taguchi and Hoyashi,1983; Belkin et al., 1986). We have studied the fluid in-clusions and mineral chemistry of the authigenic assem-blage of anhydrite and phlogopite. Anhydrite is becomingincreasingly recognized as an important physicochemicalindicator in geothermal and mineralized hydrothermalsystems (e.g., Cavarrettaetal., 1982; Queen and Motyka,1984; Hattori et al., 1985). Authigenic phlogopite in geo-thermal or hydrothermal systems is rare; furthermore,fluid-inclusion studies of phlogopite are unknown to theauthors. Therefore, we have also undertaken extensivemicroprobe analyses of the phlogopite mineral chemistryas a function of sample depth and crystal zoning. Phlog-opite reflects the relative fugacities of HF, HCl, 02, H2,and water during crystallization and hence monitors in-tensive variables during hydrothermal processes. The de-tailed characterization of the SH2 authigenic phlogopiteis especially important because we can define its environ-ment of formation in terms of pressure, temperature, andfluid composition. The trace-element chemistry of the au-thigenic anhydrite was also determined in an attempt toprovide additional information on the nature of the co-existing solutions.
Gnor,ocrc sETTTNG
The Sabatini volcanic district is part ofthe perpotassicRoman comagmatic province of Washington (1906) thatborders the eastern Tyrrhenian Sea and is aligned alonga NW-SE tectonic trend. Although the origin of the vol-canic activity is debated, the most current interpretationdefines the tectonic style as postcollisional and the asso-ciated magmatism as subduction related rather than re-sulting from intraplate rifting (e.g., Di Girolamo, 1978;Rogers et al., 1985).
The largest volcano-tectonic structure in the area, analmost square depression, is located near the Braccianovillage and is now a lake (Bracciano Lake). The Sacrofanocenter, a stratovolcanic structure, is the main eruptivecenter (De Rita et al., 1983). Numerous other minor cen-ters (-20) give the areaa"crater-field" morphology. Theiractivity was mainly explosive, producing huge volumesof pyroclastics; lava flows, very subordinate in volume,
BRACCIANO LAKE
r S k m r
XACB
{c/o

BELKIN ET AL.: HYDROTHERMAL PHLOGOPITE AND ANHYDRITE 777
are most abundant in the northern part of the BraccianoLake area. The lake perimeter is characterized by severalrecent minor eruptive centers, such as Trevignano, Vignadi Valle, Polline, and Acquerello.
The oldest dated products of the Sabatini complex arethe 0.6 Ma Morlupo center pyroclastics, whereas theyoungest dated product is the 0.083 Ma Baccano pyro-clastic flow. However, as defined by stratigraphy, the lat-est products were erupted from the Martignano, Le Case,and Stracciacappe centers (Di Filippo et al., 1984).
The composition of products erupted within the Sa-batini volcanic district is considered to be transitionalbetween the mafic Alban Hills leucitites (to the south)and the differentiated Vico and Vulsini suites (to thenorth). The Sabatini lavas have been discussed in detailby Cundari (1979) who showed that the lavas cluster inthe tephritic leucite phonolite and tephritic leucitite fieldsof the Streckeisen "APF" diagram. The compositionalvariations of the lavas are related to crystalJiquid differ-entiation in a subvolcanic Qow-pressure) regime (Cun-dan, r979).
The volcanic rocks lie on a sedimenlary basement whosestratigraphy has been reconstructed by Baldi et al. (197 4)for the northern Roman Region and by Funiciello andParotto (1978), who provided additional data and ex-tended the reconstruction to southern Latium. From theabove studies the stratigraphy of the sedimentary base-ment of the area is as follows: (1) an upper allochthonousflyschoid complex (Late Cretaceous to Oligocene-Mio-cene) that varies from alternating calcarenites, marlylimestones, and clays to alternating calcarenites andquartzo-feldspathic sandstones (200 to 1000 m in thick-ness) and (2) a lower carbonate basal complex (oldestdated as Late Triassic) that consists of marls, marly lime-stones, and limestones with a marly limestone that con-tains alternating dolomitic layers with minor anhydritelayers in the lower section (total thickness of complex canbe 2000 m).
Slvrpr,ns sruDIED
The stratigraphy and hydrothermal mineral distribu-tion of the SH2 well as reported by Cavarretta and Tecce(1987) can be summarized as follows: Above 460 m, thewell penetrated various volcanic products-lava and py-roclastic flows (phonolites, leucitites, and leucitic teph-rites) and volcaniclastic breccias. Chlorite, calcite, andzeolites (mostly phillipsite) are present as glass alterationor newly formed minerals. Below 460 m the well enteredthe allochthonous flyschoid complex, which was signifi-cantly recrystallized below 1070 m. Samples of the so-called "Cicerchina," a facies of the flyschoid complex, aredistinctly present between 1450 and 1560 m. Below 1560m the original rock type is not recogttizable, and the pres-ence of the "carbonate basal complex" is assumed. From1070 m to the bottom of the well at2498.7 m, authigenicminerals are particularly abundant and mark the top ofthe "contact metasomatic complex" defined by the first
20o
24
IIIIIIIIIIIIIIII
I , l lI
l lI
I t l
A
B
G
DCC AN PY KF MU GR VE PH BI CP SP WI CU HA
tion of the major newly formed minerals as
oooE
IFo-ulo
Figa function of depth in the SH2 well from Cavarretta and Tecce(1987). CC : calcite, AN: anhydrite, PY: pyrite, KF: K-feld-spar, MU : K-r'nica and/or sericite, GR : garnet, VE: vesu-vianite, PH : pglogopite, BI : biotite, CP : clinopyroxene, SP: spinel, WI : wilkeite, CU : cuspidine, HA: harkerite. Alsoshown are the four zones as distinguished by Cavarretta andTecce (1987). A: chlorite + zeolite zone; B : K-feldspar agarnet (grandite) + vesuvianite + wilkeite + cuspidine + har-kerite zone; C: vesuvianite + phlogopite zone; D : phlogopite+ pyroxene + spinel zone.
appearance ofgarnet. Figure 2 shows the distribution ofthe major authigenic phases as a function of depth.
Cavarretta and Tecce (1987; see Fig. 2) have definedfour main zones of hydrothermal minerals (calcite isubiquitous below 180 m, as are anhydrite and pyrite
below 870 m): (A) a near-surface chlorite + zeolite do-main in the volcaniclastic units, (B) a K-feldspl + garnet(grandite) + vesuvianite + wilkeite + cuspidine + har-kerite + wollastonite + apatite domain in the top part ofthe "contact metasomatic complex," (C) a vesuvianite tphtogopite domain in the midpart of the same complex,and (D) a phlogopite + pyroxene + spinel + cancrinitedomain in the bottom Part.
All the phlogopite samples and all the anhydrite sam-ples except the core at 2168 m were selected from drill-cuttings. The estimated positional uncertainty of the drill-cutting samples is +2 m.
778 BELKIN ET AL.: HYDROTHERMAL PHLOGOPITE AND ANHYDRITE
2Oum-
n -
Y
l O u m- B
'"E
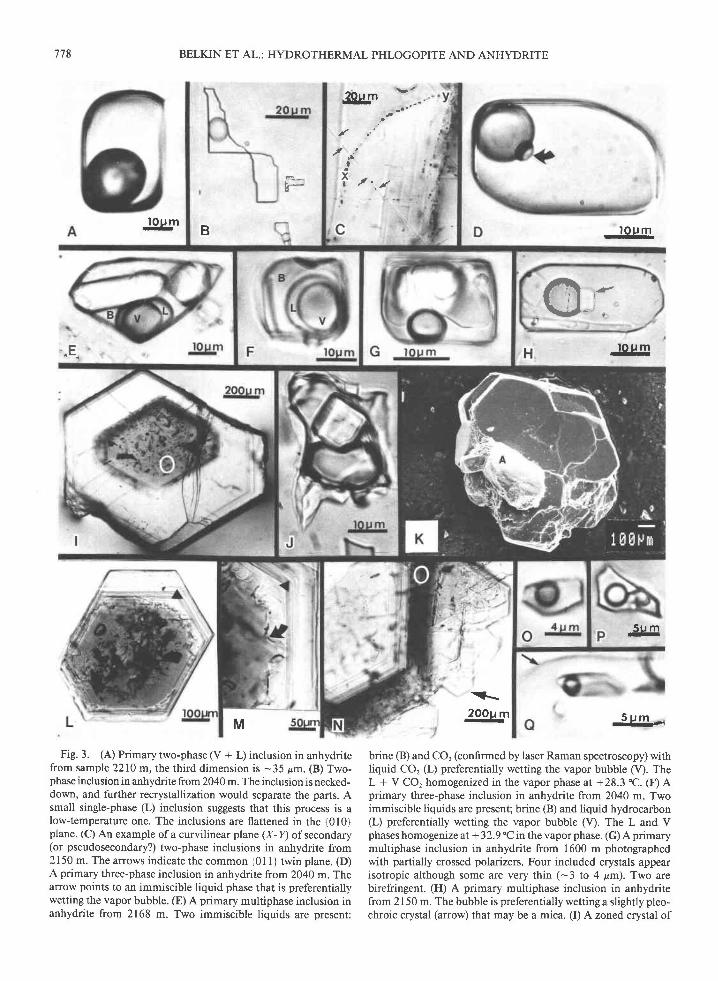
Fig. 3. (A) Primary two-phase (V + L) inclusion in anhydritefrom sample 2210 m, the third dimension is -35 pm. (B) Two-phase inclusion in anhydrite from 2040 m. The inclusion is necked-down, and further recrystallization would separate the parts. Asmall single-phase (L) inclusion suggests that this process is alow-temperature one. The inclusions are flattened in the {010}plane. (C) An example of a curvilinear plane (X-Y) of secondary(or pseudosecondary) two-phase inclusions in anhydrite from21 50 m. The arrows indicate the common {0 I I } twin plane. (D)A primary three-phase inclusion in anhydrite from 2040 m. Thearrow points to an immiscible liquid phase that is preferentiallywetting the vapor bubble. (E) A primary multiphase inclusion inanhydrite from 2168 m. Two immiscible liquids are present:
l o u m-
-lg,g.s
5 u m-
-..2OOu m- -8 E!."*
brine (B) and CO, (confirmed by laser Raman spectroscopy) withliquid CO. (L) preferentially wetting the vapor bubble (V). TheL + V CO, homogenized in the vapor phase at +28.3 'C. (F) Aprimary three-phase inclusion in anhydrite from 2040 m. Twoimmiscible liquids are present; brine (B) and liquid hydrocarbon(L) preferentially wetting the vapor bubble (V). The L and Vphases homogenize at + 32.9 "C in the vapor phase. (G) A primarymultiphase inclusion in anhydrite from 1600 m photographedwith partially crossed polarizers. Four included crystals appearisotropic although some are very thin (-3 to 4 pm). Two arebirefringent. (H) A primary multiphase inclusion in anhydritefrom 2l 50 m. The bubble is preferentially wetting a slightly pleo-chroic crystal (arrow) that may be a mica. (I) A zoned crystal of
I' l r - . ,
M
0":

The anhydrite and associated calcite, when observedin core, occupy common vein and pore-space fillings.Phlogopite occurs intergrown with anhydrite (Fig. 3K) inboth core and drill-cuttings. The evidence for the hydro-thermal origin ofphlogopite is based on this textural re-lationship and the fluid-inclusion and chemical data dis-cussed below.
Fr-urn TNCLUSToNS
Fluid inclusions have been studied in hydrothermallyformed anhydrite and phlogopite throughout the SH2 deepwell in order to better understand the physicochemicalcharacteristics of the fluid at the time of trapping, its or-igin, and possible evolution. Although fluid inclusionswere observed in other authigenic phases, only in phlog-opite and especially anhydrite was their abundance anddistribution sufficient for a systematic study. In three casesthe temperature of homogenization was determined forprimary fluid inclusions in apatite crystals trapped inphlogopite crystals.
Fluid inclusions in micas have been rarely studied(Roedder, 1984). However, Pom6rleanu and Sabliovschi(1980) reported primary fluid inclusions in muscovite withtemperatures of homogenization (In) that vary ftom220to 600 "C. Trapping of fluid as a result of twinning ongrowth boundaries (twinning sutures) during fluorphlog-opite synthesis has also been noted by Kozlova et al.( l 984).
Methods
Microthermometry was performed with a USGS design andcrurxvpca heating and freezing stages at the University of Romeand the U.S. Geological Survey, Reston. The stages were inde-pendently calibrated using organic and inorganic compounds asdescribed by Roedder (1984). The instrumental uncertainty wasestimated to be - +0.1 'C in the range of the final melting pointof ice (7.) and - +2.0 "C in the heating mode. The samples wereheated only once to avoid spurious measurements that might bedue to possible stretching or decrepitation.
Unpolished broken fragrnents (l-3 mm) of anhydrite crystalsand small (0.5-2 mm) euhedral to subhedral phlogopite crystalswere used. This lack of sample preparation (i.e., no doubly-pol-ished plates) undoubtedly helped preserve fluid inclusions thatotherwise might have been removed or partially decrepitated.
779
We judge that sample preparation probably would have decrep-itated or partially decrepitated all fluid inclusions in phlogopite.
The crushing-stage technique (Roedder, 1970) was used onanhydrite in order to obtain a qualitative estimate of the pres-ence and composition of noncondensable gases. The crushingmedia was immersion oil or an aqueous alkaline BaCl, solution.
Description of fluid inclusions in anhydrite
Three different inclusion types were distinguished. TypeA inclusions (Fig. 3,{) are two-phase (L + \4liquid-rich
aqueous inclusions with variable salinity. These are themost common and were used for the heating and freezingmeasurements. Type A inclusions are both primary andsecondary (pseudosecondary?). Primary type A inclusions(Fig. 3A,) typically are larger than secondary type A in-clusions and have an equant shape. Type A secondary(pseudosecondary) inclusions (Fig. 3C) commonly oc-cupy curvilinear planes, are smaller, and tend to be flat-tened in the (010) plane. The correspondence betweenmicrothermometric data (see below) of the primary andsecondary type A inclusions suggests that the latter maybe pseudosecondary, but we have no supporting petro-graphic evidence.
Type B inclusions are monophase, either liquid or va-por, primary or secondary inclusions. Occasionally, weobserve these inclusions to be the result of a necking-down process. Figure 38 shows that the necking-downprocess can produce monophase liquid inclusions. Neck-ing can also produce monophase vapor inclusions. How-ever, we also observe isolated monophase vapor inclu-sions. Crushing experiments (see below) have revealedthe presence ofnoncondensable gases at pressures greaterthan 1 atm. Fracturing induced by the drilling processcould produce monophase vapor inclusions that arecaused by the expansion of gases during decompressionon ascent with the resultant expulsion of liquid.
Type C inclusions are primary, multiphase, and liquid-rich. Inclusions of this type are uncommon, and theirassemblages are varied. The most common type C assem-blage (Fig. 3G and 3H) comprises vapor, liquid, plus oneor more crystal phases. The crystal phases are birefringentor nonbirefringent and euhedral to anhedral. In a few
BELKIN ET AL.: HYDROTHERMAL PHLOGOPITE AND ANHYDRITE
phlogopite frorn 2210 m. The core contains numerous fluid in-clusions (one in white oval, shown in Fig. 3J) and is separatedfrom a relatively inclusion-free zone by a sharp boundary. (J) Aprimary three-phase inclusion from the core of a phlogopite crys-tal (white oval, Fig. 3I). The included crystal is birefringent andappears to be anhydrite. (K) A crystal of phlogopite, imaged insecondary-electron emission by a JEoL JMs-84osev, from 2210 m.A crystal of anhydrite (A) identified by snr"r energy-dispersiveanalysis is partially enclosed by the phlogopite crystal. (L) Azoned crystal of phlogopite with a darker, inclusion-rich coreseparated from the lighter outer portion by an irregularly scal-loped dissolution boundary. (M) An enlargement of an area fromFig. 3L; the solid triangle is in the same location in both Fig. 3L
and Fig. 3M. The details of the scalloped dissolution boundary(arrow) are shown. (N) A zoned crystal of phlogopite from 2210m. The upper left is a portion of the lighter-colored core. This isenclosed by a darker-colored zone (white oval) that is in turnsurrounded by a faceted irregular rim (arrow). The darker zoneis inclusion-rich although the inner core also contains both solidand fluid inclusions. (O) A primary two-phase inclusion from thedark zone of Fig. 3N (white oval). (P) A primary multiphaseinclusion from the dark zone of Fig. 3N (white oval). (Q) Aprimary two-phase inclusion in a corroded apatite needle fromthe core of Fig. 3N. The arrow points to the curved phlogopite-apatite boundary with the arrow on the phlogopite side.

780 BELKIN ET AL.: HYDROTHERMAL PHLOGOPITE AND ANHYDRITE
cases we can identify these crystal phases as daughtercrystals (Roedder, 1984).
An uncommon type C assemblage (Figs. 3D and 3F)comprises two immiscible liquids plus vapor. Some ofthese multiphase inclusions were identified as containingliquid COr, and others, liquid hydrocarbon(?). Figure 3Dshows a small globule preferentially wetting the vaporbubble. This phenomenon was observed in a group ofprimary inclusions, which suggests that this is a primaryfluid component and not the result of later contamination(e.g., drilling fluids). Figure 3F shows a similar assem-blage. This inclusion did not appear to absorb infrared,and the vapor and adjacent liquid phase homogenized at+32.9 "C in the vapor phase. This suggests that it is notvapor and liquid COr. However, some type C inclusionscontain immiscible fluids that appear to be liquid andvapor CO, (confirmed by laser Raman spectroscopy, seebelow). Figure 3E shows an inclusion where the vaporand adjacent liquid homogenized at +28.3 oC and wasan excellent absorber ofinfrared and hence is presumedto be COr. Figure 3E also shows the presence of solidphases that are probably accidentally trapped crystals.
Figure 3H shows a solid phase (daughter?) that is pref-erentially wetted on its apparent basal surface by the va-por bubble. This phenomenon is similar to that describedby Roedder (1984) and Belkin et al. (1985) for mica.
Description of fluid inclusions in phlogopite
Two different types of fluid inclusions were observedin phlogopite . Type A inclusions (Fig. 30) are two-phase(L + V), liquid-rich, and aqueous. Both primary and sec-ondary (pseudosecondary?) type A inclusions were rec-ognized. The primary inclusions were most commonlyfound in the darker phlogopite zones (Fig. 3N) and wereusually isolated. We believe they are primary on the basisofthe following criteria: (l) they are always concentratedin the darker zones regardless of the sequence of zoning(e.g., dark rim and light core or light rim and dark core);we do not believe that the dark-zone preference that thefluid inclusions show is the result of a difference in sol-ubility between the light and dark zones acting on a heal-ing fracture (Roedder, 1969), and (2) they sometimes oc-cur along with solid inclusions outlining growth planes,as distinguished by color zoning.
Only the small (<35 pm) inclusions were usable forheating and freezing measurements. Larger inclusions ob-viously leaked as also did some small ones. Secondary(pseudosecondary?) type A inclusions were distributedalong healed fractures parallel to (001) that cut acrosszonrng.
Type B inclusions (Figs. 3J and 3P) are multiphase (L *V + solid), liquid-rich, and aqueous with one or morebirefringent or nonbirefringent, euhedral to anhedral sol-id phases. Most trapped crystals were isolated occur-rences and did not melt during heating; hence they areprobably accidentally trapped crystals. In a few cases,groups of type B inclusions were observed, all containingthe same solid and fluid phase assemblages and propor-
tions relative to the inclusion volume. Although thesecrystals were only partially melted at vapor-liquid ho-mogenization, they are considered to be daughter crys-tals. Many large (>50 pm) inclusions contained crystalsbut decrepitated upon heating. In many cases the crystalsappeared to be cubic and hence looked like halite (Fig.3J), but all were birefringent and probably are anhydrite.
We did not observe any inclusions with two immiscibleliquids in phlogopite . Furthermore, we recognize that thepopulation of inclusions on which we obtained heatingand freezing data are biased. We observed that many in-clusions in anhydrite, when crushed, yielded gas underpressure greater than I atm. We also noticed that manyfluid inclusions in phlogopite, even small ones, decrep-itated along the weak (001) cleavage when heated. Thisbiases the data toward those inclusions containing smallamounts of(or no) noncondensable gases.
Small, usually corroded, elongate crystals of apatite werecommonly observed in the phlogopites. They were iden-tified as apatite by optical properties and by sEM energy-dispersive analysis on exposed crystals. In three cases theapatite crystals contained primary type A fluid inclusions(Fig. 3Q) that were amenable to vapor-liquid homoge-nization measurement.
MrcnorrmnMoMETRY RESULTS
Pressure correction
A pressure correction (Potter, 1977) appropriate for theestimated trapping pressure and salinity was applied toall the Tn data subsequently discussed. The correctionwas calculated with the following assumptions: (l) thepresent water table of - 50 m existed at the time of trap-ping, (2) the pressure was hydrostatic, and (3) the thermalgradient at the time of trapping was similar to the onenow present in the well. A step-wise integration of theliquid densities from Keenan et al. (1969) and Potter andBrown (1977) was used with the water P-T data fromFisher (1976). The correction for both phlogopite andanhydrite Tndata ranged from *8 to +14 "C. Thus, thedata presented on Figures 4 and 6 are trapping temper-atures (I,).
Anhydrite microthermometry data
To observe any phase changes upon warming, I 88 pri-mary and 28 secondary type A and C inclusions werefrozen (Fig. 5), and 276 pimary and 67 secondary typeA and C inclusions were heated to vapor-liquid homog-enization (Fig. a).
On warming frozen inclusions, the eutectic tempera-ture (2") of the phase assemblage was detectable; how-ever, the small size or poor optical quality of the inclu-sions prevented this observation in most inclusions. Whenobserved, most f values were - -27 "C although a fewranged from -25 "C to -20'C. In two cases we observed7. to be - -50 "C. Although the fluid composition prob-ably lies in the system containing Ca and Na with 7"" :-52"C (Crawford, l98l), apparently the Ca species is at

BELKIN ET AL.: HYDROTHERMAL PHLOGOPITE AND ANHYDRITE 781
? 2oooooE
-o-22OOot
2400
1 300
F
140 160 220 240 260 280 300 220
trapping
Fig. 4. The temperature of trapping (7,) data for primary andsecondary fluid inclusions in SH2 anhydrite as a function ofsample depth (m). The Tndata have been pressure corrected asdescribed in the text. Also shown are the measured in-hole tem-peratures, and the boiling-point curve (BPC) for pure water (Haas,1971) adjusted for a water table of -50 m. Samples from 1990,
240 260 240 260 2AO 300 320 340
temperature ("C)
2168, and 22IO m have been offset to the right to avoid overlap.The in-hole temperatures were measured in stabilized conditionsto minimize the effect of external interferences. The uncertaintyin the in-hole temperature measurement is + l-2 "C in the range
140-200'C and t2-5'C in the range 200-300'C.
such a low concentration that the Z" melting at low tem-perature (- - 50 'C) was insufrcient to observe routinely.
Upon further warming, the temperature of the lastmelting of ice (Z* ice) was generally observable. Valuesfor I- ice (vapor-present) for primary inclusions rangedfrom -0.3 to -10.0'C with most between -0.3 and-3.0 .C. We have recast the Z- ice data into weight per-cent NaCl equivalent assuming the dominance of NaClas the dissolved species. Figure 5 shows the intra- andintersample variability of the salinity data. The salinityranges from -0.5 to 14 wto/o NaCl equivalent. Uponfreezing, a few two-phase (L + V) inclusions yielded asolid that persisted above 0.0 "C. The melting point ofthese presumed gas clathrates ranged from + l. 5 5 to + 20.0"C. Since CO, clathrates are unstable above -+10 'C
(Collins, 1979), the higher I- ice values indicate thatother gases (hydrocarbons) must be present. Clathrateformation was recognized from all sample depths. How-ever, CO, as a solute can depress the freezing point by amaximum of - 1.48 'C without forming clathrate (Hed-enquist and Henley, 1985). Hence, we cannot distinguishbetween the effects of dissolved salts or CO, in some low-salinity inclusions in anhydrite and phlogopite.
A small number of secondary inclusions were frozenand yielded Z- ice that ranged from -0.4 to -3.9 "C.The salinity for these inclusions ranged from 0.7 to 6.3wto/o NaCl equivalent.
All primary and secondary type A inclusions homog-
enized to a fluid by the disappearance ofthe vapor phase
upon heating. The 7, values of primary and secondarytype A inclusions were similar except for a sample from2410 m where the secondary inclusions had Z, values-20 "C less than the average for primary inclusions. The
f, values for primary type A inclusions ranged from - 140
"c at I 300 m to - 320 "C at 2490 m.Heating type C inclusions revealed that some included
crystals dissolve below vapor-liquid homogenization andsome remained unaffected.
Figure 4 shows that the mode of all the pressure-cor-
rected ?"n data for each sample except for those from 2410m falls within + l0 "C of the measured in-hole tempera-ture. This agreement is very good considering the limi-
tations and assumptions of the data.
Phlogopite microthermometry data
Ninety primary type A and B inclusions were heatedto vaporJiquid homogenization (Fig. 6), and 79 were fro-zen to observe any phase changes upon warming (Fig. 7).
After freezing, the inclusions were slowly warmed in anattempt to determinate 2". The 7" was -45 ! 5 .C butwas difficult to observe at best. The determination of Z-ice was easier because of better resolution of the remain-ing ice crystals. In only one inclusion from sample 2480m was evidence of clathrate ice (2. : +9 'C) observed.Figure 7 shows the T^ice data recast into weight percent
NaCl equivalent. The salinity ranged from 0.2 to 7.8 wto/o

782 BELKIN ET AL.: HYDROTHERMAL PHLOGOPITE AND ANHYDRITE
1300 ru
anhydr i te
o primary
. secondary
oooE-co.o
!t
H -. H F - - n -
2100
o 4 8 1 2wt% NaGl equivalent
Fig. 5. The salinity (wto/o NaCl equivalent) data for primaryand secondary fluid inclusions in SH2 anhydrite as a function ofsample depth (m).
NaCl equivalent with a considerable scatter and was sim-ilar to that shown by the anhydrite data.
Type A and type B inclusions were heated, and all ho-mogenization to fluid was by the disappearance of thevapor phase. Over 500/o of the heated inclusions decrep-itated before vapor-liquid homogenization. This suggeststhe presence of dissolved gases. No included crystals wereseen to melt before vapor-liquid homogenization, al-though one group became noticeably rounded.
f,, ranged from 178 "C at 1600 m to 298 .C at 2480 m.Figure 6 shows that although the data are limited, thereis a definite increase of Z, with depth. Three two-phaseprimary fluid inclusions in apatite (Fig. 3Q) homogenizedto liquid at 250 'C from sample 2210 m. This tempera-ture is similar to that of the inclusions in the host phlog-opite .
CnusnrNc n,q.Ta
Selected anhydrite crystals from all samples werecrushed in oil. The good cleavage of anhydrite and themode of occurrence of the fluid inclusions in groups madethis technique difficult. Evolution of gas, at a pressuregreater than atmospheric, was noted in all samples butonly in some inclusions. The vapor bubbles expandedvarious amounts from just filling the inclusion volume toevolving bubbles into the crushing medium. This was
oooE
E
cto!t
2000
2200
160 180 200 220 240 260 2AO 300
trapping temperature ("G)
Fig. 6. The temperature of trapping (I".) data for primary fluidinclusions in SH2 phlogopite as a function of sample depth (m).The 7n data have been pressure corrected as described in thetext. Also shown are the measured in-hole temperatures. Thesample from 2210 m has been ofset to avoid overlap.
observed in both primary and secondary inclusions. Afew crushing runs in an alkaline BaCl, solution revealedthe faint presence of a white precipitate (BaCOr) aftersudden bubble collapse, confirming the presence of CO,as a volatile componenl.
Llsrn R.LMlN spEcrRoscopy
Limited laser Raman spectroscopic analyses were per-formed on one multiphase (Fig. 3E) and six two-phaseinclusions in anhydrite. The technique used was similarto that described by Dhamelincourt et al. (1979). Theanalyses confirm the presence of CO, in the multiphaseinclusion and indicate the absence of noncondensablegases (CO2, H2S, CO, and Nr) in the six two-phase inclu-sions. This latter result supports the observations, madeby crushing and petrography, of a variable presence ofnoncondensable gases in the fluid inclusions of the SH2anhydrites.
Prrr,ocoprrr MINERAL CHEMISTRy
Analytical method
Small (0.5-2 mm) euhedral to subhedral phlogopite crystalswere handpicked, where present, from the drill-cuttings. Onlythose crystals that contained primary fluid inclusions were se-lected. A standard petrographic slide was frosted on one sidewith 800 grit AlrO3 abrasive and then cleaned and dried. A verythin layer of clear epoxy (e.g., Devcon 2-Ton) was applied withthe edge of a razor blade. Under a low-power binocular micro-
2400

BELKIN ET AL.: HYDROTHERMAL PHLOGOPITE AND ANHYDRITE 783
1600 H n PhlosoPite
H F- H - HE E F H H
1 5
1 . 4
1800
2400
0 4 8wt% NaCl equivalent
Fig. 7. The salinity (wto/o NaCl equivalent) data for primaryfluid inclusions in SH2 phlogopite as a function of sample depth(m) .
scope, the separated crystals were arranged in a recorded pattern,then set aside for the epoxy to cure (l h). The epoxy must beexceedingly thin in order to allow the single crystals to be gentlypushed against the slide without the epoxy flowing up and overtheir top surfaces. After curing, cleaning, and C-coating, the crys-tals were examined with reflected-light optics to distinguish thoseareas on the (001) surface that were perfectly flat, smooth, andsuitable for electron-microprobe analysis.
The phlogopite crystals are commonly zoned when viewedperpendicular to (001). Any analysis from any other direction ina zoned crystal would give values that may or may not be mean-ingful in terms of the systematic element distribution of the zon-1ng.
An anr--serraq electron microprobe with four fixed and fourdriven spectrometers was used for wavelength-dispersive anal-ysis. Operating conditions were 15-kV voltage and a 0.l-pA beamcurrent. Standardization was done before each analytical sessionon silicates of known composition, similar structure, and ele-ment abundances similar to those anticipated in the phlogopites.Selected representative analyses are given in Table l. Table Ialso gives the standard deviation (lo) and the detection limitassociated with each element. The count data were reduced on-line by a Bence-Albee scheme as adapted by McGee (1983). Thebackground interpolation method of M. Mangan (pers. comm.,I 985) was used. Each analysis reported in Table I represents theaverage of 3 to 9 individual analyses on different l0-pm beamspots. Phlogopite analyses of crystals from any given samplewere always run during different analytical sessions to avoid anysystematic error associated with any one analytical sesslon.
The crystallography of a phlogopite crystal from 2210 m was
o o.o2 0.04 0.06 0.08^'ld:3:':?;t=""'", Fel(Fe+Ms) + ANNTTE
Fig. 8. Variation of the phlogopite composition from the SH2well as a function of two coupled substitutions (based on an I I -
oxygen-equivalent normalization). The abscissa shows the sub-stitution Mg'* = Fe'?+, phlogopite to annite, as expressed by Fel(Fe + Mg), Fe : total Fe by microprobe. The ordinate showsthe substitutiotr tetlMr*) 1 t+t(gir+) = t6l(A13+) + I4r(Al3+) as ex-pressed by the variation in totAl per formula unit (pfu). All thephlogopite data presented in Figs. 8-10 and 12-16 represent thecomplete population of microprobe analyses (Table l). The lightand dark zones in single crystals are plotted as separate points.
Only in Fig. 9 are these points paired and marked with respectto their relative color.
determined by the precession technique, and the results are given
in Appendix 1.
Norrnalization procedure
Microprobe analysis cannot distinguish bewteen Fe2+ and Fe3+,and the HrO in hydrous silicates is not determined. We haveused the program and normalization scheme ofFlohr (1983) thatinvolves normalization to I I oxygen equivalents, i.e., total cat-ion charge : 22. We have assumed that no Fer+ is present.
Hence, all Fe discussed subsequently is total Fe expressed asFeO. Table I gives the formula proportions using the abovescheme. The OH was calculated by the method of Flohr (1983),assuming a full OH-site occupancy. We have also assumed thatthe substitution of O'- for (OH) does not occur. The cationsare assigned to crystallographic sites for the stoichiometry (lt'?E,
Na, Ca, K Ba) (Fe, Mg, Mn,161Al, Ti,16r !)3 (4rAl, Si)oO'o (OH,F,Cl),
(! : vacancy). The vacancies are then calculated by difference'
Results
The SH2 phlogopite have nearly end-member com-positions, with average Fe/(Fe + Mg) : 0.05, and vary
in composition by two major cation substitution schemes.
First, all the analyses are enriched in A1rO., save two,
compared to phlogopite-annite. The dominant mecha-
nism causing Al enrichment in biotite involves the Al-
Tschermak's substitution
r61(M2+) 4 r+r($ia+) = 16r(413+) 1tot1Al3*).
Figure 8 shows the variance sf tet(lvlz+) utt6 tollAl3*).
The values range from 1.0 to 1.35 t4rAl per ll oxygens.
The other cation substitution involves Mg'* + Fe2+; thephlogopite component ranges from 90 to 980/0. Figure 9
shows the variance of Mg with Fe, and the data show a
i r . scit "? , . ,
1 . Ood!
6 2O0OE
.cCLoE
2200
X 1 6OOmO 2 l goma 2 2 1 O m
x
o {^'
ls",
O io tar . . . t iJ t^ :

784 BELKIN ET AL.: HYDROTHERMAL PHLOGOPITE AND ANHYDRITE
TnaLe 1. Representative microprobe analyses of zoned and unzoned phlogopites from the SH2 well
+ c ounzoned unzoned unzoned
2unzoneo
1 2 3 4zoned unzoned unzoned unzoned
light core
'I
unzoneo
o
3zoneo
light core
o
Depth (m):
Sample:Description:
Number ofanaryses:
sio,AlrosFeOMgo
NaroKrOTio,MnOBaOclF
Sum- C l = O- F = O
SumH,O (calc)-
Sum
Sir4tAl
T siter6jAlFer*MgTiMn
M site
NAKBa
A site> cations
FclOH (calc ).
SumFel(Fe + Mg)F(F + OH)
40.1015 932.08
26.1 In.o.0 .10
10.360 0 80 1 01 1 40.263.35
99.690.071 . 4 1
98.21261
100.82
2.8181.1824.0000.1 380.1222.7430.0040.0063 0140.0000 0 1 40.9290.0310.9747.9880.7450.0311.2242.0000.0430.373
41.3413.370.99
26.82n.d.0.07
10.040 . 1 60.041.520.19J . C O
97.910.051 .50
vo.rtc
2.4698.82
2.9511.0494.0000.0590.0592.8530.0090.0022s820.0000.0100.9140.0430.9667.9480.8040.0231 .1732.0000.0200.402
36 13 41.44 38.061 8.57 13.79 17.001 .73 2.09 1.44
23.89 25.s9 25.12n.d. n.d. n.d.0 .10 0 .10 0 .109.23 10.10 9.660 .36 0 .16 0 .170.08 0.09 0.073.81 1.02 2.52n.d n.d. n d.2.95 3.46 3.32
96.85 97 84 97.820.00 0.00 0.001 .24 1 .46 1 .40
95.61 96.38 96.062.70 2.57 2.58
98.30 98.95 98.64
Cations calculated on the basis of 1 1 oxygen equivalents, total Fe as FeO2.645 2.952 2.7471355 1 .048 1 .2534 000 4.000 4.0000.248 0 .110 0 .1940.106 0.125 0.0872.607 2.717 2.7020.020 0.009 0.0090.005 0.005 0.0042.985 2.965 2.9960.000 0.000 0.0000.01 4 0.014 0.0140 862 0.918 0 8900.109 0 028 0.0710.985 0.961 0.9767.971 7.925 7.9700.683 0.780 0.7580.000 0.000 0.0001.317 1.220 1.2422.000 2.000 2.0000.039 0.044 0.0310.343 0.390 0.379
40.73 40.78 40.7613.31 14 .59 13 .881 . 2 1 1 . 2 5 1 . 1 9
26.54 26.57 26.75n.d. 0.03 n.d.0.09 0.08 0.09
10.12 9.92 10.040.15 0 .16 0 .200.04 0.04 0.051.38 1 .46 1 .01n.d . n .d . 0 .194.21 3.90 3.90
97.78 98.78 98.060.00 0.00 0.051.77 1 .64 1 .64
96.00 97.14 96.372j7 2.38 2.30
98.17 99.52 98.67
2.930 2.889 2.9081 .070 1 .1 11 1 .0924.000 4.000 4.0000.059 0.107 0.0760.073 0.074 0.0712.845 2.805 2.8440.008 0.009 0.0110.002 0.002 0.0032.988 2.997 3.0050.000 0.002 0.0000.013 0 .011 0 .0120.929 0.896 0.9140.039 0.041 0.0280.980 0.950 0.9547.968 7.947 7.9590.958 0.874 0.8800.000 0.000 0.0231.042 1.126 1 .0972.000 2.000 2.0000.025 0.026 0.0240.479 0.437 0.440
38.93 39.6213.60 14.200.99 1 .17
26.79 27.61n.d. n.d.0.09 0.089.64 10.260.1 5 0 .15n.d. 0.042.01 2 .11n.d. n.d.3.69 3.87
95.89 99.110.00 0.001.55 1 .63
94.34 97.482.34 2.37
96.67 99.85
2.856 2.8261.144 1 .1744.000 4.0000.032 0.0210.061 0.0702.929 2.9350.008 0.0080.000 0.0023.030 3.0360.000 0 0000.013 0.01 10.902 0.9340.058 0.0590.974 1.0048.002 8.0400.856 0.8730.000 0.0001.144 1 .1272.000 2.0000.020 0.0230.428 0.436
Notei The standard deviations (1o, wt7") for 3 to 9 individual analyses are SiO, : 0.52, Al,Oo: 0.43, FeO : 0.20, MgO = 0.47, QaO: 0.01, NazO :001 ,K ,O :0 .19 ,T iO , : 0 .04 ,MnO:0 .02 ,BaO:0 .15 ,andF :02 l .Theave ragede tec t i on l im i t s (w t%) fo r t hem ic rop robecon f i gu ra t i onuseda reS iO , : 0 . 05 , ALO. : 0 .03 , FeO: 0 .06 , MgO: 0 .04 , CaO :0 .03 , Na "O : 0 . 02 , K ,O : 0 .04 , T iO , : 0 .04 , MnO: 0 .04 , BaO:0 .11 , C l : 0 . 10 , andF : 0.08. n.d. : not detected.
. H2O calculation is based on the assumption of full OH site occupancy (OH : 2.00 - F - Cl) and is only used as a check on analysis sums.
good agreement for the substitution Mgz+ -. Fe2+. Figurel0 shows the variation of Fe/(Fe + Mg) with sampledepth. From 1600 m to 2190 m there is a slight decreasein Fe/(Fe + Mg), then the average ratio increases. Thispicture is complicatedby thefaclthalzoning also becomesmore prevalent at depths below 2210 m.
Other elements analyzed for are Mn, Ti, K, Ba, Ca, N4Cl, and F. The MnO contents vary from below the de-tection limit to 0.26 wto/o. However, it clearly varies bythe substitution 2 Mgz+ + Fe2+ * Mn2+ (e.g., Fig. I l).
CaO was usually below the detection limit. NarO wasalways minor and varies from near the detection limit to0. 19 wt0/0. Cl was always at or below the detection limit.Volfinger et al. (1985) indicated that rhe Cl content of
phlogopite is one-twentieth that of biotites. The dimen-sion of the (OH,CI) site, hence its occupancy, is mainlycontrolledby the rotation angle (cy) ofthe tetrahedra, whichis a direct function of the XF" in the biotite. Four phlog-opite crystals were analyzed for CrrOr. The CrrO, contentwas found to be at or below the detection limit (0.03 wto/o).Ti, K, Ba, and F variations are discussed below.
Phlogopite color and zoning. The SH2 phlogopites, whenviewed perpendicular to (001), display variation in colorfrom colorless to very dark green, which is in part a func-tion of crystal thickness. Very striking, especially in small(-2 mm) euhedral to subhedral crystals, is a simple butsharp light and dark zoning (Fig. 3I). As either the coreor the rim can be light or dark, the color is probably a

BELKIN ET AL.: HYDROTHERMAL PHLOGOPITE AND ANHYDRITE 785
TABLE 1-Continued
22107
zoneolight rim
3
6zoned
light rim
o
4 5zoned zoned
light rim light rim
1 1 2zoned zoned zoned
light rim dark core dark rim
2 3zoned zoned
light core dark core
5zoneo
dark core
3
zoneddark core
3
zoneodark core
e
39.99 40.0014.60 15 041.07 3.52
28.42 26.38n.d. n.d0.05 0.049.99 10.170.13 0.28n.d . 0 .111.45 0.27n.d. n.d.4.42 3.73
100.12 99.540.00 0.001 8 6 1 . 5 7
98 26 97.972.16 2 .48
100.42 100.45
2.816 2.8201 .184 1 .1804.000 4.000o 027 0.0710.063 0.2082.982 2.7720.007 0.0150.000 0.0073.079 3.0720.000 0.0000 007 0.0050.897 0.9150.040 0.0070.944 0.928LO24 8.0000 984 0.8320.000 0.0001 . 0 1 6 1 1 6 82.000 2.0000.021 0.0700.492 0.416
38.80 40.96 39.84 38.0414.43 11.83 13.73 15.021 .36 3.38 1.47 4.74
27 .41 26.78 27.29 24.18n.d. n.d. n.d. n.d.0.08 0.08 0.07 0.07
1 0.43 1 1 .01 10.70 1 0.450.23 0.15 0.19 0.530.06 0.26 0.05 0.101 . 6 7 0 . 1 3 1 . 1 3 1 . 1 2n.d. n.d. n.d. n.d.3.33 3.58 4.22 3.33
97.80 98.16 98.69 97.580.00 0.00 0.00 0.001 .40 1 .51 1 .78 1.40
96 40 96.65 96.99 96.182.59 2.48 2.16 2.53
98.99 99 13 99.16 98.71
40.47 41.5113.93 12.952.92 2 53
27.50 28.25n.d. n.d.0.04 0.05
10.30 10.450.35 0. ' t70.09 0.04n.d n.d.n.d. n.d.4.40 4.57
100.00 100.520.00 0.001 .85 1.92
98.15 98.602 . 1 7 2 . 1 2
100.32 1 00.71
40.40 39.6513.88 1 5.003.02 1.56
24 74 25.85n.d. n.d.0.13 0.07
10.02 9.850.25 0.180.13 0.050.48 1.O4n.d. n.d.3.52 4.68
96.57 97.930.00 0.001 .48 1.97
95.09 95.962.47 1.94
97.56 97.90
38.64 39.1615.41 15.221.85 3.53
26.58 24.35n.d. n.d.0.07 0.07
10.72 10.530.19 0.260.06 0.181 .18 0.58n.d. O.223.53 3.41
98.23 97.510.00 0.061 .49 1.44
96.74 96.022.51 2.47
99.25 98.49
2.771 2.8331 .229 1 .1674.000 4.0000.074 0.1320.111 0 .2142.841 2.6260.010 0 .0140.004 0.0113.039 2.9960.000 0.0000.010 0 .0100.981 0.9720.033 0.0161.024 0.9988.063 7.9940.801 0.7800.000 0.0271 .199 1 .1932.000 2.0000.038 0.0750.401 0.390
Cations calculated on the basis of 1 1 oxygen equivalents, total Fe as FeO2.849 2.906 2.925 2.856 2.791 2.941 2.855 2.7771.151 1 .069 1 .075 1 .144 1 .209 1 .001 1 .145 1 .2234.000 3.974 4.OOO 4.000 4.000 3.943 4.000 4.0000.006 o.0oo 0.109 0.129 0 015 0.000 0.014 0'0690.172 0.148 0.183 0 094 0.082 0.203 0.088 0'2892.886 2.947 2.669 2.775 2.939 2.866 2.914 2'6300.019 o.oo9 0.014 0.010 0.012 0.008 0.010 0.029o.oos 0.002 o.oo8 0.003 0.004 0.016 0.003 0.0063.087 3.107 2.983 3.01 1 3.052 3.093 3.030 3-024o.ooo o.0oo 0.000 0.000 0.000 0.000 0.000 0'000o.oo5 o.oo7 o.ol I 0.01 0 0.01 1 0.01 1 0.01 0 0.0100.925 0.933 0.925 0.905 0.957 1.009 0.978 0.973o.ooo o.oo0 0.014 0.029 0.047 0.004 0.032 0.0320.930 0.940 0.957 0.944 1 .015 1 .023 1 .020 1.0158.017 8.021 7.939 7.955 8.067 8.059 8.049 8.0390.980 1 .012 0.806 1 .066 0.758 0.813 0.956 0.769o.ooo o.ooo o.ooo 0.000 0.000 0.000 0.000 0.0101.020 0.988 1.194 0.934 1.242 1.187 1.044 1.23' l2.OOO 2.OOO 2.OOO 2.000 2.000 2.000 2.000 2.000o.os6 0.048 0.064 0.033 0.027 0.066 0.029 0.0990.490 0.506 0.403 0.533 0.379 0.407 0.478 0'385
function of time of nucleation. In a few cases the phlog-opites displayed more than this simple paired zoning. Fig-ures 3N and I I show euhedral crystals with three majorzones. Superimposed on these major zones are very thinand compositionally subtle oscillatory zones. Detailed in-vestigation ofthese oscillatory zones was not undertaken,but it appears that they result from changes in Fe2+ /Mg2+ .Also observed in a small number of phlogopite crystals isa dissolution texture always associated with the darkerzones (Figs. 3L and 3M). In every case the dissolutionevent was followed by the crystallization of a lighter (Mg-rich) zone. The dissolution has occurred primarily on theedges of the phlogopite crystals and not on the (001) sur-face.
Phlogopite zoning is not common, and although thereis considerable speculation as to the exact origin of thezoning, there is agreement that it is caused by some majorperturbation in one or more intensive parameters (Rim-saite, 1969; Rashkova, 1981). Various mechanisms havebeen considered: (l) a change in the bulk composition ofthe precipitating fluid; (2) a change in pressure and/ortemperature; (3) a preferential loss of H, during someevent by which the solution becomes more oxidized, theactivity of Fe2+ is lowered, and, hence, the phlogopitesbecome enriched in Mg; and (4) that the Fe content variesas a function ofgrowth rate. Baronnet and Velde (1977)have experimentally investigated the growth of phlogopitefor constant chemical and physical parameters. They found

786 BELKIN ET AL.: HYDROTHERMAL PHLOGOPITE AND ANHYDRITE
f ABLE 1-Continued
2410Depth (m):
Sample:Description:
Number ofanaryses:
8zoneo
dark rim
Izoneo
light rim
2
8zoneo
light core
e
9 1 1zoned zoned zoned
dark core light rim dark core
3 3 3
2 2 3 3zoned zoned zoned zoned
light rim dark core dark core light rim
3 3 3 3
sio,Alr03FeOMgoCaONa.OKrOTio,MnOBaOclF
Sum- C l = O- F = O
SumH,O (calc).
Sum
SiratAl
T site16lAlFe2*MgTiMn
M site
NAKBa
A site2 cations
F
OH (calc.)-Sum
Fel(Fe + Mg)F(F + OH)
40.53 39.25 40.34 37.8111.95 13.87 11.67 14.742 37 3.7't 2.28 3.53
27 15 25.06 27.53 25.96n.d. n d. n.d. n.d.0.08 0 08 0.08 0.07
11 .02 10.80 10.84 1 0.750.20 0.30 0.17 0.240.08 0 12 0.08 0.160.44 0 65 0.27 0.84n.d . n d . n .d . 0 .163.57 3.24 5.00 3.79
97.39 97.08 98.26 98.050.00 0.00 0.00 0.041.50 1 .36 2 .11 1 .60
95.89 95.72 96.16 96.412.46 2.59 1.76 2.28
98 35 98.30 97.92 98.69
2.928 2.854 2.926 2.7531 .018 1 146 0.998 1.2473.945 4 000 3.923 4.000.000 0.043 0 000 0.0180.143 0.226 0.138 0 2152.923 2716 2.976 2.8170.011 0 .016 0 009 0 .0130.005 0.007 0.00s 0.0103.082 3.009 3.128 3.0730.000 0.000 0.000 0.0000.011 0 .011 0 .011 0 .0101 .016 1 .O02 1 .003 0.9990.012 0.019 0.008 0.0241039 1.032 1.022 1.0328.066 8.040 8.073 8.1050.816 0.745 1.147 0.8730.000 0 000 0.000 0.0201 .'184 1 255 0.853 1 .1082.000 2.000 2.000 2.0000.047 0.077 0.044 0.0710.408 0.375 0.574 0.436
41.79 41 .39 39.64 39.2712.82 12.76 14.32 14.541.20 2.08 4.03 3.47
29.15 28.25 26.11 26.94n.d. n.d. n.d. n.d.0.04 0.05 0.04 0.05
10.57 10.33 10.11 9.800.15 0.1 1 0.40 0.41n .d . 0 .10 0 .14 0 .10n.d. 0.37 n.d. 0.19n.d. n.d. n.d. n.d.4.58 4.56 4.14 4.05
100.30 100.00 98.93 98.820.00 0.00 0.00 0.001 .93 1.92 1 74 1.71
98.37 98.08 97.21 97 .122. ' t3 2.10 2.24 2.29
100.50 100.18 99.44 99.40
40.1 814.231.58
28.47n.d.0.05
10.260.16n.o.0.40n.o.4.29
99.620.001.81
97.812.23
100.04
39.6915.501.74
27.43n.d.0.06
10.000.16n.d.o.74n.d.4.06
99 380.001.71
V T . O T
2.33100.00
Cations calculated on the basis of 11 oxygen equivalents, total Fe as FeO2.8281 j 7 24.0000.0090.0932.9870.0080 0003.0970.0000.0070.9210.0110.9398.0360.9550.0001.0452.0000.0300.478
2.7971.2034.0000.0850.1032.8810.0080.0003.0760.0000.0080.8990.0200.9288.0030.9050.0001.0952.0000.0340.453
2 915 2.9141.054 1.0593.969 3.9740.000 0.0000.070 0.1223.030 2.9650.008 0.0060.000 0.0063.108 3.0990.000 0.0000.005 0.0070.941 0.9280.000 0.0100.946 0.9458.023 8.0181 0 1 0 1 . 0 1 50.000 0.0000.990 0.9852.000 2.0000.023 0.0400.505 0.507
2.829 27981.171 1 .2024.000 4.0000.034 0.0190.241 0.2072.777 2.8610.021 0.0220.008 0.0063.082 3.1 150.000 0.0000.006 0.0070.921 0.8910.000 0.0050.927 0.9038.009 8.0180.935 0.9130.000 0.0001 .065 1.0872.000 2.0000.080 0.0670.467 0.456
that increased growth rate increases the Fe and to a lesserextent the Ti content of the mica. The abundance of solidand fluid inclusions observed in the dark zones comparedto the light zones also suggests that the dark zones grewmore rapidly (Roedder, 1984).
Ba in SH2 phlogopites. The BaO content of SH2 phlog-opite ranges from 0 to 3.8 wto/o and can be enriched ordepleted in similarly colored zones of the same or differentcrystals. Although the Ba content of SH2 phlogopite hasscatter in any given sample, there appears to be a mini-mum in the average BaO content at 2410 m with increas-ing values at lesser and greater depths (Fig. l2). A similarvariation in the Ba content ofcoexisting anhydrite is alsoseen (Fig. l2).
Ba2+ is nearly identical in size to K*, and various sub-stitutional schemes have been proposed: (l) Ba'z* + tr2lE =2K* (Shmakin, 1984) and (2) Ba2+ * Al3* + K+ + Si4+(Wentlandt, 1977). Figure l3 shows the variation of Ba2+
with K* and the position ofthe two substitutional schemes.The most statistically significant variation of Ba with Kappears to behave according to scheme Ba2+ * Al3* +K* + Si4+. However, the displacements of the 1600-mand one of the 2210-m regression curyes may indicateadditional substitution into the interlayer site by otherelements or vacancies.
The BaO content in relation to the obvious color zoningis complex. Figure I I shows a zoned crystal where BaOin one zone can be either enriched or depleted relative tothe other zone. Generally the darker (Fe-rich) zones haveintermediate amounts whereas adjacent lighterzones haveBaO contents that range from 0 to > 3 wto/0. The ratio ofBa-enriched to Ba-depleted adjacent light zones is ap-proximately one. Although the data are limited, there doesnot appear to be any systematic difference between theBa contents of light-colored centers or light-colored rims.
Ti in SH2 phlogopites. Ti in phlogopite is of interest

BELKIN ET AL.: HYDROTHERMAL PHLOGOPITE AND ANHYDRITE
2480
78',1
TABLE 1-Continued
2410 2450
4 5 6 6 7zoned zoned zoned zoned zoneddark dark light dark darkcore core core nm core
3 3 3 3 3
zoneo(very
slightly)e
1 2 3zoned zoned zoned(very dark dark
slightly) core coree e e
4zoned(very
slightly)2
1zoneddarkcore
3
zoned(very
slightly)o
41.0913.40205
26 07n.o.0.089.830.300.080 9 3n o3 7 4
97.570.001.57
96 002.42
98 41
2.9411.0594.0000.o720 1232.7810.0160.0052.9960.0000.0110.8980.026n oa(7.9310 8470 000t . t c J
2.0000.0420.424
40 17 37.94 38.8213.32 17 .42 16.233.47 3j2 2.88
24.61 23.87 23 900.06 n.d. n.d.0 .19 0 .10 0 .1 6
10.25 9.78 9.650.49 0.22 0.390.14 0 07 0.070 .45 1 .96 1 .28n .d . n .d . 0 .103.34 2.53 2.68
96.49 97.01 96.160.00 0.00 0.031 4 1 1 . O 7 1 . 1 3
95 08 95.94 95.012.54 2.95 2.84
97.62 98.90 97 86
39.42 39.48 39.52 37.80 36.55 35.7915.53 16.21 14 94 17 .37 1 8.48 17 .483.08 2.20 2.81 3.38 2.31 2.72
24.47 24.24 24.60 23.09 23.94 24.070.05 n.d. n.d. n.d. n.d. n.d.0.11 0.08 0.08 0.08 0.09 0.08
1 0.67 1 0.46 1 0.55 1 0.19 10.10 9.68o.25 0 20 0.29 0.23 0.27 0.280.09 0.05 0.10 0.1 1 0.05 0.080.84 0.98 0.54 1.84 2.30 2.97n.d. n.d. n.d. n.d. n.d. n.d.3.19 2.98 4.12 2.80 3.13 2.43
97 .70 96.88 97.55 96.89 97.22 95.580.00 0 00 0.00 0.00 0.00 0.001 .34 1 .25 1 .73 1 .18 1 .32 1 .02
96.35 95.63 95.82 95.72 95.90 94.562.66 2.76 2j9 2.79 2.64 2.90
99.01 98.38 98.01 98.50 98.54 97.45
40.33 39 2613.19 13 .593.81 4.82
24.42 24.56n.d. n.d.0.06 0.06
10.79 10.710.89 0.860 . 1 1 0 . 1 30.34 0.27n.d. n.d.3.10 2.77
97.04 97.030.00 0.001.31 1 .17
95.73 95 862.68 2.82
98.41 98.68
2.917 2.8491.083 1 .1514.000 4.0000.042 0.01 10.230 0.2932.632 2.6560.048 0.0470.007 0.0082.960 3.0150.000 0.0000.008 0.0080.996 0.9910.010 0.0081 .014 1 .0077.973 8.0220.709 0.6360.000 0.0001.291 1.3642.000 2.0000.081 0.0990.3s5 0.318
Cations calculated on the basis of 1 1 oxygen equivalents, total Fe as FeO2.921 2.739 2.812 2.832 2.837 2.860 2.748 2.657 2.6501.079 1261 1 .188 1 .168 1 .163 1 .140 1 .252 1 .343 1 .3504.000 4.000 4.000 4.000 4.000 4.000 4.000 4.000 4.0000.062 0222 0.198 0.148 0.210 0.134 0.237 0.242 0.1760.211 0.188 0.174 0.185 0.132 0.170 0.206 0.140 0.1682.667 2.568 2.580 2.620 2.596 2.653 2.502 2.594 2.6560.027 o.o1 2 0.021 0.014 0.01 1 0.01 6 0.013 0.015 0.01 60.009 0.004 0.004 0.005 0.003 0.006 0.007 0.003 0.0052.975 2.994 2.979 2.972 2.952 2.979 2.964 2.994 3.021o 005 0.000 0.000 0 004 0.000 0.000 0.000 0.000 0.000oo27 0 .014 0 .022 0 .015 0 .011 0 011 0 .011 0 .013 0 .0110.951 0.901 0.892 0.978 0.959 0.974 0.945 0.937 0.9140.01 3 0.0ss 0.036 0.024 0.028 0.015 0.052 0.066 0.0860.995 0.970 0.9s0 1 .021 0 997 1 .001 1 .009 1 .015 1.0127.970 7 964 7.929 7.993 7 950 7.980 7.972 8.009 8.0320.768 0 578 0.614 0.725 0.677 0.943 0.644 0.720 0.5690.000 0.000 0.012 0.000 0.000 0.000 0.000 0.000 0.0001.232 1.422 1.374 1.275 1 .323 1 .057 1 .356 1.280 1 .4312.000 2.000 2.000 2.000 2.000 2.000 2.000 2.000 2.0000.073 0.068 0.063 0.066 0.048 0.060 0.076 0.051 0.0600.384 0.289 0.307 0.363 0.338 0.472 0.322 0.360 0.285
especially from high-pressure and high-temperature re-gimes (e.9., Arima and Edgar, l98l) as a potential P-Zindicator, although Ti substitutions in phlogopite are notwell understood (Dymek, 1983). Various schemes havebeen proposed: (1) a Ti-Tschermak's end member, 2torsi +r61Mg + 2r4rAl + r5rTi (Robert, 1976),(2) lror
788 BELKIN ET AL.: HYDROTHERMAL PHLOGOPITE AND ANHYDRITE
?-ct
.8) o.re
o.12
Mg to.r.u.lFig. 9. The variation in SH2 phlogopites of Mg and Fe pfu
on the basis of 1l oxygen equivalents. The line *-* shows theposition of the substitution Mgt* = Fe2+. The circled data pointsindicate dark phlogopite or dark phlogopite zones. The otherdata points are light phlogopites or light phlogopite zones. Thetielines connect dark (circled) and light zones of the same crystal.All Fe assumed 1o be Fe2*.
from 0.28 to 0.57 (Table l). Using Figure 5 of Munozand Ludington (1974) and the temperature data derivedfrom primary fluid inclusions in phlogopite, the logfsro/1[. values in equilibrium with the phlogopite depositingsolutions are - >6.
Figure 15 shows the distribution of F with respect tosample location. Although the data are limited, there is adefinite maximum at22l0 m with generally lower valuesat greater and lesser depths.
Fe2+-F avoidance. Although F substitutes freely for hy-droxyl, the principle of Fe2*-F avoidance-that an Fe-rich silicate requires higher frrto stabilize a given X. thanthe equivalent Mg-rich silicate-has been studied recently
3.23.O2.92.62.4
Fe / (Fe+Mg)
Fig. 10. Variation of Fe/(Fe + Mg) in SH2 phlogopites as afunction of sample location. All Fe assumed to be Fe2*.
and emphasized by, e.9., Munoz and Ludington (1974)and Valley et al. (1982). The SH2 phlogopites have a lowFe content [Fe/(Fe + MC) < 0.1], which may in partaccount for their high X.. Figure 16 shows a positivecorrelation of F with Mg2+. Such a good correlation issurprising considering the limited range of Mg'z+ contentand the higher uncertainty associated with F analysis.
F in phlogopite zoning. The darker zones ofSH2 phlog-opite (Fig. I 1 ) generally have less F, as the Fe2+ -F avoid-ance principle would demand. However, the distributionof F in phlogopites may be more complicated. For ex-ample, although most Mg-rich (light-colored) zones havemore F than do the adjacent dark zones, in three casesthey had less. Furthermore, a traverse across a light-col-ored zone (Fig. I l) shows that the distribution is not con-stant.
ANuvnnrrn rRAcE-ELEMENT cHEMrsrRY
The partition coefficient of minor elements betweenauthigenic minerals and geothermal solutions can be usedto estimate some of the chemical parameters of the geo-thermal fluid and perhaps to resolve the precipitationmechanisms responsible for various authigenic minerals(e.g., Holland, 1956; and Shikazono et al., 1983). As apreliminary study of the trace elements in SH2 anhydrite,crystal fragments carefully handpicked from various SH2drill-cutting samples have been analyzed by a rrvnx en-ergy-dispersive system. Table 2 shows the data as a func-tion of depth and gives the estimated uncertainties for Rb,Sr, Ba, La, and Ce. There are three major limitations andassumptions of this study. First, the value determinedrepresents an average from anhydrites that perhaps weredeposited by different fluids. The salinity data (Fig. 5)show that within the same sample, fluid inclusions havedifferent values. Second, although the anhydrites werecarefully examined prior to crushing, we cannot precludethe presence of contaminating phases. Third, we haveassumed equilibrium crystallization between the anhy-drite and precipitating solutions.
There is very little published information on the rare-
8b. . - . . . .

BELKIN ET AL.: HYDROTHERMAL PHLOGOPITE AND ANHYDRITE 789
S O O p m
MnO'. t t a t a a a a
a a r a a a
t a a a a a a
BaO' '
a
a o '
a . a a a a a o o o o ' a
a t t
l a '
Fig. 11. An electron-microprobe traverse (offset black line)of a euhedral, zoned phlogopite crystal from the SH2 sample2210 m. The variation of BaO, F, FeO (total Fe), TiOr, and MnO(wto/o) across the light-dark-light sequence is shown. The beamsize was -10 pm in diameter, and the standard deviation (1o)associated with standardization is shown.
earth-element content of anhydrite; however, Morgan andWandless (1980) presented data on two samples of hy-drothermal anhydrite. Their REE values (in ppm; samplePBB-2-78, La: 9l and Ce : 180; sample PBB-3-78, La :52 and Ce : 102) are similar to those found in the SH2anhydrites.
The most notable and consistent aspect of the data forall elements is a minimum at 2040 m with generally in-creasing values to lesser and greater depths. If we comparethe Ba data ofanhydrite with the BaO content ofcoex-isting phlogopite (Fig. l2), we see a similar pattern, butdisplaced toward slightly greater depth. Furthermore, acomparison of F in coexisting phlogopite (Fig. I 5) showsa definite pattern antithetic to the anhydrite trace-elementand phlogopite BaO data; the F maximum is in a similarposition to their minima.
Fig. 12. The variation of BaO (wto/o) of SH2 phlogopites asa function of sample location (depth in meters). The Ba (ppm)trace-element data in anhydrite are also shown.
Although the above data are limited, they corroborateour conclusions that the anhydrite and phlogopite wereprecipitated from the same solutions and that the factorsthat caused the elemental variation in both minerals weresimilar. The generally enriched trace-element values sup-port the thesis that the fluid is, in part, derived from a
1.O2
0.98
j..io
Yo.s+
0.86o o.o4 0.08 0.12
Ba(p.r.u.)Fig. 13. The variation of K and Ba (ptu) of the SH2 phlog-
opites on the basis of I I oxygen equivalents. The substitutionschemes Ba2+ + Al3+ = K+ + Si4+ and Ba2+ * E = 2K* areshown as the lines *-*. Regression curves for the data fromsamples from 1600, 2210, and2489 m are shown. The data for2210 m have been divided into two groups; thus two regressioncurves are shown for 2210 m. 2210 m (upper curve), r : -0.818;
2210 m (lower curve), r : -0.919;2480 m, r : -0.970; 1600m, r : -0 .989.
{:"
{:'
FeOr a
. t
t t
t t t '
aF

790 BELKIN ET AL.: HYDROTHERMAL PHLOGOPITE AND ANHYDRITE
o.o5
o.o1
Mgtn.t.u.tFig. 14. The variation in SH2 phlogopites of Ti and Mg (pfu)
on the basis of I I oxygen equivalents. The substitution schemes2Mgt* - Ti4+ + tr and Mgr* + 2Si4+ + Ti4+ + 2Al3* are shownby the lines *-*.
highJevel fractionating magma (Cavarretta and Tecce,l 987).
Sr in SH2 anhydrite
Natural anhydrite contains minor amounts of Sr, whichsubstitutes for Ca in the anhydrite structure (Purkayasthaand Chatterjee, 1966). The coprecipitation of Sr with cal-cium sulfate minerals has been studied to try to clarifythe depositional environments and especially the brinecomposition (e.g., Herrmann, 1961; Butler, 1973; Kush-nir, 1982a). However, experimental studies of the parti-tioning ofSr between anhydrite and aqueous solutions at
?o
I
o.02
3'o F(*,r) a'o 5'o
Fig. 15. The variation of F (wto/o) in SH2 phlogopitds asfunction of sample location (depth in meters).
various salinities, pressures, and temperatures are limited(e.g., Kushnir,1982b; Shikazono and Holland, 1983).
The distribution of Sr and Ca between two phases isgoverned by the equation
K"* : (a..roo/ a"^"o o)/ (a",r* / aqur*),
where K"* is the distribution coefficient, c5,560 arrd a"^"ooare the activities of the SrSOo and CaSOo components ofanhydrite, and a.,r* and a"^r* are the activities ofSr2* andCa2* in solution. K"" is a Berthelot-Nernst-type distri-bution coefficient (e.g., Mclntire, 1963).
We have calculated the Sr/Ca ratio in the precipitatingbrine for four samples (Table 3). Kushnir (1982a) studiedthe partitioning of Sr between anhydrite and brine duringgypsum to anhydrite transformation at temperatures be-low 150 "C. He found a linear decrease of Ki' with tem-perature. Shikazono and Holland (1983) found that Ki'depends less on the NaCl concentration, temperature, andprecipitation rate than on the degree of supersaturationof the solutions with respect to anhydrite and/or the mor-phology of the precipitated anhydrite crystals. They dis-tinguished acicular and rectangular anhydrite. The rect-angular anhydrite morphology is similar to the SH2anhydrite. The Shikazono and Holland (1983) K$ valuesbetween solution and rectangular anhydrite at 150, 200,and 250 "C are0.35,0.24,0.27 (+9.95;, respectively. Notethat they show a minimum at 200'C. Thus, using theseexperimental K!'values, the Sr/Ca ratio in the precipi-tating solution ranges from 0.060 to 0.10. However, theexperimental K!' values do not agree with the higherK!' values of natural hydrothermal anhydrites from theEast Pacific Rise (Shikazono and Holland, 1983) or fromvein anhydrites from the Salton Sea geothermal system(M. A. McKibben, pers. comm., 1987). The Sr/Ca ratioof sea water (-0.021) is significantly ditrerent from thosevalues (Table 3) calculated with the experimental K:'data. If the higher, natural K!' values are used, the SH2Sr/Ca ratio would be closer to the sea-water ratio. Thus,we cannot preclude the presence of sea water as a com-ponent in the SH2 geothermal fluid.
2190m221Om t r o . o o
A A A
2.4 2.6 2.8 3.O

BELKIN ET AL.: HYDROTHERMAL PHLOGOPITE AND ANHYDRITE 791
TneLe 2. xRF-KEVEX analyses (in ppm) of anhydrite separatesfrom ther SH2 well
Depth of drillcutting sample (m)
1300 1600 1990 2040 2150 2190 2410 2480
1308400280
30
320 1005700 62003800 1300
70 3080 20
RbSrBa
19061 001 600400500
450560036001 1 0210
4 0 1 1 02000 5100'| 10 730
< 2 1 41 6 5 0
67054003900130180
Note. John R Evans, analyst. The uncertainty is +5% of the given valueexcept for values <20, where the uncertaintv is +10%.
DrscussroN
Deposition of anhydrite
Quartz, calcite, and anhydrite are perhaps the threemost common primary gangue minerals in hydrothermalore deposits (Samartsev et al., 1980; Shikazono et al.,1983; Drummond and Ohmoto, 1985). The conditionsthat deposit anhydrite are of interest to help model thegeothermal and ore-forming environments. Geothermalsolutions at the SH2 well site have deposited anhydriteas the result ofperhaps various processes.
Anhydrite solubility in pure water at geothermal tem-peratures is retrograde; however, the retrograde solubilityreaches a minimum with increasing NaCl content at con-stant pressure (Blount and Dickson, 1969). Blount andDickson (1969) also found that a pressure increase raisesthe solubility of anhydrite over the entire range of theirexperimental conditions. However, the retrograde effectof increasing temperature far outweighs the positive effectof increasing pressure except in NaCl solutions greaterthan 2M. The range of salinity from our fluid-inclusionstudies in SH2 anhydrite is 0.5 to 14.0 wt0/o NaCl equiv-alent, which corresponds to -0 to -2MNaCL Thus, theeffect of a minimum in anhydrite solubility as a functionof salinity would be minimized in SH2 solutions. How-ever, the presence ofthe other dissolved components (Ba2+,Sr'z*) and volatiles (COr, B, HF, hydrocarbons) may havesignificantly enhanced this minimum solubility effect.
Drummond and Ohmoto (1985) have modeled boilinghydrothermal systems and concluded that anhydrite, andsulfates in general, will not be common depositional prod-ucts of boiling. However, in relatively dilute and slightlyacidic solutions of about 250 "C, the decrease in protonconcentration associated with boiling can cause sulfateminerals (anhydrite) to precipitate (Sasada, 1986). Queenand Motyka (1984) found that in water-dominated zonesof the Makushin geothermal system, anhydrite is a com-mon authigenic mineral, whereas it is absent from thevapor-dominated zones. We find no petrographic evi-dence for boiling in SH2, and the measured down-holetemperatures and the similar homogenization tempera-tures lie far to the left of the depth with boiling-pointcurve calculated for this environment.
Shikazono et al. (1983) have examined the mode ofanhydrite occurrence and its depositional mechanisms in
Fig. I 6. The variation of Mg (pfu) (on the basis of I I oxygenequivalents) and F (wto/o) in SH2 phlogopites.
Kuroko deposits. Fluid inclusions in these Kuroko an-hydrites have In values that range from 240 to 340 "Cwith salinity values from 0 to 5 wto/o NaCl equivalent.They concluded on the basis ofthese data, Sr concentra-tions, and 875r/865r ratios that anhydrite deposition wasthe result of a subsurface mixing of fluids. Although wefind some evidence for perhaps multiple fluids at SH2,our data are insufficient to discuss deposition by thismechanism conclusively.
Phlogopite and biotite in geothermal systems
Biotite is a common primary constituent of the hostrock in many geothermal systems but is rare as a hydro-thermal mineral (Browne, 1984) except in the deeper,higher-temperature portions of some geothermal systems.Biotite appears between the 325 and 360 "C interval inBorehole Elmore I, Salton Sea geothermal field (Mc-Dowell and Elders, 1980), in the hotter (>325 "C) partsof the Cerro Prieto field (Elders et al., 1979), at Ngawha,New Zealand, at temperatures above 220 "C (Browne,1984), and in wells MF2, MF5, and SV3 in the Phlegraean
TneLE 3. Calculation of the Sr/Ca ratio in the geothermal fluidof the SH2 well
Calculatedftuid
K:" sr/caSample In-hole f
depth (m) ('C)Sr ppm
(Table 2)
1 3001 60021 5021 90
143190
-250-250
61 00570051 008400
0 3 5o.240.270.27
0.0600.0820.0640.10
o aA
4o o o
a 'ol lo
a
- Shikazono and Holland (1983).

792
.SH2 PHLOGOPITES
6
aeF
= 4
IL
2
o
8
n 6-=
FeO WT% TOTAL IRON
Fig. 17. A comparison of the F, TiOr, and BaO vs. FeOvariations for SH2 and other phlogopites. ESS : Exley et al.(1982), host : spinel therzolite (F was not detected in micas withFeO > 3 wt9o). M : Matson et al. (1986), host : peridotitexenoliths (primary and secondary) and mica-rich xenoliths (glim-merite) in kimberlite. BS1, BS2 : Bachinski and Simpson (1984),host : minettes, BSI : group I phenocrysts, BS2 : group IIgroundmass. JSl, JS2 : Jones and Smith (1985), host: minettes,JSI : Hannaborough Quarry locality, JS2 : Loxbeare Farmlocality. Vl, V2 : Valley et al. (1982), host : marble, Vl :
sample GOV50 -2, V2 : sample BMT- I (BaO for GOV50-2 wasnot determined). W : Wendlandt (1977), host : monticelliteperidotite. GW : Gaspar and Wyllie (1982), host : carbonatites.Y : Yau et al. (1984), host : granulite-facies (metasedimentary)retrograde calcsilicate rock. SSN : Schulze et al. (1985), host :
BELKIN ET AL.: HYDROTHERMAL PHLOGOPITE AND ANHYDRITE
d\r 4
F
2
aF=oo
d}
Fields at temperatures above 300 "C (Belkin et al., 1986).Cavarretta et al. (1985) reported biotite as a contact me-tasomatic mineral at or above 300 "C in the Latera geo-thermal field, Italy. Biotite is also reported in the SH2well as an uncommon phase below 1600 m and above200 "C (Cavarretta and Tecce, 1987). Another phyllosil-icate not generally found in geothermal systems is lepid-olite. However, from Yellowstone National Park bore-holes, Bargar et al. (1973) reported lepidolite formingbetween 130 and 140'C. Phlogopite is also a rare authi-genic mineral in geothermal fields. Cavarretta et al. (1985)reported phlogopite from the Lalera geothermal field, It-aly, in the contact metasomatic zone above 200 "C. Phlog-opite has also been reported in paleohydrothermal sys-tems. Zhang (1986) reported the assemblage phlogopite+ anhydrite (with pyrite) from a volcanic area in theYangtze River valley. Fluid-inclusion studies in the an-hydrite indicate the temperature to be between 300 and500'c.
The common occurrence of authigenic phlogopite inthe SH2 well indicates that equilibrium crystallization ofphlogopite can occur at temperatures from - 200 to - 300'C and pressures from 140 to 220 bars from a F-bearing,volatile-rich, generally dilute geothermal solution.
Cornparison with phlogopites from other environments
Phlogopite is often the only volatile-bearing constituentof mantle-derived rocks and potassic mafic and ultra-mamfic rocks. Because of its petrogenetic importance,geothermometers and geobarometers involving variouselemental variations have been proposed (e.g., Luhr et al.,1984; Tronnes et al., I 985). Figure 17 shows a comparisonof F, TiOr, and BaO vs. FeO as total Fe between the SH2phlogopites and phlogopites or phlogopitic biotites fromdifferent metamorphic and igneous environments. This isnot a comprehensive survey and was further limited bythe paucity ofstudies that provided data on all three ele-ments-F, Ba, and Ti. Minor-element abundances in anymineral are a complex interrelationship of intensive andextensive parameters. SH2 phlogopites represent com-positions formed from a low-temperature, low-pressure,aqueous, volatile-rich environment and might be used toconstrain the lower-pressure, lower-temperature stabilityfield of phlogopite compositions.
A generally negative correlation of F with FeO is ap-parent (Fig. 17) and would be consistent with the crystal-chemical rule of Fe2+-F avoidance. Two fields of phlog-opites (M, ESS, Fig. 17) from kimberlites and spinellherzolites have a low F content with respect to otherphlogopites with similar FeO content and probably rep-resent the influence of a low-F bulk composition. A pos-itive correlation of TiO, with FeO (Fig. 17) suggests that,in general, the substitution Mg2+ + f'sz+ controls the Ticontent and/or a bulk composition richer in Fe is also
lamprophyres. C : Cross (1897), host : wyomingite. AC : Allanand Carmichael (1984), host : lamprophyric lavas.

richer in Ti. The position of the F and Ti SH2 phlogopitecompositional fields with respect to other fields suggeststhat neither pressure nor temperature alone control Ti orF variation.
The pattern of BaO distribution (Fig. l7), however,suggests that the major controlling factor in the Ba contentof phlogopites is the bulk composition. In general, phlog-opite has BaO values of I wto/o or less. Three fields (SH2phlogopites, GW, W) are major exceptions. The replace-ment of K+ by Ba2+ in the phlogopite interlayer site re-quires charge compensation that can be achieved by var-ious substitution schemes (see above). Higuchi andNagasawa (1969) and Jensen (1973) reported partitioncoefficients in a dacite-Ku" for biotite/matrix of - l0 andK" for biotite/matrix of -2. Thus, phlogopite would actas a very effective scavenger ofBa. The variability ofBaOat relatively constant FeO content in the SH2 phlogopitessuggests significant Ba variations in the geothermal fluid.
Hydrocarbons in the inclusion fluid
The occurrence ofliquid hydrocarbons and a gas-clath-rate with a melting temperature significantly greater thanl0'C are not common in the fluid inclusions in the SH2anhydrites. The presence ofhydrocarbons in geothermaland hydrothermal environments is not unusual (e.g.,Roedder, 1984; Hodge and Norman, 1985), especially ifsuch environments are located in, or if the fluid passedthrough, a sedimentary sequence. Thus, the presence ofhydrocarbons in the SH2 inclusion fluid suggests someinteraction with or fluid derivation from the local sedi-mentary environment.
CO, in the inclusion fluid
The evidence for CO, as a volatile constituent in fluidinclusions in SH2 anhydrite is widespread but not uni-versal. Crushing and freezing data suggest that during someanhydrite-depositional periods, the percipitating fluidcontained COr. Because the drill-cutting sample may rep-resent the entire depositional time range, each samplewould tend to show the complete range of fluid compo-sitions. The minimum CO, concentration necessary toproduce CO, clathrate in liquid-rich inclusions trappedin the temperature range of 200 to 300'C is 1.5 molo/o(Sasada, 1985).
The rare occurrence ofliquid-CO, fluid inclusions fromgeothermal fields has been discussed by Sasada (1985).He has argued that pressures greater than hydrostatic arenecessary to form inclusions with liquid CO, (at roomtemperature) in the geothermal environment. A vein sys-tem, sealed by mineral deposition, could represent sucha circumstance. The self-sealed vein system could still besubject to greater than lithostatic pressure from the as-cending fluid, especially if some or all of the ascendingliquids and volatiles evolved from crystallizing magma.In the SH2 well, the abundant filled and cross-cuttingveins suggest that such overpressure resulted in commonhydrofracturing, subsequent self-sealing of fracture per-
793
meability by mineral deposition, and then repeated hy-drofracturing.
Evolution of the geothermal system
A comparison ofthe well-fluid composition and meauredin-hole temperatures with the fluid inclusion Zn and sa-linity data would allow an assessment of geothermal evo-lution (e.g., Browne et al., I 976; Belkin et al., I 986)' How-ever, because no fluid was recovered from the SH2 well,our analysis is limited.
The correspondence ofthe 7i data (Fig. 4) for anhydritewith in-hole temperatures is quite good. The scatter of the?", values and especially the low ?] values from 2410 mcould result from one or a combination of factors: (l) thehydrologic regime (water table) was different at the timeoftrapping than the regime that exists today, and hencethe pressure correction is in error; (2) the drill-cuttingsamples may have significant vertical-and hence tem-perature-scatter; (3) inclusions that had necked-downwere measured; and (4) the sample may represent severaldifferent times, temperatures, or pressures of formation.The L data (Fig. 6) of phlogopite show a similar corre-spondence to the in-hole temperature. The data are lessnumerous than the T, data for anhydrite, and this un-doubtedly adds to th€ scatter. Nevertheless, the T, dalafor anhydrite and phlogopite indicate that these authigenicphases are relatively recent and/or the thermal flux ofthewater-dominated geothermal system has remained stableduring the latter stages of its evolution. The salinity datafor anhydrite and phlogopite (Figs. 4 and 5) suggest theexistence of multiple fluids that resulted in the trappingof a range of salinities (-0 to -14wto/o NaCl equivalent).However, the data are too limited to define any system-atics between sample location and host.
An episodic and multiple-fluid environment
The large-scale (light-dark, etc.) zoning in some SH2phlogopites and their element variations indicate an ep-isodic and/or multiple-fluid environment during the evo-lution of the SH2 geothermal system. The major phlog-
opite color-zone difference is associated with the Mg-Fesubstitution. The dark zones are enriched in Fe but de-pleted in F relative to the light zones. A plausible expla-nation for such a distribution would be the episodic in-troduction of magmatic fluid into the geothermal regime.A fluid, perhaps derived from a fractionating trachyticmagma (Cavarretta and Tecce, 1987), would be enrichedin HF and other volatile species (COr, etc.). This wouldreduce the activity of HrO and hence the activity of Fe.Phlogopite crystallizing at this time would be depleted inFe but enriched in F. The common sharp, color-zoneboundaries suggest that these pulses produced relativelyrapid changes in fluid conditions. Cavarretta and Tecce(1987) have reported similar zoning in vesuvianite andsuggested that it has resulted from the process ofepisodichydrofracturing. Uncommon phlogopite dissolution tex-tures also suggest that during some periods the fluid be-came undersaturated with respect to phlogopite.
BELKIN ET AL.: HYDROTHERMAL PHLOGOPITE AND ANHYDRITE

794 BELKIN ET AL.: HYDROTHERMAL PHLOGOPITE AND ANHYDRITE
The BaO distribution in the phlogopites, where, forexample, light zones can be enriched or depleted withrespect to the dark zones, suggests that the episodic con-ditions are not just the simple alternation of two uniformfluid compositions or physicochemical conditions. TheBa distribution indicates that each fluid pulse was some-what different with respect to some components. Thisargues for an evolving magmatic fluid or varying degreesof interaction (mixing) with another Ba-rich fluid. It isinteresting to note that the first Ba-rich igneous biotite,containing 7.32 wto/o BaO, was reported by Thompson(1977) ftom a leucitite from the Alban Hills, Italy, a sim-ilar volcanic district in the perpotassic Roman province.Subsequent reported Ba-rich biotites from similar feld-spathoid-bearing volcanic rocks are interpreted as late-crystallizing phases.
Although the element distribution can be zoned withina single phlogopite crystal, the element distribution withrespect to sample location (depth) in the phlogopites andanhydrites also indicates zoning. The stratigraphic inter-val from approximately 2000 to 2200 m shows a generaldepletion of BaO in phlogopite and trace elements in an-hydrite and an enrichment of F in phlogopite. This sug-gests a stratigraphic zone where the presence of a fluidrich in Ba, Sr, and other trace elements was limited. Thisimplies lithologic and/or permeability differences or per-haps a fluid stratification (Oakes, 1985).
The origin and evolution of various S species in geo-thermal systems related to volcanic districts is the subjectof continual investigation and debate (e.g., Kiyosu andKurahashi, 1983). Furthermore, the presence of SO, andstable igneous sulfate minerals (e.g., anhydrite) in magmasand their products has received considerable renewed in-terest, especially after the eruption of El Chich6n in 1982(Luhr et al., 1984). Rye et al. (1984) argued on the basisof stable isotopes that a major source of the high El Chi-ch6n S content (pre-eruption, -2.6 wto/o SO.) must be, inpart, magmatic and thus the S was not entirely remobi-lized from nearby evaporites. The release of SO, as partof the volatile magma fraction degassing from the upperportions of a fractionating magma will eventually allowthe S to become part of a hot ascending aqueous fluid.These S and other volcanic exhalations will participate inreactions with magmatic, connate, and/or meteoricaqueous fluids. Kiyosu and Kurahashi (1983) suggestedthat the sulfate-rich waters in volcanic areas result froma disproportionation reaction of SO, to yield the moreoxidized sulfate species. HrS is also produced and wouldtend to react with available Fe to form, for example, py-rite-a ubiquitous accessory in the SH2 well. Thus, it isreasonable to assume that the S present in the SH2 wellcould be partially magmatic and that appeal to the re-mobilization of Mesozoic evaporites as the sole S sourceis unnecessary. Bertrami et al. (1986) compared the DrsOand d'3C in calcites from various Latium geothermal wellsand their host Mesozoic carbonates. The D'8O of SH2calcites is significantly diferent from the Mesozoic car-bonates, being more than 20Vm lighter. This suggests a
possible magmatic source for the geothermal COr. Cor-tecci et al. (1980) reported that the 63aS values for sulfatefrom the Cesano C-l well brine and anhydrites from theCesano RC-l well show similar values of about * 157o,but quite different 6t8O values of +4.8Vm and *l4.9Vm +0.37m, respectively. The low d'8O value of +4.87@ suggeststhat the origin of the Cesano sulfates may not be just thesimple dissolution and reprecipitation of Upper Triassicsedimentary evaporites.
A detailed S- and Sr-isotope study of the authigenicmineral assemblage in the SH2 well would provide valu-able information on the oriein and evolution of the SH2geothermal fluid.
CoNcrusroNrs
1. Phlogopite and anhydrite (plus pyrite and calcite)occur as authigenic and hydrothermal minerals in fractureand pore-space fillings in the SH2 geothermal well, locatedin the Sabatini volcanic district, Latium, Italy. Also pres-ent in the well, at various levels, are K-feldspar, garnet,vesuvianite, apatite, spinel, pyroxene, wollastonite, wilk-eite, cuspidine, harkerite, cancrinite, and reyerite.
2. The primary fluid inclusions in phlogopite and theprimary and secondary fluid inclusions in anhydrite havevapor-liquid homogenization temperatures similar to themeasured in-hole temperature of the SH2 well. This in-dicates that the minerals are relatively recent and/or thatthe thermal regime has remained stable during the past.The salinity data show a considerable scatter; this and therare occurrence of hydrocarbons and daughter crystalsindicate the presence of fluids with different compositions.Crushing data, clathrate formation, and the rare occur-rence of liquid CO, also indicate that CO, was a commonvolatile species.
3. Detailed microprobe analyses of unzoned and zonedphlogopite crystals that contain primary fluid inclusionsreveal that they have nearly end-member compositions,with Fe/(Fe + Mg) : 0.02 to 0.l, and have variable con-tents of F, BaO, and TiOr. This variability is directlyrelated to the phlogopite zoning and sample location. Thecrystal zoning indicates episodic changes in growth con-ditions whereas the variation with depth also suggestssome kind of lithologic (permeability?) control on growthconditions. e.g.. f luid mixing.
4. Energy-dispersive trace-element analysis of anhydritecrystals shows a relatively high abundance of Sr, Ba, Rb,Ce, and La. The overall variation of anhydrite composi-tion with sample location is similar to that of the variationof phlogopite chemistry with sample location and suggestsa similar and related control in growth conditions.
5. The fluid-inclusion salinity data, the presence ofzonedphlogopites, and the compositional variation among dif-ferent samples ofphlogopite and anhydrite reveal a pictureof episodic and/or changing fluid and/or mineral growthconditions during the evolution of the SH2 geothermalfield. The presence of hot, mineral-rich, ascending solu-tions has effectively reduced the permeability of the host

rock by successive episodes ofdeposition in pore spacesand fractures.
AcrNowr,BocMENTS
The AGIP-ENEL Joint Venture is gratefully acknowledged for supplyingthe samples and drillingdata of the SH2 well. Dr. Jean Dubessy of CREGU(Nancy, France) kindly allowed access and instruction (F. T.) for the laserRaman probe. Financial support to this project for G. C., B. D. V., andF T. was provided by C.N.R., Gruppo Nazionale di Vulcanologia. Wethank Malcom Ross (USGS) for determining the phlogopite crystallog-raphy and John R. Evans (USGS) for the KrvEx analyses. We also thankElaine S. McGee (USGS) and Marta J. K Flohr (USGS) for stimulatingdiscussions conceming phlogopite chemistry. The manuscript benefitedfrom the careful reviews of E. Roedder. M.J K Flohr. and M. A Mc-Kibben.
RnrnnnNcns crrooAllan, J.F, and Carmichael, I.S.E. (1984) Lamprophyric lavas in the Co-
lima graben, SW Mexico. Contributions to Mineralogy and Petrology,88 .203 -216 .
Arima, M., and Edgar, A.D. (1981) Substitution mechanisms and solu-bility oftitanium in phlogopites from rocks ofprobable mantle origrnContributions to Mineralogy and Petrology, 77,288-295.
Bacbinski, S.W., and Simpson, E.L. (1984) Ti-phlogopites of the Shaw'sCove minette: A comparison with micas ofother lamprophyres, potassicrocks, kimberlites, and mantle xenoliths. American Mineralogist, 69,4r-56.
Bailey, J.C. (1977) Fluorine in granitic rocks and melts, a review. ChemicalGeology, 19,142.
Baldi, P., Decandia, F.A.,LazzarcIto, A, and Calamai, A. (1974) Studiogeologico del substrato della copertura vulcanica laziale nella zona deilaghi di Bolsena, Vico e Bracciano Memorie della Societd GeologrcaItaliana. 13. 575-606.
Bargar, K.E., Beeson, M H., Fournier, R O., and Muffier, L.J.P (1973)Present-day deposition oflepidolite from thermal waters in YellowstoneNational Park. American Mineralogist, 58, 901-904.
Baronnet, A., and Velde, B. (1977) Iron content of synthetic phlogopiteas a function ofgrowth rate Earth and Planetary Science Letters, 37,l 50- l 53.
Belkin, HE, De Vivo,8., Roedder, E., and Cortini, M. (1985) Fluidinclusion geobarometry from ejected Mt. Somma-Yesuvius nodules.American Mineralogst, 70, 288-303.
Belkin, H.E., Chelini, W., De Vivo, 8., and Lattanzi, P. (1986) Fluidinclusions in hydrothermal minerals from Mofete 2, Mofete 5 and SanVito 3 geothermal wells, Phlegrean Fields, Campania, Italy. Interna-tional Volcanological Congress, Proceedings of Symposium 5: Volca-nism, Hydrothermal Systems and Related Mineralization, 7-12.
Bertrami, R., Friedman, I., Gleason, J., Lombardi, S., and Pandeli, E.(1986) Isotopic composition of carbon and oxygen in the carbonatematerials present in Italian geothermal wells: On theirgenesis andgeoth-ermometric application. Fifth Intemational Symposium on Water-RockInteraction, Iceland, Extended Abstracts, 56-59.
Blount, C.W , and Dickson, F W. (1969) The solubility of anhydrite (CaSO")in NaCl-HrO from 100 to 450 .C and I to 1000 bars Geochimica etCosmochimica Acta, 33, 227-245.
Bohlen, S.R, Peacor, D.R., and Essene, E.J. (1980) Crystal chemistry ofmetamorphic biotite and its significance in water barometry. AmericanMineralogist, 65,5542
Browne, P.R.L. (1984) Lectures on geothermal geology and petrology. TheUnited Nations University, Geothermal Training Programme, Iceland,Report 1984-2, 92 p
Browne, P.R.L., Roedder, E., and Wodzicki, A. (1976) Comparison ofpast and present geothermal waters, from a study of fluid inclusions,Broadlands field, New Zealand. In J Cadek, and T. Paces, Eds , Pro-ceedings, Intemational symposium on water-rock interaction, Czecho-slovakia, 1974, Geological Survey, Prague, 140-149
Butler, G.P (1973) Strontium geochemistry of modem and ancient cal-cium sulphate minerals. In B.H. Purser, Ed., The Persian Gulf, p. 423-452 Spnnger, Berlin.
795
Calamai, A., Cataldi, R , Dall'Aglio, M., and Ferrara, G.C. (1975) Prelim-inary report on the Cesano hot brine deposit (Northem Latium, Italy).United Nations Symposium ofGeothermal Energy, San Francisco, Cal-i f om ia , 1 ,305 -313
Calamai, A., Fiordelisi, A., Pandeli, E., and Valenti, P. (1985) First ex-ploratory well in the Sabatini area (northern Latium). In A.S. Strub andP. Ungemach, Eds., European geothermal update, p 433439. Pro-ceedings ofthe Third International Seminar on the Results ofEC Geo-thermal Energy Research, Munich, 1983.
Cavarretta, G., and Tecce, F (1987) Contact metasomatic and hydro-thermal minerals in the SH2 deep well, Sabatini volcanic district, La-1ium, Italy, Geothermics, 16, 127-145.
Cavarretta, G., Gianelli, G., and Puxeddu, M. (1982) Formation of au-thigenic minerals and their use as indicators of the physicochemicalparameters ofthe fluid in the Larderello-Travale geothermal field. Eco-nomic Geology, 77 , 107 l-1084.
Cavarretta, G , Gianelli, G , Scandiffio, G., and Tecce, F. (1985) Evolutionof the Latera geotherrnal system II: Metamorphic, hydrothermal min-eral assemblages and fluid chemistry. Journal ofVolcanology and Geo-thermal Research. 26. 337-364.
Collins, P.L.F. (1979) Gas hydrates in COabeanng fluid inclusions andthe use of freezing data for estimation of salinity Economic Geology,74.1435-1444.
Cortecci, G., Bertrami, R., and Ceccarelli, A (1980) Circulation patterns
and geothermometry ofsome Italian spring systems by sulfate isotopesThird International Symposium on Water-Rock Interaction, Edmon-ton, Extended Abstracts, I l5-l 16.
Crawford, M.L. (1981) Phase equilibria in aqueous fluid inclusions. In
L.S. Hollister and M.L. Crauford, Eds., Fluid inclusions: Applicationsto petrology, p 75-100. Mineralogical Association of Canada ShortCourse Handbook.
Cross, W (1897) Igneous rocks ofthe l€ucite Hills and Pilot Butte, Wy-oming. American Journal of Science, fourth series, 4, I I 5-14 I
Cundari, A (1979) Petrogenesis of leucite-bearing lavas in the Romanvolcanic region, Italy: The Sabatini lavas. Contributions to Mineralogyand Petrology, 70, 9-21.
De Rita, D., Funiciello, R., Rossi, U., and Sposato, A. (1983) Structureand evolution ofthe Sacrofano-Baccano caldera, Sabatini volcanic com-plex, Rome Journal ofVolcanology and Geothermal Research, l7 ,219-z ) o .
Dhamelincourt, P., Beny, J.M., Dubessy, J., and Poty, B (1979) Analysesd'inclusions fluides i la microsonde MOLE a effet Raman. Bulletin deMin6ralogie, 102, 600-610
Di Filippo, M, Funiciello, R, and Parotto, M., Eds. (1984) Geologicalmap of the Sabatini area. Conisiglio Nazionale delle Ricerche ProgettoF inalizzato Geodinamica
Di Girolamo, P. (1978) Geotectonic setting of Miocene-Quatemary vol-canism in and around eastern Tyrrhenian Sea border (Italy) as deducedby major element geochemistry. Bulletin Yolcanologiqte, 4243, 229-2s0.
Drummond, S. E., and Ohmoto, H. (1985) Chemical evolution and min-eral deposition in boiling hydrothermal systems. Economic Geology,80, 126-147.
Dymek, R. F. (1983) Titanium, aluminum and interlayer cation substi-tutions in biotite from high-grade gneisses, West Greenland. AmericanMineralogist, 68, 880-899.
Elders, W.A., Hoagland, J R., McDowell, S.D., and Cobo R, J.M (1979)
Hydrothermal mineral zones in the geothermal reservoir of Cerro Pne-to In W.A. Elders, Ed., Geology and geothermics of the Salton Trough,Field Trip no. 7 , p. 3643 Geological Society of America 92nd AnnualMeeting, November 1979.
Exley, R. A., Sills, J. D, and Smith, J. v. (1982) Geochemistry of micasfrom the Finero spinel-lherzolite, Italian Alps. Contributions to Min-eralogy and Petrology, 81, 59-63.
Fisher, J.R. (1976) The volumetric properties ofHrO-A gtaphical por-
trayal U.S Geological Survey Journal ofResearch, 4, 189-193.Flohr, M J.K. (1983) BASIC programs for calculation of cation site oc-
cupancies and plotting ofmineral data with applications for evaluationof metamorphic mineral assemblages. U S. Geological Survey, Open-File Report 83-905, 65 p.
Foley, S.F, Taylor, W.R., and Green, D.H. (1986) The effect of fluorine
BELKIN ET AL.: HYDROTHERMAL PHLOGOPITE AND ANHYDRITE

796
on phase relationships in the system KAlSiOr-MgSiOn-SiO, at 28 kbarand the solution mechanism offluorine in silicate melts. Contributionsto Mineralogy and Petrology, 93,46-55.
Funiciello, R., and Parotto, M. (1978) Il substrato sedimentario nell'areadei Colli Albani: Considerazioni geodinamiche e paleogeografiche delmargine tirrenico dell'Appennino centrale. Geologica Romana, l7 ,233-287.
Gaspar, J.C., and Wyllie, PJ. (1982) Barium phlogopite from the Jacu-piranga carbonatite, Brazll. American Mineralogist, 67, 997-l0OO.
Gunow, A.J, Ludington, S., and Munoz, J.L. (1980) Fluorine in micafrom the Henderson molybdenite deposit, Colorado. Economic Geol-ogy,75, l l27-1137
Haas, J.L., Jr., (1971) The effect of salinity on the maximum thermalgradient of a hydrothermal system at hydrostatic pressure. EconomicGeology, 66,940-946.
Hattori, K., Cameron, E.M., and Smith, R (1985) Occurrence and geo-chemistry of anhydrite in the Hemlo Basin. Geological Association ofCanada and Mineralogical Association ofCanada, Joint Annual Meet-ing 1985, Program with Absfacts, 10, A25.
Hedenquist, J.W., and Henley, R.W. (1985) Effect ofCO, on freezing pointdepression measurements offluidinclusions-Evidencefrom active sys-tems and implications for epithermal ore deposition. Economic Geol-ogy, 80, 1379-1406.
Herrmann, A.G. (1961) Zur Geochimie des Strontiums in den salinarenZechstein abbgerunngun der Stassfurt serie die Subharzbezirkes Chemieder Erde. 21. 137-194.
Higuchi, H., and Nagasawa, H. (1969) Partition of trace elements betweenrock-forming minerals and the host volcanic rocks Eanh and PlanetaryScience Letters. 7. 281-287
Hodge, G., and Norman, D.L (1985) Organic compounds in epithermalore-depositingfluids (abs). In Epithermal Deposits in New Mexico. NewMexico Bureau of Mines and Mineral Resources Circular 199, 53.
Holland, H.D. (1956) The chemical composition of vein minerals and thenature of ore forming fluids Economic Geology, 5 l, 7 81-797 .
Jensen, B.B. (1973) Patterns oftrace element partitioning Geochimica etCosmochimica Acta, 37, 2227 -2242.
Jones, A.P, and Smith, J.V. (1985) Phlogopite and associated mineralsfrom Permian minettes in Devon, South England. Bulletin of the Geo-logical Society of Finland, 57 , part l-2, 89-102.
Keenan, J.H., Keyes, F.G., Hill, P.G., and Moore, J.G (1969) Steamtables: Thermodynamic properties ofwater including yapor, liquid andsolid phases, 162 p. Wiley, New York.
Kiyosu, Y., and Kurahashi, M (1983) Origin of sulfur species in acidsulfate-chloride thermal waters, northeastern Japan. Geochimica etCosmochimica Acra. 47. 1237-1245.
Kozlova, O.G., Stepanova, T.V., and Egorov-Tismenko, Yu.K. (1984)The mica law of twinning and the formation of primary inclusions.Vestnik Moskovskogo Universiteta. Geologiya, 39, no. 3, 52-57 (trans-lated in Moscow University Geology Bulletin, 1984,39, no. 3, 5,t-60)
Kushnir, J. (1982a) The partitioning ofseawater cations during the trans-formation of gypsum to anhydrite. Geochimica et Cosmochimica Acta,46,433446.
- (l 982b) The composition and origin ofbrines during the Messiniandesiccation event in the Mediterranean basin as deduced from concen-trations of ions coprecipitated with gypsum and anhydrite. ChemicalGeology, 35, 333-350.
Luhr, J.F Carmichael, I.S.E., and Varekamp, J.C. (1984) The 1982 erup-tions of El Chich6n volcano, Chiapas, Mexico: Mineralogy and petrol-ogy ofthe anhydrite-bearing pumices. Joumal ofVolcanology and Geo-thermal Research, 23, 69-108.
Matson, D.W., Muenow, D.W., and Garcia, M.O. (1986) Volatile contentsof phlogopite micas from South African kimberlite. Contributions toMineralogy and Petrology, 93, 399408.
McDowell, S.D., and Elders, W.A. (1980) Authigenic layer silicate min-erals in Borehole Elmore l, Salton Sea geothermal field, California,USA. Contributions to Mineralogy and Petrology, 74,293-310.
McGee, J.J (1983) $ANBA, a rapid, combined data acquisition and cor-rection program for the SEMQ electron microprobe U.S. GeologicalSurvey Open-File Report 83-817,45 p
BELKIN ET AL.: HYDROTHERMAL PHLOGOPITE AND ANHYDRITE
Mclntire, W.L. (1963) Trace element partition coefrcients-A review oftheory and application to geology. Geochimica et Cosmochimica Acta,27, 1209-1264.
Morgan, J.W., and Wandless, G.A. (1980) Rare earth element distributionin some hydrothermal minerals: Evidence for crystallographic control.Geochimica et Cosmochimica Acta. 44.973-980.
Munoz, J.L., and Eugster, H.P. (1969) Experimental control offluorinereactions in hydrothermal systems. American Mineralogist, 54, 943-9s9.
Munoz, JL., and Ludington, S. (1974) Fluoride-hydroxyl exchange inbiotite. American Journal of Science, 27 4, 396413
Oakes, C.S. (l 985) Strong salinity gradients in the northeastern part oftheSalton Sea geothermal field, CA: A fluid inclusion and brine chemistrystudy. Geological Society ofAmerica Abstracts with Prograrns, I 7, 679.
Petersen, E.U., Essene, E.J , Peacor, D.R., and Valley, J.W. (1982) Fluorineend-member micas and amphiboles. American Mineralogist, 67, 538-544
Plimer, I.R. (1984) The role of fluorine in submarine exhalative systemswith special reference to Broken Hill, Australia Mineralium Deposita,19, 19-25
PomArleanu, V., and Sabliovschi, V. (1980) Contribution to the geochem-istry of muscovite from Romania 26th Intemational Geological Con-gress, Paris, Abstracts, l, 139.
Potter, R.W., L (1977) Pressure corrections for fluid-inclusion homoge-nization temperatures based on the volumetric properties ofthe systemNaCl-HrO. U.S. Geological Survey Journal ofResearch, 5, 603-607.
Potter, R.W., II, and Brown, D.L. (1977) The volumetric properties ofaqueous sodium chloride solutions from 0'to 500'C at pressures up to2000 bars based on a regression ofavailable data in the literature. U.S.Geological Survey Bulletin l42l-C,36 p.
Purkayastha, B.C., and Chatterjee, A. (1966) On the uptake ofstrontiumtracer by different forms of calcium sulphate. Joumal of the IndianChemical Sociery, 43, 687-.693.
Queen, L.D., and Motyka, R.J. (1984) Changes in the Makushin geother-mal system: Evidence from alteration mineralogy. Geological Societyof America Abstracts with Programs, 16, 329.
Rashkova, D.M. (1981) Zonal phlogopite crystals from the Rossen copper-molybdenum deposit, district ofBourgas Comptes Rendus de I'Acad-6mie Bulgare de Sciences, 34, 1529-1532.
Rim9ite, J. (1969) Evolution ofzoned micas and associated silicates inrhe Oka carbonatite. Contributions to Mineralogy and Petrology, 23,340-360.
Robert, J.L. (1976) Titanium solubility in synthetic phlogopite solid so-lutions. Chemical Geology, 17, 213-227
Roedder, E. (1969) Varvelike banding ofpossible annual origin in celestitecrystals from Clay Center, Ohio, and in other minerals. Amencan Min-eralogist, 5 4, 7 9 6-8 10.
-(1970) Application of an improved crushing microscope stage tostudies ofthe gases in fluid inclusions. Schweizerische Mineralogischeund Petrographische Mitteilungen, 50, part 1, 41-58.
- (1984) Fluid inclusions. Mineralogical Society of America Reviewsin Mineralogy, 12,644 p.
Rogers, N.W., Hawkesworth, C.J., Parker, R.J. and Marsh, J.S. (1985)The geochemistry ofpotassic lavas from Vulsini, central Italy and im-plications for mantle enrichment processes beneath the Roman regionConrributions to Mineralogy and Petrology, 90,244-257.
Rye, R O, Luhr, J.F., and Wasserman, M.D. (1984) Sulfur and oxygenisotopic systematics ofthe 1982 eruptions ofEl Chich6n volcano, Chia-pas, Mexico. Joumal of Volcanology and Geotherrnal Research, 23,r09-t23.
Samartsev, I.T., Ovsyannikov, I.I , and Inshina, V M. (1980) Gypsum-anhydrite mineralization in some gold-ore deposits ofthe Central Urals.Izvestiya Akademii Nauk SSSR: Seriya geologicheskaya, no. 2,70-74.
Sasada, M. (1985) COrbearing fluid inclusions from geothermal fluids.Geothermal Resources Council, Transactions, 9, part l, 351-356.
-(1986) Anhydrite precipitation by low pressure boiling at DW-5drill hole, Hohi geothermal area, Japan: Fluid inclusion evidence andgeological significance. Geothermal Resources Council, Transactions,r0,149-r54.

Schulze, D.J., Smith, J.V., and Ncmec, D. (1985) Mica chemistry of lam-prophyres from the Bohemian massif, Czechoslovakia. Neues Jahrbuchfilr Mineralogie Abhandlungen, | 52, 32 | -33 4.
Shikazono, N , and Holland, H D. (1983) The partitioning of strontiumbetween anhydrite and aqueous solutions from 1 50'to 250'C. EconomicGeology, Monograph 5, 320-328.
Shikazono, N., Holland, H D., and Quirk, R F (1983) Anhydrite in Ku-roko deposits: Mode ofoccurrence and depositional mechanisms Eco-nomic Geology, Monograph 5, 329-344.
Shmakin, B.M. (l 984) Causes and consequences ofhigh contents ofbanumin sheet muscovite and phlogopite. In Non-metallic mineral ores. Pro-ceedings ofthe 27th International Geological Congress, 15,261-271.
Taguchi, S., and Hoyashi, M (1983) Fluid inclusion study in some geo-
thermal fields of Kyushu, Japan. Fourth International Symposium onWater-rock Interaction, Misasa, Japan, Extended Abstracts, 459462.
Thompson, R.N. (1977) Primary basalts and magma genesis III. AlbanHills, Roman comagmatic province, central Italy Contributions to Min-eralogy and Petrology, 60, 9l-108.
Tronnes, R.G, Edgar, A D., and Arima, M (1985) Titanium solubilityin phlogopite: An experimental study on its potential as a P-T indicatorfor upper mantle-lower crustal rocks. Geological Association ofCanadaand Mineralogical Association of Canada Joint Annual Meeting, Pro-gram with Abstracts, 10, A63.
Valley, J.W., Petersen, E.U., Essene, E.J., and Bowman, J.R (1982) Fluor-phlogopite and fluortremolite in Adirondack marbles and calculatedC-O-H-F fluid composition. American Mineralogist, 67, 545-557.
Volfinger, M , Robert, J.-L., Vielzeuf, D., and Nevia, A.M.R. (1985) Struc-tural control of the chlorine content of OH-bearing silicates (mica andamphiboles). Geochimica et Cosmochimica Acta, 49,37-48
Washington,H S (1906) The Roman comagmatic region Camegie Insti-tution Publication no 57, 199 p
Wentlandt, R F (1977) Barium-phlogopite from Haystack Butte, High-
797
wood Mountains, Montana. Carnegie Institution of Washington Year
Book 76, 53+539.Yau, Y.-C , Anovitz, L.M., Essene, E.J, and Peacor, D.R. (1984) Phlog-
opite-chlorite reaction mechanisms and physical conditions during ret-
rograde reactions in the Marble Formation, Franklin, New Jersey. Con-
tributions to Mineralogy and Petrology, 88, 299-306.
Yoder, H S., and Eugster, H.P. (1954) Phlogopite synthesis and stability
range Geochimica et Cosmochimica Acta, 6, 157-185'
Zhang, R. (1986) Sulfur isotopes and pyrite-anhydrite equilibria in a vol-
canic basin hydrothermal system of the middle to lower Yangtze River
Valley Economic Geology, 81,3245.
MANUscRrpr RECEIvED Jr-ms 26, 1987Meruscnrpr ACcEPTED Mmcn 17, 1988
ApprNlrx 1. Pnr-ocoplTE cRYSTALLocRAPHY
A handpicked euhedral phlogopite crystal from 2210 m con-taining primary fluid inclusions but relatively free of trappedsolids was examined by the single-crystal precession technique.The unit-cell data (Malcolm Ross, pers. comm., 1986) for the2210-m crystal based on Buerger precession single-crystal pho-
tographs of the h\L h3h1, h3h\lkl hhl, afld hhl nets are 4 :
5 .318, D :9 .228,c : 10 .070A, B : l }1 .2 ,spacegroup : C2/m.The crystal examined is twinned by spiral +60'rotations of
the individual layers (twinning about [l 10] and [1 10]). The spacegrotrp, C2/m, corresponds to the 1M form. The /M form occursthroughout the entire range ofgeologic, physical, and chemicalconditions (Yoder and Eugster, 1954).
BELKIN ET AL.: HYDROTHERMAL PHLOGOPITE AND ANHYDRITE