Embed Size (px)
Citation preview

103
Journal of Environmental
Informatics
ISEIS
Journal of Environmental Informatics 20(2) 103-114 (2012)
www.iseis.org/jei
Spatiotemporal Dynamics and Urban Land-Use Transformation in the Rapid Urbanization of the Shanghai Metropolitan Area in the 1980s–2000s
X. W. Li*, C. Liang, J. B. Shi, and M. D. Li
State Key Laboratory of Water Environment Simulation, School of Environment, Beijing Normal University, Beijing 100875, China
Received 8 May 2011; revised 30 June 2012; accepted 7 August 2012; published online 27 September 2012
ABSTRACT. As one of the world’s largest cities, Shanghai has undergone rapid urbanization over the past two decades. This process has been characterized by high intensity and extreme heterogeneity in its spatiotemporal dynamics, and it has been driven by various transformation processes of nonurban to urban land use. However, the spatiotemporal dynamics of this unique, rapid urbanization has not been adequately addressed, and the contribution of the urban transformation process to regional urbanization has likewise not been targeted. The present study aimed to examine the urbanization dynamics in Shanghai by measuring the magnitude and spatiotemporal heterogeneity of two major forms of urban land uses—high- and low-density constructed areas. The complexity in the urban transformation process and its contribution to regional urbanization were also investigated. Four time-successive Landsat Thematic Mapper (TM) image datasets were used, and a GIS-based gridding system combined with the urbanization intensity index was employed to measure and analyze the spatiotemporal characteristics of urbanization in the Shanghai metropolitan area from 1987 to 2000. We identified 34 types of urban land-use transformation and compared their effects on urbanization based on area contribution and transformation frequency. A neighboring index was introduced to measure the spatial interactions among those types of urban land-use transformation and reveal the formation and evolution of urban land use in urbanization. We expect that our research can make a contribution in the monitoring and detection of urbanization using remote sensing and GIS approaches. Keywords: urbanization, spatiotemporal dynamics, urban land-use transformation, spatial interactions, Shanghai
1. Introduction
The urbanization dynamics reflects economic, environ- mental, technological, and social processes, all of which are shaped by the evolving urban spatial structure (Potter and Unwin, 1995; Swenson and Franklin, 2000). The strategies of smart growth and sustainable development of urban regions depend upon improvements in our knowledge of the causes, chronology, and impacts of the process of urbanization and its driving forces (Paul and Meyer, 2001; Mckinney, 2006; Weng, 2007; Reilly et al., 2009). Hence, the morphology and evolu- tion of cities due to urban sprawl have long been a hot topic in geographic research and urban planning in an effort to under- stand, represent, and model the complex urban system (Dou- glass, 1998; Gaubatz, 1999; Herold et al., 2003; Liu and Phinn, 2003; Antrop, 2004; Sudhira et al., 2004; Bryant, 2006; Solon, 2009; Sante et al., 2010; Zhang et al., 2011).
Research in the fields of urban geography, ecosystems, and modeling has been conducted for some time (Grimm et al., 2000; Zipperer et al., 2000; Yang et al., 2004; Herold et al., * Corresponding author. Tel.: +86 10 58802797; fax: +86 10 58802797.
E-mail address: [email protected] (X. W. Li). ISSN: 1726-2135 print/1684-8799 online © 2012 ISEIS All rights reserved. doi:10.3808/jei.201200224
2005; Catalán et al., 2008; Deng et al., 2009; Arribas-Bel et al., 2011). New sources of spatial data and innovative tech- niques have the potential of significantly improving the analy- sis, understanding, presentation, and modeling of urban dyna- mics (Martinuzzi et al., 2006; Schwarz, 2010; Zhang and Seto, 2011). The technique of combining remotely sensed data with landscape metrics and urban-rural gradient analysis is com- monly used to investigate how urbanization is changing the ecological patterns and processes across the landscape (Mc- Donnell and Pickett, 1990; Medley et al., 1995; Luck and Wu, 2002; Hahs et al., 2006; Weng, 2007; Kroll et al., 2012). The gradient paradigm, which integrates ecological, social, and physical variables from different disciplines, has proved a useful tool in studying the urban morphology and ecological consequences of urbanization (McDonnell and Pickett, 1990; Medley et al., 1995; Foresman et al., 1997; Luck and Wu, 2002).
However, the transecting gradient paradigm has limita- tions in characterizing the complexity of urbanization dynami- cs and the diversity of driving forces, especially in a metro- politan area where the regional urbanization process is charac- terized by great spatiotemporal heterogeneity. The transect selection of different parts of the study area cannot satisfacto- rily depict such a complex regional urbanization since it is ne- cessary to examine the overall spatiotemporal characteristics of the urbanization process. In addition, urban expansion is
X. W. Li et al. / Journal of Environmental Informatics 20(2) 103-114 (2012)
104
the most prominent morphological dynamic feature in urbani- zation, being principally determined by the transformation of non-urban to urban land use. And the analysis of urban land- use transformation can be employed to track the origin, for- mation, and evolution of existing urban land use. However, such studies have hitherto seldom been documented.
Accompanied by fast socioeconomic development, China has experienced rapid urbanization over recent decades, and this has led to significant landscape changes (Lieberthal, 1995; Yeung, 1998; Zhou and Ma, 2000; Liu et al., 2002; Tian et al., 2005; Deng et al., 2009; Frakias and Seto, 2009; Su et al., 2010; Chen et al. 2011). Large tracts of agricultural land have been transformed into urban areas, and the impacts of the landscape change on the environment have been significant (Zhou et al., 2004; Zhao et al., 2006; Wei and Zhao, 2009; Siciliano, 2012). Research has been conducted on the urba- nization and consequential land-cover change for such cities in China as Beijing (Gu, 1999; Liu et al., 2000; He et al., 2002; Xie and Fan, 2003; Wu et al., 2006; Zhao, 2011), Shanghai (Zhao et al., 2006; Zhu et al., 2006; Wang et al., 2008; Han et al., 2009; Li et al., 2009; Li et al., 2010), Guangzhou (Seto et al., 2002; Weng, 2002; Yang et al., 2004; Yu and Ng, 2007), Shenzhen (Shi et al., 2000; Sui and Zeng, 2001; Gong et al., 2012), Shijiazhuang and Chengdu (Schneider et al., 2005; Xiao et al., 2006), Lhasa (Zhang et al., 2000), and compa- rative research among them (Gaubatz, 1999). These studies have investigated urban landscape patterns, urban socioecono- mic structure, urbanization scenarios, and associated environ- mental issues, such as water and air pollution, heat island effects, and urban biodiversity loss. However, these studies have not adequately addressed the urbanization process itself, especially the issue about how to measure the magnitude and spatiotemporal characteristics of urbanization and the contri- bution of urban land-use transformation to urbanization.
Located at the Yangtze River estuarine area along the ea- stern coast of China and having an administrative area of near- ly 6400 km2, Shanghai is one of the country’s largest and most important industrial and economic centers. Shanghai has ex- perienced rapid urban expansion over the past 30 years; this was driven by China’s economic reform and the establishment of the Shanghai Pudong New District in the 1990s. The built- up area of the Shanghai city center increased from 149.85 km2 in 1982 to 377.56 km2 in 2000 (Shanghai Municipal Statistics Bureau, 2004); its population climbed to 16.74 million in 2000, with a net increase of 3.4 million people since 1990 (Shanghai Municipal Statistics Bureau, 2004). This rapid ur- banization in Shanghai from the 1980s to 2000s reflects the spatial configuration of a new metropolitan expansion pattern, and it lends itself well to urban geographic, urban landscape ecological, and urban ecosystem and environmental studies (Wang and Deng, 2001; Ren et al., 2003; Zeng et al., 2005; Zhao et al., 2006; Zhu et al., 2006).
In those studies of Shanghai’s urban landscape, transec- ting gradient analysis integrated with landscape pattern metri- cs was used to quantitatively characterize the landscape and urbanization pattern and to study the impacts of road corridors on that pattern (Zhu et al., 2006). Most recently, Li et al. (2011) innovatively employed geographic information system (GIS)-based buffer analysis to quantify the overall spatiotem- poral dynamics of urban expansion, depicting the distance- dependent characteristics of urbanization and revealing the in- teractions between urbanization of the central city and its major
satellite cities. Although by capturing the full spatiotemporal patterns of urban growth for the central and satellite cities, this study largely overcame the selection bias of research that employed transecting gradient analysis, Li et al.’s study still failed to examine the contribution made by urban land-use
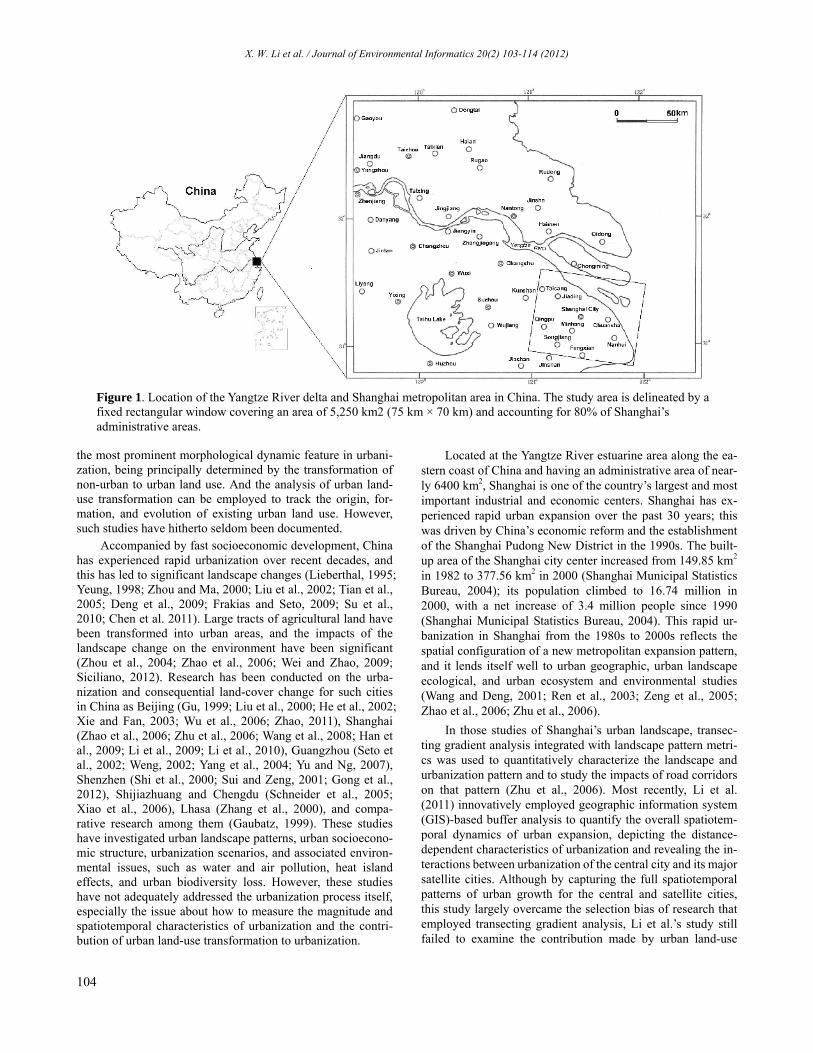
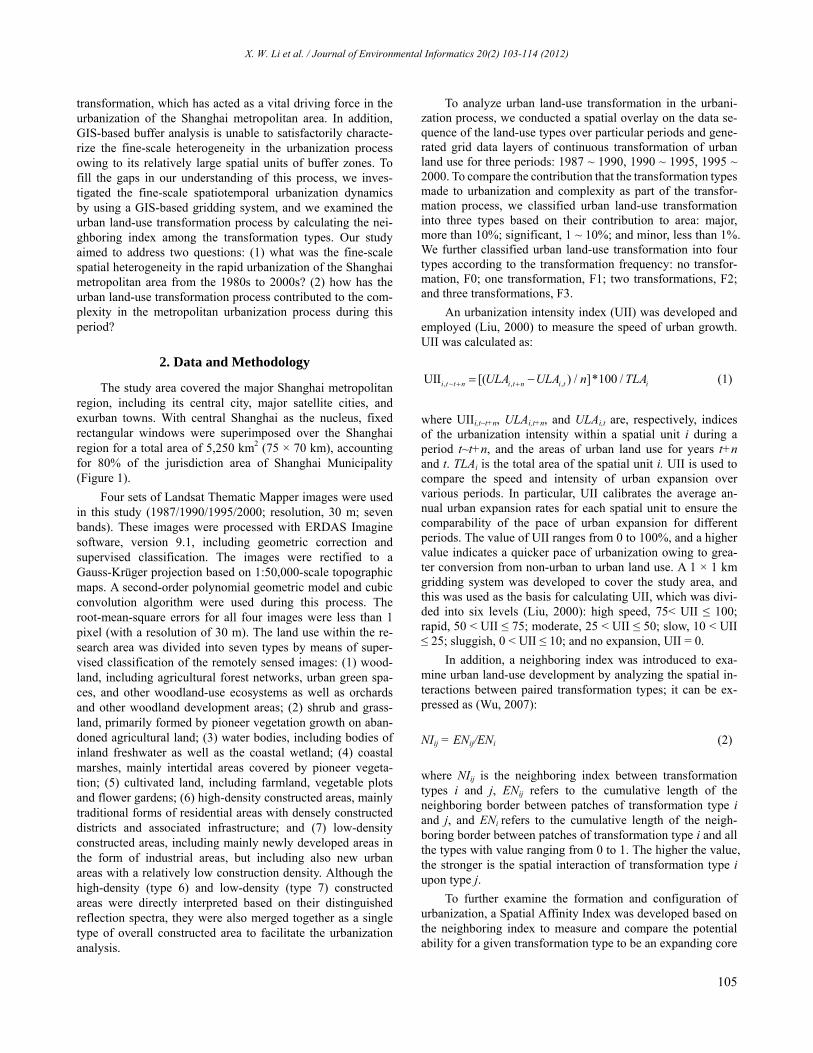
Figure 1. Location of the Yangtze River delta and Shanghai metropolitan area in China. The study area is delineated by a fixed rectangular window covering an area of 5,250 km2 (75 km × 70 km) and accounting for 80% of Shanghai’s administrative areas.
X. W. Li et al. / Journal of Environmental Informatics 20(2) 103-114 (2012)
105
transformation, which has acted as a vital driving force in the urbanization of the Shanghai metropolitan area. In addition, GIS-based buffer analysis is unable to satisfactorily characte- rize the fine-scale heterogeneity in the urbanization process owing to its relatively large spatial units of buffer zones. To fill the gaps in our understanding of this process, we inves- tigated the fine-scale spatiotemporal urbanization dynamics by using a GIS-based gridding system, and we examined the urban land-use transformation process by calculating the nei- ghboring index among the transformation types. Our study aimed to address two questions: (1) what was the fine-scale spatial heterogeneity in the rapid urbanization of the Shanghai metropolitan area from the 1980s to 2000s? (2) how has the urban land-use transformation process contributed to the com- plexity in the metropolitan urbanization process during this period?
2. Data and Methodology
The study area covered the major Shanghai metropolitan region, including its central city, major satellite cities, and exurban towns. With central Shanghai as the nucleus, fixed rectangular windows were superimposed over the Shanghai region for a total area of 5,250 km2 (75 × 70 km), accounting for 80% of the jurisdiction area of Shanghai Municipality (Figure 1).
Four sets of Landsat Thematic Mapper images were used in this study (1987/1990/1995/2000; resolution, 30 m; seven bands). These images were processed with ERDAS Imagine software, version 9.1, including geometric correction and supervised classification. The images were rectified to a Gauss-Krüger projection based on 1:50,000-scale topographic maps. A second-order polynomial geometric model and cubic convolution algorithm were used during this process. The root-mean-square errors for all four images were less than 1 pixel (with a resolution of 30 m). The land use within the re- search area was divided into seven types by means of super- vised classification of the remotely sensed images: (1) wood- land, including agricultural forest networks, urban green spa- ces, and other woodland-use ecosystems as well as orchards and other woodland development areas; (2) shrub and grass- land, primarily formed by pioneer vegetation growth on aban- doned agricultural land; (3) water bodies, including bodies of inland freshwater as well as the coastal wetland; (4) coastal marshes, mainly intertidal areas covered by pioneer vegeta- tion; (5) cultivated land, including farmland, vegetable plots and flower gardens; (6) high-density constructed areas, mainly traditional forms of residential areas with densely constructed districts and associated infrastructure; and (7) low-density constructed areas, including mainly newly developed areas in the form of industrial areas, but including also new urban areas with a relatively low construction density. Although the high-density (type 6) and low-density (type 7) constructed areas were directly interpreted based on their distinguished reflection spectra, they were also merged together as a single type of overall constructed area to facilitate the urbanization analysis.
To analyze urban land-use transformation in the urbani- zation process, we conducted a spatial overlay on the data se- quence of the land-use types over particular periods and gene- rated grid data layers of continuous transformation of urban land use for three periods: 1987 ~ 1990, 1990 ~ 1995, 1995 ~ 2000. To compare the contribution that the transformation types
made to urbanization and complexity as part of the transfor- mation process, we classified urban land-use transformation into three types based on their contribution to area: major, more than 10%; significant, 1 ~ 10%; and minor, less than 1%. We further classified urban land-use transformation into four types according to the transformation frequency: no transfor- mation, F0; one transformation, F1; two transformations, F2; and three transformations, F3.
An urbanization intensity index (UII) was developed and employed (Liu, 2000) to measure the speed of urban growth. UII was calculated as:
, ~ , ,UII [( ) / ]*100 /i t t n i t n i t iULA ULA n TLA (1)
where UIIi,t~t+n, ULAi,t+n, and ULAi,t are, respectively, indices of the urbanization intensity within a spatial unit i during a period t~t+n, and the areas of urban land use for years t+n and t. TLAi is the total area of the spatial unit i. UII is used to compare the speed and intensity of urban expansion over various periods. In particular, UII calibrates the average an- nual urban expansion rates for each spatial unit to ensure the comparability of the pace of urban expansion for different periods. The value of UII ranges from 0 to 100%, and a higher value indicates a quicker pace of urbanization owing to grea- ter conversion from non-urban to urban land use. A 1 × 1 km gridding system was developed to cover the study area, and this was used as the basis for calculating UII, which was divi- ded into six levels (Liu, 2000): high speed, 75< UII ≤ 100; rapid, 50 < UII ≤ 75; moderate, 25 < UII ≤ 50; slow, 10 < UII ≤ 25; sluggish, 0 < UII ≤ 10; and no expansion, UII = 0.
In addition, a neighboring index was introduced to exa- mine urban land-use development by analyzing the spatial in- teractions between paired transformation types; it can be ex- pressed as (Wu, 2007):
NIij = ENij/ENi (2)
where NIij is the neighboring index between transformation types i and j, ENij refers to the cumulative length of the neighboring border between patches of transformation type i and j, and ENi refers to the cumulative length of the neigh- boring border between patches of transformation type i and all the types with value ranging from 0 to 1. The higher the value, the stronger is the spatial interaction of transformation type i upon type j.
To further examine the formation and configuration of urbanization, a Spatial Affinity Index was developed based on the neighboring index to measure and compare the potential ability for a given transformation type to be an expanding core
X. W. Li et al. / Journal of Environmental Informatics 20(2) 103-114 (2012)
106
in urbanization:
SAj = ΣNIij (3)
where SAj is the spatial affinity index of transformation type j and ΣNIij is the sum of the neighboring index of other transformation types i that are borne by transformation type j, with values ranging from 0 to j. A higher value indicates a stronger spatial affinity of a given transformation type to the others, with a greater potential of being an expanding core in the urbanization process.
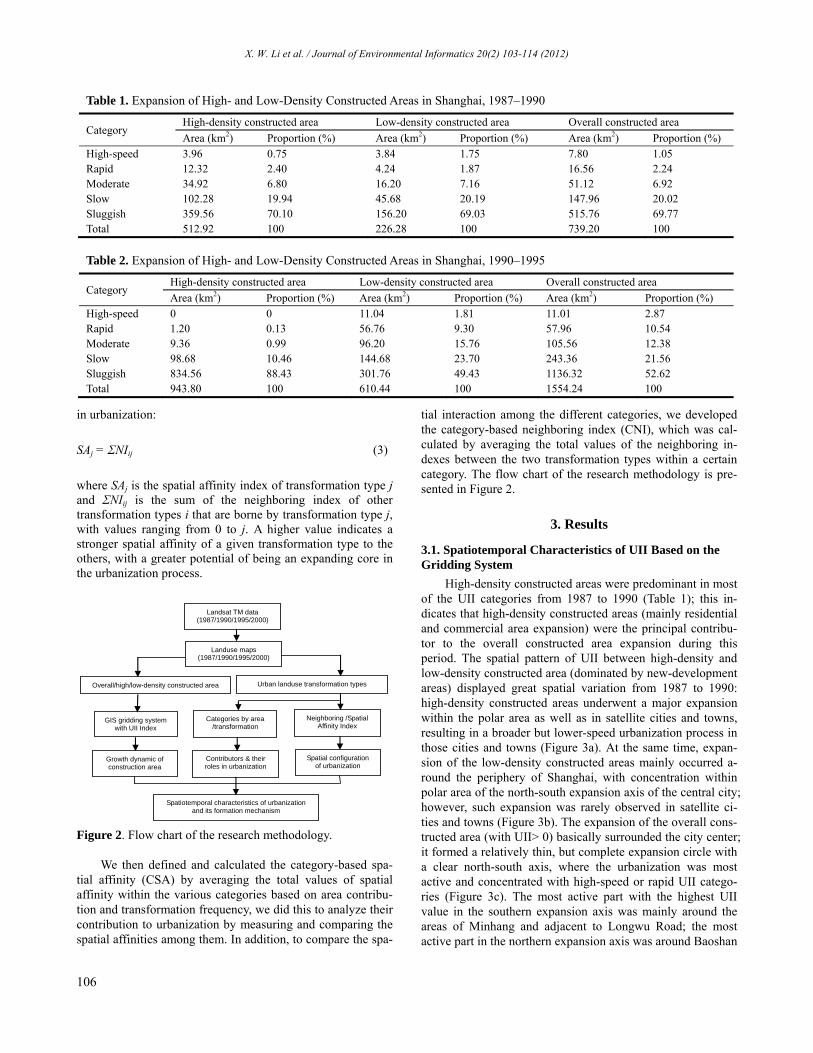
Spatiotemporal characteristics of urbanization and its formation mechanism
Landsat TM data (1987/1990/1995/2000)
Landuse maps (1987/1990/1995/2000)
Growth dynamic of construction area
GIS gridding system with UII Index
Overall/high/low-density constructed area Urban landuse transformation types
Categories by area /transformation
Contributors & their roles in urbanization
Neighboring /Spatial Affinity Index
Spatial configuration of urbanization
Figure 2. Flow chart of the research methodology.
We then defined and calculated the category-based spa- tial affinity (CSA) by averaging the total values of spatial affinity within the various categories based on area contribu- tion and transformation frequency, we did this to analyze their contribution to urbanization by measuring and comparing the spatial affinities among them. In addition, to compare the spa-
tial interaction among the different categories, we developed the category-based neighboring index (CNI), which was cal- culated by averaging the total values of the neighboring in- dexes between the two transformation types within a certain category. The flow chart of the research methodology is pre- sented in Figure 2.
3. Results
3.1. Spatiotemporal Characteristics of UII Based on the Gridding System
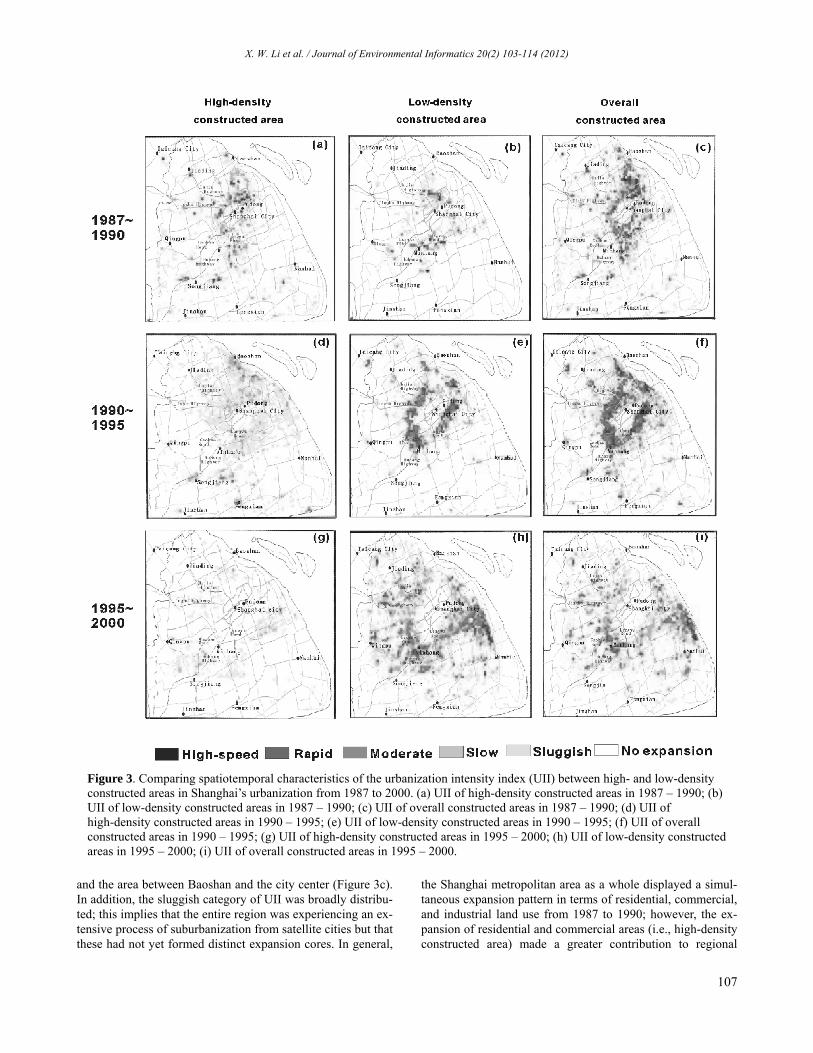
High-density constructed areas were predominant in most of the UII categories from 1987 to 1990 (Table 1); this in- dicates that high-density constructed areas (mainly residential and commercial area expansion) were the principal contribu- tor to the overall constructed area expansion during this period. The spatial pattern of UII between high-density and low-density constructed area (dominated by new-development areas) displayed great spatial variation from 1987 to 1990: high-density constructed areas underwent a major expansion within the polar area as well as in satellite cities and towns, resulting in a broader but lower-speed urbanization process in those cities and towns (Figure 3a). At the same time, expan- sion of the low-density constructed areas mainly occurred a- round the periphery of Shanghai, with concentration within polar area of the north-south expansion axis of the central city; however, such expansion was rarely observed in satellite ci- ties and towns (Figure 3b). The expansion of the overall cons- tructed area (with UII> 0) basically surrounded the city center; it formed a relatively thin, but complete expansion circle with a clear north-south axis, where the urbanization was most active and concentrated with high-speed or rapid UII catego- ries (Figure 3c). The most active part with the highest UII value in the southern expansion axis was mainly around the areas of Minhang and adjacent to Longwu Road; the most active part in the northern expansion axis was around Baoshan
Table 1. Expansion of High- and Low-Density Constructed Areas in Shanghai, 1987–1990
Category High-density constructed area Low-density constructed area Overall constructed area
Area (km2) Proportion (%) Area (km2) Proportion (%) Area (km2) Proportion (%) High-speed 3.96 0.75 3.84 1.75 7.80 1.05 Rapid 12.32 2.40 4.24 1.87 16.56 2.24 Moderate 34.92 6.80 16.20 7.16 51.12 6.92 Slow 102.28 19.94 45.68 20.19 147.96 20.02 Sluggish 359.56 70.10 156.20 69.03 515.76 69.77 Total 512.92 100 226.28 100 739.20 100
Table 2. Expansion of High- and Low-Density Constructed Areas in Shanghai, 1990–1995
Category High-density constructed area Low-density constructed area Overall constructed area
Area (km2) Proportion (%) Area (km2) Proportion (%) Area (km2) Proportion (%) High-speed 0 0 11.04 1.81 11.01 2.87 Rapid 1.20 0.13 56.76 9.30 57.96 10.54 Moderate 9.36 0.99 96.20 15.76 105.56 12.38 Slow 98.68 10.46 144.68 23.70 243.36 21.56 Sluggish 834.56 88.43 301.76 49.43 1136.32 52.62 Total 943.80 100 610.44 100 1554.24 100
X. W. Li et al. / Journal of Environmental Informatics 20(2) 103-114 (2012)
107
and the area between Baoshan and the city center (Figure 3c). In addition, the sluggish category of UII was broadly distribu- ted; this implies that the entire region was experiencing an ex- tensive process of suburbanization from satellite cities but that these had not yet formed distinct expansion cores. In general,
the Shanghai metropolitan area as a whole displayed a simul- taneous expansion pattern in terms of residential, commercial, and industrial land use from 1987 to 1990; however, the ex- pansion of residential and commercial areas (i.e., high-density constructed area) made a greater contribution to regional
Figure 3. Comparing spatiotemporal characteristics of the urbanization intensity index (UII) between high- and low-density constructed areas in Shanghai’s urbanization from 1987 to 2000. (a) UII of high-density constructed areas in 1987 – 1990; (b) UII of low-density constructed areas in 1987 – 1990; (c) UII of overall constructed areas in 1987 – 1990; (d) UII of high-density constructed areas in 1990 – 1995; (e) UII of low-density constructed areas in 1990 – 1995; (f) UII of overall constructed areas in 1990 – 1995; (g) UII of high-density constructed areas in 1995 – 2000; (h) UII of low-density constructed areas in 1995 – 2000; (i) UII of overall constructed areas in 1995 – 2000.
X. W. Li et al. / Journal of Environmental Informatics 20(2) 103-114 (2012)
108
urbanization. The expansion of the industrial development area (low-density constructed area) was at a relatively small scale and was close to the city center from 1987 to 1990.
The expansion of the high-density constructed area pre- sented a very different picture in 1990 ~ 1995 (Table 2, Figure 3d), characterized by a sharp drop almost without high-speed and rapid classes. UII of the sluggish and slow classes, how- ever, saw clear increases, indicating that high-density constru- cted area occurred at a broader scale with lower intensity. By contrast, the UII distribution of the low-density constructed area dominated by industrial land use increased significantly for all UII categories in 1990 ~ 1995 compared with the previ- ous period (Table 2, Figure 3e). During 1990 ~ 1995, the rapid and high-speed classes contributed substantially to the expan- sion of the overall constructed area. The urban expansion cir- cles (spatial units with a higher UII value) basically surround- ed the urban fringe, and they were greatly increased compared with the previous period, especially the Pudong New District became the most actively urbanizing area. Low-density cons- tructed areas (dominated by new-development zones) in 1990 ~ 1995 showed large-scale and highly intense expansion, and these areas maintained a vigorous expansion momentum (Fig- ure 3e). The spatial pattern of high-density constructed area expansion mostly fell into the sluggish category during this period. Such expansion was mainly distributed in suburban areas, which indicates that the large-scale expansion of tradi- tional high-density residential areas in the city center was gradually being replaced by small-scale, scattered constructed areas in some satellite cities and exurban towns (Figure 3d). The overall constructed area exhibited a more complete ex- panding circle, with a significant increase in both the north- south and east-west directions (Figure 3f). In 1990 ~ 1995,
some high-speed class distribution appeared in the form of expanding circles, whereby the suburban central business district (CBD) was gradually formed owing to suburbaniza- tion driven by the satellite cities, this implies that during this period Shanghai was evolving from a single CBD in the central city to multiple business districts, which also occured in its suburban area. In addition, expansion of the overall constructed area along some main transportation arteries was also evident during this period.
In 1995 ~ 2000, high-density constructed areas continued to decrease in terms of both scale and intensity (Table 3, Figure 3g), which led to the disappearance of the high-speed and rapid category distribution. However, during this period, the sluggish category distribution area increased to 92.98%.
Low-density constructed area expansion still contributed lar- gely to the overall urban growth in 1995 ~ 2000, and a great decrease in the high-speed and rapid class area and an increa- se in the sluggish and slow category areas were evident (Table 3, Figure 3h). During this period, the high-speed and rapid categories of the overall constructed area were mostly concen- trated within the Pudong New District instead of the northern part of the expansion axis, where the urbanization process was basically complete (Figure 3i). Compared with 1990 ~ 1995, expansion of the overall constructed area exhibited a diffuse and broad spatial pattern in 1995 ~ 2000, this large-scale but low-intensity urbanization in the suburbs and exurbs conse- quently led to a complex metropolitan urban system composed of the central city, satellite cities, and exurban towns.
3.2. Urban Land-Use Transformation Types Based on Area
Contribution
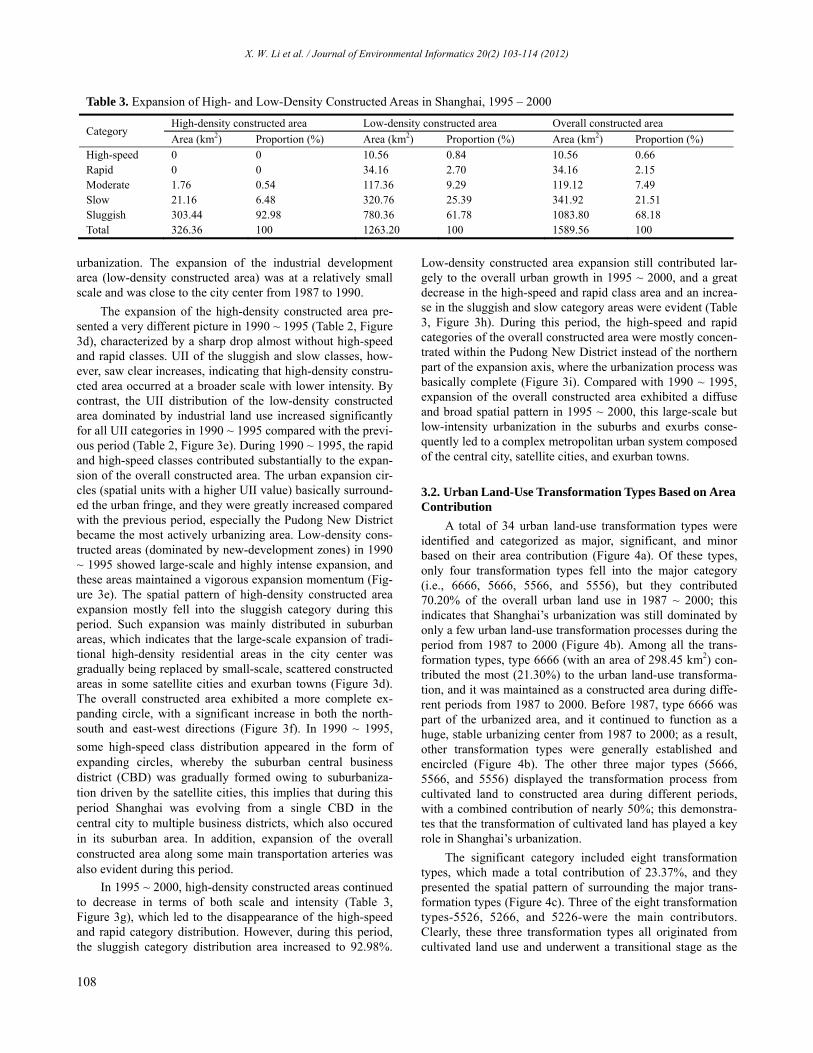
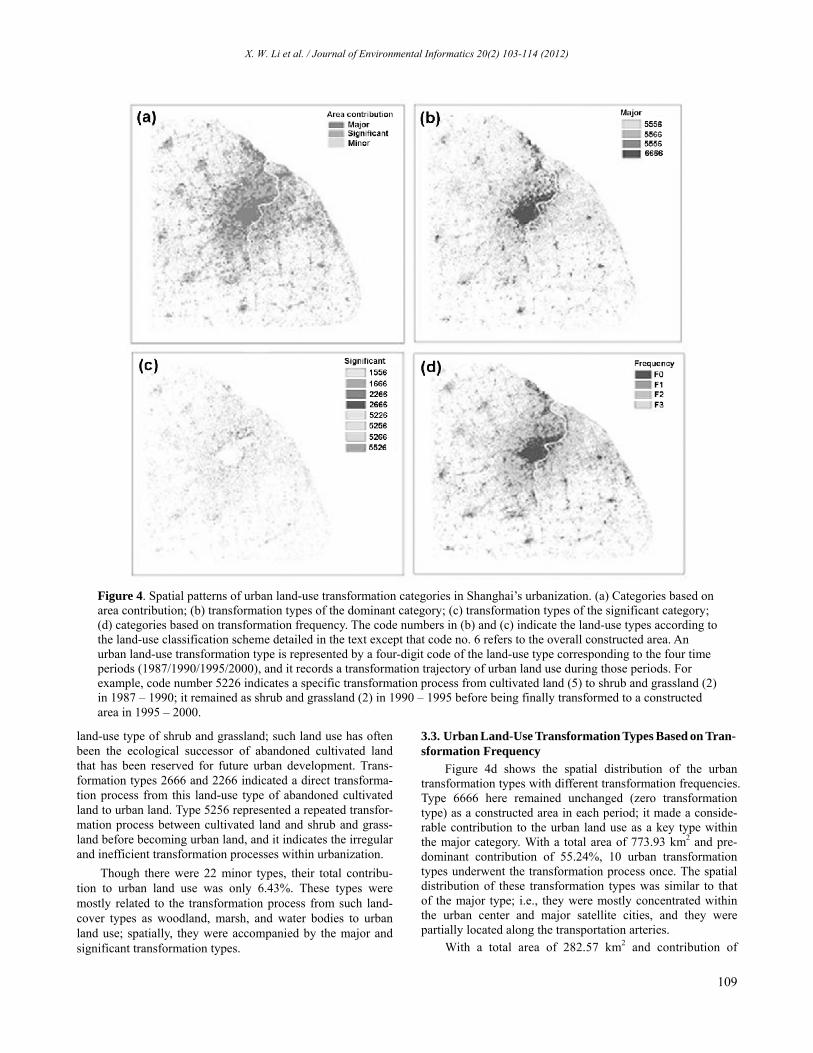
A total of 34 urban land-use transformation types were identified and categorized as major, significant, and minor based on their area contribution (Figure 4a). Of these types, only four transformation types fell into the major category (i.e., 6666, 5666, 5566, and 5556), but they contributed 70.20% of the overall urban land use in 1987 ~ 2000; this indicates that Shanghai’s urbanization was still dominated by only a few urban land-use transformation processes during the period from 1987 to 2000 (Figure 4b). Among all the trans- formation types, type 6666 (with an area of 298.45 km2) con- tributed the most (21.30%) to the urban land-use transforma- tion, and it was maintained as a constructed area during diffe- rent periods from 1987 to 2000. Before 1987, type 6666 was part of the urbanized area, and it continued to function as a huge, stable urbanizing center from 1987 to 2000; as a result, other transformation types were generally established and encircled (Figure 4b). The other three major types (5666, 5566, and 5556) displayed the transformation process from cultivated land to constructed area during different periods, with a combined contribution of nearly 50%; this demonstra- tes that the transformation of cultivated land has played a key role in Shanghai’s urbanization.
The significant category included eight transformation types, which made a total contribution of 23.37%, and they presented the spatial pattern of surrounding the major trans- formation types (Figure 4c). Three of the eight transformation types-5526, 5266, and 5226-were the main contributors. Clearly, these three transformation types all originated from cultivated land use and underwent a transitional stage as the
Table 3. Expansion of High- and Low-Density Constructed Areas in Shanghai, 1995 – 2000
Category High-density constructed area Low-density constructed area Overall constructed area
Area (km2) Proportion (%) Area (km2) Proportion (%) Area (km2) Proportion (%) High-speed 0 0 10.56 0.84 10.56 0.66 Rapid 0 0 34.16 2.70 34.16 2.15 Moderate 1.76 0.54 117.36 9.29 119.12 7.49 Slow 21.16 6.48 320.76 25.39 341.92 21.51 Sluggish 303.44 92.98 780.36 61.78 1083.80 68.18 Total 326.36 100 1263.20 100 1589.56 100
X. W. Li et al. / Journal of Environmental Informatics 20(2) 103-114 (2012)
109
land-use type of shrub and grassland; such land use has often been the ecological successor of abandoned cultivated land that has been reserved for future urban development. Trans- formation types 2666 and 2266 indicated a direct transforma- tion process from this land-use type of abandoned cultivated land to urban land. Type 5256 represented a repeated transfor- mation process between cultivated land and shrub and grass- land before becoming urban land, and it indicates the irregular and inefficient transformation processes within urbanization.
Though there were 22 minor types, their total contribu- tion to urban land use was only 6.43%. These types were mostly related to the transformation process from such land- cover types as woodland, marsh, and water bodies to urban land use; spatially, they were accompanied by the major and significant transformation types.
3.3. Urban Land-Use Transformation Types Based on Tran-
sformation Frequency
Figure 4d shows the spatial distribution of the urban transformation types with different transformation frequencies. Type 6666 here remained unchanged (zero transformation type) as a constructed area in each period; it made a conside- rable contribution to the urban land use as a key type within the major category. With a total area of 773.93 km2 and pre- dominant contribution of 55.24%, 10 urban transformation types underwent the transformation process once. The spatial distribution of these transformation types was similar to that of the major type; i.e., they were mostly concentrated within the urban center and major satellite cities, and they were partially located along the transportation arteries.
With a total area of 282.57 km2 and contribution of
Figure 4. Spatial patterns of urban land-use transformation categories in Shanghai’s urbanization. (a) Categories based on area contribution; (b) transformation types of the dominant category; (c) transformation types of the significant category; (d) categories based on transformation frequency. The code numbers in (b) and (c) indicate the land-use types according to the land-use classification scheme detailed in the text except that code no. 6 refers to the overall constructed area. An urban land-use transformation type is represented by a four-digit code of the land-use type corresponding to the four time periods (1987/1990/1995/2000), and it records a transformation trajectory of urban land use during those periods. For example, code number 5226 indicates a specific transformation process from cultivated land (5) to shrub and grassland (2) in 1987 – 1990; it remained as shrub and grassland (2) in 1990 – 1995 before being finally transformed to a constructed area in 1995 – 2000.
X. W. Li et al. / Journal of Environmental Informatics 20(2) 103-114 (2012)
110
20.17%, 15 types underwent the transformation process twice. Among them, three main contributors (area contribution 77.88%) were from the significant category (i.e., 5526, 5266, and 5226). The contribution from other types in this category was very low and mostly consisted of the minor transforma- tion types. The spatial distribution of the twice-transformed category generally surrounded that of the once-transformed category, and it exhibited a broader, scattered distribution pa- ttern.
With a total area of 45.99 km2 and contribution of 3.28%, eight transformation types underwent the transformation pro- cess three times. Except for significant-type 5256, they were all within the minor category, and they underwent repeated transformations between agricultural land use and such other uses as woodlands, shrub and grassland, coastal marsh, and water bodies before being transformed to urban land use. The- se transformation types generally showed a scattered, disorga- nized distribution within suburbs or exurb towns.
3.4. Spatial Interactions among Urban Land-Use Transfor- mation Types
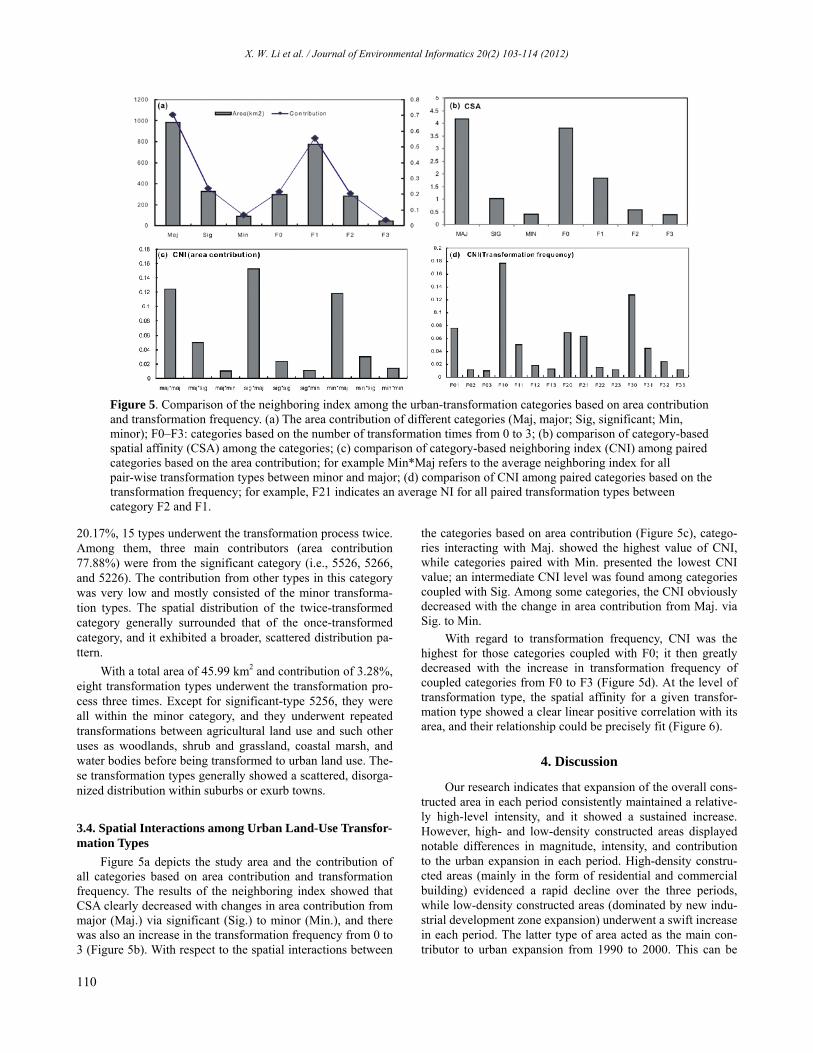
Figure 5a depicts the study area and the contribution of all categories based on area contribution and transformation frequency. The results of the neighboring index showed that CSA clearly decreased with changes in area contribution from major (Maj.) via significant (Sig.) to minor (Min.), and there was also an increase in the transformation frequency from 0 to 3 (Figure 5b). With respect to the spatial interactions between
the categories based on area contribution (Figure 5c), catego- ries interacting with Maj. showed the highest value of CNI, while categories paired with Min. presented the lowest CNI value; an intermediate CNI level was found among categories coupled with Sig. Among some categories, the CNI obviously decreased with the change in area contribution from Maj. via Sig. to Min.
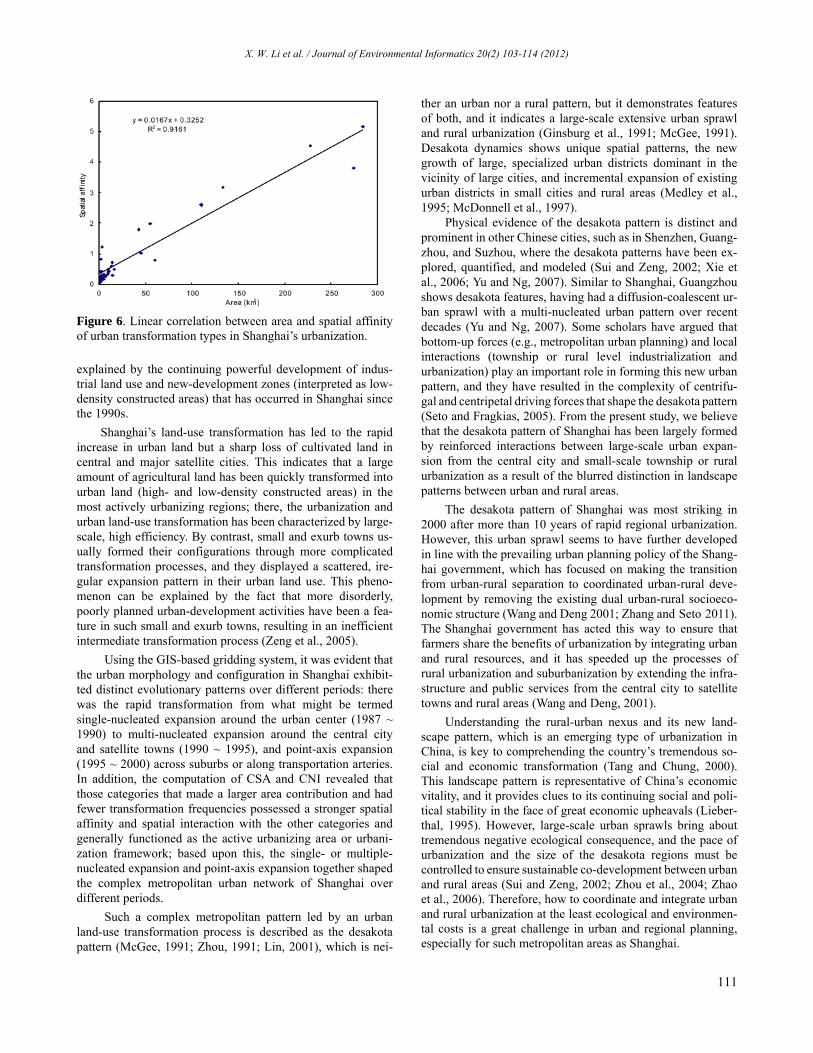
With regard to transformation frequency, CNI was the highest for those categories coupled with F0; it then greatly decreased with the increase in transformation frequency of coupled categories from F0 to F3 (Figure 5d). At the level of transformation type, the spatial affinity for a given transfor- mation type showed a clear linear positive correlation with its area, and their relationship could be precisely fit (Figure 6).
4. Discussion
Our research indicates that expansion of the overall cons- tructed area in each period consistently maintained a relative- ly high-level intensity, and it showed a sustained increase. However, high- and low-density constructed areas displayed notable differences in magnitude, intensity, and contribution to the urban expansion in each period. High-density constru- cted areas (mainly in the form of residential and commercial building) evidenced a rapid decline over the three periods, while low-density constructed areas (dominated by new indu- strial development zone expansion) underwent a swift increase
in each period. The latter type of area acted as the main con- tributor to urban expansion from 1990 to 2000. This can be
Figure 5. Comparison of the neighboring index among the urban-transformation categories based on area contribution and transformation frequency. (a) The area contribution of different categories (Maj, major; Sig, significant; Min, minor); F0–F3: categories based on the number of transformation times from 0 to 3; (b) comparison of category-based spatial affinity (CSA) among the categories; (c) comparison of category-based neighboring index (CNI) among paired categories based on the area contribution; for example Min*Maj refers to the average neighboring index for all pair-wise transformation types between minor and major; (d) comparison of CNI among paired categories based on the transformation frequency; for example, F21 indicates an average NI for all paired transformation types between category F2 and F1.
X. W. Li et al. / Journal of Environmental Informatics 20(2) 103-114 (2012)
111
Figure 6. Linear correlation between area and spatial affinity of urban transformation types in Shanghai’s urbanization.
explained by the continuing powerful development of indus- trial land use and new-development zones (interpreted as low- density constructed areas) that has occurred in Shanghai since the 1990s.
Shanghai’s land-use transformation has led to the rapid increase in urban land but a sharp loss of cultivated land in central and major satellite cities. This indicates that a large amount of agricultural land has been quickly transformed into urban land (high- and low-density constructed areas) in the most actively urbanizing regions; there, the urbanization and urban land-use transformation has been characterized by large-
scale, high efficiency. By contrast, small and exurb towns us- ually formed their configurations through more complicated transformation processes, and they displayed a scattered, ire- gular expansion pattern in their urban land use. This pheno- menon can be explained by the fact that more disorderly, poorly planned urban-development activities have been a fea- ture in such small and exurb towns, resulting in an inefficient intermediate transformation process (Zeng et al., 2005).
Using the GIS-based gridding system, it was evident that the urban morphology and configuration in Shanghai exhibit- ted distinct evolutionary patterns over different periods: there was the rapid transformation from what might be termed single-nucleated expansion around the urban center (1987 ~ 1990) to multi-nucleated expansion around the central city and satellite towns (1990 ~ 1995), and point-axis expansion (1995 ~ 2000) across suburbs or along transportation arteries. In addition, the computation of CSA and CNI revealed that those categories that made a larger area contribution and had fewer transformation frequencies possessed a stronger spatial affinity and spatial interaction with the other categories and generally functioned as the active urbanizing area or urbani- zation framework; based upon this, the single- or multiple- nucleated expansion and point-axis expansion together shaped the complex metropolitan urban network of Shanghai over different periods.
Such a complex metropolitan pattern led by an urban land-use transformation process is described as the desakota pattern (McGee, 1991; Zhou, 1991; Lin, 2001), which is nei-
ther an urban nor a rural pattern, but it demonstrates features of both, and it indicates a large-scale extensive urban sprawl and rural urbanization (Ginsburg et al., 1991; McGee, 1991). Desakota dynamics shows unique spatial patterns, the new growth of large, specialized urban districts dominant in the vicinity of large cities, and incremental expansion of existing urban districts in small cities and rural areas (Medley et al., 1995; McDonnell et al., 1997).
Physical evidence of the desakota pattern is distinct and prominent in other Chinese cities, such as in Shenzhen, Guang-
zhou, and Suzhou, where the desakota patterns have been ex- plored, quantified, and modeled (Sui and Zeng, 2002; Xie et al., 2006; Yu and Ng, 2007). Similar to Shanghai, Guangzhou shows desakota features, having had a diffusion-coalescent ur- ban sprawl with a multi-nucleated urban pattern over recent decades (Yu and Ng, 2007). Some scholars have argued that bottom-up forces (e.g., metropolitan urban planning) and local interactions (township or rural level industrialization and urbanization) play an important role in forming this new urban
pattern, and they have resulted in the complexity of centrifu- gal and centripetal driving forces that shape the desakota pattern
(Seto and Fragkias, 2005). From the present study, we believe that the desakota pattern of Shanghai has been largely formed by reinforced interactions between large-scale urban expan- sion from the central city and small-scale township or rural urbanization as a result of the blurred distinction in landscape patterns between urban and rural areas.
The desakota pattern of Shanghai was most striking in 2000 after more than 10 years of rapid regional urbanization. However, this urban sprawl seems to have further developed in line with the prevailing urban planning policy of the Shang- hai government, which has focused on making the transition from urban-rural separation to coordinated urban-rural deve- lopment by removing the existing dual urban-rural socioeco- nomic structure (Wang and Deng 2001; Zhang and Seto 2011). The Shanghai government has acted this way to ensure that farmers share the benefits of urbanization by integrating urban and rural resources, and it has speeded up the processes of rural urbanization and suburbanization by extending the infra- structure and public services from the central city to satellite towns and rural areas (Wang and Deng, 2001).
Understanding the rural-urban nexus and its new land- scape pattern, which is an emerging type of urbanization in China, is key to comprehending the country’s tremendous so- cial and economic transformation (Tang and Chung, 2000). This landscape pattern is representative of China’s economic vitality, and it provides clues to its continuing social and poli- tical stability in the face of great economic upheavals (Lieber- thal, 1995). However, large-scale urban sprawls bring about tremendous negative ecological consequence, and the pace of urbanization and the size of the desakota regions must be controlled to ensure sustainable co-development between urban
and rural areas (Sui and Zeng, 2002; Zhou et al., 2004; Zhao et al., 2006). Therefore, how to coordinate and integrate urban and rural urbanization at the least ecological and environmen- tal costs is a great challenge in urban and regional planning, especially for such metropolitan areas as Shanghai.
X. W. Li et al. / Journal of Environmental Informatics 20(2) 103-114 (2012)
112
Acknowledgments. We are grateful to Professor J. Y. Fang and Dr. S. L. Piao for very helpful discussions on this project. This study was funded by the State Key Basic Research and Development Plan (2005CB724200, G2000046801) and National Natural Science Foun- dation of China (30100020).
References
Antrop, M. (2004). Landscape change and the urbanization process in Europe, Landscape Urban Plann., 67, 9-26. http://dx.doi.org/10. 1016/S0169-2046(03)00026-4
Arribas-Bel, D., Nijkamp, P., and Scholten, H. (2011). Multi- dimensional urban sprawl in Europe: A self-organizing map app- roach, Computers, Environ. Urban Syst., 35, 263-275. http://dx. doi.org/10.1016/j.compenvurbsys.2010.10.002
Bryant, M.M. (2006). Urban landscape conservation and the role of ecological greenways at local and metropolitan scales, Landscape Urban Plann., 76, 23-44. http://dx.doi.org/10.1016/j.landurbplan. 2004.09.029
Catalán, B., Saurí, D., and Serra, S. (2008). Urban sprawl in the Mediterranean? Patterns of growth and change in the Barcelona Metropolitan Region 1993-2000, Landscape Urban Plann., 85, 174-184. http://dx.doi.org/10.1016/j.landurbplan.2007.11.004
Chen, Y.M., Li, X., Zheng, Y., Guan, Y.Y., and Liu, X.P. (2011). Estimating the relationship between urban forms and energy con- sumption: A case study in the Pearl River Delta, 2005-2008, Landscape Urban Plan., 102, 33-42. http://dx.doi.org/10.1016/j. landurbplan.2011.03.007
Deng, X.Z., Huang, J.K., Rozelle, S., and Uchida, E. (2008). Growth, population and industrialization, and urban land expansion of China, J. Urban Econ., 63, 96-115. http://dx.doi.org/10.1016/j.jue. 2006.12.006
Deng, J.S., Wang, K., Hong, Y., and Qi, J.G. (2009). Spatio-temporal dynamics and evolution of land use change and landscape pattern in response to rapid urbanization, Landscape Urban Plan., 92, 187-198. http://dx.doi.org/10.1016/j.landurbplan.2009.05.001
Douglass, M. (1998). A regional network strategy for reciprocal rural-urban linkages, Third World Plan Rev., 20, 1-33.
Foresman, T.M., Pickett, S.T.A., and Zipperer, W.C. (1997). Methods for spatial and temporal land use and land cover assessment for urban ecosystems and application in the greater Baltimore-Chesa- peake region, Urban Ecosyst., 1, 210-216. http://dx.doi.org/10.10 23/A:1018583729727
Fragkias, M., and Seto, K.C. (2009). Evolving rank-size distributions of intra-metropolitan urban clusters in South China, Comput., En- viron. Urban Syst., 33,189-199. http://dx.doi.org/10.1016/j.com penvurbsys.2008.08.005
Gaubatz, P. (1999). China’s urban transformation: patterns and pro- cesses of morphological change in Beijing, Shanghai and Guang- zhou, Urban Stud., 36 (9), 1495-1521. http://dx.doi.org/10.1080/ 0042098992890
Ginsburg, N.B., Koppel, B., and McGee, T. (1991). The extended metropolis: settlement transition in Asia. University of Hawaii Press, Honolulu.
Gong, J.Z., Liu, Y.S., and Chen, W.L. (2012). Land suitability eva- luation for development using a matter-element model: A case stu- dy in Zengcheng, Guangzhou, China, Land Use Policy, 29, 464- 472. http://dx.doi.org/10.1016/j.landusepol.2011.09.005
Grimm, N.B., Grove, J.M., Pickett, S.T.A., and Redman, C.L. (2000). Integrated approaches to long-term studies of urban ecological systems, Bioscience, 50 (7), 571-584. http://dx.doi.org/10.1641/ 0006-3568(2000)050[0571:IATLTO]2.0.CO;2
Gu, C. (1999). Study on the mechanism of land use/land cover changes in Beijing City, J. Nat. Resour., 14, 307-312 [in Chinese:
English abstract]. Hahs, A.K., Mcdonnell, M.J. (2006). Selecting independent measures
to quantify Melbourne’s urban-rural gradient. Landscape Urban Plan., 78, 435-448. http://dx.doi.org/10.1016/j.landurbplan.2005. 12. 005
Han, J., Hayashia, Y., Cao, X., and Imuraa, H. (2009). Application of an integrated system dynamics and cellular automata model for urban growth assessment: A case study of Shanghai, China, Land- scape Urban Plan., 91, 133-141. http://dx.doi.org/10.1016/j.land urbplan.2008.12.002
He, C.Y., Shi, P.J., Chen, J., and Xu, X.L. (2002). Process and mechanism of urbanization in Beijing area, Acta Geogr. Sin., 57(3), 363-371 [in Chinese: English abstract].
Herold, M., Goldstein, N.C., and Clarke, K.C. (2003). The spatio- temporal form of urban growth: measurement, analysis and mo- deling, Remote Sens. Environ., 86, 286-302. http://dx.doi.org/10. 1016/S0034-4257(03)00075-0
Herold, M., Couclelis, H., and Clarke, K.C. (2005). The role of spatial metrics in the analysis and modeling of urban land use change, Environ. Urban Syst., 29, 369-399. http://dx.doi.org/10.10 16/j.compenvurbsys.2003.12.001
Kroll, F., Müllera, F., Haase,D., and Fohrer,N. (2012). Rural-urban gradient analysis of ecosystem services supply and demand dynamic, Land Use Policy., 29(3), 521-535. http://dx.doi.org/10. 1016/j.landusepol.2011.07.008
Li, J.X., Song, C.H., Cao, L., Zhu, F.J., Meng,X.L., and Wu, J.G. (2011). Impacts of landscape structure on surface urban heat islands: A case study of Shanghai, China. Remote Sens. Environ., 115, 3249-3263. http://dx.doi.org/10.1016/j.rse.2011.07.008
Li, J.J., Wang, X.R., Wang, X.J., Ma, W.C., and Zhang, H. (2009). Remote sensing evaluation of urban heat island and its spatial pattern of the Shanghai metropolitan area, China, Ecol. Complex., 6, 413-420. http://dx.doi.org/10.1016/j.ecocom.2009.02.002
Li, X.W., Zhang, L.N., and Chen, L. (2010). A GIS-based buffer gradient analysis on spatiotemporal dynamics of urban expansion in Shanghai and its major satellite cities, Procedia Environ. Sci., 2, 1139-1156. http://dx.doi.org/10.1016/j.proenv.2010.10.123
Lieberthal, K. (1995). Governing China: from revolution through reform. Norton & Co., New York.
Lin, C. (2001). Evolving spatial form of urban-rural interaction in post-reform China: A case study of the Pearl River Delta, Profes. Geogr., 53, 56-70. http://dx.doi.org/10.1080/00330124.2001. 9628 434
Liu, J.Y., Liu, M., and Zhuang, D.F. (2002). Study on spatial pattern of land-use change in China during 1995-2000, Sci China (D), 46(4), 373-384 [in Chinese: English abstract].
Liu, S., Wu, C., and Shen, H. (2000). A GIS-based model of urban landuse growth in Beijing, Acta Geogr. Sin., 55, 407-416 [in Chinese: English abstract].
Liu,Y., and Phinn, S.R. (2003). Modelling urban development with cellular automata incorporating fuzzy-set approaches, Comput., Environ. Urban Syst., 27, 637-658. http://dx.doi.org/10.1016/ S0198-9715(02) 00069-8
Luck, M., and Wu, J. (2002). A gradient analysis of urban landscape pattern: a case study from the Phoenix metropolitan region of USA, Landscape Ecol., 17, 327-339. http://dx.doi.org/10.1023/A:1020 512723753
Martinuzzi, S., Gould, W.A., and González, O.M.R. (2007). Land development, land use, and urban sprawl in Puerto Rico inte- grating remote sensing and population census data, Landscape Ur- ban Plan., 79, 288-297. http://dx.doi.org/10.1016/j.landurbplan. 2006.02.014
McDonnell, M.J., and Pickett, S.T.A. (1990). Ecosystem structure and function along urban-rural gradients: an unexploited oppor-
X. W. Li et al. / Journal of Environmental Informatics 20(2) 103-114 (2012)
113
tunity for ecology, Ecology, 71(4), 1232-1237. http://dx.doi.org/ 10.2307/1938259
McDonnell, M.J., Pickett, S.T.A., Groffman, P., Bohlen, P., and Pouyat, R.V. (1997). Ecosystem processed along an urban-to rural gradient, Urban Ecosyst., 1, 21-36. http://dx.doi.org/10.1023/A: 1014359024275
McGee, T. (1991). The emergence of desakota regions in Asia: expanding a hypothesis. In: Ginsburg NB, Koppel B, McGee T (eds) The Extended metropolis: settlement transition in Asia. University of Hawaii Press, Honolulu.
McKinney, M.L. (2006). Urbanization as a major cause of biotic homogenization, Biol. Conserv., 127, 247-260. http://dx.doi.org/10. 1016/j.biocon.2005.09.005
Medley, K.E., McDonnell, M.J., and kett, S.T.A. (1995). Human influences on forest-landscape structure along an urban-to-rural gradient, Prof. Geogr., 47, 159-168. http://dx.doi.org/10.1111/j. 0033- 0124.1995.00159.x
Paul, M.J., and Meyer, J.L. (2001). Streams in the urban landscape, Ann. Rev. Ecol. Syst., 32, 333-365. http://dx.doi.org/10.1146/ annurev.ecolsys.32.081501.114040
Potter, R., and Unwin, T. (1995). Urban-rural interaction: physical form and political process in the Third World, Cities, 12(1), 67-74. http://dx.doi.org/10.1016/0264-2751(95)91866-E
Reilly, M.K., O’Mara, M.P., and Seto, K.C. (2009). From Bangalore to the Bay Area: Comparing transportation and activity accessibility as drivers of urban growth, Landscape Urban Plan., 92, 24-33. http://dx.doi.org/10.1016/j.landurbplan.2009.02.001
Ren, W.W., Zhong, Y., Meligranab, J., Anderson, B., and Watt, W. E. (2003). Urbanization, land use, and water quality in Shanghai 1947-1996, Environ. Int., 29, 649-659. http://dx.doi.org/10.1016/ S0160-4120(03)00051-5
Santé, I., García, A.M., Miranda, D., and Crecente,R. (2010). Cellular automata models for the simulation of real-world urban processes: A review and analysis, Landscape Urban Plan., 96,108-122. http://dx.doi.org/10.1016/j.landurbplan.2010.03.001
Schneider, A., Seto, K.C., and Webster, D.R. (2005). Urban growth in Chengdu, Western China: application of remote sensing to assess planning and policy outcomes, Environ. Plan. B, 32, 323-345. http://dx.doi.org/10.1068/b31142
Schwarz, N. (2010). Urban form revisited—Selecting indicators for characterising European cities, Landscape Urban Plan., 96, 29-47. http://dx.doi.org/10.1016/j.landurbplan.2010.01.007
Seto, K.C., and Fragkias, M. (2005). Quantifying spatiotemporal patterns of urban land-use change in four cities of China with time series landscape metrics, Landscape Ecol., 20, 871-888. http://dx. doi.org/10.1007/s10980-005-5238-8
Seto, K.C., Woodcock, C.E., Song, C., Huang, X., and Lu, J. (2002). Monitoring land-use change in the Pearl River Delta using Landsat TM, Int. J. Remote Sens., 23 (10), 1985-2004. http://dx.doi.org/10. 1080/01431160110075532
Shanghai Municipal Statistics Bureau. (2004). Shanghai Statistical Yearbook (1990-2003). China Statistical Press, Beijing [in Chi- nese].
Shi, P., Chen, J., and Pan, Y. (2000). Land use change mechanism in Shenzhen city, Acta Geogr. Sin., 55, 151-160 [in Chinese: English abstract].
Siciliano, G. (2012). Urbanization strategies, rural development and land use changes in China: A multiple-level integrated assessment, Land Use Policy, 29, 165-178. http://dx.doi.org/10.1016/j.landus epol.2011.06.003
Solon, J. (2009). Spatial context of urbanization: Landscape pattern and changes between 1950 and 1990 in the Warsaw metropolitan area, Poland. Landscape Urban Plan., 93, 250-261. http://dx.doi. org/10.1016/j.landurbplan.2009.07.012
Su, W.Z., Gu, C.L., Yang, G.S., Chen, S., and Zhen, F. (2010). Measuring the impact of urban sprawl on natural landscape pattern of the Western Taihu Lake watershed, China, Landscape Urban Plan., 95, 61-67. http://dx.doi.org/10.1016/ j.landurbplan.2009. 12.003
Sudhira, H.S., Ramachandra, T.V., and Jagadish, K.S. (2004). Urban sprawl: metrics, dynamics and modelling using GIS, Int. J. Appl. Earth Observ. Geoinf., 5, 29-39. http://dx.doi.org/10.1016/j.jag.20 03.08.002
Sui, D.Z., and Zeng, H. (2001). Modeling the dynamics of landscape structure in Asia’s emerging desakota regions: a case study in Shenzhen, Landscape Urban Plann., 53, 37-52. http://dx.doi.org/ 10.1016/S0169-2046(00)00136-5
Swenson, J.J., and Franklin, J. (2000). The effects of future urban development on habitat fragmentation in the Santa Monica Mountains, Landscape Ecol., 15, 713-730. http://dx.doi.org/10.10 23/ A:1008153522122
Tang, W., and Chung, H., (2000). Urban-rural transition in China: beyond the desakota model. In: Li S, Tang W (eds) China’s regions, polity, & economy: a study of spatial transformation in the post-reform era. The Chinese University Press, Hong Kong.
Wang, J.Y., Da, L.G., Song, K., and Li, B.L. (2008). Temporal variations of surface water quality in urban, suburban and rural areas during rapid urbanization in Shanghai, China, Environ. Pollut., 152, 387-393. http://dx.doi.org/10.1016/j.envpol.2007.06. 050
Wang, Z., and Deng, Y. (2001). Analysis of spatial structure com- plexity in Shanghai city, Adv. Geogr. Sci., 20(4), 331-339 [in Chi- nese: English abstract].
Wei,Y.P., and Zhao, M. (2009). Urban spill over vs. local urban sprawl: Entangling land-use regulations in the urban growth of China’s megacities, Land Use Policy, 26, 1031-1045. http://dx.doi. org/10.1016/j.landusepol.2008.12.005
Weng, Q.H. (2002). Land use change analysis in the Zhujiang Delta of China using satellite remote sensing, GIS and stochastic mo- deling, J. Environ. Manage., 64, 273-284. http://dx.doi.org/10. 1006/jema.2001.0509
Weng, Y.C. (2007). Spatiotemporal changes of landscape pattern in response to urbanization, Landscape Urban Plann., 81, 341-353. http://dx.doi.org/10.1016/j.landurbplan.2007.01.009
Wu, J.G. (2007). Landscape ecology: pattern, process, scale and hierarchy (2nd edition). Higher Eduction Press, Beijing [in Chi- nese].
Wu, Q., Li, H.Q., Wang, R.S., Paulussen, J., and He, Y. (2006). A Monitoring and predicting land use change in Beijing using remote sensing and GIS, Landscape Urban Plan., 78, 322-333. http://dx. doi.org/10.1016/j.landurbplan.2005.10.002
Xiao, J.Y., Shen, Y.J., Ge, J.F., Tateishi, R., and Tang, C.Y. (2006). Evaluating urban expansion and land use change in Shijiazhuang, China, by using GIS and remote sensing, Landscape Urban Plan., 75, 69-80. http://dx.doi.org/10.1016/j.landurbplan.2004.12.005
Xie, Y., and Fan, Z. (2003). Examine urban expansion from remote sensing and GIS: a case study in Beijing, Asian Geogr., 22, 119-132. http://dx.doi.org/10.1080/10225706.2003.9684102
Xie, Y.C., Yu, M., Bai, Y.F., and Xing, X.R. (2006). Ecological analysis of an emerging urban landscape pattern—desakota: a case study in Suzhou, China, Landscape Ecol., 21:1297-1309. http://dx. doi.org/10.1007/s10980-006-0024-9
Yang, Z.F., He, M.C., Mao, X.Q., Yu, J.S., and Wu, Q.Z. (2004). Ecological sustainable development planning in an urban area. China Science Press, Beijing [in Chinese].
Yeung, Y.M. (1998). Urban and regional development in China: Recent transformations and future prospects. In: Yeung YM, (ed) Urban development in Asia: retrospect and prospect. The Chinese
X. W. Li et al. / Journal of Environmental Informatics 20(2) 103-114 (2012)
114
University of Hong Kong, Hong Kong. Yu, X.J., and Ng, C.N. (2007). Spatial and temporal dynamics of
urban sprawl along two urban-rural transects: A case study of Guangzhou, China, Landscape Urban Plan., 79(1), 69-80. http:// dx.doi.org/10.1016/j.landurbplan.2006.03.008
Zeng, Y., Shen, G., Huang, S., and Wang, M. (2005). Assessment of urban ecosystem health in Shanghai, Resources and Environment in the Yangtze Basin. 14 (2), 208-212 [in Chinese: English ab- stract].
Zhang, Y.L., Li, X.B., Fu, X.F., Xie, G.D., and Zheng, D. (2000). Urban land use change in Lasa, Acta Geogr. Sin., 55 (4), 395-405 [in Chinese: English abstract].
Zhang, Q.L., and Seto, K.C., (2011). Mapping urbanization dynamics at regional and global scales using multi-temporal DMSP/OLS nighttime light data, Remote Sens. Environ., 115, 2320-2329. http://dx.doi.org/10.1016/j.rse.2011.04.032
Zhao, P.J. (2011). Managing urban growth in a transforming China: Evidence from Beijing, Land Use Policy, 28, 96-109. http://dx. doi.org/10.1016/j.landusepol.2010.05.004
Zhao, S.Q., Da, L. J., Tang, Z. Y., Fang, H. J., and Fang, J. Y. (2006). Ecological consequences of rapid urban expansion: Shanghai,
China, Front. Ecol. Environ., 4(7), 341-346. http://dx.doi.org/10. 1890/1540-9295(2006)004[0341:ECORUE]2.0.CO;2
Zhou, L.M., Dickinson, R. E., Tian, Y.H., Fang, J.Y., and Li, Q.X. (2004). Evidence for a significant urbanization effect on climate in China, PNAS, 101(26), 9540-9544. http://dx.doi.org/10.1073/pnas. 0400357101
Zhou, Y., and Ma, L., 2000. Economic restructuring and suburbani- zation in China, Urban Geogr., 21, 205-236. http://dx.doi.org/10. 2747/0272-3638.21.3.205
Zhou, Y. (1991). The Metropolitan interlocking region in China: A preliminary hypothesis. In: Ginsburg NB, Koppel B, McGee T (eds) The extended metropolis: settlement transition in Asia. University of Hawaii Press, Honolulu.
Zhu, M., Xu, J.G., Jiang, N., Li, J.L., and Fan, Y.M. (2006). Impacts of road corridors on urban landscape pattern: a gradient analysis with changing grain size in Shanghai, China, Landscape Ecol., 21, 723-734. http://dx.doi.org/10.1007/s10980-005-5323-z
Zipperer, W.C., Wu, J., Pouyat, R.V., and Pickett, S.T.A. (2000). The application of ecological principles to urban and urbanizing landscapes, Ecol. Appl., 10 (3), 685-688. http://dx.doi.org/10.1890 /1051-0761 (2000)010[0685:TAOEPT]2.0.CO;2