Embed Size (px)
Citation preview

www.elsevier.com/locate/foreco
Forest Ecology and Management 237 (2006) 103–114
Spatio-temporal availability of soft mast in clearcuts in the
Southern Appalachians
Melissa J. Reynolds-Hogland a,*, Michael S. Mitchell b,1, Roger A. Powell c
a School of Forestry and Wildlife Sciences, 602 Duncan Drive, Auburn University, Auburn, AL 36849, USAb U.S. Geological Survey, Alabama Cooperative Fish and Wildlife Research Unit, Auburn University, Auburn, AL 36849, USA
c Department of Zoology, 241 David Clark Labs, North Carolina State University, Raleigh, NC 27695, USA
Received 20 April 2006; received in revised form 26 September 2006; accepted 27 September 2006
Abstract
Soft mast is an important resource for many wild populations in the Southern Appalachians, yet the way clear-cutting affects availability of soft
mast though time is not fully understood. We tested a theoretical model of temporal availability of soft mast in clearcuts using empirical data on
percent cover and berry production of Gaylussacia, Vaccinium, and Rubus spp. plants in 100 stands that were clearcut (0–122 years old) in the
Southern Appalachian Mountains. We modeled the relationship between soft mast availability and stand age, evaluated the effects of topography
and forest type on soft mast, developed statistical models for predicting the spatio-temporal distribution of soft mast, and tested the hypothesis that
percent cover of berry plants and berry production provided similar information about soft mast availability. We found temporal dynamics
explained berry production better than it predicted percent plant cover, whereas topographic variables influenced percent plant cover more than
they influenced berry production. Berry production and percent plant cover were highest in�2–9-year-old stands. Percent plant cover was lowest in
10–69-year-old stands and intermediate in 70+-year-old stands. Three of our spatio-temporal models performed well during model testing and they
were not biased by the training data, indicating the inferences about spatio-temporal availability of soft mast extended beyond our sample data. The
methods we used to estimate the distribution of soft mast may be useful for modeling distributions of other resources.
# 2006 Elsevier B.V. All rights reserved.
Keywords: Clearcuts; Habitat; Timber harvesting; Wildlife
1. Introduction
Improving habitat quality for some populations of wild
animals is often considered an objective of harvesting trees on
forested landscapes. Timber harvesting increases availability of
soft mast (Clark et al., 1994; Mitchell et al., 2002; Noyce and
Coy, 1990; Perry et al., 1999; Stransky and Roese, 1984), an
important component of habitat for many wild animals (Jonkel
and Cowan, 1971; Elowe and Dodge, 1989; Boddy, 1991;
Castleberry et al., 2002; Thomas, 1984; Thompson and Fritzell,
1986; Willson, 1986). Availability of soft mast in harvested
* Corresponding author at: 559 Grandview Drive, Stevensville, MT 59870,
USA. Tel.: +1 406 777 3406; fax: +1 334 844 1084.
E-mail addresses: [email protected], [email protected]
(M.J. Reynolds-Hogland).1 Current address: U.S. Geological Survey, Montana Cooperative Wildlife
Research Unit, University of Montana, Natural Sciences Building Room 205,
Missoula, MT 59812, USA.
0378-1127/$ – see front matter # 2006 Elsevier B.V. All rights reserved.
doi:10.1016/j.foreco.2006.09.035
stands and its affect on habitat quality, however, is not static. It
changes through time due to succession.
In recently harvested stands, availability of soft mast can be
relatively high (Clark et al., 1994; Mitchell et al., 2002; Noyce
and Coy, 1990; Perry et al., 1999; Stransky and Roese, 1984)
because conditions favor early successional species, some of
which produce soft mast (e.g., Rubus spp.; Archambault et al.,
1998; Costello and Sage, 1994; McCarty et al., 2002; Perry
et al., 1999). As stands age and forest canopies close, however,
availability of soft mast due to early successional species
declines (Mitchell et al., 2002; Mitchell and Powell, 2003).
Eventually, availability of soft mast should increase again as
conditions favor later successional species, some of which
produce soft mast (e.g., Vaccinium spp. Ihalainen et al., 2003;
Perry et al., 1999).
Knowing the range of stand ages in which soft mast is most
available may be key to maintaining levels of soft mast on
forested landscapes for wild animals. Equally important is to
know the range of stand ages in which soft mast is least
available because one way to optimize soft mast availability

M.J. Reynolds-Hogland et al. / Forest Ecology and Management 237 (2006) 103–114104
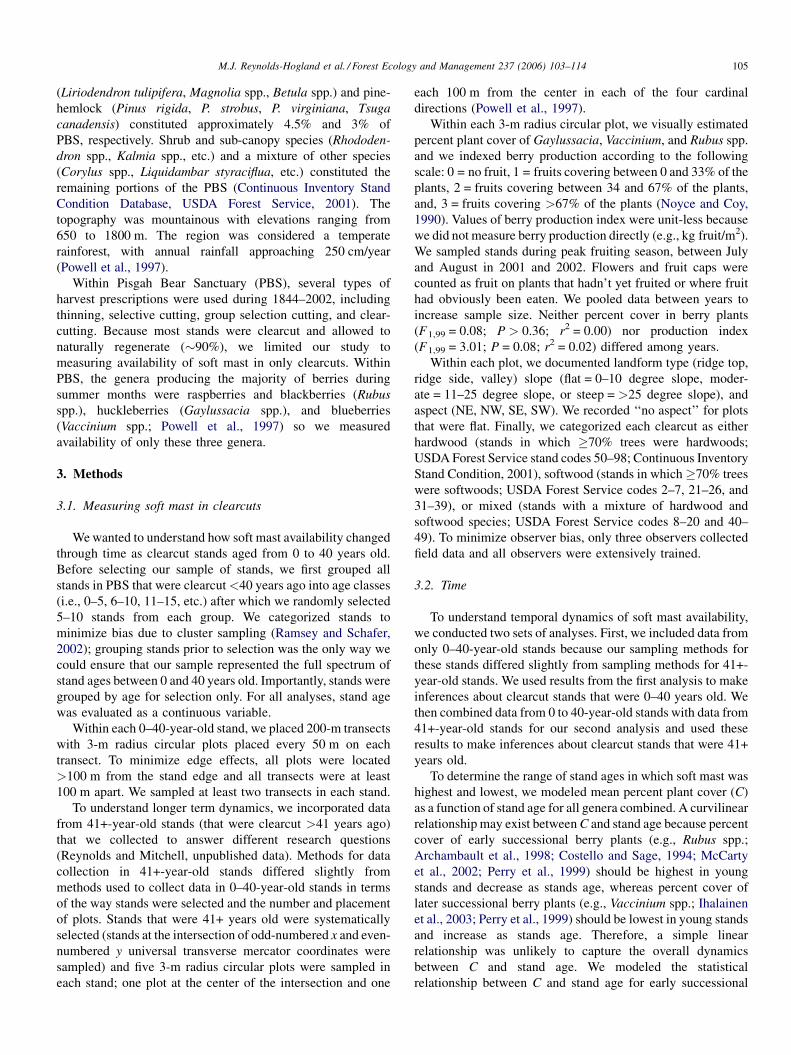
Fig. 1. Model of soft mast availability in Southern Appalachian clearcuts, as
they age from 0 to 120 years, taken from Brody and Stone (1987). The y-axis is
an index of habitat capability with respect to soft mast availability.
across a forested landscape is to minimize the proportion of
area in stand ages in which soft mast is lowest.
Several studies have evaluated temporal dynamics of soft
mast availability in harvested stands, but results have been
incomplete. The range of stand ages in which soft mast was
measured was narrow or stands were categorized, a priori, into
arbitrary age classes. For example, Perry et al. (1999) assessed
availability of soft mast in 1-, 3-, 5- and 70+-year-old stands in
pine and hardwood forests in the Ouachita Mountains of
Arkansas and Oklahoma and found soft mast was highest in 5-
year-old shelterwood cuts and in 5-year-old clearcuts and
lowest in 70+-year-old stands. Because soft mast was not
measured in 6–69-year-old stands, it is unknown whether a
range of stand ages between 6 and 69 years supported levels of
soft mast greater than that in 5-year-old stands or lower than
that in 70+-year-old stands. Costello and Sage (1994) compared
availability of soft mast in 1–8, 9–16, 17–24, and 24+-year-old
stands in hardwood forests in New York and found summer
fruits were highest in 1–8 and 9–16-year-old stands and lowest
in 24+-year-old stands. All stands >24 years were combined,
which may have masked possible changes in soft mast
availability that occurred as stands aged beyond 24 years.
In Minnesota, Noyce and Coy (1990) compared soft
mast availability in 0–1, 2–4, 5–8, 9–12, 13–16, 30–59, and
60+-year-old stands in hardwood and boreal forests and found
soft mast was highest in 5–8-year-old stands and lowest in 0–1
and 2–4-year-old stands. Importantly, they also found percent
cover of berry plants was higher in 60+-year-old stands
compared to that in 30–59-year-old stands, suggesting
intermediate aged stands supported relatively low levels of
soft mast. The last finding was detectable only because stands
>30 years old were not grouped, a priori, into a single category.
Our first objective was to build upon previous research by
evaluating how clear-cutting (i.e., removal of all trees within a
stand) in the Southern Appalachian Mountains affected soft
mast availability through time. Currently, little is known about
temporal dynamics of soft mast in the Southern Appalachian
Mountains. Brody and Stone (1987) hypothesized soft mast
availability in clearcuts would be very high when clearcuts
were young, but then steadily decline until stands were about 70
years old (Fig. 1). To date, this model has not been tested with
empirical data. Mitchell and Powell (2003) showed soft mast in
western North Carolina was higher in 0–10-year-old clearcuts
compared to that in 11+-year-old stands, but all stands >10
years old were combined, making it impossible to discern
changes in soft mast availability that may have occurred as
stands aged beyond 10 years. We wanted to expand their work
by analyzing temporal dynamics of soft mast availability in
clearcuts without categorizing stands, a priori, into specific age
groups. By using continuous data, we hoped to uncover patterns
in soft mast availability that might be masked by analysis of
categorical data.
Factors other than stand age also influence availability of
soft mast in harvested stands. Type of harvest technique was
important in Texas (Johnson and Landers, 1978), New York
(Costello and Sage, 1994) and Oklahoma (Perry et al., 1999)
whereas forest type was a factor in Minnesota (Noyce and Coy,
1990) and Arkansas (Clark et al., 1994). Topography (e.g.,
aspect, slope, etc.) and spatial location of a stand on the
landscape (e.g., ridge top, ridge side, valley) may also affect the
availability of soft mast, yet these influences have not been
tested in the Southern Appalachian Mountains. Therefore, our
second objective was to understand how forest type, topography
and spatial location on the landscape affected soft mast
availability in the Southern Appalachian Mountains. Our third
objective was to combine temporal and spatial information to
develop models for predicting the spatio-temporal distribution
of soft mast on Southern Appalachian landscapes.
Finally, estimates of soft mast availability are influenced by
how availability is defined. Some studies estimated availability
of soft mast in terms of percent cover of berry plants (Mitchell
et al., 2002; Mitchell and Powell, 2003), but Perry et al. (1999)
showed percent cover was not always a reliable measure of
potential soft mast production. In their study, poison ivy
(Toxicodendron radicans) plants were highly available through-
out the study area, but they produced few berries. Alternatively,
areas could have high berry production but few berry plants. If so,
estimates of only plant cover or only berry production may not
provide reliable estimates of soft mast availability. Our fourth
objective was to evaluate whether percent cover of berry plants
and berry production provided similar estimates of soft mast
availability in the Southern Appalachian Mountains.
2. Study area
We conducted our study in the Pisgah Bear Sanctuary (PBS),
located in the western mountains of North Carolina (358170N,
828470W), during summers 2001 and 2002. The PBS (235 km2)
was located within the Pisgah National Forest and managed by
the United States Department of Agriculture Forest Service
(USDAFS) which harvested �1000 stands during 1844–2002.
Stand ages within PBS ranged from 0 to 158 years old, but most
stands (�80%) were 60+ years old in 2001–2002.
Eighty-eight percent of PBS comprised oak and oak-
hickory species, including northern red oak (Quercus rubrus),
southern red oak (Q. falcata), white oak (Q. alba), chestnut oak
(Q. prinus) and hickory (Carya spp.). Cove hardwoods
M.J. Reynolds-Hogland et al. / Forest Ecology and Management 237 (2006) 103–114 105
(Liriodendron tulipifera, Magnolia spp., Betula spp.) and pine-
hemlock (Pinus rigida, P. strobus, P. virginiana, Tsuga
canadensis) constituted approximately 4.5% and 3% of
PBS, respectively. Shrub and sub-canopy species (Rhododen-
dron spp., Kalmia spp., etc.) and a mixture of other species
(Corylus spp., Liquidambar styraciflua, etc.) constituted the
remaining portions of the PBS (Continuous Inventory Stand
Condition Database, USDA Forest Service, 2001). The
topography was mountainous with elevations ranging from
650 to 1800 m. The region was considered a temperate
rainforest, with annual rainfall approaching 250 cm/year
(Powell et al., 1997).
Within Pisgah Bear Sanctuary (PBS), several types of
harvest prescriptions were used during 1844–2002, including
thinning, selective cutting, group selection cutting, and clear-
cutting. Because most stands were clearcut and allowed to
naturally regenerate (�90%), we limited our study to
measuring availability of soft mast in only clearcuts. Within
PBS, the genera producing the majority of berries during
summer months were raspberries and blackberries (Rubus
spp.), huckleberries (Gaylussacia spp.), and blueberries
(Vaccinium spp.; Powell et al., 1997) so we measured
availability of only these three genera.
3. Methods
3.1. Measuring soft mast in clearcuts
We wanted to understand how soft mast availability changed
through time as clearcut stands aged from 0 to 40 years old.
Before selecting our sample of stands, we first grouped all
stands in PBS that were clearcut<40 years ago into age classes
(i.e., 0–5, 6–10, 11–15, etc.) after which we randomly selected
5–10 stands from each group. We categorized stands to
minimize bias due to cluster sampling (Ramsey and Schafer,
2002); grouping stands prior to selection was the only way we
could ensure that our sample represented the full spectrum of
stand ages between 0 and 40 years old. Importantly, stands were
grouped by age for selection only. For all analyses, stand age
was evaluated as a continuous variable.
Within each 0–40-year-old stand, we placed 200-m transects
with 3-m radius circular plots placed every 50 m on each
transect. To minimize edge effects, all plots were located
>100 m from the stand edge and all transects were at least
100 m apart. We sampled at least two transects in each stand.
To understand longer term dynamics, we incorporated data
from 41+-year-old stands (that were clearcut >41 years ago)
that we collected to answer different research questions
(Reynolds and Mitchell, unpublished data). Methods for data
collection in 41+-year-old stands differed slightly from
methods used to collect data in 0–40-year-old stands in terms
of the way stands were selected and the number and placement
of plots. Stands that were 41+ years old were systematically
selected (stands at the intersection of odd-numbered x and even-
numbered y universal transverse mercator coordinates were
sampled) and five 3-m radius circular plots were sampled in
each stand; one plot at the center of the intersection and one
each 100 m from the center in each of the four cardinal
directions (Powell et al., 1997).
Within each 3-m radius circular plot, we visually estimated
percent plant cover of Gaylussacia, Vaccinium, and Rubus spp.
and we indexed berry production according to the following
scale: 0 = no fruit, 1 = fruits covering between 0 and 33% of the
plants, 2 = fruits covering between 34 and 67% of the plants,
and, 3 = fruits covering >67% of the plants (Noyce and Coy,
1990). Values of berry production index were unit-less because
we did not measure berry production directly (e.g., kg fruit/m2).
We sampled stands during peak fruiting season, between July
and August in 2001 and 2002. Flowers and fruit caps were
counted as fruit on plants that hadn’t yet fruited or where fruit
had obviously been eaten. We pooled data between years to
increase sample size. Neither percent cover in berry plants
(F1,99 = 0.08; P > 0.36; r2 = 0.00) nor production index
(F1,99 = 3.01; P = 0.08; r2 = 0.02) differed among years.
Within each plot, we documented landform type (ridge top,
ridge side, valley) slope (flat = 0–10 degree slope, moder-
ate = 11–25 degree slope, or steep = >25 degree slope), and
aspect (NE, NW, SE, SW). We recorded ‘‘no aspect’’ for plots
that were flat. Finally, we categorized each clearcut as either
hardwood (stands in which �70% trees were hardwoods;
USDA Forest Service stand codes 50–98; Continuous Inventory
Stand Condition, 2001), softwood (stands in which�70% trees
were softwoods; USDA Forest Service codes 2–7, 21–26, and
31–39), or mixed (stands with a mixture of hardwood and
softwood species; USDA Forest Service codes 8–20 and 40–
49). To minimize observer bias, only three observers collected
field data and all observers were extensively trained.
3.2. Time
To understand temporal dynamics of soft mast availability,
we conducted two sets of analyses. First, we included data from
only 0–40-year-old stands because our sampling methods for
these stands differed slightly from sampling methods for 41+-
year-old stands. We used results from the first analysis to make
inferences about clearcut stands that were 0–40 years old. We
then combined data from 0 to 40-year-old stands with data from
41+-year-old stands for our second analysis and used these
results to make inferences about clearcut stands that were 41+
years old.
To determine the range of stand ages in which soft mast was
highest and lowest, we modeled mean percent plant cover (C)
as a function of stand age for all genera combined. A curvilinear
relationship may exist between C and stand age because percent
cover of early successional berry plants (e.g., Rubus spp.;
Archambault et al., 1998; Costello and Sage, 1994; McCarty
et al., 2002; Perry et al., 1999) should be highest in young
stands and decrease as stands age, whereas percent cover of
later successional berry plants (e.g., Vaccinium spp.; Ihalainen
et al., 2003; Perry et al., 1999) should be lowest in young stands
and increase as stands age. Therefore, a simple linear
relationship was unlikely to capture the overall dynamics
between C and stand age. We modeled the statistical
relationship between C and stand age for early successional

M.J. Reynolds-Hogland et al. / Forest Ecology and Management 237 (2006) 103–114106
berry plants by considering two transformations of stand age
(stand age�1 and stand age�1/2), both of which have a
decreasing function. We considered both transformations,
even though their functions were similar, because slopes
differed between the transformations (stand age�1 had a
smaller slope) and we did not know, a priori, which slope best
represented the relationship between C and stand age for early
successional berry plants. We modeled temporal dynamics of
C and stand age for later successional berry plants by
transforming stand age (stand age2; Johnson et al., 2004),
which had an increasing function. To develop a global model of
C for both early and later successional berry plants combined,
therefore, we randomly selected 70% of the data and used stand
age, stand age�1, stand age�1/2, and stand age2 as predictor
variables (Proc Reg: SAS Institute, 2000). We considered stand
age as an explanatory variable because C for later successional
berry plants may have been very low and relatively constant for
a long time during the early and mid stages of succession. We
developed a suite of nested models from the global model and
we considered the null model to be the intercept-only model.
We used Akaike’s information criterion, with an adjustment for
small sample bias (AICc; Akaike, 1973; Anderson et al., 1994)
to rank the models in terms of their ability to explain the data.
We used the remaining 30% of the data to test the top-ranked
model. We used the same method to model berry production
index (P).
We used results from the above regression analysis to
estimate the range of stand ages in which C was high, low, and
intermediate. To test if C was statistically different among the
three ranges of stand ages that were estimated using regression
analysis, we categorized data on percent cover into the three age
groups and compared mean C among the groups (Proc GLM:
SAS Institute, 2000; alpha = .10). For example, if the regression
analysis indicated C was highest in 0–10-year-old stands,
intermediate in 11–69-year-old stands and lowest in 70+-year-
old stands (Brody and Stone, 1987; Fig. 1), then we categorized
percent cover data into 0–10, 11–69, and 70+ age groups and
compared mean C among the three groups. We used the same
method to test for statistical differences in P among stand age
groups.
Although data on both percent plant cover and berry
production contained zeros, we did not adjust for zero inflation
because the goal of this research was to understand how clear-
cutting affected the temporal availability of soft mast through
time. Zeros were important to retain because we wanted to
estimate mean soft mast availability as a function of stand age.
Had we first modeled the probability of plant cover of berry
plants and then modeled the probability of berry production,
our results would have reflected the likelihood of berry
production given the presence of berry plants, which was not
the purpose of this study.
3.3. Topography
To understand how topography affected soft mast avail-
ability, we developed a suite of models for C for all genera
combined using aspect, slope, and topographic position as
predictor variables. We used AIC for model selection. Sample
size was based on number of plots because topography and
spatial location were heterogeneous within stands. To under-
stand how forest type affected soft mast availability, we
compared differences in mean C and differences in mean P
among forest types (Proc GLM: SAS Institute, 2000). Because
the category forest type was homogeneous within a given stand,
sample size was based on number of stands (Hurlbert, 1984).
3.4. Spatio-temporal models
We developed statistical models for predicting C on the
landscape using both temporal and topographic parameters. For
each sampled stand, we extracted mean values of slope,
elevation and aspect (Beers transformation of aspect; Beers
et al., 1966) using a geographic information system (GIS) at a
30 m resolution. We also extracted mean values for curvature of
the land, plane of the curvature, profile of the curvature
(DEMAT Behrens 2000), and distance to water (Mitchell et al.,
2002). We did not include soil data because soil type did not
differ on over 95% of our plots (Hermann, 1996).
We regressed each topographic parameter and its square
(e.g., elevation and elevation2; Johnson et al., 2004) as well as
stand age and three transformations of stand age (stand age2,
stand age�1, stand age�1/2; Proc Reg; SAS Institute, 2000) to
develop a global model of C using 70% of the randomly
selected data. We generated a suite of nested models from the
global model, selected the best approximating model using
AICc and tested the top-ranked model using the remaining 30%
of the data (Proc Reg; SAS Institute, 2000). We used the same
method to develop and test a model for predicting the spatio-
temporal distribution of P. Because soft mast availability might
be best explained by combining measures of C and P (Clark
et al., 1994), we also developed and tested a model for
predicting C � P.
During model testing, we evaluated model bias. If training
data (i.e., data used during model development) are unbiased
estimators of the population, the amount of variability
explained during model development will be similar to the
amount of variability explained during model testing (Neter
et al., 1996). For each model of C, P, and C � P, we compared
values of coefficient of determination (r2) between training and
testing models.
3.5. Cover in berry plants versus berry production
To test if C and P provided similar estimates of soft mast
availability, we evaluated three predictions. First, we evaluated
the degree to which stand age and topographic variables each
explained C and P. If C and P provided similar information
about soft mast availability, we predicted the effects of stand
age and topography on C would be similar to the effects of stand
age and topography on P. Second, we modeled C and P using
berry genus as the predictor variable and used AIC to compare
the ability of this model to explain the data relative to the ability
of a null model (i.e., an intercept only model). If C and P
provided similar information, we predicted C values for each

M.J. Reynolds-Hogland et al. / Forest Ecology and Management 237 (2006) 103–114 107
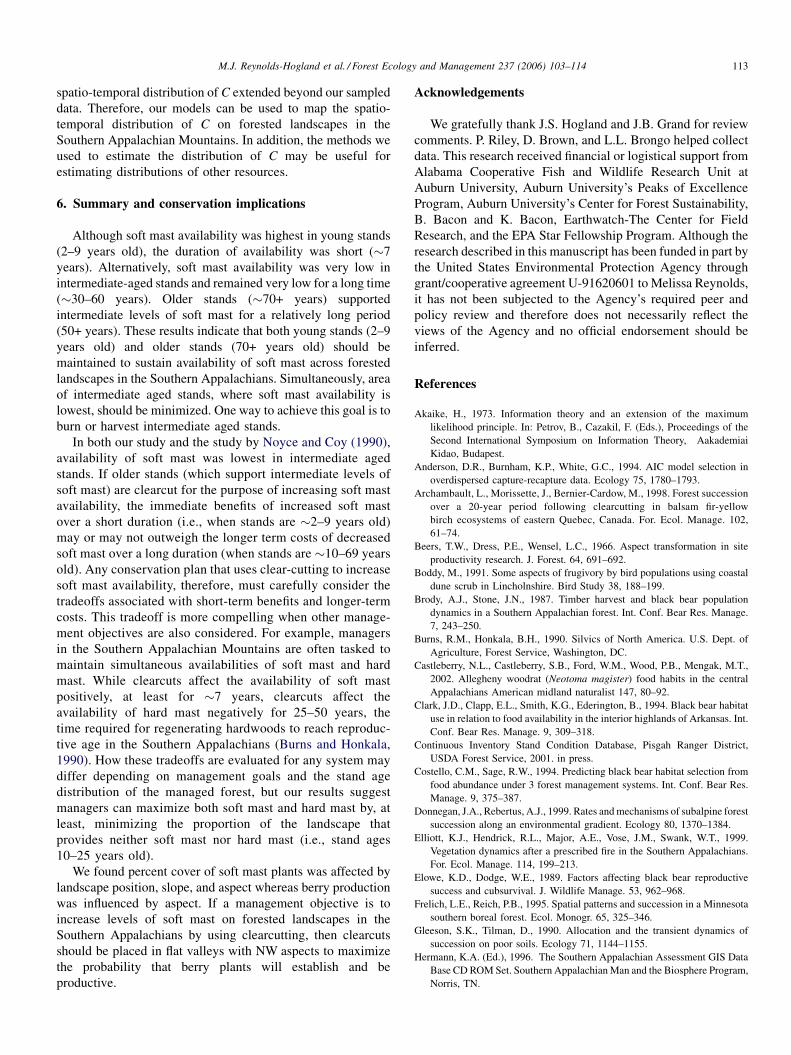
Fig. 2. Berry production index (P) of Vaccinium, Rubus, and Gaylussacia spp. combined in 579 plots in 0–40-year-old clearcuts in Pisgah Bear Sanctuary, North Carolina,
2001. Data for each plot are shown by genus, but the regression line predicts mean P of all three genera combined and was based on mean P per stand (n = 57).
genus would be similar to P values. Third, we used least squares
regression (Proc Reg; SAS Institute, 2000) to examine the
variability in P explained by C. If C and P provided similar
information, we predicted C would explain P reasonably well.
4. Results
We collected data in 57 stands that were 0–38 years (no
stands in Pisgah Bear Sanctuary were 39 or 40 years old in 2001
or 2002); within which we sampled 579 plots. Percent plant
cover of Gaylussacia, Vacinnium, or Rubus, spp. was>0 in 205
plots (34%). Of the 205 plots, Gaylussacia spp. were found in
43% (n = 88), Vaccinium spp. were found in 34% (n = 70), and
Fig. 3. Percent plant cover (C) of Vaccinium, Rubus, and Gaylussacia spp. comb
Carolina, 2001. Data for each plot are shown by genus. A regression line is not includ
Rubus spp. were found in 23% (n = 47). We collected data in 43
stands that were 41–122 years old, within which we sampled
215 plots. Percent plant cover was >0 in 93 plots (43%). Of the
93 plots, Gaylussacia spp. were in 29% (n = 27), Vaccinium
spp. were in 61% (n = 57) and Rubus spp. were in 10% (n = 9).
4.1. Time
The top-ranked model for P when all genera were combined
for 0–40-year-old stands included stand age, stand age2, stand
age1/2, and stand age�1/2 (r2 = 0.37; Fig. 2). The top-ranked
model for C when all genera were combined for 0–40-year-old
stands was the null model (i.e., intercept-only model; Fig. 3).
ined in 579 plots in 0–40-year-old clearcuts in Pisgah Bear Sanctuary, North
ed because stand age was a poor predictor of mean C in 0–40-year-old clearcuts.

M.J. Reynolds-Hogland et al. / Forest Ecology and Management 237 (2006) 103–114108
Fig. 4. Berry production index (P) for Vaccinium, Rubus, and Gaylussacia spp. combined in 794 plots in 0–122-year-old clearcuts in Pisgah Bear Sanctuary, North
Carolina, 2001–2002. Data for each plot are shown by genus, but the regression line predicts mean P of all three genera combined and was based on mean P per stand
(n = 100).
Results of model testing showed the temporal model of
P explained 43% variability in predicted P. P was highest in
�2–9-year-old stands (Fig. 2). Data for C did not always
correlate with data for P. For example, several values of C for
Gaylussacia spp. at stand age 23 were high (Fig. 3), but all
values of P for Gaylussacia spp. at stand age 23 were low or
zero (Fig. 2).
The top ranked model for P when all genera were combined
for 0–122-year-old stands included stand age, stand age2, stand
age1/2, and stand age�1/2 (r2 = 0.32; Fig. 4). The top ranked
model for C when all general were combined for 0–122-year-
old stands was the null model (Fig. 5). Results of model testing
Fig. 5. Percent plant cover (C) of Vaccinium, Rubus, and Gaylussacia spp. combined i
2001–2002. Data for each plot are shown by genus. A regression line is not included
showed the temporal model of P predicted 28% variability in
predicted P, indicating the training data did not bias the model.
Based on the regression line, P was lowest in �14–49-year-old
stands (Fig. 4). Based on data, P was lowest in �30–68-year-
old stands (Fig. 4) and berry plants were notably missing in 34–
69-year-old stands (Fig. 5). Although we sampled 50 plots in
34–69-year-old stands, we found berry plants in only 4% of the
plots (n = 2).
Based on the relationship between stand age and P predicted
by our regression analysis (Figs. 2 and 4), soft mast appeared to
be highest in�2–9-year-old stands and lowest in�10–69-year-
old stands. P appeared to increase as stands aged beyond �70
n 794 plots in 0–122-year-old clearcuts in Pisgah Bear Sanctuary, North Carolina,
because stand age was a poor predictor of mean C in 0–122-year-old clearcuts.

M.J. Reynolds-Hogland et al. / Forest Ecology and Management 237 (2006) 103–114 109
Table 1
Mean values of percent plant cover (C) and berry production index (P) of
Vaccinium, Rubus, and Gaylussacia spp. (combined) among different levels of
topographic position, aspect, and slope
Percent plant
cover
S.E. Berry production
index
S.E. n
Landform
Ridge top 6.22 1.60 0.22 0.06 102
Ridge side 5.69 0.74 0.24 0.03 512
Valley 11.24 2.01 0.28 0.06 127
Aspect
NE 6.00 1.22 0.22 0.05 179
NW 16.24 2.70 0.36 0.06 114
SE 4.06 0.76 0.17 0.04 212
SW 3.09 0.74 0.19 0.05 181
Slope
Flat 10.44 1.72 0.18 0.04 163
Moderate 6.29 0.94 0.26 0.04 363
Steep 4.57 0.89 0.25 0.05 215
Data were collected within 741 plots in 0–122-year-old clearcuts in Pisgah Bear
Sanctuary in North Carolina during 2001 and 2002.
Table 3
Slope estimates and standard errors for variables in the top-ranked model for
predicting the spatio-temporal distribution of percent plant cover (C) of
Vaccinium, Rubus, and Gaylussacia spp. (combined) in 0–40-year-old clearcuts
(n = 57) and in 0–122-year-old clearcuts (n = 100) in Pisgah Bear Sanctuary in
western North Carolina, 2001–2002
Model Slope S.E. r2
C in 0–40-year-old clearcuts
Intercept 60.97205 10.27 0.66
Stand age�1 151.37519 47.42
Stand age�1/2 �143.8855 44.43
Slope �7.93037 1.38
Slope2 0.21155 0.05
Distance to water2 0.00006 0.00
C in 0–122-year-old clearcuts
Intercept 26.187 9.56 0.57
Stand age 0.11896 0.04
Stand age�1 145.22699 34.03
Stand age�1/2 �134.36371 31.13
Slope �6.03658 0.84
Slope2 0.14947 0.02
Elevation 0.01929 0.01
Distance to water 0.02429 0.01
years. When we categorized plots into 2–9, 10–69, and 70+ age
groups to test for statistical differences, we found mean P in 2–
9-year-old stands differed from mean P in 10–69 and 70+-year-
old stands (F2,748 = 63.17; r2 = 0.14; P < 0.0001), but mean P
in 10–69-year-old stands did not differ from mean P in 70+-
year-old stands. Mean C, however, differed among all three
stand age groups (F2,748 = 22.75; r2 = 0.06; P < 0.0001). Mean
C was highest in 2–9-year-old stands (mean percent
cover = 16.1; S.E. = 2.42), lowest in 10–69-year-old stands
(mean percent cover = 4.2; S.E. = 0.65), and intermediate in
70+-year-old stands (mean percent cover = 7.1; S.E. = 1.13).
4.2. Topography
The top ranked model for C in sampled plots included slope,
topographic position, and aspect. Percent cover in berry plants
was highest on flat slopes, in valleys, and in areas with NW
aspects (Table 1). The top ranked model for P included only
Table 2
Model rankings for cover of berry plants (C) in (A) 0–40-year-old clearcuts and (B)
2001–2002
Model
(A) C in 0–40-year-old clearcuts
Age�1, age�1/2, slope, slope2, distance to water
Age�1, age�1/2, slope, slope2, curvature, aspect, distance to water
Age2, age�1, age�1/2, slope, slope2 distance to water2
Age�1, age�1/2, slope, slope2, curvature2, distance to water2
Null
(B) C in 0–122-year-old clearcuts
Age, age�1, age�1/2, slope, slope2, elevation, distance to water
Age2, age�1, age�1/2, slope, slope2, elevation2, distance to water
Age2, age�1, age�1/2, slope, slope2, elevation, distance to water
Age, age2, age�1, age�1/2, slope, slope2, elevation, elevation2, distance to water
Null
Only the top four models and the null model are presented.
aspect. Production index was highest on NW aspects (Table 1).
Of the 100 stands we sampled, 91 were classified as hardwood,
7 were softwood, and 2 were mixed hardwood and softwood.
Forest type affected neither C (F2,99 = 0.25; P = 0.86) nor P
(F2,99 = 0.68; P = 0.56).
4.3. Spatio-temporal models
The top-ranked model for predicting C included temporal and
topographic parameters. The model that best supported the data
on C in 0–40-year-old stands included stand age�1, stand age�1/2,
slope, slope2, and distance to water2 (Table 2), slope estimates for
variables are provided in Table 3. The null model ranked very low
and had low model weight. The top-ranked model performed
well during model testing (F1,11 = 24.64; r2 = 0.71; P = 0.0006;
Table 4). The model that best fit the data on C in 0–122-year-old
stands (Table 2) performed reasonably well during model testing
(F1,28 = 23.98; r2 = 0.47; P = 0.0001; Table 4).
0–122-year-old clearcuts in Pisgah Bear Sanctuary in western North Carolina,
AICc DAICc Model likelihood K
216.60 0.00 1.00 6
216.98 0.38 0.83 8
218.31 1.71 0.43 7
218.40 1.80 0.41 7
259.77 43.17 0.001
404.25 0.00 1.00 8
405.24 0.99 0.61 8
405.98 1.73 0.42 8
406.41 2.16 0.34 10
465.72 61.47 0.001

M.J. Reynolds-Hogland et al. / Forest Ecology and Management 237 (2006) 103–114110
Table 4
Results of model testing using training data (70% of data, randomly selected)
and testing data (30% of data) for spatio-temporal models of percent cover of
berry plants (C), spatio-temporal models of berry production index (P), and
spatio-temporal models of C � P
Model F d.f. r2 P-value
C in 0–40-year-old clearcuts
Training data 12.09 5, 36 0.66 <0.0001
Testing data 24.64 1, 11 0.71 0.0006
C in 0–122-year-old clearcuts
Training data 9.39 6, 64 0.57 <0.0001
Testing data 23.98 1, 28 0.47 0.0001
P in 0–40-year-old clearcuts
Training data 8.13 6, 36 0.62 <0.0001
Testing data 16.03 1, 11 0.61 0.002
P in 0–122-year-old clearcuts
Training data 9.28 6, 64 0.49 <0.0001
Testing data 6.19 1, 28 0.18 0.019
C � P in 0–40-year-old clearcuts
Training data 7.44 4, 36 0.48 <0.0002
Testing data 0.7 1, 11 0.06 0.42
C � P in 0–122-year-old clearcuts
Training data 5.64 6, 64 0.37 <0.0001
Testing data 3.54 1, 28 0.12 0.07
Berry plants measured included Vacinnium, Rubus, and Gaylussacia spp.
(combined) collected in 0–40-year-old clearcuts (n = 57) and in 0–122-year-
old clearcuts (n = 100) in Pisgah Bear Sanctuary in North Carolina, 2001–2002.
Table 6
Slope estimates and standard errors for variables in the top-ranked model for
predicting the spatio-temporal distribution of percent plant cover (P) of
Vaccinium, Rubus, and Gaylussacia spp. (combined) in 0–40-year-old clearcuts
(n = 57) and in 0–122-year-old clearcuts (n = 100) in Pisgah Bear Sanctuary in
western North Carolina, 2001–2002
Model Slope S.E. r2
P in 0–40-year-old clearcuts
Intercept �6.34536 5.74 0.62
Stand age 0.02317 0.02
Stand age�1 13.04812 3.67
Stand age�1/2 �11.64471 3.19
Elevation 0.01144 0.00
Elevation2 �0.00000633 0.01
Distance to water 0.00115 0.00
P in 0�122-year-old clearcuts
Intercept 0.00891 0.33 0.49
Stand age 0.0059 0.01
Stand age�1 8.5777 1.48
Stand age�1/2 �7.76266 1.36
Slope �0.07351 0.04
Slope2 0.00191 0.00
Distance water 0.00094367 0.00
The top-ranked model for predicting P in 0–40-year-old
stands also included temporal and topographic variables
(Table 5), slope estimates for variables are provided in
Table 6. The top-ranked model performed well during model
testing (F1,11 = 16.03; r2 = 0.61; P = 0.002; Table 4). The
model that best fit the data on P in 0–122-year-old stands
included both temporal and spatial parameters (Table 5), but the
top-ranked model did not perform well during model testing
(F1,28 = 6.19; r2 = 0.18; P = 0.019; Table 4).
Evaluation of model bias showed both spatio-temporal
models of C were not biased by the training data, but one
model of P was biased. The variability in C explained by the
Table 5
Model rankings for berry production index (P) in (A) 0–40-year-old clearcuts and (B
2001–2002
Model AIC
(A) P in 0–40-year-old clearcuts
Age, age�1, age�1/2, elevation, elevation2, distance to water �8
Age�1, age�1/2, distance to water �8
Age�1, age�1/2, elevation, elevation2, distance to water �8
Age�1, age�1/2, distance to water2 �8
Null �6
(B) P in 0–122-year-old clearcuts
Age, age�1, age�1/2, slope, slope2, distance to water �20
Age, age�1, age�1/2, distance to water �20
Age, age2, age�1, age�1/2, slope, slope2, distance to water2 �20
Age, age�1, age�1/2, slope, distance to water �20
Null �12
Only the top four models and the null model are presented.
training data for 0–40-year-old stands (66%; Table 4) was
similar to the variability in predicted C (71%; Table 4).
Similar results were found for the model of C in 0–122-year-
old stands and the model of P in 0–40-year-old stands
(Table 4). However, the variability in P explained by the
training data for 0–122-year-old stands (49%; Table 4)
was not similar to the variability in predicted P (18%;
Table 4).
The top-ranked model for predicting the spatio-temporal
distribution of C � P in 0–40-year-old stands included stand
age�1, stand age�1/2, aspect2, and distance to water2
(F4,36 = 7.44; r2 = 0.48; P = 0.0001), but this model performed
poorly during model testing (F1,11 = 0.70; r2 = 0.06; P = 0.42;
Table 4). Similarly, the model that best fit the data on C � P in
0–122-year-old stands (F6,64 = 5.64; r2 = 0.37; P = 0.0001)
performed poorly during model testing (Table 4). Both models
of C � P were biased by the training data (Table 4).
) 0–122-year-old clearcuts in Pisgah Bear Sanctuary in western North Carolina,
c DAICc Model likelihood K
6.21 0.00 1.00 7
4.54 1.67 0.37 4
4.24 1.97 0.43 6
3.81 2.40 0.30 4
2.24 23.97 0.001
2.80 0.00 1.00 7
1.48 1.32 0.52 5
1.44 1.36 0.51 8
0.62 2.18 0.34 6
0.85 81.95 0.001

M.J. Reynolds-Hogland et al. / Forest Ecology and Management 237 (2006) 103–114 111
Fig. 6. Percent plant cover, with 95% confidence intervals (A), and berry
production index, with 95% confidence intervals (B), for Vaccinium, Rubus, and
Gaylussacia spp. in 794 plots in 0–122-year-old clearcuts in Pisgah Bear
Sanctuary, North Carolina, 2001–2002.
4.4. Cover in berry plants versus berry production
Stand age and topography affected C differently than they
affected P. In 0–122-year-old stands, temporal dynamics
explained P (Fig. 4) but not C (the null model ranked highest
for C; Fig. 5), whereas topographic variables influenced C more
than they influenced P (Table 1). Moreover, the top-ranked
model for both C and P included berry genera. Based on 95%
confidence intervals, C and P differed among berry genera
(Fig. 6). Mean P was highest in Rubus spp. whereas mean C was
highest in Gaylussacia spp. Results of least squares regression
showed mean C predicted mean P (F1,99 = 66.78; r2 = 0.41;
P < 0.0001).
5. Discussion
The relationship between clear-cutting and its effect on
habitat for wild animals is complex. Distilling this complex-
ity requires understanding how clear-cutting affects the
availability of resources that are important to populations of
wild animals. The focus of this paper was to understand how
clear-cutting in the Southern Appalachians affected the
spatio-temporal availability of soft mast.
We found berry production of Rubus, Gaylussacia, and
Vacinnium spp. combined was highest in �2–9-year-old
clearcut stands (Fig. 2). It appeared that berry production was
lowest in �10–69-year-old stands and increased as stands
aged beyond �70 years (Figs. 2 and 4), but we found no
statistical difference in mean berry production between 10–69
and 70+-year-old stands. Based on analysis of continuous
data, we did not find a relationship between stand age and
percent cover in berry plants. When data on percent cover
were grouped into 2–9, 10–69, and 70+ age classes, however,
percent cover differed among all three groups. Percent cover
in berry plants was highest in 2–9-year-old stands, lowest in
10–69-year-old stands, and intermediate in 70+-year-old
stands.
Presence of berry plants did not guarantee berry production.
In 0–40-year-old stands, percent cover of Gaylussacia spp.
plants was approximately equally distributed among stand ages,
but berry production was not. Of the 57 plots in which
Gaylussacia spp. were present in 10–38-year-old stands, 70%
(n = 40) had zero berry production whereas only 20% of the 25
plots in which Gaylussacia spp. were present in 2–9-year-old
stands had zero berry production. Similarly, Vaccinium spp.
plants were approximately equally distributed among 2–38-
year-old clearcuts (Fig. 3), but Vaccinium spp. in 2–9-year-old
stands were three times more likely to be productive than
Vaccinium spp. in 10–38-year-old stands (Fig. 2). These results
indicate that although Gaylussacia and Vaccinium spp. were
present in 2–38-year-old stands, they were highly productive in
only �2–9-year-old stands. Moola and Mallik (1998) similarly
found Vaccinium myrtilloides plants persisted in both clearcut
stands and older stands, but plants in older stands were
relatively unproductive. V. myrtilloides demonstrate morpho-
logical plasticity in that leaf area, leaf weight, and proportion of
total biomass in stems and foliage change along a light gradient
(Moola and Mallik, 1998), which may help explain why these
plants can persist in both open and closed canopies. Assuming
sunlight is a necessary prerequisite to berry production,
however, berry production of Vaccinium spp. plants located
in stands with relatively high canopy cover are unlikely to be
productive.
Beyond stand age 40, availability of soft mast in our study
remained relatively low until, at most, stand age 70 (Figs. 4 and
5). Of the 50 plots we sampled that were located in 34–69-year-
old stands, we found berry plants in only two plots (4%; Fig. 5),
suggesting the range of stand ages in which soft mast was
lowest was �10–69 years. Our ability to detect soft mast
availability in 34–69-year-old stands may have been compro-
mised because our sample size of these stands was relatively
small (few stands in our study site during 2001–2002 were 34–
69 years old). A conservative estimate of the range of stand ages
in which soft mast was lowest is �10–40-year-old stands.
Future research should test our results by measuring soft mast
in other Southern Appalachian forests that contain a larger
sample of 34–69-year-old clearcut stands.
Our results did not support Brody and Stone’s (1987)
hypothesis about the temporal dynamics of soft mast
availability in Southern Appalachian clearcuts (Fig. 1). They
hypothesized soft mast availability would be highest in young
stands, after which it would gradually decline and asymptote
when stands reach age �70. Our data showed berry production
peaked in �2–9-year-old stands, but then plummeted and
remained very low for 30–60 years (Figs. 2 and 4), after which
it appeared to increase. Importantly, Brody and Stone (1987)

M.J. Reynolds-Hogland et al. / Forest Ecology and Management 237 (2006) 103–114112
hypothesized soft mast availability would be lowest in stands
70+ years old, but we found soft mast availability was lowest in
intermediate aged stands. This finding is significant because it
suggests that area in intermediate aged stands, not area in older
stands, should be minimized to optimize availability of soft
mast on forested landscapes in the Southern Appalachians.
Our results regarding the high availability of soft mast in
young stands generally agreed with findings from previous
studies on harvesting effects in Minnesota (Noyce and Coy,
1990), Maryland (Matlack et al., 1993), New York (Costello
and Sage, 1994), Quebec (Archambault et al., 1998), Arkansas
(Perry et al., 1999) and North Carolina (Mitchell and Powell,
2003) as well as findings from previous studies on burn effects
in western North Carolina (Elliott et al., 1999) and New Jersey
(Matlack et al., 1993). Our results regarding the low availability
of soft mast in intermediate-aged stands corroborated findings
by Noyce and Coy (1990) who found percent cover in berry
plants was higher in 60+-year-old stands compared to that in
30–59-year-old stands. Similarly, Ihalainen et al. (2003) found
Vaccinium myrtillus was most abundant in mature stands in a
boreal forest in Finland, not intermediate aged stands.
The temporal dynamics in soft mast availability we found
were probably due to changes in canopy closure. In recently
harvested stands, the forest canopy is relatively open providing
opportunities for early successional plants, such as Rubus spp., to
flourish. We also found that Vaccinium spp. and Gaylusacia spp.
established and produced berries in young stands (Figs. 2–5),
which corroborated previous findings by Moola and Mallik
(1998).
After stands aged beyond �10 years, the sharp decline in
soft mast availability probably occurred because forest
canopies began to close, making forest conditions less ideal
for early successional species (e.g., Rubus spp.) and other
species (e.g., Vaccinium and Gaylussacia spp.). Canopy closure
in intermediate aged stands may have been too high for berry
production, which would help explain why soft mast
availability was relatively low in intermediate aged stands.
Older stands (70+ years old) have relatively closed forest
canopies, but sunlight can often reach the forest floor due to
occasional tree gaps (Frelich and Reich, 1995; Johnston, 1996),
which may help explain why soft mast availability in 70+-year-
old stands was higher than that in 10–69-year-old stands.
We did not test if canopy closure was the mechanism
underlying the temporal trends we documented, but results
from a previous study supports predictions from this hypoth-
esis. Although rate of forest succession depends on numerous
variables including moisture, temperature, duration of solar
radiation, soil fertility, site condition, species availability, and
herbivory (Donnegan and Rebertus, 1999; Gleeson and Tilman,
1990; Pickett and McDonnell, 1989), forests in the northeast
and far upper midwest should have slower successional rates
than forests in the Southern Appalachians, on average, because
the growing season is shorter in the former. Therefore, forest
canopies in the northeast should close slower after clear-cutting
compared to rate of canopy closure in the Southern
Appalachians. Hence, the range of stand ages in which soft
mast availability peaks should be higher in the northeast
compared to that in the Southern Appalachians. Soft mast
availability in New York was highest in 1–16-year-old stands
(Costello and Sage, 1994), whereas it was highest in 2–9-year-
old stands in our study.
Our findings yielded two additional insights regarding soft
mast availability at a landscape scale. Although mean P was
highest for Rubus spp. (Fig. 5) and Vacinnium spp. were found
in the most number of plots (129 plots), Gaylussacia spp.
probably contributed most to total soft mast availability on the
Pisgah Bear Sanctuary landscape. Intuitively, the contribution
each genus makes to total soft mast should be a function of the
number of plots in which the genus was found, C, and P.
Gaylussacia spp. were located in 115 plots, within which mean
C was 30% and mean P was 0.65. Alternatively, Rubus spp.
were located in 56 plots, mean C was 17%, and mean P was
1.43. Finally, Vaccinium spp. were located in 129 plots, mean C
was 6.5%, and mean P was 0.32. Assuming the contribution
each genus makes to total soft mast availability is based on the
interaction of all three measures of soft mast, Gaylussacia spp.
contributed most (115 � 0.30 � 0.65 = 22.42), Rubus spp.
contributed the second most (56 � 0.17 � 1.43 = 13.61), and
Vaccinium spp. contributed the least (129 � 0.065 �0.32 = 2.68).
Surprisingly, Vaccinium spp. contributed the least to total
availability of soft mast on the landscape, even though it was
found in more plots than either Gaylussacia spp. or Rubus spp.
Such counterintuitive results provide insights not only about the
ecological system in our study site, but also about research
techniques that measure resource availability with only
presence/absence data. Clearly, presence/absence data alone
may lead to biased inferences.
Estimates of C and P did not always provide similar
information about soft mast availability. Topography and
spatial location on the landscape influenced C more than it
influenced P (Table 1), whereas the relationship between stand
age and P (F4,69 = 6.33; r2 = 0.28; P < 0.0002; Fig. 4) was
stronger than the relationship between stand age and C
(F4,69 = 1.50; r2 = 0.08; P = 0.21). Moreover, analysis of only
P suggested Rubus spp. contributed most to total soft mast
availability, whereas analysis of only C suggested Gaylussacia
spp. contributed most (Fig. 6). In addition, data for C did not
always correlate with data for P, particularly as stands aged
beyond 10 years (Figs. 2 and 3).
We were unable to develop an unbiased model for predicting
the spatio-temporal distribution of C � P on forested land-
scapes in the Southern Appalachians. Our statistical models of
C � P had fairly high r2 values during model development, but
they performed poorly during model testing (Table 4). Our
sample size may have been too small to capture both temporal
and spatial variability necessary to model C � P, given P was
most affected by temporal dynamics whereas C was most
affected by topography and spatial location.
We were able to predict the spatio-temporal distribution of
C. The model for C in 0–40-year-old stands explained 71%
variability in predicted C and the model for C in 0–122-year-old
stands explained 47% variability in predicted C. Importantly,
both models were unbiased, indicating the inferences about the
M.J. Reynolds-Hogland et al. / Forest Ecology and Management 237 (2006) 103–114 113
spatio-temporal distribution of C extended beyond our sampled
data. Therefore, our models can be used to map the spatio-
temporal distribution of C on forested landscapes in the
Southern Appalachian Mountains. In addition, the methods we
used to estimate the distribution of C may be useful for
estimating distributions of other resources.
6. Summary and conservation implications
Although soft mast availability was highest in young stands
(2–9 years old), the duration of availability was short (�7
years). Alternatively, soft mast availability was very low in
intermediate-aged stands and remained very low for a long time
(�30–60 years). Older stands (�70+ years) supported
intermediate levels of soft mast for a relatively long period
(50+ years). These results indicate that both young stands (2–9
years old) and older stands (70+ years old) should be
maintained to sustain availability of soft mast across forested
landscapes in the Southern Appalachians. Simultaneously, area
of intermediate aged stands, where soft mast availability is
lowest, should be minimized. One way to achieve this goal is to
burn or harvest intermediate aged stands.
In both our study and the study by Noyce and Coy (1990),
availability of soft mast was lowest in intermediate aged
stands. If older stands (which support intermediate levels of
soft mast) are clearcut for the purpose of increasing soft mast
availability, the immediate benefits of increased soft mast
over a short duration (i.e., when stands are �2–9 years old)
may or may not outweigh the longer term costs of decreased
soft mast over a long duration (when stands are �10–69 years
old). Any conservation plan that uses clear-cutting to increase
soft mast availability, therefore, must carefully consider the
tradeoffs associated with short-term benefits and longer-term
costs. This tradeoff is more compelling when other manage-
ment objectives are also considered. For example, managers
in the Southern Appalachian Mountains are often tasked to
maintain simultaneous availabilities of soft mast and hard
mast. While clearcuts affect the availability of soft mast
positively, at least for �7 years, clearcuts affect the
availability of hard mast negatively for 25–50 years, the
time required for regenerating hardwoods to reach reproduc-
tive age in the Southern Appalachians (Burns and Honkala,
1990). How these tradeoffs are evaluated for any system may
differ depending on management goals and the stand age
distribution of the managed forest, but our results suggest
managers can maximize both soft mast and hard mast by, at
least, minimizing the proportion of the landscape that
provides neither soft mast nor hard mast (i.e., stand ages
10–25 years old).
We found percent cover of soft mast plants was affected by
landscape position, slope, and aspect whereas berry production
was influenced by aspect. If a management objective is to
increase levels of soft mast on forested landscapes in the
Southern Appalachians by using clearcutting, then clearcuts
should be placed in flat valleys with NW aspects to maximize
the probability that berry plants will establish and be
productive.
Acknowledgements
We gratefully thank J.S. Hogland and J.B. Grand for review
comments. P. Riley, D. Brown, and L.L. Brongo helped collect
data. This research received financial or logistical support from
Alabama Cooperative Fish and Wildlife Research Unit at
Auburn University, Auburn University’s Peaks of Excellence
Program, Auburn University’s Center for Forest Sustainability,
B. Bacon and K. Bacon, Earthwatch-The Center for Field
Research, and the EPA Star Fellowship Program. Although the
research described in this manuscript has been funded in part by
the United States Environmental Protection Agency through
grant/cooperative agreement U-91620601 to Melissa Reynolds,
it has not been subjected to the Agency’s required peer and
policy review and therefore does not necessarily reflect the
views of the Agency and no official endorsement should be
inferred.
References
Akaike, H., 1973. Information theory and an extension of the maximum
likelihood principle. In: Petrov, B., Cazakil, F. (Eds.), Proceedings of the
Second International Symposium on Information Theory, Aakademiai
Kidao, Budapest.
Anderson, D.R., Burnham, K.P., White, G.C., 1994. AIC model selection in
overdispersed capture-recapture data. Ecology 75, 1780–1793.
Archambault, L., Morissette, J., Bernier-Cardow, M., 1998. Forest succession
over a 20-year period following clearcutting in balsam fir-yellow
birch ecosystems of eastern Quebec, Canada. For. Ecol. Manage. 102,
61–74.
Beers, T.W., Dress, P.E., Wensel, L.C., 1966. Aspect transformation in site
productivity research. J. Forest. 64, 691–692.
Boddy, M., 1991. Some aspects of frugivory by bird populations using coastal
dune scrub in Lincholnshire. Bird Study 38, 188–199.
Brody, A.J., Stone, J.N., 1987. Timber harvest and black bear population
dynamics in a Southern Appalachian forest. Int. Conf. Bear Res. Manage.
7, 243–250.
Burns, R.M., Honkala, B.H., 1990. Silvics of North America. U.S. Dept. of
Agriculture, Forest Service, Washington, DC.
Castleberry, N.L., Castleberry, S.B., Ford, W.M., Wood, P.B., Mengak, M.T.,
2002. Allegheny woodrat (Neotoma magister) food habits in the central
Appalachians American midland naturalist 147, 80–92.
Clark, J.D., Clapp, E.L., Smith, K.G., Ederington, B., 1994. Black bear habitat
use in relation to food availability in the interior highlands of Arkansas. Int.
Conf. Bear Res. Manage. 9, 309–318.
Continuous Inventory Stand Condition Database, Pisgah Ranger District,
USDA Forest Service, 2001. in press.
Costello, C.M., Sage, R.W., 1994. Predicting black bear habitat selection from
food abundance under 3 forest management systems. Int. Conf. Bear Res.
Manage. 9, 375–387.
Donnegan, J.A., Rebertus, A.J., 1999. Rates and mechanisms of subalpine forest
succession along an environmental gradient. Ecology 80, 1370–1384.
Elliott, K.J., Hendrick, R.L., Major, A.E., Vose, J.M., Swank, W.T., 1999.
Vegetation dynamics after a prescribed fire in the Southern Appalachians.
For. Ecol. Manage. 114, 199–213.
Elowe, K.D., Dodge, W.E., 1989. Factors affecting black bear reproductive
success and cubsurvival. J. Wildlife Manage. 53, 962–968.
Frelich, L.E., Reich, P.B., 1995. Spatial patterns and succession in a Minnesota
southern boreal forest. Ecol. Monogr. 65, 325–346.
Gleeson, S.K., Tilman, D., 1990. Allocation and the transient dynamics of
succession on poor soils. Ecology 71, 1144–1155.
Hermann, K.A. (Ed.), 1996. The Southern Appalachian Assessment GIS Data
Base CD ROM Set. Southern Appalachian Man and the Biosphere Program,
Norris, TN.

M.J. Reynolds-Hogland et al. / Forest Ecology and Management 237 (2006) 103–114114
Hurlbert, S.H., 1984. Pseudoreplication and the design of ecological field
experiments. Ecol. Monogr. 54, 187–211.
Ihalainen, M., Salo, K., Pukkala, T., 2003. Empirical predictions models for
Vaccinium myrtillus and V. vitis-idaea berry yields in North Karelia, Fin-
land. Silva Fennica 37, 95–108.
Johnson, A.S., Landers, J.L., 1978. Fruit production in slash pine plantations in
Georgia. J. Wildlife Manage. 42, 1978.
Johnson, C.J., Seip, D.R., Boyce, M.S., 2004. A quantitative approach to
conservation planning: using resource selection functions to map the
distribution of mountain caribou at multiple spatial scales. J. Appl. Ecol.
41, 238–251.
Johnston, M., 1996. The role of disturbance in boreal mixedwood forests of
Ontario. In: Smith, C.R., Crook, G.W. (Eds.), Proceedings of the Workshop
on Advancing Boreal Mixedwood Management in Ontario, October 17–19,
1995, Sault Ste. Marie, Ont, Natural Resources Canada, Canadian Forest
Service and Ontario Ministry of Natural Resources, Sault Ste Marie, Ont,
pp. 33–40.
Jonkel, C.J., Cowan, I.M., 1971. The black bear in the spruce-fir forest. Wildlife
Monogr. 27 .
Matlack, G.R., Gibson, D.J., Good, R.E., 1993. Regeneration of the shrub
Gaylussacia baccata and associated species after low intensity fire in an
Atlantic coastal plain forest. Am. J. Bot. 80, 119–126.
McCarty, J.P., Levey, D.J., Greenberg, C.H., Sargent, S., 2002. Spatial and
temporal variation in fruit use by wildlife in a forested landscape. For. Ecol.
Manage. 164, 277–291.
Mitchell, M.S., Zimmerman, J.W., Powell, R.A., 2002. Test of a habitat
suitability index for black bears in the Southern Appalachians. Wildlife
Soc. Bull. 30, 794–808.
Mitchell, M.S., Powell, R.A., 2003. Response of black bears to forest
management in the Southern Appalachian Mountains. J. Wildlife Manage.
67, 692–705.
Moola, F.M., Mallik, A.U., 1998. Morphological plasticity and regeneration
strategies of velvet leaf blueberry (Vaccinium myrtilloides Michx) following
canopy disturbance in boreal mixedwood forests. For. Ecol. Manage. 111,
35–50.
Neter, J., Kutner, M.H., Nachtsheim, C.J., Wasserman, W., 1996. Applied
Linear Statistical Models, 4th ed. The McGraw-Hill Companies Inc.,
New York.
Noyce, K.V., Coy, P.L., 1990. Abundance and productivity of bear food species
in different forest types of northcentral Minnesota. Int. Conf. Bear Res.
Manage. 8, 169–181.
Perry, R.W., Thill, R.E., Peitz, D.G., Tappe, P.A., 1999. Effects of different
silvicultural systems on initial soft mast production. Wildlife Soc. Bull. 27,
915–923.
Pickett, S.T.A., McDonnell, M.J., 1989. Changing perspectives in community
dynamics: a theory of successional forces. Trends Ecol. Evol. 42,
241–245.
Powell, R.A., Zimmerman, J.W., Seaman, D.E., 1997. Ecology and Behavior
North American Black Bears: Home Ranges, Habitat and Social Organiza-
tion. Chapman and Hall Publishers, London.
Ramsey, F.L., Schafer, D.W., 2002. The Statistical Sleuth: A Course in Methods
of Data Analysis, 2nd ed. Duxbury, Pacific Grove, CA, USA.
SAS Institute Inc., 2000. SAS/STAT User’s Guide. Version 6. SAS Institute Inc.,
Cary, NC, USA.
Stransky, J.J., Roese, J.H., 1984. Promoting soft mast for wildlife in intensively
managed forests. Wildlife Soc. Bull. 12, 234–239.
Thomas, D.W., 1984. Fruit intake and energy budgets of frugivorous bats.
Physiol. Zool. 57, 457–467.
Thompson III, F.R., Fritzell, E.K., 1986. Fall foods and nutrition of ruffed
grouse in Missouri USA. Trans. Missouri Acad. Sci. 20, 45–48.
Willson, M.F., 1986. Avian frugivory and seed dispersal in eastern North
America. Curr. Ornithol. 3, 223–279.