Embed Size (px)
Citation preview
HAL Id: hal-01307672https://hal-amu.archives-ouvertes.fr/hal-01307672
Submitted on 26 Apr 2016
HAL is a multi-disciplinary open accessarchive for the deposit and dissemination of sci-entific research documents, whether they are pub-lished or not. The documents may come fromteaching and research institutions in France orabroad, or from public or private research centers.
L’archive ouverte pluridisciplinaire HAL, estdestinée au dépôt et à la diffusion de documentsscientifiques de niveau recherche, publiés ou non,émanant des établissements d’enseignement et derecherche français ou étrangers, des laboratoirespublics ou privés.
Spatio-temporal analysis of malaria within atransmission season in Bandiagara, Mali
Drissa Coulibaly, Stanislas Rebaudet, Mark Travassos, Youssouf Tolo,Matthew Laurens, Ak Kone, Karim Traore, Ando Guindo, Issa Diarra,
Amadou Niangaly, et al.
To cite this version:Drissa Coulibaly, Stanislas Rebaudet, Mark Travassos, Youssouf Tolo, Matthew Laurens, et al.. Spatio-temporal analysis of malaria within a transmission season in Bandiagara, Mali. Malaria Journal,BioMed Central, 2013, <10.1186/1476-072X-2-5>. <hal-01307672>
Coulibaly et al. Malaria Journal 2013, 12:82http://www.malariajournal.com/content/12/1/82
RESEARCH Open Access
Spatio-temporal analysis of malaria within atransmission season in Bandiagara, MaliDrissa Coulibaly1*, Stanislas Rebaudet3, Mark Travassos2, Youssouf Tolo1, Matthew Laurens2, Abdoulaye K Kone1,Karim Traore1, Ando Guindo1, Issa Diarra1, Amadou Niangaly1, Modibo Daou1, Ahmadou Dembele1,Mody Sissoko1, Bourema Kouriba1, Nadine Dessay4, Jean Gaudart3, Renaud Piarroux3, Mahamadou A Thera1,Christopher V Plowe2 and Ogobara K Doumbo1
Abstract
Background: Heterogeneous patterns of malaria transmission are thought to be driven by factors including hostgenetics, distance to mosquito breeding sites, housing construction, and socio-behavioural characteristics. Evaluation oflocal transmission epidemiology to characterize malaria risk is essential for planning malaria control and eliminationprogrammes. The use of geographical information systems (GIS) techniques has been a major asset to this approach.To assess time and space distribution of malaria disease in Bandiagara, Mali, within a transmission season, data wereused from an ongoing malaria incidence study that enrolled 300 participants aged under six years old”.
Methods: Children’s households were georeferenced using a handheld global position system. Clinical malaria wasdefined as a positive blood slide for Plasmodium falciparum asexual stages associated with at least one of the followingsigns: headache, body aches, fever, chills and weakness. Daily rainfall was measured at the local weather station.Landscape features of Bandiagara were obtained from satellite images and field survey. QGIS™ software was used tomap malaria cases, affected and non-affected children, and the number of malaria episodes per child in each block ofBandiagara. Clusters of high or low risk were identified under SaTScanW software according to a Bernoulli model.
Results: From June 2009 to May 2010, 296 clinical malaria cases were recorded. Though clearly temporally related tothe rains, Plasmodium falciparum occurrence persisted late in the dry season. Two “hot spots” of malaria transmissionalso found, notably along the Yamé River, characterized by higher than expected numbers of malaria cases, and highnumbers of clinical episodes per child. Conversely, the north-eastern sector of the town had fewer cases despite itsproximity to a large body of standing water which was mosquito habitat.
Conclusion: These results confirm the existence of a marked spatial heterogeneity of malaria transmission inBandiagara, providing support for implementation of targeted interventions.
Keywords: Malaria, Geographic information system, Malaria transmission heterogeneity
BackgroundMalaria is one of the leading causes of morbidity andmortality in the world, with an estimated 3.3 billionpeople at risk of malaria [1]. The incidence of malariaworldwide is estimated to be 216 million cases per year,with 81% of these cases occurring in sub-Saharan Africa.Malaria kills approximately 655,000 people per year; 91%of deaths occur in sub-Saharan Africa [1], mostly in
* Correspondence: [email protected] of Epidemiology of Parasitic Diseases, Faculty of Medicine andDentistry, University of Sciences, Techniques and Technologies of Bamako,BP 1805, Point G, Bamako, MaliFull list of author information is available at the end of the article
© 2013 Coulibaly et al.; licensee BioMed CentrCommons Attribution License (http://creativecreproduction in any medium, provided the or
children under five years of age. In Mali, West Africa,malaria represents 36.5% of consultation motives inhealth center, it is a leading cause of morbidity and mor-tality children of less than five years of age and the firstreason of anaemia in pregnant women [2]. Malariatransmission is seasonal.Malaria parasite transmission and clinical disease are
characterized by important microgeographic variation,often between adjacent villages, households or families[3-8]. This local heterogeneity is driven by a variety offactors including human genetics [9,10], distance to po-tential breeding sites [11,12], housing construction
al Ltd. This is an Open Access article distributed under the terms of the Creativeommons.org/licenses/by/2.0), which permits unrestricted use, distribution, andiginal work is properly cited.
Coulibaly et al. Malaria Journal 2013, 12:82 Page 2 of 9http://www.malariajournal.com/content/12/1/82
[2,13-16], presence of domestic animals near the house-hold [17,18], and socio-behavioural characteristics[6,12,19,20]. WHO recommends the geographic stratifi-cation of malaria risk. An analysis of the local epidemio-logical situation is therefore essential, and such analysesformed one of the priorities of the 18th WHO Report[21], reiterated in the 20th WHO Report [22]. This in-volves an analysis of local variations, making it possibleto define high-risk zones on a fine geographical scale,with the aim of increasing the efficacy of anti-malariameasures [23]. Setting up anti-malaria programmestargeting specific zones is therefore a priority. The devel-opment of Geographical Information Systems (GIS) hasbeen an indispensable asset to this approach [24].While seldom prioritized in the planning of malaria
control by national programmes, the understanding ofthe microepidemiology of malaria is important to the de-sign of effective small-area interventions [3,18], particu-larly in areas of unstable or very low transmission. Toassess space-time local heterogeneity of disease, statisticsthat detect the presence of significant small-area diseaseclusters are often useful [2,7,25]. The space-time cluster-ing of malaria has also been described, mainly in moder-ate to high transmission settings [2,13,26-30]. A fewstudies showed a difference of malaria risk at the re-gional or local level [27,31]. A precise knowledge of thegeographic zones at risk, the levels of risk, the variousrisk factors, and the exposed populations, is requiredparticularly in sites where malaria vaccines are tested. Inorder to assess space and time distribution of malariadisease in children in Bandiagara, Mali, within a trans-mission season, the data from a malaria incidence studyhave been used.
MethodsStudy areaThis space-time description of malaria distribution amongchildren in Bandiagara, Mali is part of a multi-year cohortsurvey conducted by the Malaria Research and TrainingCenter (MRTC) as part of the Bandiagara Malaria Project(BMP). This survey measures the age-specific incidencerates of clinical malaria episodes at a site dedicated to mal-aria clinical trials. Auxiliary parts of the project includemolecular epidemiology studies, as well as Plasmodiumfalciparum genomic and transcriptomic analyses and sero-logical investigations.Bandiagara is a town, of approximately 13,364 inhabi-
tants, situated in north-eastern Mali in West Africa(Figure 1) on a rocky plain above the Dogon escarpmentand receiving a mean annual rainfall of 600 mm. The rainyseason spans from June to October and the dry seasonfrom November to May. Bandiagara has a small river, theYamé, a minor tributary of the Niger which stops flowingduring the dry season, and transient post rainfall standing
water body during the rainy season. Anopheles gambiae isthe principal malaria vector and malaria transmission ishighly seasonal meso- to hyperendemic [32].With less than one infecting bite per person per month
at the height of the dry season in March, the transmissionseason starts in June, peaks at up to 60 infected mosquitobites per person per month in August or September, andends in December Following transmission fluctuations,malaria incidence is seasonal too, with an intense peak inSeptember to October. In 1999, the clinical malaria inci-dence was 1.7 episodes per transmission season in chil-dren less than 10 years [33,34]. Plasmodium falciparumrepresents 97% of malaria infections, Plasmodiummalariae 3%, and rare infections are due to Plasmodiumovale.
Cohort descriptionThis study was approved by institutional review boards ofthe Faculty of Medicine, Pharmacy and Dentistry of theUniversity of Mali and of the University of MarylandSchool of Medicine. After obtaining permission to work inthe community from local officials, elders, and traditionalhealers as described by Diallo et al. [35], the study waspublicized by local radio broadcast, and parents were in-vited to accompany children aged up to six years to theBMP research clinic to be screened for eligibility. Childrenin the target age group were eligible for inclusion in thestudy if they met each of the following inclusion criteria:below six years of age at the time of screening, resident inBandiagara town, good general health based on clinicalevaluation, written informed consent obtained from theparent/guardian, and participation feasible through the48-month follow up. Exclusion criteria were: simultaneousparticipation in an interventional clinical trial, chronicmedication with known anti-malarial activity (such astrimethoprim-sulphamethoxazole for prevention of AIDS-associated opportunistic infections), or any conditionthat in the opinion of the principal investigator wouldjeopardize the safety or rights of a participant in the trialor would render the participant unable to comply with theprotocol.Active and passive surveillance were conducted to cap-
ture the incidence of malaria infection and disease. Activesurveillance consisted of scheduled monthly visits aimedat detecting asymptomatic malaria infection and anaemia.Clinical examination of the participants was performed bythe study physician at enrolment and on a quarterly basis.Following standard protocols, finger-prick blood sampleswere collected monthly for malaria smears, measurementof haemoglobin level, and parasite genotyping from filterpaper. Venous blood was collected quarterly for molecularand immunological analyses. Passive surveillance con-sisted of continuous availability of free, expeditious, highquality, basic medical care at the BMP research clinic and
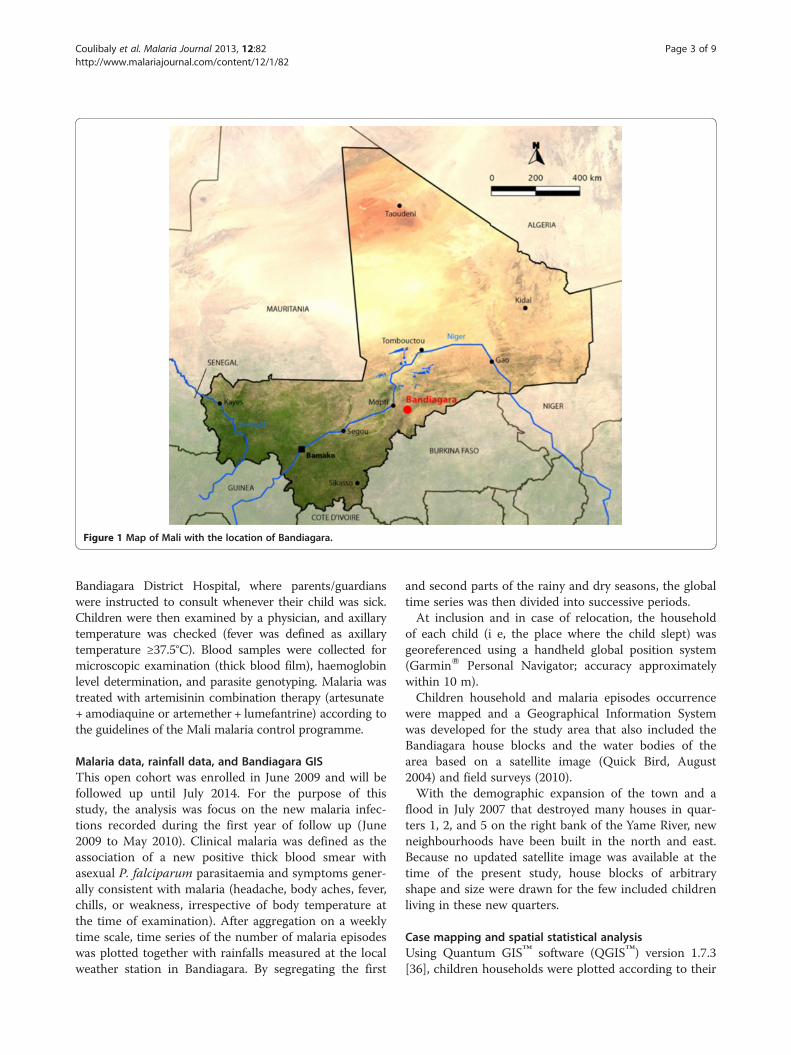
Figure 1 Map of Mali with the location of Bandiagara.
Coulibaly et al. Malaria Journal 2013, 12:82 Page 3 of 9http://www.malariajournal.com/content/12/1/82
Bandiagara District Hospital, where parents/guardianswere instructed to consult whenever their child was sick.Children were then examined by a physician, and axillarytemperature was checked (fever was defined as axillarytemperature ≥37.5°C). Blood samples were collected formicroscopic examination (thick blood film), haemoglobinlevel determination, and parasite genotyping. Malaria wastreated with artemisinin combination therapy (artesunate+ amodiaquine or artemether + lumefantrine) according tothe guidelines of the Mali malaria control programme.
Malaria data, rainfall data, and Bandiagara GISThis open cohort was enrolled in June 2009 and will befollowed up until July 2014. For the purpose of thisstudy, the analysis was focus on the new malaria infec-tions recorded during the first year of follow up (June2009 to May 2010). Clinical malaria was defined as theassociation of a new positive thick blood smear withasexual P. falciparum parasitaemia and symptoms gener-ally consistent with malaria (headache, body aches, fever,chills, or weakness, irrespective of body temperature atthe time of examination). After aggregation on a weeklytime scale, time series of the number of malaria episodeswas plotted together with rainfalls measured at the localweather station in Bandiagara. By segregating the first
and second parts of the rainy and dry seasons, the globaltime series was then divided into successive periods.At inclusion and in case of relocation, the household
of each child (i e, the place where the child slept) wasgeoreferenced using a handheld global position system(GarminW Personal Navigator; accuracy approximatelywithin 10 m).Children household and malaria episodes occurrence
were mapped and a Geographical Information Systemwas developed for the study area that also included theBandiagara house blocks and the water bodies of thearea based on a satellite image (Quick Bird, August2004) and field surveys (2010).With the demographic expansion of the town and a
flood in July 2007 that destroyed many houses in quar-ters 1, 2, and 5 on the right bank of the Yame River, newneighbourhoods have been built in the north and east.Because no updated satellite image was available at thetime of the present study, house blocks of arbitraryshape and size were drawn for the few included childrenliving in these new quarters.
Case mapping and spatial statistical analysisUsing Quantum GIS™ software (QGIS™) version 1.7.3[36], children households were plotted according to their
Coulibaly et al. Malaria Journal 2013, 12:82 Page 4 of 9http://www.malariajournal.com/content/12/1/82
geographic coordinates. Numerous children, likely sib-lings of the same family, shared the same location. Foreach corrected location, data were subsequently aggre-gated, and several variables were calculated: initial num-ber of study participant, total and daily number ofrecorded malaria episodes, daily number of susceptiblechildren (taking into account the excluded children anda three-week refractory period after a malaria episode).After aggregating data at the house block level, the meannumber of malaria episodes per child was calculated foreach block over the entire year. The mean number ofmalaria episodes per child-week was also calculated foreach successive period.Using QGIS™, the numbers of included children asnd
malaria episodes were mapped using proportional circles.The spatial distribution of malaria risk was illustrated bychoropleth mapping at the block level of the mean num-ber of malaria episodes per child, as described above.In order to better assess the spatial variability of malaria
risk, a cluster analysis was performed using Kulldorff ’s sta-tistics through the SaTScanW software [25,37]. This widelyapplied method [5,38-40] moves a circular or elliptic scan-ning window over the study area and compares observedand expected case numbers inside and outside this win-dow in order to detect clusters and estimate risk ratios.Using daily malaria episodes and susceptible children ateach location, a Bernouilli distribution model with 50% ofthe population at risk, and elliptic scanning windows, highor low risk purely spatial clusters were sought over thewhole year and over each study period. The standardizedincidence ratio (SIR) was defined as the ratio of observedto expected cases. Cluster significance (P-value) was com-puted with a likelihood ratio test provided by a MonteCarlo approach using 999 random simulations under thenull hypothesis of no cluster. Statistically significant spatialclusters (P-value < 0.05) were subsequently mapped onQGIS™.
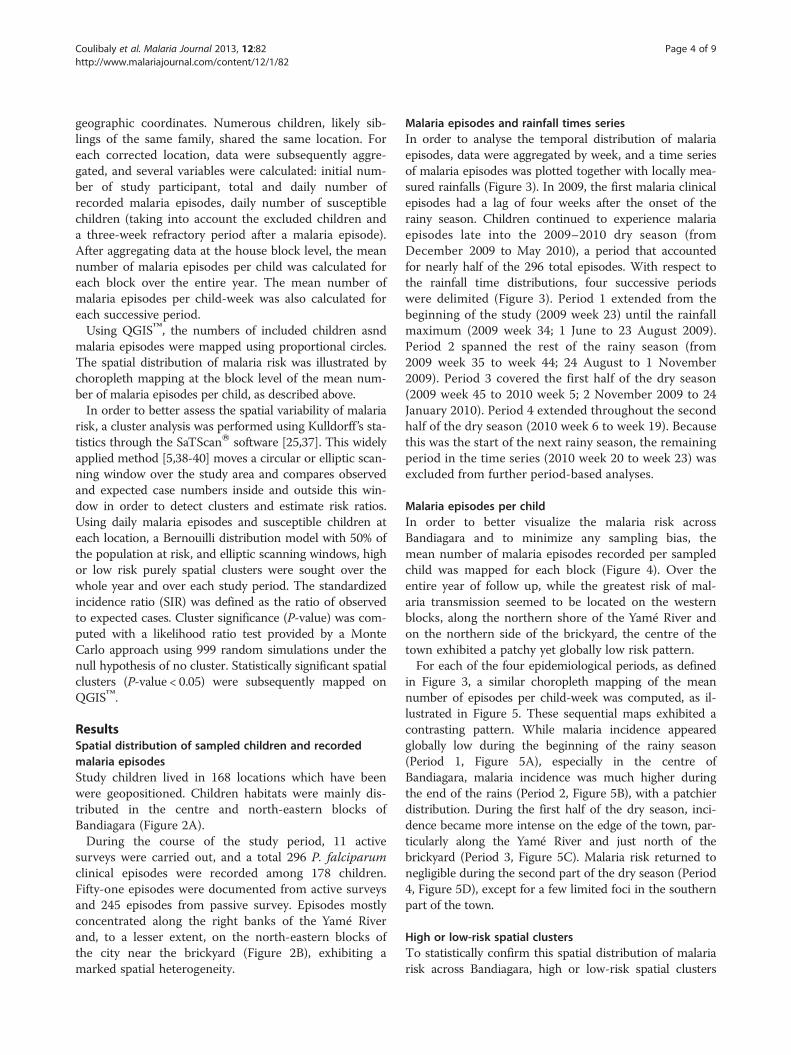
ResultsSpatial distribution of sampled children and recordedmalaria episodesStudy children lived in 168 locations which have beenwere geopositioned. Children habitats were mainly dis-tributed in the centre and north-eastern blocks ofBandiagara (Figure 2A).During the course of the study period, 11 active
surveys were carried out, and a total 296 P. falciparumclinical episodes were recorded among 178 children.Fifty-one episodes were documented from active surveysand 245 episodes from passive survey. Episodes mostlyconcentrated along the right banks of the Yamé Riverand, to a lesser extent, on the north-eastern blocks ofthe city near the brickyard (Figure 2B), exhibiting amarked spatial heterogeneity.
Malaria episodes and rainfall times seriesIn order to analyse the temporal distribution of malariaepisodes, data were aggregated by week, and a time seriesof malaria episodes was plotted together with locally mea-sured rainfalls (Figure 3). In 2009, the first malaria clinicalepisodes had a lag of four weeks after the onset of therainy season. Children continued to experience malariaepisodes late into the 2009–2010 dry season (fromDecember 2009 to May 2010), a period that accountedfor nearly half of the 296 total episodes. With respect tothe rainfall time distributions, four successive periodswere delimited (Figure 3). Period 1 extended from thebeginning of the study (2009 week 23) until the rainfallmaximum (2009 week 34; 1 June to 23 August 2009).Period 2 spanned the rest of the rainy season (from2009 week 35 to week 44; 24 August to 1 November2009). Period 3 covered the first half of the dry season(2009 week 45 to 2010 week 5; 2 November 2009 to 24January 2010). Period 4 extended throughout the secondhalf of the dry season (2010 week 6 to week 19). Becausethis was the start of the next rainy season, the remainingperiod in the time series (2010 week 20 to week 23) wasexcluded from further period-based analyses.
Malaria episodes per childIn order to better visualize the malaria risk acrossBandiagara and to minimize any sampling bias, themean number of malaria episodes recorded per sampledchild was mapped for each block (Figure 4). Over theentire year of follow up, while the greatest risk of mal-aria transmission seemed to be located on the westernblocks, along the northern shore of the Yamé River andon the northern side of the brickyard, the centre of thetown exhibited a patchy yet globally low risk pattern.For each of the four epidemiological periods, as defined
in Figure 3, a similar choropleth mapping of the meannumber of episodes per child-week was computed, as il-lustrated in Figure 5. These sequential maps exhibited acontrasting pattern. While malaria incidence appearedglobally low during the beginning of the rainy season(Period 1, Figure 5A), especially in the centre ofBandiagara, malaria incidence was much higher duringthe end of the rains (Period 2, Figure 5B), with a patchierdistribution. During the first half of the dry season, inci-dence became more intense on the edge of the town, par-ticularly along the Yamé River and just north of thebrickyard (Period 3, Figure 5C). Malaria risk returned tonegligible during the second part of the dry season (Period4, Figure 5D), except for a few limited foci in the southernpart of the town.
High or low-risk spatial clustersTo statistically confirm this spatial distribution of malariarisk across Bandiagara, high or low-risk spatial clusters
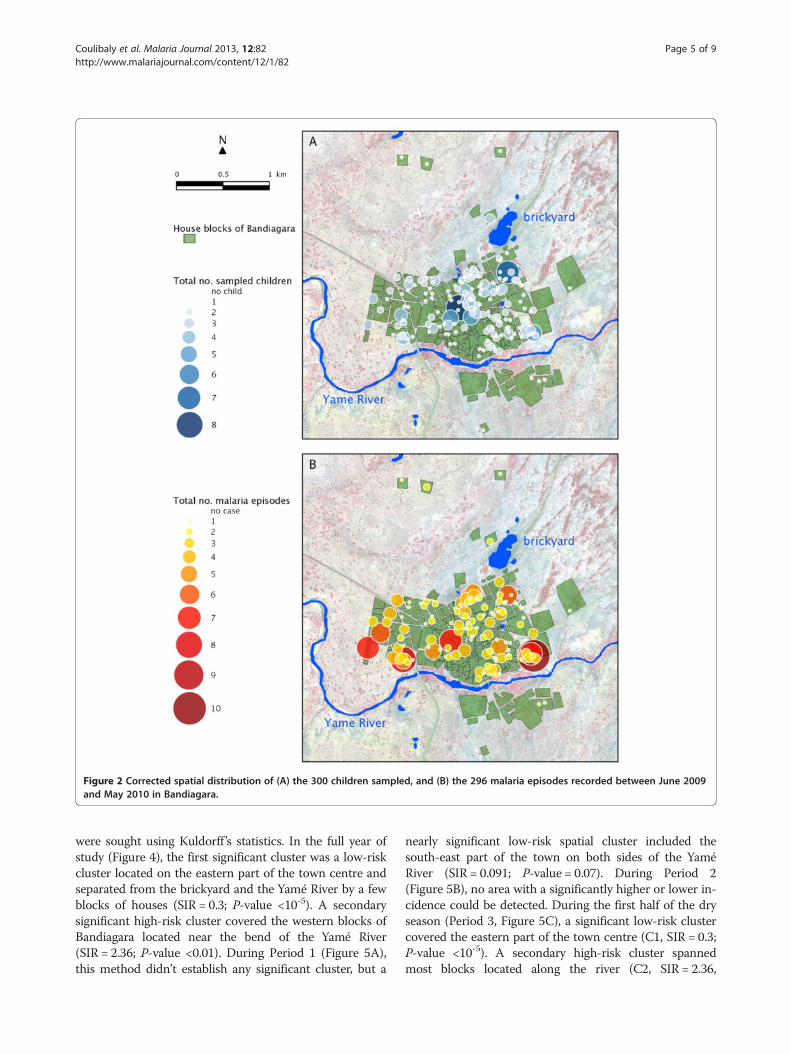
Figure 2 Corrected spatial distribution of (A) the 300 children sampled, and (B) the 296 malaria episodes recorded between June 2009and May 2010 in Bandiagara.
Coulibaly et al. Malaria Journal 2013, 12:82 Page 5 of 9http://www.malariajournal.com/content/12/1/82
were sought using Kuldorff ’s statistics. In the full year ofstudy (Figure 4), the first significant cluster was a low-riskcluster located on the eastern part of the town centre andseparated from the brickyard and the Yamé River by a fewblocks of houses (SIR = 0.3; P-value <10-5). A secondarysignificant high-risk cluster covered the western blocks ofBandiagara located near the bend of the Yamé River(SIR = 2.36; P-value <0.01). During Period 1 (Figure 5A),this method didn’t establish any significant cluster, but a
nearly significant low-risk spatial cluster included thesouth-east part of the town on both sides of the YaméRiver (SIR = 0.091; P-value = 0.07). During Period 2(Figure 5B), no area with a significantly higher or lower in-cidence could be detected. During the first half of the dryseason (Period 3, Figure 5C), a significant low-risk clustercovered the eastern part of the town centre (C1, SIR = 0.3;P-value <10-5). A secondary high-risk cluster spannedmost blocks located along the river (C2, SIR = 2.36,
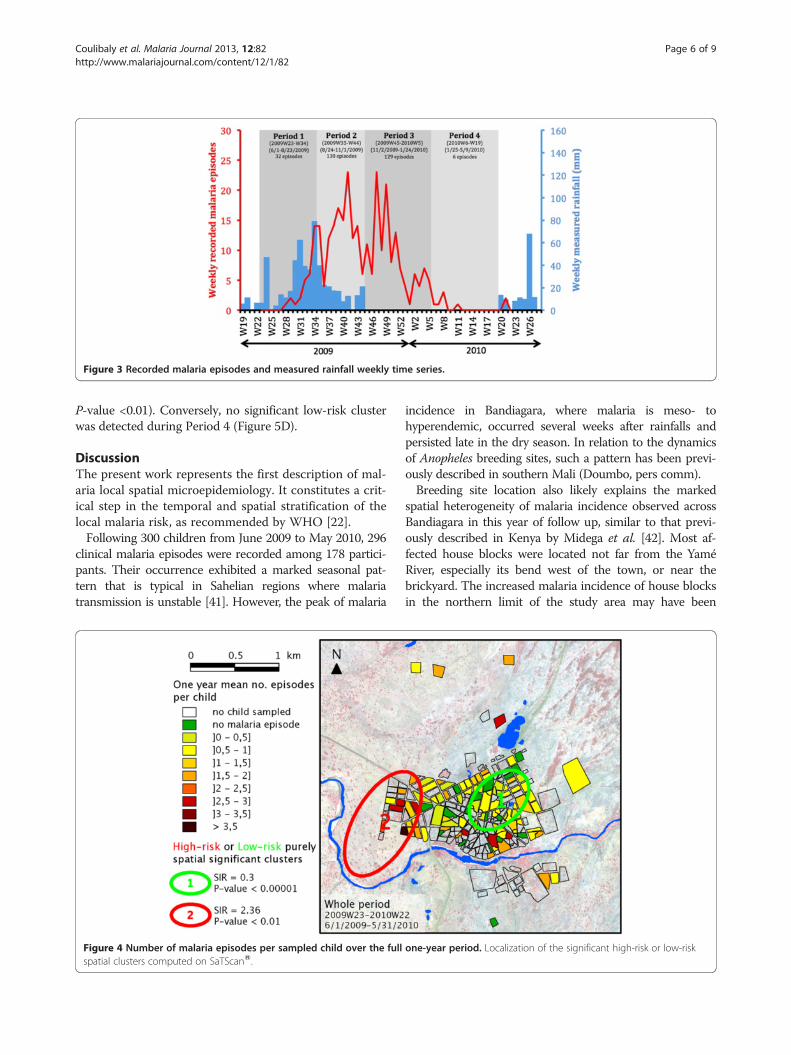
Figure 3 Recorded malaria episodes and measured rainfall weekly time series.
Coulibaly et al. Malaria Journal 2013, 12:82 Page 6 of 9http://www.malariajournal.com/content/12/1/82
P-value <0.01). Conversely, no significant low-risk clusterwas detected during Period 4 (Figure 5D).
DiscussionThe present work represents the first description of mal-aria local spatial microepidemiology. It constitutes a crit-ical step in the temporal and spatial stratification of thelocal malaria risk, as recommended by WHO [22].Following 300 children from June 2009 to May 2010, 296
clinical malaria episodes were recorded among 178 partici-pants. Their occurrence exhibited a marked seasonal pat-tern that is typical in Sahelian regions where malariatransmission is unstable [41]. However, the peak of malaria
Figure 4 Number of malaria episodes per sampled child over the fullspatial clusters computed on SaTScanW.
incidence in Bandiagara, where malaria is meso- tohyperendemic, occurred several weeks after rainfalls andpersisted late in the dry season. In relation to the dynamicsof Anopheles breeding sites, such a pattern has been previ-ously described in southern Mali (Doumbo, pers comm).Breeding site location also likely explains the marked
spatial heterogeneity of malaria incidence observed acrossBandiagara in this year of follow up, similar to that previ-ously described in Kenya by Midega et al. [42]. Most af-fected house blocks were located not far from the YaméRiver, especially its bend west of the town, or near thebrickyard. The increased malaria incidence of house blocksin the northern limit of the study area may have been
one-year period. Localization of the significant high-risk or low-risk
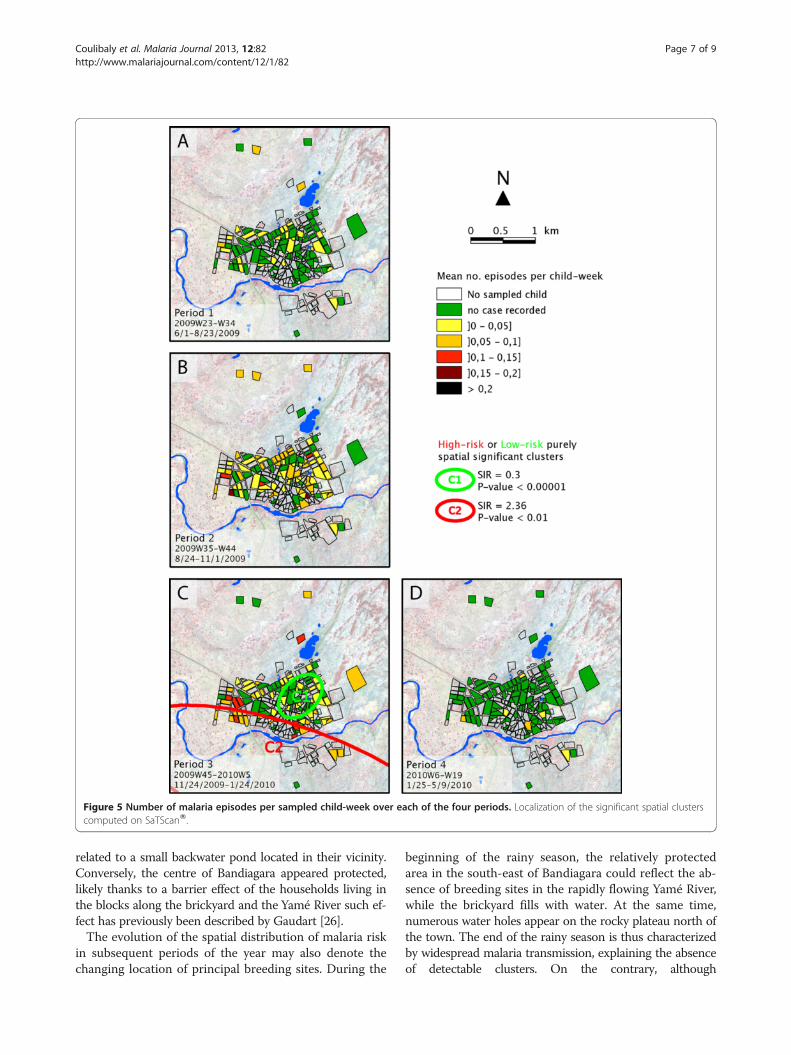
Figure 5 Number of malaria episodes per sampled child-week over each of the four periods. Localization of the significant spatial clusterscomputed on SaTScanW.
Coulibaly et al. Malaria Journal 2013, 12:82 Page 7 of 9http://www.malariajournal.com/content/12/1/82
related to a small backwater pond located in their vicinity.Conversely, the centre of Bandiagara appeared protected,likely thanks to a barrier effect of the households living inthe blocks along the brickyard and the Yamé River such ef-fect has previously been described by Gaudart [26].The evolution of the spatial distribution of malaria risk
in subsequent periods of the year may also denote thechanging location of principal breeding sites. During the
beginning of the rainy season, the relatively protectedarea in the south-east of Bandiagara could reflect the ab-sence of breeding sites in the rapidly flowing Yamé River,while the brickyard fills with water. At the same time,numerous water holes appear on the rocky plateau north ofthe town. The end of the rainy season is thus characterizedby widespread malaria transmission, explaining the absenceof detectable clusters. On the contrary, although
Coulibaly et al. Malaria Journal 2013, 12:82 Page 8 of 9http://www.malariajournal.com/content/12/1/82
transmission remains high during the beginning of the dryseason, the north-eastern blocks of the town appearprotected, potentially because of increasing pollution ofurban breeding sites, while transmission concentrates alongthe Yamé River, whose lesser flow with standing pools mayallow mosquito breeding, and near the brickyard,These hypotheses should be confirmed by further studies
with longer time series as well as transmission and ento-mological surveys. This study proves the feasibility of thor-ough epidemiological studies in rural African areas. It alsopresents valuable tools to better understand malaria dy-namics in endemic foci like Bandiagara, better target con-trol interventions, and better design future clinical trials.The lack of environmental factors, the limited study
period and the time lag between satellite image, the lack ofcut-off for temperature and parasitemia represent the limi-tations of this study. The implementation of additional in-vestigations is therefore essential to take in account theseitems in an in-depth description of the micro epidemi-ology of malaria in Bandiagara.
ConclusionDespite its limitations which are the no taking in accountthe environmental factors, the follow up time limitation,the present work provides valuable information on thelocal distribution patterns of malaria in Bandiagara. Theseresults confirm the existence of a marked spatial hetero-geneity of malaria transmission, likely related to seasonalbreeding sites.
AbbreviationsAIDS: Acquired immune deficiency syndrome; BMP: Bandiagara malaria project;GIS: Geographical information system; MRTC: Malaria research and trainingcenter; SIR: Standardized incidence ratio; WHO: World Health Organization.
Competing interestsThe authors declare that they have no competing interests.
Authors’ contributionsDC, MT, ML, BK, MAT, ND, JG, CVP and OKD were involved in theconceptualization, research design, data collection and preparation of themanuscript. YT, AKK, KT, AG, ID, AN, MD, AD and MS contributed significantlyto study execution and data collection. SR, ND, JG and RP collaborated onthe geographical data analysis, the mapping, and preparation of themanuscript. All authors read and approved the final manuscript.
AcknowledgementsWe thank Issaka Sagara, Ibrahima Kebe, Chebou Diallo, Ismael Thera, andMamadou Soumana Sissoko for data management; Alasseini Balam for clinicalsupport; Bouréma Ouologuem, Abdoulaye Ouologuem, Tabanidjou Karembé,Boucari Djiguiba, Akouni Dougnon, Sadio Dolo, Domo Ouologuem, Issa Tapily,and Paul Dougnon for fieldwork; Danzélé Coulibaly, Moctar Traoré, SékoubaMariko, Amadou Arama, Nicole Eddington, and Malathi Vala for administrativeand technical support; Aboubacar Sidiki Kouyaté, the medical chief officer of theBandiagara District Hospital, for support; Karen Ball for regulatory support; andthe community of Bandiagara, Mali for their dedication.The Malaria Incidence Study was supported by cooperative agreement5U01AI065683 from the National Institute of Allergy and Infectious Diseases; TheGIS study was supported by the AMMA consortium and the grant D43TW001589from the Fogarty International Center, National Institutes of Health.
Author details1Department of Epidemiology of Parasitic Diseases, Faculty of Medicine andDentistry, University of Sciences, Techniques and Technologies of Bamako,BP 1805, Point G, Bamako, Mali. 2Howard Hughes Medical Institute/Center forVaccine Development, University of Maryland School of Medicine, Baltimore,MD, USA. 3Aix-Marseille University, Marseille, France. 4Institut de Recherchepour le Développement, Montpellier, France.
Received: 13 December 2012 Accepted: 26 February 2013Published: 1 March 2013
References1. World Health Organization Expert Committee on Malaria: World malaria
report. Geneva: WHO; 2011.2. Ministère de la Santé, Secrétariat général: Direction nationale de la Santé.
Mali: Annuaire Système Local d’Information Sanitaire (SLIS); 2009.3. Brooker S, Clarke S, Njagi JK, Polack S, Mugo B, Estambale B, Muchiri E,
Magnussen P, Cox J: Spatial clustering of malaria and associated riskfactors during an epidemic in a highland area of western Kenya. TropMed Int Health 2004, 9:757–766.
4. Carter R, Mendis KN, Roberts D: Spatial targeting of interventions againstmalaria. Bull World Health Organ 2000, 78:1401.
5. Cattani JA, Tulloch JL, Vrbova H, Jolley D, Gibson FD, Moir JS, Heywood PF,Alpers MP, Stevenson A, Clancy R: The epidemiology of malaria in apopulation surrounding Madang, Papua New Guinea. AmJTrop Med Hyg1986, 35:3–15.
6. Chaput EK, Meek JI, Heimer R: Spatial analysis of human granulocyticEhrlichiosis near Lyme, Connecticut. Emerg Infect Dis 2002, 8:943–948.
7. Clarke SE: Variation in malaria risk and response in Rural Gambia. Denmark:University of Copenhagen; 2001.
8. Coleman M, Mabuza AM, Kok G, Coetzee M, Durrheim DN: Using theSaTScan method to detect local malaria clusters for guiding malariacontrol programmes. Malar J 2009, 8:68.
9. Mackinnon MJ, Mwangi TW, Snow RW, Marsh K, Williams TN: Heritability ofmalaria in Africa. PLoS Med 2005, 2:e340.
10. Stirnadel HA, Al-Yaman F, Genton B, Alpers MB, Smith TA: Assessment ofdifferent sources of variation in the antibody responses to specific malariaantigens in children in Papua New Guinea. Int J Epidemiol 2000, 29:579.
11. Pullan RL, Bukirwa H, Staedke SG, Snow RW, Brooker S: Plasmodiuminfection and its risk factors in eastern Uganda. Malar J 2010, 9:2.
12. Trape JF, Lefebvrezante E, Legros F, Ndiaye G, Bouganali H, Druilhe P, SalemG: Vector density gradients and the epidemiology of urban malaria inDakar, Senegal. AmJTrop Med Hyg 1992, 47:181–189.
13. Ernst KC, Lindblade KA, Koech D, Sumba PO, Kuwuor DO, John CC, WilsonML: Environmental, socio-demographic and behavioural determinants ofmalaria risk in the western Kenyan highlands: a case–control study. TropMed Int Health 2009, 14:1258–1265.
14. Gamage-Mendis AC, Carter R, Mendis C, De Zoysa AP, Herath PR, MendisKN: Clustering of malaria infections within an endemic population: riskof malaria associated with the type of housing construction. AmJTropMed Hyg 1991, 45:77–85.
15. Lindsay SW, Snow RW: The trouble with eaves; house entry by vectors ofmalaria. Trans R Soc Trop Med Hyg 1988, 82:645–646.
16. Van der Hoek W, Konradens F, Dijkstra DS, Amerasinghe PH, AmerasingheFP: Risk factors for malaria: a microepidemiological study in a village inSri Lanka. Trans R Soc Trop Med Hyg 1998, 92:265–269.
17. Killeen GF, Smith TA: Exploring the contributions of bed nets, cattle,insecticides and excitorepellency to malaria control: a deterministicmodel of mosquito host-seeking behaviour and mortality. Trop Med Hyg2007, 101:867–880.
18. Subramanian S, Manoharan A, Sahu S, Jambulingam P, Govardhini P,Mohapatra SS, Das PK: Living conditions and occurrence of malaria in arural community. Indian J Malar 1991, 28:29–37.
19. Greenwood BM: The microepidemiology of malaria and its importance tomalaria control. Trans R Soc Trop Med Hyg 1989, 83:25–29.
20. Koram KA, Bennett S, Adiamah JH, Greenwood BM: Socio-economic riskfactors for malaria in a peri-urban area of The Gambia. Trans R Soc TropMed Hyg 1995, 89:146–150.
21. World Health Organization Expert Committee on Malaria: 18th Report. WorldHealth Organ Tech Rep; 1986:735.
Coulibaly et al. Malaria Journal 2013, 12:82 Page 9 of 9http://www.malariajournal.com/content/12/1/82
22. World Health Organization Expert Committee on Malaria: 20th Report. WorldHealth Organ Tech Rep; 2000:892.
23. Killeen GF, Seyoum A, Knols BGJ: Rationalizing historical successes ofmalaria control in Africa in terms of mosquito resource availabilitymanagement. AmJTrop Med Hyg 2004, 71(suppl 2):87–93.
24. Booman M, Durrheim DN, La Grange K, Martin C, Mabuza AM, Zitha A,Mbokazi FM, Fraser C, Sharp BL: Using a geographical information systemto plan a malaria control programme in South Africa. Bull World HealthOrgan 2000, 78:1438–1444.
25. Kulldorff M, Heffernan R, Hartman J, Assuncao R, Mostashari F: A spacetimepermutation scan statistic for disease outbreak detection. PLoS Med 2005, 2:e59.
26. Gaudart J, Giorgi R, Poudiougou B, Touré O, Ranque S, Doumbo O,Demongeot J: Spatial cluster detection without point sourcespecification: the use of five methods and comparison of their results.Rev Epidemiol Sante Publique 2007, 55:297–306.
27. Gaudart J, Poudiougou B, Dicko A, Ranque S, Toure O, Sagara I, Diallo M,Diawara S, Ouattara A, Diakite M, Doumbo OK: Space-time clustering ofchildhood malaria at the household level: a dynamic cohort in a Malivillage. BMC Pub Health 2006, 6:286. 286.
28. Kreuels B, Kobbe R, Kreuzberg C, Von Reden C, Bater K, Klug S, Busch W,Adjei O, May J: Spatial variation of malaria incidence in young childrenfrom a geographically homogeneous area with high endemicity. J InfectDis 2007, 197:85–93.
29. Schellenberg JA, Newell JN, Snow RW, Mung’ala V, Marsh K, Smith PG,Hayes RJ: An analysis of the geographical distribution of severe malariain children in Kilifi District, Kenya. Int J Epidemiol 1998, 27:323–329.
30. Snow RW, Schellenberg JR, Peshu N, Forster D, Newton CR, Winstanley PA,Mwangi I, Waruiru C, Warn PA, Newbold C, Marsh K: Periodicity and space-time clustering of severe childhood malaria on the coast of Kenya. TransR Soc Trop Med Hyg 1993, 87:386–390.
31. Zacarias OP, Andersson M: Spatial and temporal patterns of malariaincidence in Mozambique. Malar J 2011, 10:189.
32. Plowe CV, Djimde A, Wellems TE, Diop S, Kouriba B, Doumbo OK:Community pyrimethamine-sulfadoxine use and prevalence of resistantPlasmodium falciparum genotypes in Mali: a model for deterringresistance. AmJTrop Med Hyg 1996, 55:467–471.
33. Coulibaly D, Diallo DA, Thera MA, Dicko A, Guindo AB, Kone AK, Cissoko Y,Coulibaly S, Djimde A, Lyke K, Doumbo OK, Plowe CV: Impact of preseasontreatment on incidence of falciparum malaria and parasite density at a site fortesting malaria vaccines in Bandiagara, Mali. AmJTrop Med Hyg 2002, 67:604–610.
34. Lyke KE, Dicko A, Kone A, Coulibaly D, Guindo A, Cissoko Y, Traore K, PloweCV, Doumbo OK: Incidence of severe Plasmodium falciparum malaria as aprimary endpoint for vaccine efficacy trials in Bandiagara, Mali. Vaccine2004, 22:3169–3174.
35. Diallo DA, Doumbo OK, Plowe CV, Wellems TE, Emanuel EJ, Hurst SA:Community permission for medical research in developing countries.Clin Infect Dis 2005, 41:255–259.
36. QGISTm version 1.7.3.. http://www.qgis.org.37. Kulldorff M: A spatial scan statistic. Com Stat Theory and Methods 1997,
26:1481–1496.38. Mostashari F, Kulldorff M, Hartman JJ, Miller JR, Kulasekera V: Dead bird
clusters as an early warning system for West Nile virus activity. EmergInfect Dis 2003, 9:641–646.
39. Nkhoma ET, Hsu CE, Hunt VI, Harris AM: Detecting spatiotemporal clustersof accidental poisoning mortality among Texas counties, U.S.,1980–2001. Int J Health Geogr 2004, 3:25.
40. Odoi A, Martin SW, Michel P, Holt J, Middleton D, Wilson J: Geographicaland temporal distribution of human giardiasis in Ontario. Canada. Int JHealth Geogr 2003, 2:5.
41. Mouchet J, Carnevale P, Coosemans M, Juliez J, Manguin S, Richard-Lenoble D,Sircoulon J: Biodiversité du paludisme dans le monde. Ed. John Libbey Eurotext; 2004.
42. Midega JT, Smith DL, Olotu A, Mwangangi JM, Nzovu JG, Wambua J,Nyangweso G, Mbogo CM, Christophides GK, Marsh K, Bejon P: Winddirection and proximity to larval sites determines malaria risk in KilifiDistrict in Kenya. Nat Commun 2012, 3:674.
doi:10.1186/1475-2875-12-82Cite this article as: Coulibaly et al.: Spatio-temporal analysis of malariawithin a transmission season in Bandiagara, Mali. Malaria Journal 2013 12:82.
Submit your next manuscript to BioMed Centraland take full advantage of:
• Convenient online submission
• Thorough peer review
• No space constraints or color figure charges
• Immediate publication on acceptance
• Inclusion in PubMed, CAS, Scopus and Google Scholar
• Research which is freely available for redistribution
Submit your manuscript at www.biomedcentral.com/submit