Embed Size (px)
Citation preview
Spatial variability of interior ice-sheet accumulation determined with an FM-CW
radar and connections to the NAO
David Braaten, Prasad Gogineni, Claude Laird, Susanne Buchardt*, and Hilary Barbour
* Centre for Ice and Climate, Univ. Copenhagen
Introduction• Snow accumulation is important in understanding ice
sheet mass balance and the accumulation/precipitation climatology.
• Detecting near-surface internal layers with radar allow regional scale assessments of snow accumulation on time scales of 1 year or less.
• Radar data permit spatial averaging to overcome local uncertainty caused by wind-generated surface features.
• Regional scale assessments of accumulation on annual time scales can lead to an understanding of links between climate indices and ice-sheet accumulation.
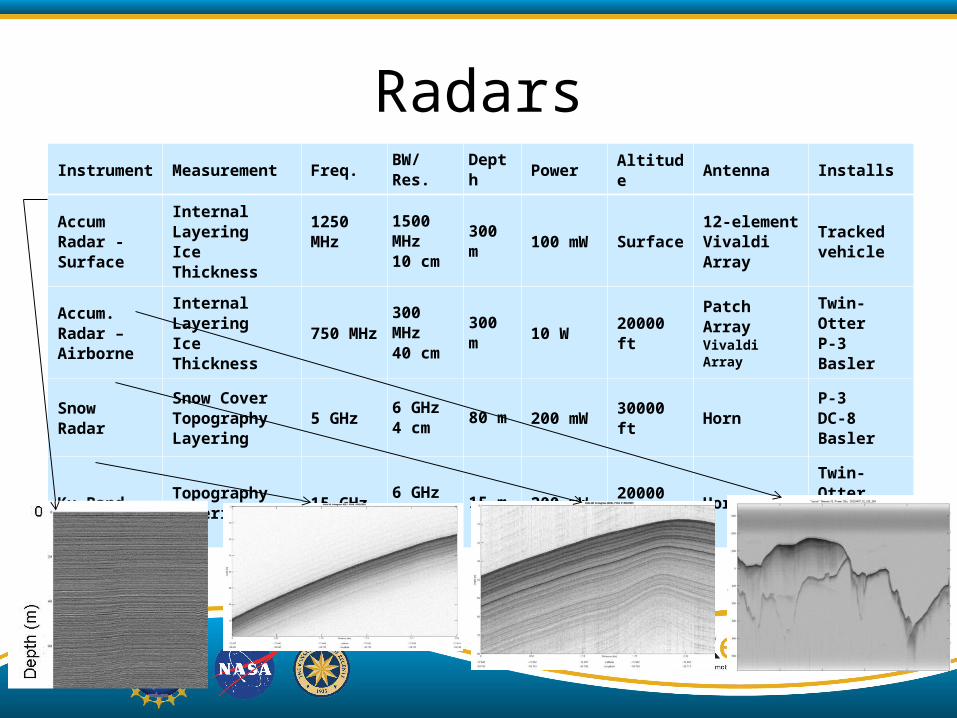
RadarsInstrument Measurement Freq.
BW/Res. Depth Power Altitude Antenna Installs
AccumRadar -Surface
Internal LayeringIce Thickness
1250 MHz
1500 MHz10 cm
300 m 100 mW Surface12-element Vivaldi Array
Tracked vehicle
Accum.Radar –Airborne
Internal LayeringIce Thickness
750 MHz300 MHz40 cm 300 m 10 W 20000 ft Patch Array
Vivaldi Array
Twin-OtterP-3Basler
SnowRadar
Snow CoverTopographyLayering
5 GHz6 GHz4 cm 80 m 200 mW 30000 ft Horn
P-3DC-8Basler
Ku-Band TopographyLayering 15 GHz
6 GHz4 cm 15 m 200 mW 20000 ft Horn
Twin-OtterDC-8Basler
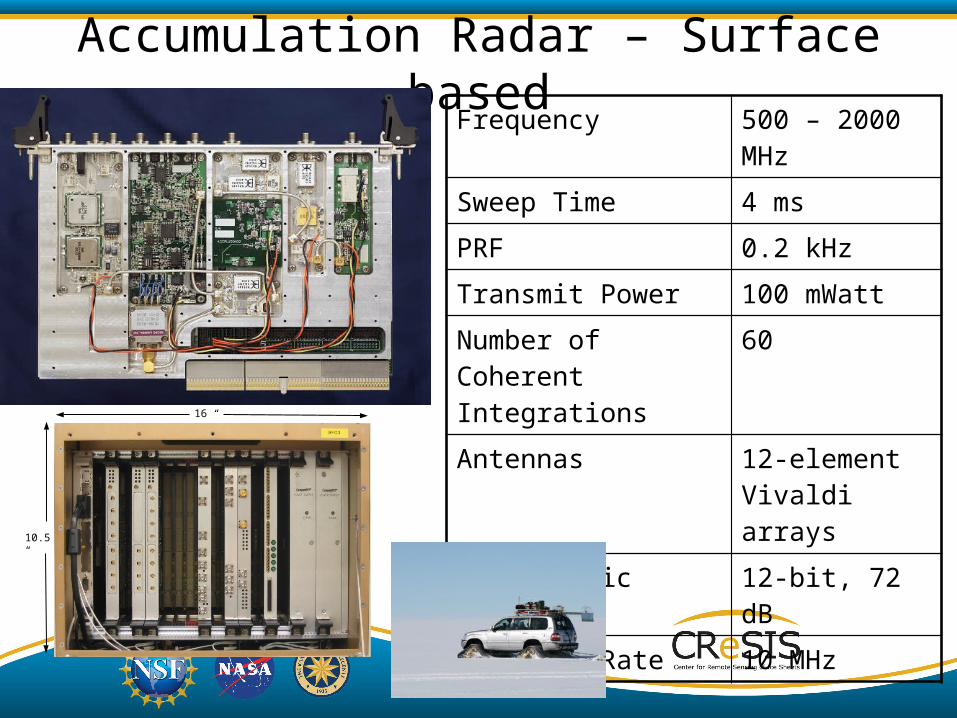
Accumulation Radar – Surface basedFrequency 500 – 2000 MHz
Sweep Time 4 ms
PRF 0.2 kHz
Transmit Power 100 mWatt
Number of Coherent Integrations
60
Antennas 12-element Vivaldi arrays
A/D Dynamic Range 12-bit, 72 dB
Sampling Rate 10 MHz
10.5 “
16 “
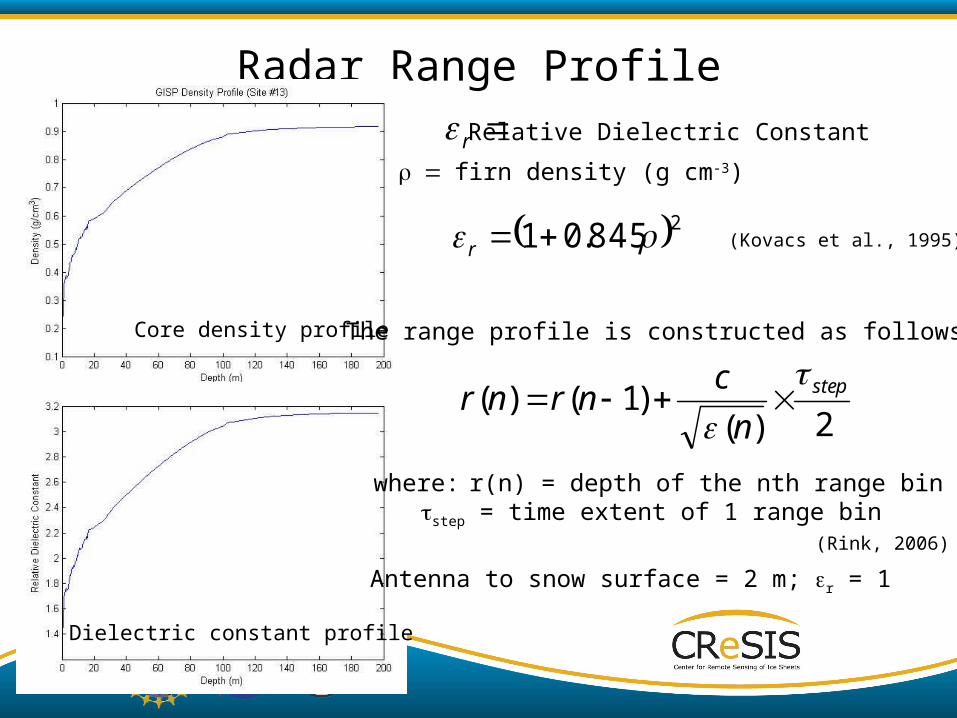
Radar Range Profile
2845.01 r
r Relative Dielectric Constant
= r firn density (g cm-3)
Core density profile
Dielectric constant profile
(Kovacs et al., 1995)
The range profile is constructed as follows:
2)()1()( step
n
cnrnr
where: r(n) = depth of the nth range bintstep = time extent of 1 range bin
(Rink, 2006)
Antenna to snow surface = 2 m; er = 1
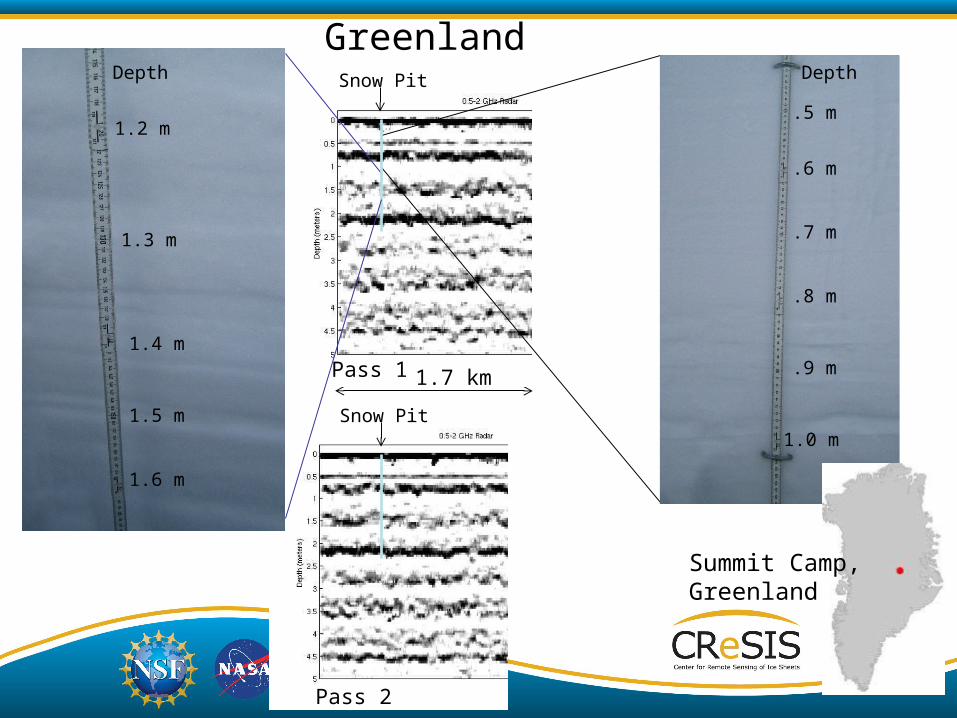
Pass 1
Pass 2
.5 m
.6 m
Depth
.7 m
.8 m
.9 m
1.0 m
Depth
1.2 m
1.3 m
1.4 m
1.5 m
1.6 m
Snow Pit
Snow Pit
1.7 km
Greenland
Summit Camp,Greenland
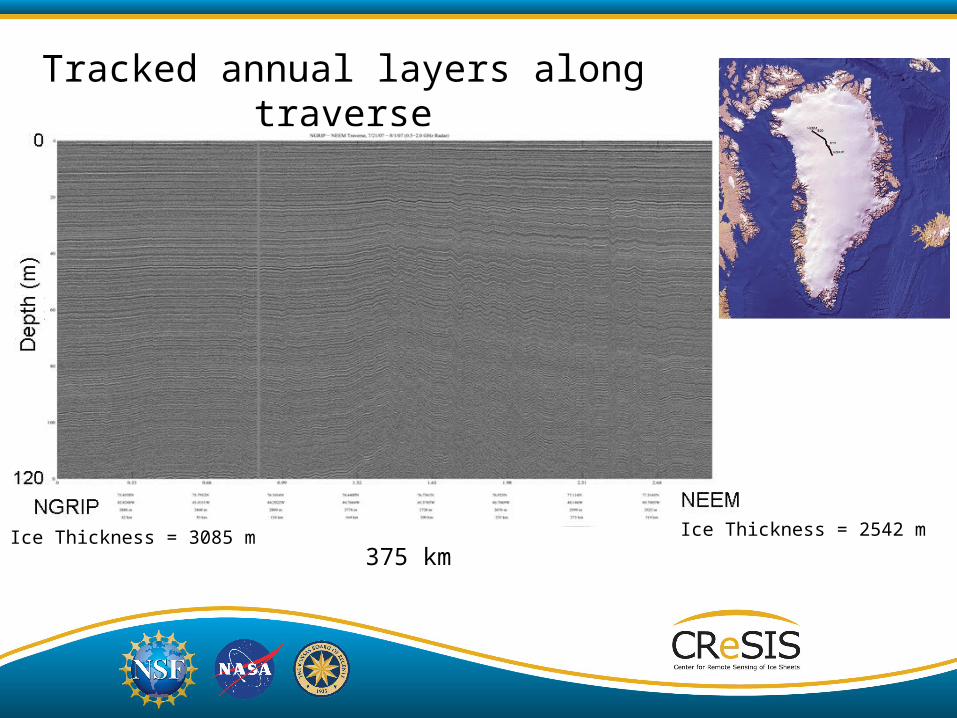
Tracked annual layers along traverse
375 kmIce Thickness = 3085 m Ice Thickness = 2542 m
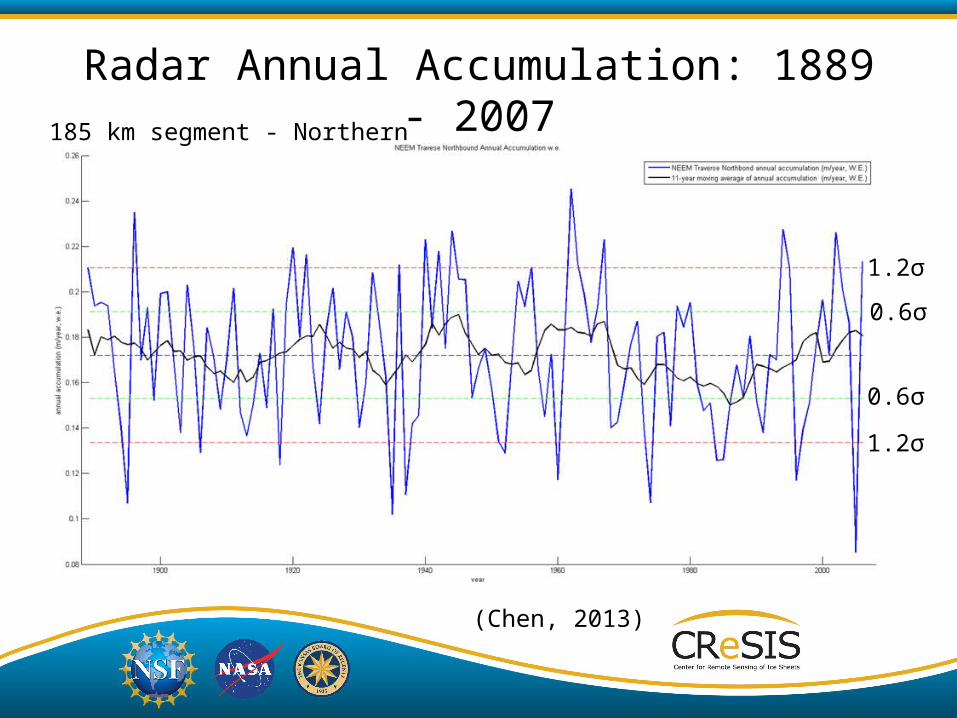
Radar Annual Accumulation: 1889 - 2007
1.2σ
1.2σ
0.6σ
0.6σ
185 km segment - Northern
(Chen, 2013)
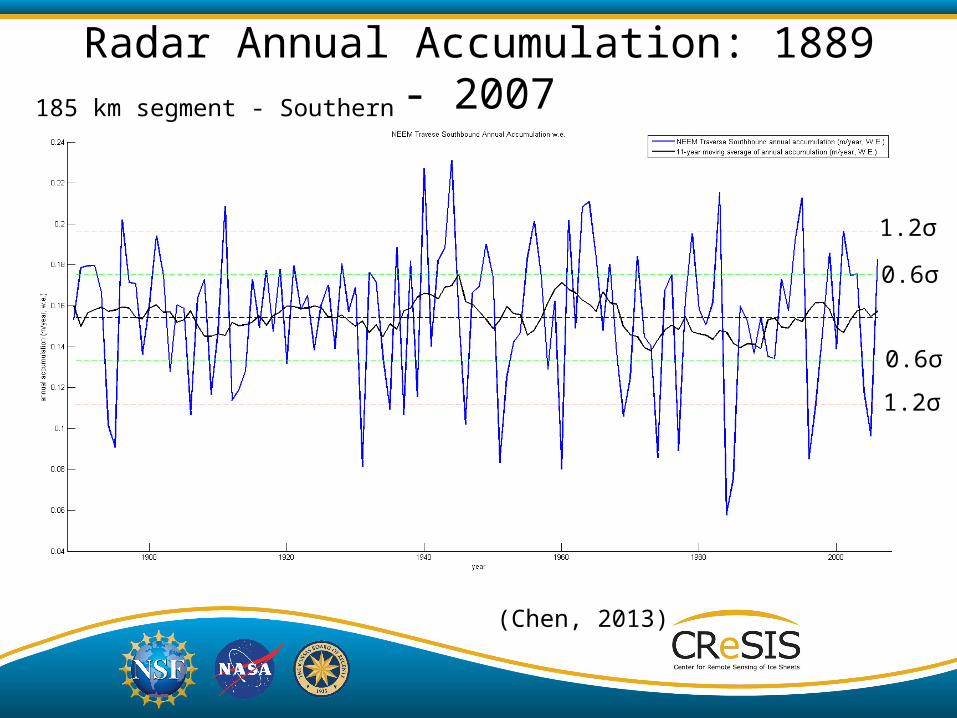
Radar Annual Accumulation: 1889 - 2007185 km segment - Southern
1.2σ
1.2σ
0.6σ
0.6σ
(Chen, 2013)
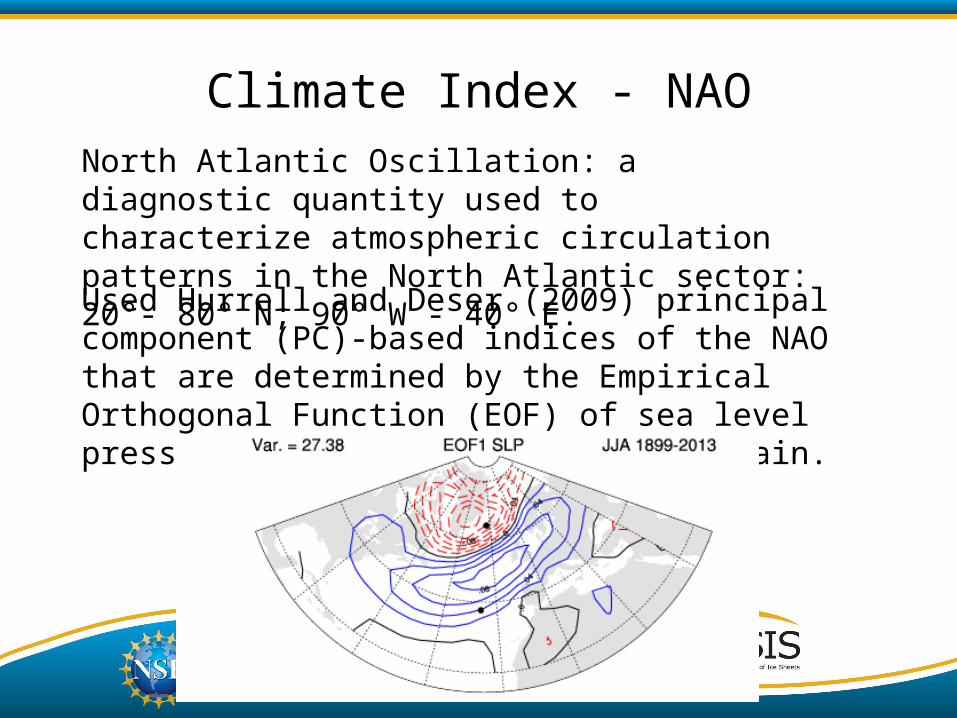
Climate Index - NAONorth Atlantic Oscillation: a diagnostic quantity used to characterize atmospheric circulation patterns in the North Atlantic sector: 20°- 80° N; 90° W - 40° E.
Used Hurrell and Deser (2009) principal component (PC)-based indices of the NAO that are determined by the Empirical Orthogonal Function (EOF) of sea level pressure (SLP) anomalies in the domain.
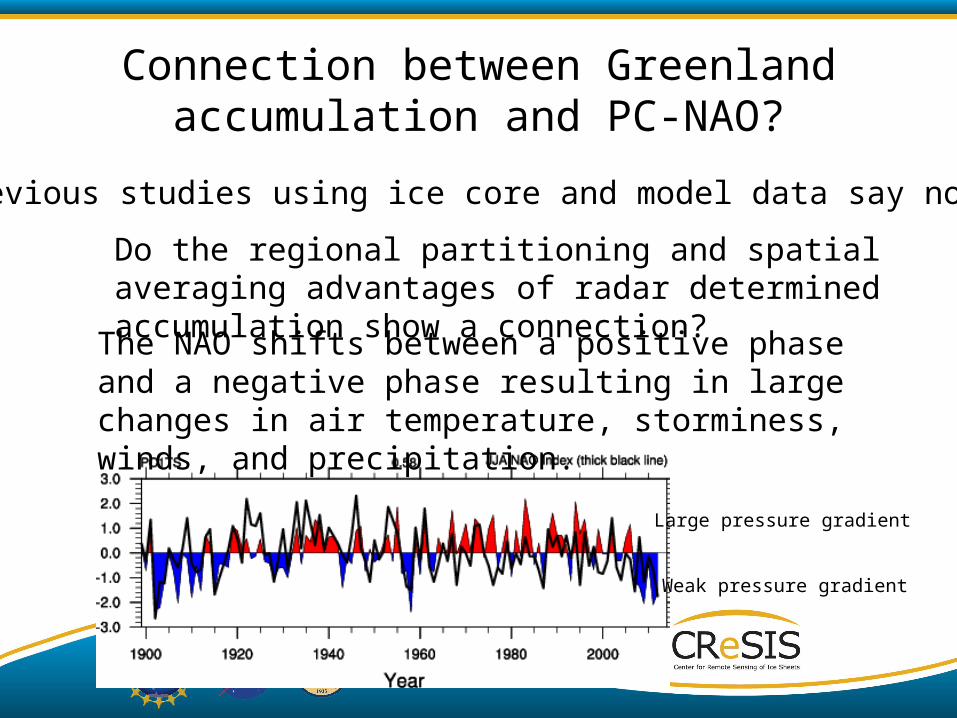
Connection between Greenland accumulation and PC-NAO?
Previous studies using ice core and model data say no.
Do the regional partitioning and spatial averaging advantages of radar determined accumulation show a connection?
The NAO shifts between a positive phase and a negative phase resulting in large changes in air temperature, storminess, winds, and precipitation.
Large pressure gradient
Weak pressure gradient
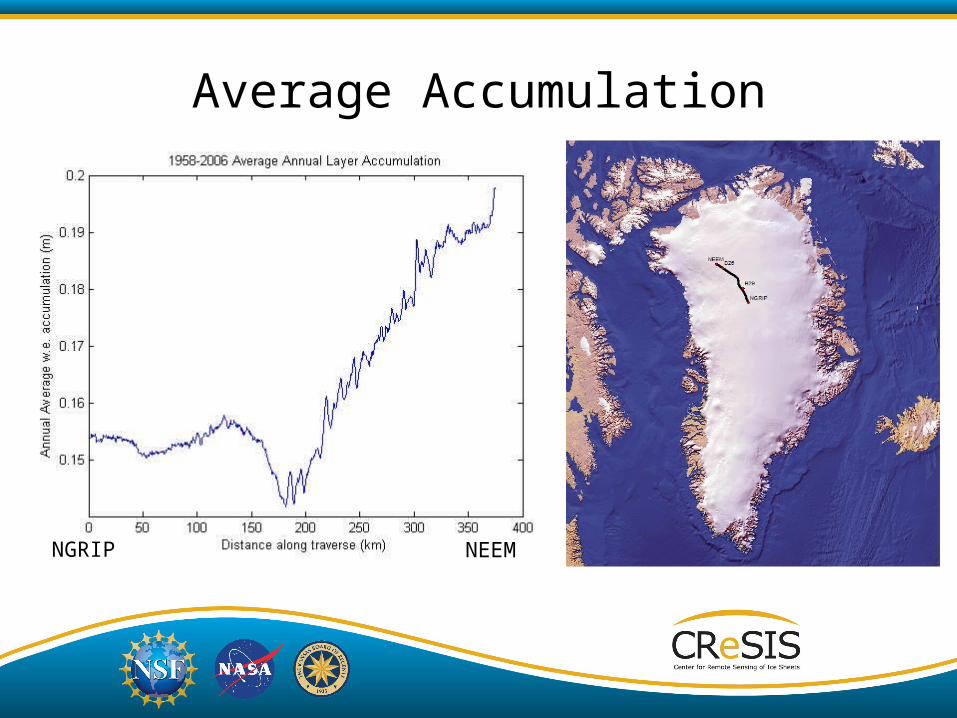
Average Accumulation
NGRIP NEEM
NAO versus Accumulation: 1958-2006
Radar annual accumulation• Gridded annual accumulation from Polar MM5
(Burgess et al., 2010)• NEEM ice core derived annual accumulations
PC-NAO time series examined:
• Annual• Winter (DJFM and DJF)• Spring (MAM) Summer (JJA)• Fall (SON)
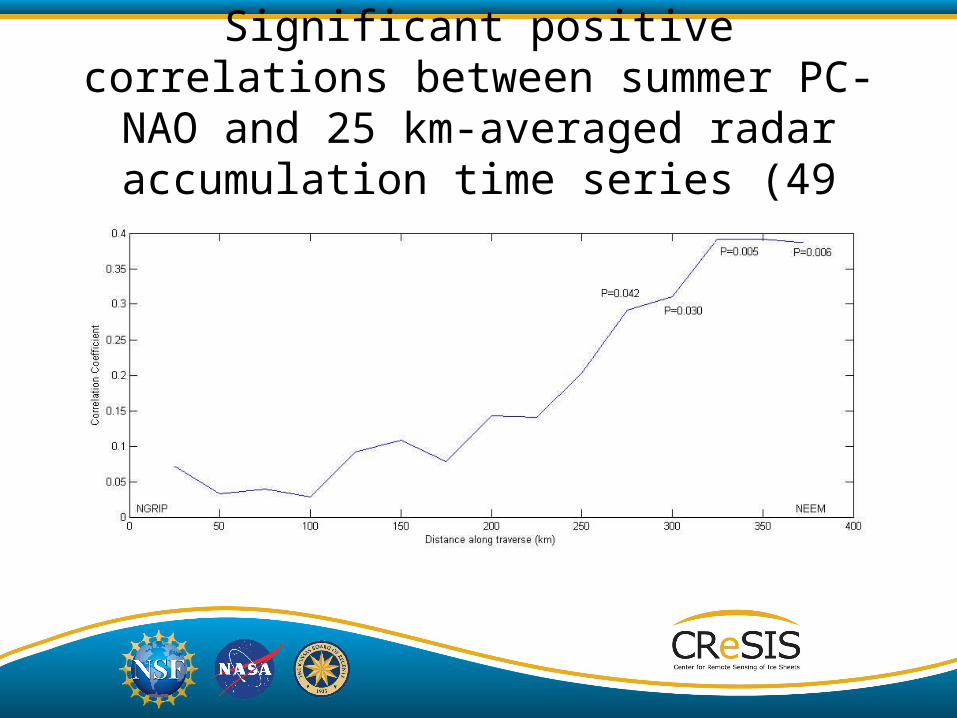
Significant positive correlations between summer PC-NAO and 25 km-averaged
radar accumulation time series (49 years)
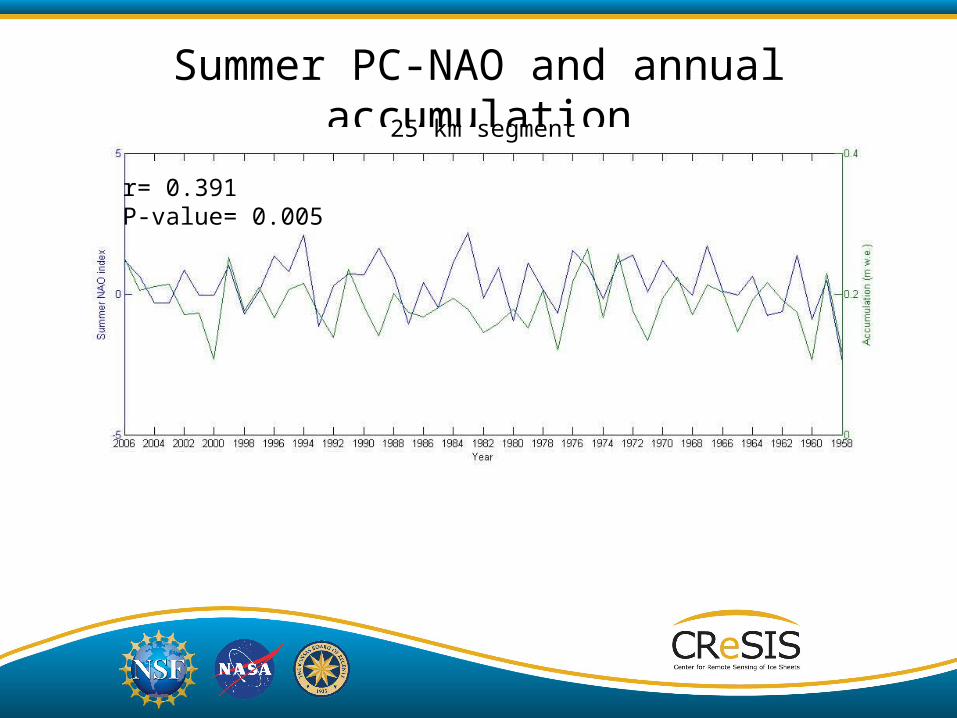
Summer PC-NAO and annual accumulation
r= 0.391P-value= 0.005
25 km segment
Conclusions
• Accumulation radar provides spatial averaging to overcome local redistribution of snow by wind.
• Accumulation radar provides regional coverage allowing examination of different precipitation regimes.
• Positive correlation found between summer PC-NAO and radar determined accumulation.
• Climate models show summer NAO becomes increasingly positive in a warming world (Folland et al., 2009).
• Takes us beyond the Clausius–Clapeyron equation (es(T)) to include large scale circulation for understanding future ice sheet mass balance.