Embed Size (px)
Citation preview

Spatial Transmission of 2009 Pandemic Influenza in theUSJulia R. Gog1,2*, Sebastien Ballesteros3, Cecile Viboud2, Lone Simonsen2,4, Ottar N. Bjornstad2,5,
Jeffrey Shaman6, Dennis L. Chao7, Farid Khan8, Bryan T. Grenfell2,3
1 Department of Applied Mathematics and Theoretical Physics, University of Cambridge, Cambridge, United Kingdom, 2 Fogarty International Center, National Institutes
of Health, Bethesda, Maryland, United States of America, 3 Department of Ecology and Evolutionary Biology, Princeton University, Princeton, New Jersey, United States of
America, 4 Department of Global Health, George Washington University, Washington, D.C., United States of America, 5 Department of Entomology, Pennsylvania State
University, State College, Pennsylvania, United States of America, 6 Department of Environmental Health Sciences, Mailman School of Public Health, Columbia University,
New York, New York, United States of America, 7 Center for Statistics and Quantitative Infectious Diseases, Vaccine and Infectious Disease Division, Fred Hutchinson
Cancer Research Center, Seattle, Washington, United States of America, 8 IMS Health, Plymouth Meeting, Pennsylvania, United States of America
Abstract
The 2009 H1N1 influenza pandemic provides a unique opportunity for detailed examination of the spatial dynamics of anemerging pathogen. In the US, the pandemic was characterized by substantial geographical heterogeneity: the 2009 springwave was limited mainly to northeastern cities while the larger fall wave affected the whole country. Here we use finelyresolved spatial and temporal influenza disease data based on electronic medical claims to explore the spread of the fallpandemic wave across 271 US cities and associated suburban areas. We document a clear spatial pattern in the timing ofonset of the fall wave, starting in southeastern cities and spreading outwards over a period of three months. We usemechanistic models to tease apart the external factors associated with the timing of the fall wave arrival: differential seedingevents linked to demographic factors, school opening dates, absolute humidity, prior immunity from the spring wave,spatial diffusion, and their interactions. Although the onset of the fall wave was correlated with school openings aspreviously reported, models including spatial spread alone resulted in better fit. The best model had a combination of thetwo. Absolute humidity or prior exposure during the spring wave did not improve the fit and population size only played aweak role. In conclusion, the protracted spread of pandemic influenza in fall 2009 in the US was dominated by short-distance spatial spread partially catalysed by school openings rather than long-distance transmission events. This is incontrast to the rapid hierarchical transmission patterns previously described for seasonal influenza. The findings underlinethe critical role that school-age children play in facilitating the geographic spread of pandemic influenza and highlight theneed for further information on the movement and mixing patterns of this age group.
Citation: Gog JR, Ballesteros S, Viboud C, Simonsen L, Bjornstad ON, et al. (2014) Spatial Transmission of 2009 Pandemic Influenza in the US. PLoS ComputBiol 10(6): e1003635. doi:10.1371/journal.pcbi.1003635
Editor: Neil M. Ferguson, Imperial College London, United Kingdom
Received November 18, 2013; Accepted April 7, 2014; Published June 12, 2014
This is an open-access article, free of all copyright, and may be freely reproduced, distributed, transmitted, modified, built upon, or otherwise used by anyone forany lawful purpose. The work is made available under the Creative Commons CC0 public domain dedication.
Funding: This study was supported by the RAPIDD program of the Science and Technology Directorate, Department of Homeland Security (to JRG, LS, JS, BTG),the in-house influenza program of the Fogarty International Center, National Institutes of Health, and the MIDAS program of the National Institute of GeneralMedical Sciences, NIH (grant U01-GM070749, DLC). The funders had no role in study design, data collection and analysis, decision to publish, or preparation of themanuscript.
Competing Interests: The authors have declared that no competing interests exist.
* E-mail: [email protected]
Introduction
Understanding the spatio-temporal spread of infectious disease is
important both for design of control strategies and to deepen
fundamental knowledge about the interaction between epidemic
dynamics and spatial mixing of the host population. Dynamic models
and statistical analyses have provided key insights into the spread of a
number of acute, directly transmitted infections of humans, including
measles, rotavirus, dengue, pertussis, and seasonal and pandemic
influenza [1,2,3,4,5,6,7,8,9,10]. A unifying feature of these analyses is
the interaction of coupling between populations (often expressed in
terms of ‘gravity’ or ‘radiation’ models for hierarchical spatial spread,
[1,2,3,5,11,12]) and demographic or environmental factors modulat-
ing transmission, in particular the seasonal aggregation of children in
schools [13,14,15,16,17], or seasonal variation in humidity [18,19]
Previous efforts have sought to forecast the likely spatial spread
of pandemic influenza with model simulations accounting for
intricate host demography and mixing data [10,20]. However, a
lack of finely resolved epidemiological data complicates validation
and testing of such models. Analysis of long-term influenza-related
mortality time series has highlighted the role of daily work
commute as a driver of the regional spread of seasonal influenza in
the US [3]. While mortality records were useful to explore the
spatial transmission of the devastating 1918 pandemic in the US
and UK [5], such data typically lack power to investigate disease
patterns in small geographical areas or during more recent and
milder seasons. However, increased disease surveillance and data
availability in the context of the 2009 A/H1N1pdm09 pandemic
provides a unique opportunity to explore the spatial spread of
influenza in more detail, identify further data gaps, and validate
existing models and theory. Here we used a rich dataset of
influenza-like-illness records compiled from electronic medical
claims and covering about 50% of outpatient physician visits in
2009 across the US to study influenza spread with an unprece-
PLOS Computational Biology | www.ploscompbiol.org 1 June 2014 | Volume 10 | Issue 6 | e1003635

dented level of detail. These electronic claims data have only
recently been used for public health purposes, in particular to
investigate the reduction in diarrhoea outpatient visits associated
with Rotavirus vaccine introduction [21].
The 2009 pandemic spread rapidly across the world, soon after
the putative emergence of the pandemic virus in Mexico [22]. The
earliest laboratory-confirmed cases of pandemic influenza infec-
tion were reported in April 2009 in the South Western US.
Subsequently, some cities, such as New York, Boston and
Milwaukee, experienced intense community transmission in spring
and summer [23,24]. For most of the country however, there was
no widespread outbreak until the autumn of 2009 when most
pandemic-related deaths occurred [23]. Recent work has suggest-
ed that school fall terms starts were associated with the onset of the
fall pandemic onsets in different US states [15], while reactive
school closure in the spring reduced influenza transmission in
Hong-Kong and Mexico [25,26]. Another candidate driver of
pandemic spread is low absolute humidity, which according to
experimental and epidemiological studies may favour the trans-
mission of influenza [18,19,27].
To determine the relative contributions of population move-
ments, demographics, school openings, prior immunity, and
environmental factors to pandemic spread, we fit a series of
mechanistic models to our highly resolved US influenza surveil-
lance datasets [28]. To track pandemic activity, we compile weekly
epidemic indicators of the number of influenza-like illness (ILI)
patients stratified by zip code, providing disease information in
271 administrative areas, covering more than 90% of the US
population in the 48 contiguous states (Figure 1, top panel). We
focus on the dynamics of the fall wave of the 2009 H1N1pdm09
pandemic, as all sites experienced a clearly defined pandemic
onset between July and November 2009.
Results
Our analysis begins with a simple descriptive analysis of
observed spatial autumn 2009 pandemic patterns and correlations
with putative drivers. Armed with these empirical results, we
construct a series of mechanistic epidemiological models to
determine the importance of different processes for pandemic
spread.
Descriptive analysisOur spatial analysis relies on the estimation of pandemic onset
dates, which are based on the date when ILI incidence exceeded a
seasonal threshold during summer-autumn 2009 [29,30] (as most
onset dates occurred in autumn, we refer to this pandemic wave as
the ‘‘autumn wave’’ for the sake of simplicity; see methods for
details). We disregard receipt of pandemic influenza vaccine as
nearly all doses were administered after the onset of the autumn
wave [31].
Onset dates range between 26th July to 1st November, 2009 in
the 271 locations, with a clear spatial patterning starting in South
East US and spreading in all directions within around three
months (Figure 1 and Supplementary Movie). Visually, the hub of
the South Eastern spread is in Alabama or Georgia, and Dothan,
Alabama had the earliest onset in these states (see also Figure S1).
We correlate estimates of onset dates with four different putative
drivers of spatial transmission: date of school term start [15], great
circle distance from Dothan, distance on the nearest neighbour
network from Dothan (see Figure 1b), and absolute humidity
indicators (considering both raw values and anomalies in days 7–
10 prior to pandemic onset, as in past work [18,19]). Autumn
pandemic onset is highly correlated with distance metrics and
school starts (correlation coefficients 0.35–0.72, P,0.0001;
Figure 2a–c) and moderately correlated with absolute humidity
(coefficient 20.63, P,0.0001 for raw AH, and 0.22, P = 0.001 for
anomalies; Figure 2d–e). Outliers in this correlation analysis may
indicate a second important seeding event in California; hence
correlations with distance are even stronger if restricted to the
Eastern US (Figure 2 red points, correlation coefficient 0.91 and
0.92, P,0.0001). As AH in each location is generally decreasing
through the autumn, the correlation between onset and AH at
onset must be treated with some caution. However there is more
signal here than can be explained just by the general temporal
trend in AH: the correlation coefficient (20.63) is stronger than
that obtained from 10,000 random permutations of onset dates
between locations.
Partial correlations were computed for each combination of
predictors (Table 1). For the residuals from regression with
geographic or network distance, weak but significant correlations
were found with absolute humidity (coefficient 20.26 and 20.27,
p,1024) and schools (0.16, p = 0.02). For the residuals from
school openings and both humidity measures, any of the other
variables gave a typically moderate to high correlation (range of
coefficients, 0.16–0.90, P,0.02). This finding suggests that a
purely spatial process may dominate in explaining the timing of
the autumn wave, perhaps modulated by environmental and
school-related factors. However analysis of a more mechanistic
epidemiological model is required to distinguish the relative
contributions and interactions of these and other potential drivers.
Mechanistic epidemiological modelsWe build a simple spatial model for the spread of influenza,
inspired by previous work on the 1918 pandemic [5] (see methods
for full details). Briefly, treating each of 271 locations in the US as
the statistical units, a maximum likelihood approach is used to fit
the observed pandemic onset dates. The parametric model of the
force of infection, the rate of outbreak initiation for each location,
includes the contribution of both local and long-distance
transmission. The outbreak in each location can be sparked by
Author Summary
The determinants of influenza spatial spread are not fullyunderstood, in part due to the insufficient geographicresolution of incidence data. We address this using a fine-grained private sector electronic health database ofinsurance claims data from health encounters in the USduring 2009. We used physician diagnoses codes togenerate a dataset of the weekly number of office visitswith diagnosed influenza-like illness for 271 US locations.Applying statistical and mathematical models to thesedisease data, we find that the main autumn wave of the2009 pandemic in the US was remarkably spatiallystructured. Its onset in the South Eastern US precipitateda slow radial spread that took 3 months to diffuse acrossthe country. These patterns were replicated by modelsthat included short-distance spatial transmission betweennearby locations and increased transmission rates whenschool was in session. Our results contrast with previousmodelling studies that indicated that environmentalfactors, population sizes, and long-distance transmissionevents (air traffic) are major determinants in diseasespread. We conclude that the 2009 pandemic autumnwave spread slowly because transmissibility of theinfluenza virus was relatively low and children (who travellong distance far less than adults) were the predominantsources of infection.
Spatial Transmission of 2009 Pandemic Influenza
PLOS Computational Biology | www.ploscompbiol.org 2 June 2014 | Volume 10 | Issue 6 | e1003635

transmission from another nearby location: this contribution to the
force of infection is modelled using a power law kernel driven by
population size and distance (hereafter referred to as the gravity
model) [1,3,5,12]. Alternative spatial kernels based on different
model formulations or distance metrics were also explored,
including Gaussian kernel and grid distance (methods). Further,
we introduced a normalization parameter that quantifies how
connectivity may depend on the number and size of neighbouring
populations, following [5], akin to the difference between density-
dependent and density-independent transmission [32]. In addition
to short-range disease transmission, a term was included to
account for the background probability of an outbreak spark
(hereafter referred to as external seeding), which could be seeded
by imported infections from distant locations (domestically or
internationally) or even a low-level persistent local chain of
infection that survived the summer. Both external seeding and
local transmission were also allowed to depend on whether or not
schools were in session and also to scale according to population
sizes to some power. The force of infection was also allowed to be
modulated by previous immunity to pandemic A/H1N1pdm09 (as
Figure 1. Geographic patterns of pandemic onset timings in studied locations in the 48 contiguous US states, autumn 2009. Upperpanel: The map shows how the available influenza-like-illness (ILI) data are spatially stratified by 449 locations according to postal sectional centerfacility (SCF). The areas of the circles are proportional to population size. Locations in red are included in the analysis below, while those in black areexcluded either due to small population size, or low reporting of ILI cases during 2009. See methods for neighbour network construction. Lowerpanel: Map of estimated timing of fall pandemic onset for the 271 locations with sufficient sampling for use in subsequent statistical and modellinganalyses. These locations span 90% of the US population. There is a clear spatial spread visible for much of the US, with influenza pandemic onsetearliest for the South Eastern states, and latest in the North East. Some places do not fit this overall pattern, and the distribution of timings on thewest coast is more complex. The inset plot shows the proportion ILI during the fall wave of 2009 for the whole of the US aggregated (black), Atlanta(Yellow) and Boston (Blue): the aggregated ILI curve masks the relative sharp upswing in cases for individual locations as the pandemic onset timingdiffers considerably between locations.doi:10.1371/journal.pcbi.1003635.g001
Spatial Transmission of 2009 Pandemic Influenza
PLOS Computational Biology | www.ploscompbiol.org 3 June 2014 | Volume 10 | Issue 6 | e1003635

Spatial Transmission of 2009 Pandemic Influenza
PLOS Computational Biology | www.ploscompbiol.org 4 June 2014 | Volume 10 | Issue 6 | e1003635

measured by indicators of the intensity of the spring 2009
pandemic wave) and absolute humidity. We evaluate every
possible combination of these factors to explain pandemic onset
dates using the corrected Akaike information criteria.
Figure 3 shows the relative importance of each factor and their
interactions. Irrespective of the spatial kernel used, introducing
terms for schools and/or spatial spread results in a significant
improvement of fit over models exclusively considering external
seeding. Models including spatial spread alone result in better fit
than models purely driven by schools terms. For both the gravity
and Gaussian models, the normalisation described above consis-
tently improves the fit, whereas it is less important for the grid
models. Of the spatial kernels tested, the gravity model offers the
best fit (AICc more than 30 lower than other kernels, see Table
S1). In line with a strong distance effect evidenced in the
correlation analysis, the distance exponent of the best-fit gravity
model was high (2.6, See Table S2) while the population size
exponent was low (0.27).
Overall, the best model includes terms for spatial transmission,
the effect of schools on spatial transmission, and a baseline external
seeding rate (see Table 2). The external seeding rate was small but
not zero (Table S2), and only appears to have played any
significant role in a small number of locations (Figure S1). Neither
absolute humidity nor prior exposure to influenza during the
spring wave were part of the best model. Taken together, these
results support a scenario where autumn pandemic onset is
determined by a local mode of spatial spread, which is density-
independent and enhanced by schools being in session.
One-step ahead predictions (Figure S2) and full simulations
(Figure S3) confirmed that the best model could broadly reproduce
the observed spatial dynamics of autumn pandemic wave onsets.
However the model predicts later onsets than those observed in
California’s Central Valley, again suggesting multiple seeding
events (Figure S1). Simulating the effect of setting schools to be
permanently closed, the general spatial structure of the wave was
similar to observed, but spread was substantially slower (Figure
S3).
Discussion
To our knowledge, this is the most detailed analysis to date of
the local and regional dynamics of influenza pandemic spread,
made possible by the availability of rich electronic disease datasets
maintained in the private sector. Our analysis shows that the
spread of the A/H1N1pdm09 pandemic during autumn 2009 in
the US was highly spatially structured, with a clear wave
originating in the South Eastern region of the country and slowly
spreading outwards over a 3-month period. Variation in school
openings alone cannot explain the observed fine grain variations in
pandemic onset across the US, but school opening does exert a
significant effect on the spread of the pandemic, consistent with
past research [15,25,26,33]
It is remarkable that the main 2009 pandemic wave, set in an
era of intense air traffic and regional ground transportation,
showed such a short-range mode of spread – so local that observed
outbreak patterns conflicted with the usual model of rapid
transmission between distant major cities followed by spread to
less populated areas [3,10,20]. This intriguing picture of mainly
local spread could be due to a combination of two factors: the
relatively low transmissibility of the 2009 A/H1N1pdm09 virus
[34] and the importance of children in pandemic spread [35]. In
turn, both of these factors could be consequences of a strong build-
up of anti H1N1pdm09 immunity in older cohorts due to earlier
exposure to related viruses [25,36]. The global transportation
network likely played a significant role in the initial spread of the
pandemic virus in spring 2009 [37,38,39].
Analysis of long-term mortality data indicates that the regional
spread of seasonal influenza is driven by longer-range commuter-
driven movements of adults with strong dependence on population
sizes of recipient and donor locations [3]. Previous models of
pandemic spread make similar assumptions [10,20]; however, our
analysis of detailed local morbidity data suggest that the travel
patterns of school-age children may be a major factor explaining the
spread of the 2009 autumn pandemic wave in the US. While
intuitively one might expect that movements of children are
Table 1. Partial correlations of putative factors affecting the onset of influenza autumn 2009 pandemic wave in 176 Eastern USlocations.
Geographic Distance Network Distance School Opening Absolute Humidity Anomalous Humidity
Geographic Distance - 0.04 (p = 0.30) 0.48 p,1024 0.47 p,1024 0.90 p,1024
Network Distance 0.09 (p = 0.12) - 0.49 p,1024 0.49 p,1024 0.91 p,1024
School Opening 0.16 (p = 0.02) 0.15 (p = 0.03) - 0.51 p,1024 0.78 p,1024
Absolute Humidity 20.27 p,1024 20.26 p,1023 20.57 p,1024 - 20.85 p,1024
Anomalous Humidity 0.04 (p = 0.30) 0.08 (p = 0.15) 0.16 (p = 0.02) 0.48 p,1024 -
Each of the five variables in the first row (geographic distance, network distance, school opening time, absolute humidity, humidity anomalies), residuals are computedfrom linear regression with the onset of influenza timings for locations in the East of the US. This table gives the correlation between these residuals and a secondvariable, listed in the first column.For the residuals from regression with geographic or network distance (first two columns), weak correlation is found with absolute humidity (p,1024) and schools(p = 0.02). For the residuals from school openings and both humidity measures (last three columns), any of the other variables give a significant correlation (p = 0.02 forone combination and p,1024 for the other 11).doi:10.1371/journal.pcbi.1003635.t001
Figure 2. Univariate correlations between autumn 2009 pandemic onset timings and potentially contributing factors. The influenzaonset timings are on the vertical axes for all four plots, and red points are locations in HHS regions 1–5 (East) and black in regions 6–10 (West). Theseare correlated either as East only (in red) or all US (in black) against four different candidate explanatory variables: (a) Distance from the earliestlocation in Alabama as measured by great circle geographic distance, (b) distance measured as minimum number of steps on the neighbour network,(c) the timing of fall school openings for the state and (d) absolute humidity and (e) humidity anomalies in the 7–10 days prior pandemic onset. Seemethods for details. Correlation coefficients and significance are inset in each plot. All of these correlations are highly significant (p,1024).doi:10.1371/journal.pcbi.1003635.g002
Spatial Transmission of 2009 Pandemic Influenza
PLOS Computational Biology | www.ploscompbiol.org 5 June 2014 | Volume 10 | Issue 6 | e1003635

typically shorter-range and revolve around home and school,
limited information exists on contact rates in this age group. The
2009 experience underlines the urgency for improved understand-
ing of the dynamics of epidemiologically-relevant spatial and social
mixing in children.
The relatively modest transmissibility of the A/H1N1pdm09
virus, with an effective reproduction ratio estimated at around 1.5
[34], might also explain why long range travel was a lesser
determinant of the spread of the pandemic. With a low
reproduction ratio, occasional long-range imports of infection
may die out after a small number of generations of transmission,
and hence simply fail to ‘‘take’’. In contrast, a large outbreak in a
proximate community will result in repeated infection challenges,
and inevitably a successful chain of infection will commence.
Intriguingly, the effective reproduction number of seasonal
influenza is typically lower than that of the A/H1N1pdm09 virus,
and hence we would expect an even more localized and slower
spread for seasonal outbreaks than for the autumn 2009 pandemic.
Unfortunately, no epidemiological data at a comparable level of
spatial detail is available for comparison. Further, as hypothesized
in earlier work, the transmission patterns of seasonal influenza
epidemics may not be predictive of pandemic patterns, due to
Figure 3. Parsimony of model fits to the autumn 2009 pandemic onset timings – corrected Akaike information criteria (AICc)histograms for all models. Left panels: AICc per categories (EXT: External seeding; AH: Absolute Humidity; SCH: Schools; SP: Space). Each verticalline represents one possible model. Right panels: AICc for models containing parameters related to space (SP) segregated regarding the assumptionmade on density dependence in connectivity between SCFs.doi:10.1371/journal.pcbi.1003635.g003
Spatial Transmission of 2009 Pandemic Influenza
PLOS Computational Biology | www.ploscompbiol.org 6 June 2014 | Volume 10 | Issue 6 | e1003635
differences in outbreak timing and age distribution of infection
[35,40,41,42]. Understanding the relative contribution of virus
transmissibility, seasonality, and mean age at infection on the
spatial dynamics of influenza is an interesting area for future work.
Another surprising feature of the 2009 autumn pandemic wave
was the late arrival in large northeastern cities – regardless of
whether these cities had experienced an early summer wave. For
instance, the five boroughs of New York City suffered a major
spring pandemic outbreak and were particularly late in experi-
encing an autumn outbreak, in contrast to the less densely
populated cities upstate. This implies that chains of influenza
transmission from the spring wave did not persist over the summer
in most places, consistent with phylogeographic analysis of A/
H1N1pdm09 viruses suggesting reintroduction of a single domi-
nant viral lineage in the autumn in the US [24]. This phylogenetic
pattern is not repeated in all countries, for example in Scotland
[43], and synthesising the evolutionary and epidemiological
observations for influenza spatial transmission is proving chal-
lenging [44]. It would therefore be interesting to test whether other
countries also experienced slow and localized pandemic transmis-
sion and how that correlates with the corresponding observed
evolutionary patterns.
Although our study is the first to investigate influenza spread at
such a high level of spatial resolution and over such a broad
geographic area, our findings may be compared with those of an
earlier study of the 1918 pandemic in the US, England and Wales
by Eggo et al. [5], made using a similar modelling framework.
Interestingly, both studies suggest that transmission should be
normalised by a weighted sum of all populations, meaning that
transmission is nearly density-independent. However the fitted
spatial kernels differ between the studies: in the study of the 1918
datasets [5] spatial transmission scales approximately as distance to
the power 21, whereas in this 2009 study the distance exponent is
around 22.6, implying much sharper localised transmission.
Differences in spatial resolution of the data available and
transmissibility of the 1918 and 2009 pandemic virus may explain
these conflicting results. Clearly, more high resolution analyses of
influenza disease spread are needed, in a variety of geographic
settings, before the spatial transmission of pandemic influenza can
be accurately predicted.
Several caveats are worth noting in our study. Here we have
developed time series data of influenza-like illness coded by
physicians (as a proxy of H1N1pdm09 activity), but these patients
were not generally laboratory-confirmed. The contribution of other
respiratory pathogens to influenza-like illness diagnoses is likely
small in all age groups given the unusual timing of the pandemic
outbreak during autumn when other important respiratory viruses –
especially respiratory syncytial virus – are typically not epidemic.
Further, because of its unusual timing, the onset of the pandemic
was relatively easy to identify at a fine spatial and temporal
resolution, given low background of respiratory diagnoses.
Our analysis was limited to the 2009 pandemic autumn wave
period, and it would be interesting to model the spread of seasonal
influenza epidemics at the scale studied here, although outbreak
onset dates would be more difficult to identify. Additionally, we
did not explore the spatial patterning of the 2009 spring wave,
because its presence in the US was much more sporadic than the
autumn wave and onset dates could be obscured by changes in
health-seeking behaviour as people become aware of the new
pandemic. Further, even though the 271 locations in our study
represent 90% of the US population, we had to exclude cities with
less than 200,000 inhabitants due to demographic noise. Most of
these cities are located in the central US, a less well-connected and
potentially interesting region that was not considered here. In
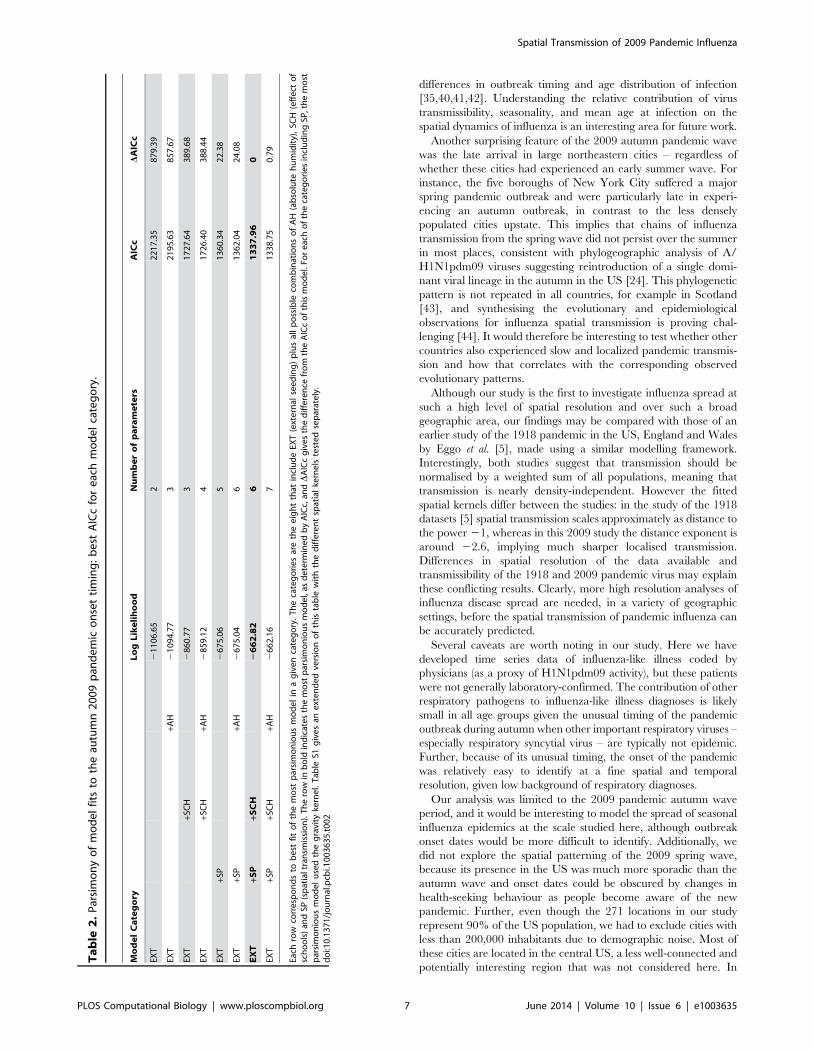
Ta
ble
2.
Par
sim
on
yo
fm
od
el
fits
toth
eau
tum
n2
00
9p
and
em
ico
nse
tti
min
g:
be
stA
ICc
for
eac
hm
od
el
cate
go
ry.
Mo
de
lC
ate
go
ryL
og
Lik
eli
ho
od
Nu
mb
er
of
pa
ram
ete
rsA
ICc
DA
ICc
EXT
21
10
6.6
52
22
17
.35
87
9.3
9
EXT
+AH
21
09
4.7
73
21
95
.63
85
7.6
7
EXT
+SC
H2
86
0.7
73
17
27
.64
38
9.6
8
EXT
+SC
H+A
H2
85
9.1
24
17
26
.40
38
8.4
4
EXT
+SP
26
75
.06
51
36
0.3
42
2.3
8
EXT
+SP
+AH
26
75
.04
61
36
2.0
42
4.0
8
EX
T+S
P+S
CH
26
62
.82
61
33
7.9
60
EXT
+SP
+SC
H+A
H2
66
2.1
67
13
38
.75
0.7
9
Each
row
corr
esp
on
ds
tob
est
fit
of
the
mo
stp
arsi
mo
nio
us
mo
de
lin
ag
ive
nca
teg
ory
.T
he
cate
go
rie
sar
eth
ee
igh
tth
atin
clu
de
EXT
(ext
ern
alse
ed
ing
)p
lus
all
po
ssib
leco
mb
inat
ion
so
fA
H(a
bso
lute
hu
mid
ity)
,SC
H(e
ffe
cto
fsc
ho
ols
)an
dSP
(sp
atia
ltra
nsm
issi
on
).T
he
row
inb
old
ind
icat
es
the
mo
stp
arsi
mo
nio
us
mo
de
l,as
de
term
ine
db
yA
ICc,
andD
AIC
cg
ive
sth
ed
iffe
ren
cefr
om
the
AIC
co
fth
ism
od
el.
For
eac
ho
fth
eca
teg
ori
es
incl
ud
ing
SP,t
he
mo
stp
arsi
mo
nio
us
mo
de
lu
sed
the
gra
vity
kern
el.
Tab
leS1
giv
es
ane
xte
nd
ed
vers
ion
of
this
tab
lew
ith
the
dif
fere
nt
spat
ial
kern
els
test
ed
sep
arat
ely
.d
oi:1
0.1
37
1/j
ou
rnal
.pcb
i.10
03
63
5.t
00
2
Spatial Transmission of 2009 Pandemic Influenza
PLOS Computational Biology | www.ploscompbiol.org 7 June 2014 | Volume 10 | Issue 6 | e1003635
addition, we used school term data at the state level [15], rather
than at the county or city-level, given that detailed school data are
not publicly available in most states. Further, our models do not
integrate any age information, although analysis of age-stratified
disease incidence time series revealed very similar patterns of
pandemic onsets in the 271 US locations (not shown). Finally, we
did not consider radiation models of spatial flux [11]: these are
unlikely to add significantly to the present analysis as the picture of
sequential outbreak onset is so clear already, and a normalisation
factor has been included in the gravity formulation to account for
the varying population density across the US. However it would be
interesting to test the relative performance of radiation and gravity
models on a finer grained influenza data set, particularly if a
matching resolution of school data were available.
Overall, our results are robust: they do not depend on the exact
formulation of the spatial model nor the definition of epidemiologic
indicators. Our conclusions highlight the role of local transmission
in the spread of the major autumn 2009 pandemic wave. This work
highlights the importance of testing model predictions against
detailed empirical disease data and suggests that fine-scale
transmission models should take these results into account for
simulation of future pandemic outbreaks. As ever, a synthesis of
models, demographic, viral sequence data, environmental and
movement data with multiple incidence data sets collected by
different means would offer a particularly powerful way forward to
understand infectious disease dynamics and improve preparedness
for outbreaks of novel respiratory pathogens.
Methods
Data sourceWeekly time series of outpatient visits for influenza-like-illness
and total visits were compiled from the visit-level database of
CMS-1500 medical claims data maintained by IMS Health, which
captures a convenience sample of about half of all physician visits
in the US. We first developed and employed a case definition of
influenza-like illness (ILI) as any mention of a diagnostic code for
influenza (ICD487x-488x) OR [fever and (sore throat or cough),
(ICD780.6 and (462 or 786.2)] OR febrile viral illness
(ICD079.99). Most of the cases were coded as ICD9 = 079.99
rather than the influenza specific code 487–488 – which probably
reflects that only few doctor’s offices utilized rapid testing for
H1N1pdm09 influenza, on advice from the CDC and WHO to
allow the laboratories to focus supplies and effort on severe cases
only [45].
We extracted the weekly number of visits that met the ILI
definition and also total number of all visits, stratified by 3-digit zip
code of the physician’s office. The IMS database covered 906
three-digit zip codes in the continental US during the 2009
pandemic period. The resulting syndromic case definition was
validated against CDC’s ILI surveillance system at the national
and HHS regional level for seasonal and pandemic seasons;
furthermore the ILI time series displayed known geographical
heterogeneities, in particular large early summer waves in
Northern cities like New York City but an absence of such
patterns in upstate New York and the South [46].
Standardization of ILI dataThe three-digit zip codes were aggregated according to 449
‘‘sectional center facility’’ (SCF) as defined by the United States
Postal Service, to make geographically meaningful population
divisions. The case definition was sensitive enough to yield a large
number of weekly cases in most SCFs year-round; however both
coverage and reporting rate may vary by location and time. To
generate stable time series, we used the ratio of ILI to total number
of visits. We restricted the analysis to the continental US, to SCFs
with populations of more than 200,000, and to SCFs with more
than 250 ILI cases reported in 2009. This reduced the total
number of SCFs available for analysis to 271 but still accounted for
over 90% of the US population. These SCF are shown in Figure 1
(top panel), and we refer to these as ‘‘locations’’ in the main text.
Geographic dataPopulation numbers were determined from US Census 2000
data and zip codes weighted by population size to determine SCF
centres. The eastern US was defined as HHS regions 1–5 [47].
The neighbour network (also called ‘grid model’) was constructed
by joining each location to its four nearest neighbours and
allowing all links to be reciprocal. The median school opening date
was used for each state, and methods for collecting these data are
given in Chao et al. 2010 [15]. The absolute humidity data were
daily 2 m above-ground specific humidity conditions compiled
from the North America Land Data Assimilation System (NLDAS)
project, 1999–2009 [48]. For each SCF, we calculated the AH
values and AH anomalies in days 7–10 prior pandemic onset,
where daily AH anomalies are defined as observed AH minus
average AH for the same day of the year during 1999–2008.
Definition of influenza pandemic onsetWeeks of national ‘‘low ILI activity’’ between 2001–2009 for
aggregated US are defined as when the ILI ratio is below 0.6%,
and a sinusoid is fitted to these weeks to determine the phase
(similar to methods used for mortality data [29,30]). Using this
phase and the same set of weeks, amplitude plus a quartic function
of time is fitted to the ILI ratio for each SCF to give an
approximate seasonal baseline. As the pandemic does not
necessarily respect the usual annual timing of influenza, we define
a conservative pandemic threshold as the maximum of the
sinusoidal model baseline during 2009 plus a small additional
buffer (0.2%). Using absolute numbers for 2009, a binomial test
(with exact probabilities) is used to determine if the observed
number of visits is significantly (p,0.01) above threshold in each
week. If there are at least three consecutive weeks that are
significantly above threshold, then the first such week is considered
to be the week of pandemic onset. To interpolate to a slightly
greater degree of resolution, we estimate the number of ILI visits
and total visits in the half week before onset using the geometric
mean, and the binomial test is again used to determine if the fall
wave start time should be moved back by half a week. For the fall
wave of 2009, the calculated pandemic onset timings will not be
sensitive to these methods of calculation as the epidemic upswing
in each location is so sharply defined.
Transmission modelWe use a maximum likelihood approach based on a simple
mechanistic model. Following Eggo et al. [5], the probability that
the fall wave starts at time T for a given location (indexed by i) is
given by
Pi(T)~(1{e{li (T)) PT{1
t~1e{li (t)
where li(t) is the force of infection at location i at time t. For the
gravity model, this force of infection is given by
Spatial Transmission of 2009 Pandemic Influenza
PLOS Computational Biology | www.ploscompbiol.org 8 June 2014 | Volume 10 | Issue 6 | e1003635

li(t)~hiwevxi b0Na
i zbsIiz(bdzbdsIi)Nmi
Pj[L
Nnj d
{ci, j
Pj=i
Nnj d
{ci, j
" #e
0BBBB@
1CCCCA
where the following are explanatory variables: di,j is the great
circle distance between locations i and j, and for each location i:hi
is the absolute humidity, xi is the intensity of the spring wave
(percentage of total pandemic excess ILI cases that were reported
during the spring), Ni is the population size normalised by average
population size, Ii is an indicator function of time which is 1 when
schools are open and 0 otherwise. L is the set of indices of
currently infected locations.
The estimated parameters are as follows: w and v are the effects
of the spring wave and humidity in modulating the full transmission
rate. The b parameters are all transmission rate factors: b0 is for the
background rate of infection (including external seeding from
domestic and international locations and local chains of transmis-
sion surviving over summer), bs is a boost due to schools being in, bd
is the spatial transmission coefficient and bds is the boost to spatial
transmission due to schools being in. a, m and u are all exponents on
population size, representing the effect of population size on the
background rate of infection, for recipient population and donor
population in spatial transmission respectively. The distance
exponent in the spatial kernel of the gravity model is c. For the
spatial transmission, the numerator of the fraction is the sum over
infected locations (weighted by distance and population size to some
powers), and the denominator is the same sum but over all locations.
The denominator is to the power e: so 0 corresponds to no
normalisation (fully density-dependent), and 1 corresponds to full
normalisation (fully density-independent).
For the Gaussian model, the expression is the same except for
the form of dependence on distance and the parameter s gives the
distance scaling in the Gaussian (and c is no longer used):
li(t)~hiwevxi b0Na
i zbsIiz(bdzbdsIi)Nmi
Pj[L
Nnj e
{d2i,j=s2
Pj=i
Nnj e
{d2i,j=s2
" #e
0BBBB@
1CCCCA
The grid model is slightly different as instead of explicit
dependence on geographic distance, we use the set of locations one
step (n1,i) or two steps (n2,i) away for location i, as defined by the
constructed grid:
li(t)~
hQi evxi b0Na
i zbsIiz(bd1zbd1sIi)Nmi
Pj[(L\n1,i )
Nnj
Pj[n1,i
Nnj
" #e z(bd2zbd2sIi)Nmi
Pj[(L\n2,i )
Nnj
Pj[n2,i
Nnj
" #e
0BBBBB@
1CCCCCA
There is no distance parameter, but now the spatial transmis-
sion parameters have been extended from two to four to account
for transmission to locations one and two steps away: bd2, bd1s, bd2
and bd2s.
Simpler models can be made from all these spatial kernels by
‘‘turning off’ combinations of parameters, i.e. setting them to zero.
This makes 400 gravity, 400 Gaussian and 1936 grid models. For
each of the 2736 models, likelihood was maximised using the
Nelder-Mean simplex algorithm as implemented in the GNU
scientific library in C. Simulations were done in C using the ranlux
algorithm of Luscher with maximum luxury level as provided by
the GSL library. Convergence was assessed by likelihood profiles
(Figure S4).
Supporting Information
Figure S1 Analysis of contribution of external seedingby location. Upper panel: The percentage contribution of
external seeding to the model force of infection was calculation
for each location at the observed date of pandemic onset. For 253
out of 271 locations the external seeding accounted for less than
5% of the force of infection, indeed in 177 it accounted for less
than 1% of the force of infection. On the map, locations with 5–
10% external contribution are marked in yellow (five locations),
10–50% in orange (seven locations, and all less than 25%), and
those over 50% in red. Lower panel: Plots correspond to
individual locations: the black curve gives the standardized ILI (y-
axis) against date (x-axis) for the calendar year 2009, the grey
curve and shaded area give the pandemic onset threshold, and
the blue line marks the calculated autumn pandemic onset date
(see methods for full details). The plot labels give the location
name an in brackets the percentage of force of infection at week
of onset that is contributed by external seeding. The first row
gives three representative plots (Atlanta GA, Boston MA and
Trenton NJ). In each case, the contribution to force of infection
at week of onset was less than 5%, and it can be seen that the
week of onset can be identified unambiguously. The second row
shows three of the six places where external contribution at week
of onset was over 50%, but date of onset is not clearly identified.
St. Petersburg FL, the standardized ILI dips below threshold
again after onset is detected. For Corpus Christi TX there is also
a dip after onset, though it does not drop below threshold. For
Grand Island NE, there is also a dip after onset, and the general
rise of ILI is not as sharp as other locations. If week of onset for a
location is misidentified as earlier than other locations nearby,
then the apparent dominant contribution of external seeding
would be artefactual: we cannot exclude this for these three
locations. The third row shows the remaining three places where
external contributions was over 50%. In each of these, the week
of onset is clearly defined. Visually from the supplementary
movie, both Dothan AL and Stockton CA appear to be at or near
the source of clear regional waves, so these are likely to
correspond to true external seeding events. The final location,
Baltimore MD, does not appear to be the origin of separate
regional wave, and the apparent high contribution of external
seeding can be explained as an artefact: there is another location
very close by (Linthicum MD). The power-law dependence on
distance in the transmission model and the normalisation mean
that essentially these two locations only ‘‘see’’ each other. It
happens that Baltimore onset is a week before Linthicum, so this
appears as having a strong component of external contribution to
the force of infection. This highlights a potential weakness of
gravity normalisation methods, but could be overcome by
modifications such as merging locations that are close together,
or by capping the power-law dependence on distance within a
certain range. In this model, the external seeding term
ameliorates the difficulty. In summary: the evidence here suggests
only two likely external seeding events: near Dothan AL and near
Stockton CA.
(PDF)
Spatial Transmission of 2009 Pandemic Influenza
PLOS Computational Biology | www.ploscompbiol.org 9 June 2014 | Volume 10 | Issue 6 | e1003635

Figure S2 Comparison of most parsimonious models toobserved onset timings of the autumn 2009 pandemic. A:
Conditional probability of epidemic onset, model prediction and
residual analysis for the most parsimonious model per category. For
each location (sorted by increasing time of onset) probabilities of
epidemic onset conditional on the previous disease dynamic are
represented in grey scale with mode in brown and model prediction
(average) in orange. Residuals are computed as the difference
between the model prediction (brown) and the data (red) and
reported on the maps. Titles indicate parameters defining these
models. Models discarding local spatial transmission are unable to
reproduce the qualitative patterns of spread (upper panels). The
inclusion of local spatial spread with or without school opening
means the model broadly tracks the spatial progression of pandemic
onsets (lower panels). The best-fit model is able to reproduce the
general spread pattern of the autumn 2009 pandemic wave
originating from the South Eastern US, but the residuals are
geographically clustered, particularly in California and Florida.
Most notably, the model predicts later onsets than those observed in
California’s Central Valley and earlier onsets than observed in
Florida. B: While the spatial model with and without schools give
broadly similar visual results, there is a significant improvement in
model fit (see Table 2), and here this difference is investigated by
location. For each location (x-axis and map) difference of log
likelihood (conditional on the previous disease dynamic) between
the model with and without schools are reported.
(PDF)
Figure S3 Predictions from the most parsimoniousmodel on the effect of school closure on pandemic onsettimings of the autumn 2009 pandemic in the US. 1000
realisations were started without any locations infected. The full
model (black lines) was simulated using maximum likelihood
parameters of the most parsimonious model (see table 2). The
simulations without school opening (grey lines) uses the same
parameters, but schools were set as closed. The general spatial
structure of the wave is similar to observed or simulated with the
correct school opening times, but the spread was substantially
slower. However, the exact length of the delay was sensitive to the
fitted parameters. In the lower graphs, the spatial transmission
parameter (bd) was fixed, other parameters refitted and the above
simulations repeated. The 95% confidence intervals are indicated
by black dashed lines and the maximum likelihood estimate by
orange lines. The lower left plot shows the distribution of the time
when 50% of the locations were infected (T50). The simulated
times with schools (black boxes) was not sensitive to the fixed
parameter, but the extra delay with schools closed (grey boxes) was
highly variable over the confidence interval. The lower right graph
shows how the transmission parameters are interdependent, which
explains the sensitivity in simulation. In summary: the extent of the
epidemic slowing from closing schools is difficult to estimate
accurately from this model, but is likely to be substantial.
(PDF)
Figure S4 The profile likelihoods for the parameters inthe most parsimonious model. For the transmission rate
parameters (top row), logged parameter values are used, while the
exponents (bottom row) are given unlogged. The orange line
marks the maximum likelihood, and the dotted lines give the range
for a drop of 1.92 in the log likelihood, corresponding to a 95%
confidence interval.
(PDF)
Table S1 Most parsimonious model per categoryincluding different spatial kernels. An extension of
Table 2 from the main text: this table gives the log likelihood
and AICc for the maximum likelihood fits to the most
parsimonious models in each category. Here, additional results
are given for the alternative spatial kernels (Gaussian, or using grid
distance). For each model category, the most parsimonious model
is specified by the parameters that are non-zero, which are given in
the final column. In all cases, the gravity model has much
lower AICc than the Gaussian or the grid models. Despite the
crudeness of the spatial grid, the grid model performs surprisingly
well.
(PDF)
Table S2 Fitted parameters for the most parsimoniousmodel. The most parsimonious model has six non-zero
parameters. These are given in the table together with their
maximum likelihood values and confidence intervals, as deter-
mined by a drop of 1.96 in the profile likelihoods. Setting the other
parameters to zero, the force of infection for location i can be
written as: li(t)~b0z(bdzbdsIi)Nmi
Pj[L
d{ci,j
Pj=i
d{ci,j
� �e. This force of
infection is a rate and the units correspond to the time step
Dt = half week.
(PDF)
Movie S1 Influenza-like-illness in the US from January2009 to April 2010. The area of the disc on each location is
proportional to the population size and the colour represents the
standardised ILI (see methods for details). The lower panel shows
standardised ILI for the aggregate of all locations.
(MOV)
Acknowledgments
The weekly disease time series were kindly compiled by IMS Health for
research purposes, under a collaborative agreement.
Author Contributions
Analyzed the data: JRG SB CV LS ONB JS DLC FK BTG. Wrote the
paper: JRG SB CV LS ONB JS DLC FK BTG.
References
1. Cliff AD, Haggett P, Smallman-Raynor M (1998) Deciphering global epidemics:
analytical approaches to the disease records of world cities, 1888–1912; Press
BU, editor. Cambridge.
2. Grenfell BT, Bjornstad ON, Kappey J (2001) Travelling waves and spatial
hierarchies in measles epidemics. Nature 414: 716–723.
3. Viboud C, Bjornstad ON, Smith DL, Simonsen L, Miller MA, et al. (2006) Synchrony,
waves, and spatial hierarchies in the spread of influenza. Science 312: 447–451.
4. Chowell G, Bettencourt LM, Johnson N, Alonso WJ, Viboud C (2008) The
1918–1919 influenza pandemic in England and Wales: spatial patterns in
transmissibility and mortality impact. Proc Biol Sci 275: 501–509.
5. Eggo RM, Cauchemez S, Ferguson NM (2011) Spatial dynamics of the 1918 influenza
pandemic in England, Wales and the United States. J R Soc Interface 8: 233–243.
6. Pitzer VE, Viboud C, Simonsen L, Steiner C, Panozzo CA, et al. (2009)
Demographic variability, vaccination, and the spatiotemporal dynamics of
rotavirus epidemics. Science 325: 290–294.
7. Cummings DAT, Irizarry RA, Huang NE, Endy TP, Nisalak A, et al. (2004)
Travelling waves in the occurrence of dengue haemorrhagic fever in Thailand.
Nature 427: 344–347.
8. Keeling MJ, Rohani P (2008) Modeling infectious diseases in humans and
animals. Princeton: Princeton University Press.
9. Rvachev LA, Longini IM (1985) Model for the Global Spread of Influenza.
Mathematical biosciences 75: 3–22.
10. Ferguson NM, Cummings DA, Fraser C, Cajka JC, Cooley PC, et al. (2006)
Strategies for mitigating an influenza pandemic. Nature 442: 448–452.
Spatial Transmission of 2009 Pandemic Influenza
PLOS Computational Biology | www.ploscompbiol.org 10 June 2014 | Volume 10 | Issue 6 | e1003635

11. Simini F, Gonzalez MC, Maritan A, Barabasi AL (2012) A universal model for
mobility and migration patterns. Nature 484: 96–100.12. Xia Y, Bjornstad ON, Grenfell BT (2004) Measles metapopulation dynamics: a
gravity model for epidemiological coupling and dynamics. Am Nat 164: 267–281.
13. Cauchemez S, Ferguson NM, Wachtel C, Tegnell A, Saour G, et al. (2009)Closure of schools during an influenza pandemic. Lancet Infect Dis 9: 473–481.
14. Cauchemez S, Valleron AJ, Boelle PY, Flahault A, Ferguson NM (2008)Estimating the impact of school closure on influenza transmission from Sentinel
data. Nature 452: 750–754.
15. Chao DL, Halloran ME, Longini IM, Jr. (2010) School opening dates predictpandemic influenza A(H1N1) outbreaks in the United States. J Infect Dis 202:
877–880.16. Bjornstad O, Finkenstadt B, Grenfell B (2002) Dynamics of measles epidemics:
Estimating scaling of transmission rates using a Time series SIR model. EcolMonogr 72: 169–184.
17. Grenfell BT, Bjornstad ON, Finkenstadt BF (2002) Dynamics of measles
epidemics: scaling noise, determinism, and predicability with the TSIR model.Ecological Monographs 72: 185–202.
18. Shaman J, Goldstein E, Lipsitch M (2011) Absolute humidity and pandemicversus epidemic influenza. Am J Epidemiol 173: 127–135.
19. Shaman J, Pitzer VE, Viboud C, Grenfell BT, Lipsitch M (2010) Absolute
humidity and the seasonal onset of influenza in the continental United States.PLoS Biol 8: e1000316.
20. Germann TC, Kadau K, Longini IM, Jr., Macken CA (2006) Mitigationstrategies for pandemic influenza in the United States. Proc Natl Acad Sci U S A
103: 5935–5940.21. Cortese MM, Tate JE, Simonsen L, Edelman L, Parashar UD (2010) Reduction
in gastroenteritis in United States children and correlation with early rotavirus
vaccine uptake from national medical claims databases. Pediatr Infect Dis J 29:489–494.
22. Fraser C, Donnelly CA, Cauchemez S, Hanage WP, Van Kerkhove MD, et al.(2009) Pandemic potential of a strain of influenza A (H1N1): early findings.
Science 324: 1557–1561.
23. CDC (2005) CDC Influenza activity in the US. http://www.cdc.gov/flu/(accessed Oct 12, 2005)
24. Nelson MI, Tan Y, Ghedin E, Wentworth DE, St George K, et al. (2011)Phylogeography of the spring and fall waves of the H1N1/09 pandemic
influenza virus in the United States. J Virol 85: 828–834.25. Chowell G, Echevarria-Zuno S, Viboud C, Simonsen L, Tamerius J, et al.
(2011) Characterizing the Epidemiology of the 2009 Influenza A/H1N1
Pandemic in Mexico. PLoS Med 8: e1000436.26. Wu JT, Cowling BJ, Lau EH, Ip DK, Ho LM, et al. (2010) School closure and
mitigation of pandemic (H1N1) 2009, Hong Kong. Emerg Infect Dis 16: 538–541.27. Shaman J, Kohn M (2009) Absolute humidity modulates influenza survival,
transmission, and seasonality. Proc Natl Acad Sci U S A 106: 3243–3248.
28. http://www.sdihealth.com/ (2012) Surveillance Data Incorporated.29. Serfling R (1963) Methods for current statistical analysis of excess pneumonia-
influenza deaths. Public Health Rep 78: 494–506.30. Viboud C, Grais RF, Lafont BA, Miller MA, Simonsen L (2005) Multinational
impact of the 1968 Hong Kong influenza pandemic: evidence for a smolderingpandemic. J Infect Dis 192: 233–248.
31. Borse RH, Shrestha SS, Fiore AE, Atkins CY, Singleton JA, et al. (2013) Effects
of vaccine program against pandemic influenza A(H1N1) virus, United States,
2009–2010. Emerg Infect Dis 19: 439–448.
32. McCallum H, Barlow N, Hone J (2001) How should pathogen transmission be
modelled? Trends Ecol Evol 16: 295–300.
33. Eames KT, Tilston NL, Brooks-Pollock E, Edmunds WJ (2012) Measured
dynamic social contact patterns explain the spread of H1N1v influenza. PLoS
Comput Biol 8: e1002425.
34. Boelle PY, Ansart S, Cori A, Valleron AJ (2011) Transmission parameters of the
A/H1N1 (2009) influenza virus pandemic: a review. Influenza Other Respi
Viruses 5: 306–316.
35. Hardelid P, Andrews NJ, Hoschler K, Stanford E, Baguelin M, et al. (2010)
Assessment of baseline age-specific antibody prevalence and incidence of
infection to novel influenza A/H1N1 2009. Health Technol Assess 14: 115–192.
36. Hancock K, Veguilla V, Lu X, Zhong W, Butler EN, et al. (2009) Cross-reactive
antibody responses to the 2009 pandemic H1N1 influenza virus. N Engl J Med
361: 1945–1952.
37. Lemey P, Suchard M, Rambaut A (2009) Reconstructing the initial global
spread of a human influenza pandemic: A Bayesian spatial-temporal model for
the global spread of H1N1pdm. PLoS Curr 1: RRN1031.
38. Balcan D, Hu H, Goncalves B, Bajardi P, Poletto C, et al. (2009) Seasonal
transmission potential and activity peaks of the new influenza A(H1N1): a Monte
Carlo likelihood analysis based on human mobility. BMC Med 7: 45.
39. Hosseini P, Sokolow SH, Vandegrift KJ, Kilpatrick AM, Daszak P (2010)
Predictive power of air travel and socio-economic data for early pandemic
spread. PLoS One 5: e12763.
40. Simonsen L, Clarke MJ, Schonberger LB, Arden NH, Cox NJ, et al. (1998)
Pandemic versus epidemic influenza mortality: a pattern of changing age
distribution. J Infect Dis 178: 53–60.
41. Olson DR, Simonsen L, Edelson PJ, Morse SS (2005) Epidemiological evidence
of an early wave of the 1918 influenza pandemic in New York City. Proc Natl
Acad Sci U S A 102: 11059–11063.
42. Andreasen V, Viboud C, Simonsen L (2008) Epidemiologic characterization of
the 1918 influenza pandemic summer wave in Copenhagen: implications for
pandemic control strategies. J Infect Dis 197: 270–278.
43. Baillie GJ, Galiano M, Agapow PM, Myers R, Chiam R, et al. (2012)
Evolutionary Dynamics of Local Pandemic H1N1/2009 Influenza Virus
Lineages Revealed by Whole-Genome Analysis. J Virol 86: 11–18.
44. Viboud C, Nelson MI, Tan Y, Holmes EC (2013) Contrasting the
epidemiological and evolutionary dynamics of influenza spatial transmission.
Philos Trans R Soc Lond B Biol Sci 368: 20120199.
45. (2009) 2009 pandemic influenza A (H1N1) virus infections - Chicago, Illinois,
April–July 2009. MMWR Morb Mortal Wkly Rep 58: 913–918.
46. Charu V, Viboud C, Ballesteros S, Gog J, Grenfell B, et al. (2013) Validation of
a high-volume electronic surveillance system to monitor seasonal and pandemic
influenza activity in the US. Submitted.
47. HHS (2013) Regions Map. http://www.hhs.gov/about/regionmap.html
48. Cosgrove BA, Lohmann D, Mitchell KE, Houser PR, Wood EF, et al. (2003)
Real-time and retrospective forcing in the North American Land Data
Assimilation System (NLDAS) project. J Geophys. Res, 108(D22), 8842.
Spatial Transmission of 2009 Pandemic Influenza
PLOS Computational Biology | www.ploscompbiol.org 11 June 2014 | Volume 10 | Issue 6 | e1003635