Embed Size (px)
Citation preview

CLIMATE RESEARCH Clim. Res.
Published September 9
Spatial patterns of multiple drought types in the contiguous United States: a seasonal comparison
Peter T. Soule
Department of Geography, University of Alabama. Tuscaloosa, Alabama 35487, USA
ABSTRACT: The impacts of severe droughts on human activities, terrestrial ecosystems, and hydrologic systems are wide ranging and easily discernible. Because these impacts are felt at different times by water users, various forms of drought are recognized (e.g. agricultural, hydrological). The purpose of this study is to examine spatial patterns of drought in the contiguous United States on a seasonal basis using 4 measures of drought severity. Data used include the Palmer Moisture Anomaly Index (ZINX), Palmer Drought Severity Index (PDSI), Palmer Hydrologic Drought Index (PHDI), and standardized scores of monthly precipitation (PREZ) for the 344 climatic divisions in the contiguous United States, by month, for the period 1931 to 1985. Principal Components Analysis and a VARIMAX rotation are used to search for spatially coherent drought regions, i.e. clusters of climatic divisions that experienced similar moisture conditions during the study period. Regional drought patterns are presented using isoline maps of principal component loadings. Within a given season, the location, size and orientation of most drought reqons is largely consistent across the drought types represented by the PREZ, ZINX, PDSI, and PHDI. Although the fast responding index (ZINX, PREZ) patterns are more discrete (i.e. the drought regions are smaller and more numerous), the general location and orientation of the regions conform to those for the more slowly responding indices (PDSI, PHDI). For the fast responding indices there is a considerable amount of interseasonal variability in the regional drought patterns. The amount of variability decreases for both PDSI and PHDI, with most PHDI drought regions remaining stable throughout the year.
INTRODUCTION
Drought is a recurring component of climate in the continental United States. The negative impacts of a severe, protracted drought on human activities and the landscape are wide ranging and easily discernible. However, since droughts often last for months or years, these impacts are not uniformly experienced. The selection of appropriate measures, or definitions, of drought is thus complicated by the variable nature of drought impacts. At present, no universally acceptable definition of drought exists, except perhaps the general concept - 'lack of rain'. Instead, numerous definitions and measures of drought intensity geared to specific aspects of drought are used. The drought types recog- nized by climatologists, geographers, and others involved in drought research include, among others: agricultural, meteorological, hydrological, forest-fire potential, municipal water supply, and recreational.
The diverse nature of drought analyses can be par- tially attributed to the absence of unifying definitions and measures of drought. Analysis of the behavior
O Inter-Research/Printed in F. R. Germany
(duration, severity, etc.) of individual drought types (e.g. agricultural drought) is common: however, the concurrent behavior of more than one drought type is not generally examined (Yevjevich et al. 1978, Dracup et al. 1980). Thus, the base of knowledge about drought is skewed toward individual drought types.
Much of the work in geographical climatology cen- ters on the identification of regions that exhibit similar characteristics in response to meteorological fluctua- tions (e.g. Kutzbach 1967, Horel 1981, Karl & Koscielny 1982, Barring 1987, Ehrendorfer 1987). Walsh et al. (1982) claim that the accuracy of long-range (monthly to seasonal) precipitation forecasts should be greatest within spatially coherent precipitation regions. This argument could be applied to the forecasting of drought events, especially on a seasonal basis. Further justification for identifying spatially homogeneous, drought-type specific regions is that the different types of drought can vary both temporally and spatially in their impacts on human activities. Separate forecasting, drought planning, and water management schemes may need to be developed if the spatial properties (size,

14 Climate Research 1. 13-21. 1990
Fig. 1. The 344 climatic divisions in the contiguous United States
shape, location) of drought regions are highly variable among different drought types over the climatic record.
In this study spatial patterns of drought in the co- terminous United States are examined on a seasonal basis using 4 measures of drought severity. The pri- mary objectives are: (1) to identify spatially homogene- ous drought regions in the contiguous United States on a seasonal basis, (2) to determine if the identified re- gions are consistent across the drought types rep- resented, and (3) to examine the degree of season-to- season persistence of these regions.
DATA
All data used in this study are obtained from the 1986 version of the National Climatic Data Center's (NCDC) magnetic tape file TD9640 (NCDC 1986). Items directly extracted from this file include monthly values of the Palmer Moisture Anomaly Index (ZINX), the Palmer Drought Severity Index (PDSI) (Palmer 1965), and the Palmer Hydrologic Drought Severity Index (PHDI) (Karl & Knight 1985) for the 3 4 4 climatic divisions in the contiguous United States for the period 1931 to 1985 (Fig. 1). The calibration period for all indices is 1931 to 1985.
The Palmer indices are derived through manipula- tions of various water-balance variables. They incorpo- rate both current and antecedent moisture conditions
so that a long period of drought or wetness produces large absolute values of the indices. Although there is no upper or lower Limit, the indices generally range from +? to -7, with positive values representing mois- ture conditions above normal, negative values condi- tions below normal (i.e. a drought). The indices are also standardized so that drought (moisture) conditions can be compared across dissimilar climatic regimes and through time. Alley (1984), Karl & Knight (1985), and Karl (1986) provide detailed descriptions of the pro- cedures used to calculate the Palmer indices.
The ZINX measures the departure of the moisture status in an area from normal in a given month. It is the most sensitive of the 3 Palmer indices. Large deviations in supply (precipitation) or demand (evapotranspira- tion) of moisture within a given month will cause large changes in index values. Because of this trait, the ZINX is often positive for 1 or 2 mo during long periods of meteorological or hydrological drought (e.g. several months with negative PDSI or PHDI values). In terms of drought types, the ZINX is most appropriately used as a measure of agricultural or forest-fire potential drought (Karl 1986).
The PDSI is usually presented as a measure of meteorological drought intensity. Palmer (1965) designed the index to represent general moisture con- ditions during periods or spells of abnormally dry or wet weather. It responds too slowly to be useful as a measure of agricultural drought (Steila 1972) and too

Soule. Spatial patterns of drought in the USA 15
rapidly to assess conditions of hydrological drought (streamflow, ground-water levels) accurately (Alley 1985).
Hydrologic conditions are generally not representa- tive of moisture departures for other uses during the early stages of a drought. The PHDI, a measure of hydrological drought, expresses this by lagging behind both the ZINX and PDSI during the initial months of a drought. Also, since streamflow and reservoir levels are often well below normal long after a meteorological drought has ended, values of the PHDI tend to remain negative for up to several months after PDSI values have returned to normal levels.
Besides the Palmer indices, standardized scores (z- scores) of monthly precipitation (PREZ) were calculated for each climatic division using data for the entire study period (1931 to 1985). The PREZ provides for a measure of drought intensity based solely on the deviation of precipitation from normal.
METHODS
The technique used to help aid in the identification of spatially homogeneous drought regions is Principal Components Analysis (PCA). The use of PCA to iden- tify clusters of stations or spatial units that behave similarly with respect to a particular climatic variable is well established by the work of, among others, Dyer (1975), Barring (1987), Ehrendorfer (1987), for the spa- tial coherence of precipitation patterns, Horel (1981) and k c h m a n (1981) for atmospheric pressure patterns, and Karl & Koscielny (1982) and Eder et al. (1987) for spatial patterns of meteorological drought.
This study employs S-mode PCA, one of the 6 basic modes of PCA described by Richman (1986). For each of the 4 drought indices (PREZ, ZINX, PDSI, PHDI), the original data matrix has 344 variables (colun~ns) and 165 observations (rows). The variables are the 344 climatic divisions in the contiguous United States while the observations are collected over the 165 mo con- tained in each season during the 55 yr study period. Karl et al. (1982) point out that potential biases can result when using an irregularly spaced data set in an S-mode PCA. However, regularly spaced data sets are not always employed when analyzing climatic varia- bles with PCA (e.g. Goossens 1986, Eder et al. 1987). The alternate options of interpolating the raw data to a n equal-area grid or selecting only climatic divisions corresponding to an equal-area grid were not used in this study because of the potential for loss of informa- tion during the data reduction process, and the need to preserve the loadings for each variable (344 climatic divisions) for further analyses. The physical interpreta- tions of the drought regions may suffer somewhat, but
the primary goals of this study are unhindered by using all available data.
The first step in the PCA procedure was the compu- tation of a 344 X 344 Pearson product-moment correla- tion matrix for each drought index. The correlation matrix was then input into the procedure to extract the principal components (PCs or eigenvectors) and the associated eigenvalues of the unrotated solution. All PCAs were completed using the FACTOR procedure of SAS (SAS 1985).
In an S-mode PCA, the loadings can be mapped to show the spatial pattern of the characteristic under investigation. Mapping the loadings pattern from the unrotated PCA generally does not yield physically interpretable patterns when dealing with meteorologi- cal or climatological data (Richman 1981, 1986). Thus, results from the unrotated PCAs were used only to determine the number of factors to retain for rotation.
By rigidly rotating a predetermined number of PCs toward simple structure, clusters of climatic divisions that behave similarly with respect to the various drought types were identified. A simple structure solu- tion is obtained when the number of near-zero loadings is maximized (Thurstone 1947). The VARIMAX ortho- gonal rotation was used in this study. A VARIMAX solution strives for simple structure by increasing the value of large component loadings and decreasing the value of small loadings, i.e. the variance is maximized (Richman 1986). VARIMAX is a commonly used rota- tional method for meteorological map typing (e.g. Horel 1981, Karl & Koscielny 1982, Ehrendorfer 1987).
For this study a 2-stage approach was used to deter- mine the number of components to retain for rotation. The first stage employed the use of a scree test (Cattell 1966). Plots of eigenvalues for sequentially extracted components (scree plots) from the unrotated PCAs were used to identify a range of components to retain. For all indices, the scree plots suggested that a minimum of 6 PCs be retained for rotation.
For each data set, the second stage began with reten- tion of 6 components, rotation of the solution toward simple structure, and examination of the resulting load- ing matrix. The process was repeated with 7 , 8 , etc. components for rotation. To select the final number of components a critical loading value of 0.70 was used. If the maximum loading on the last PC extracted was below 0.70, the analysis proceeded using the results from the previous step. For example, if after rotation of 9 PCs, the maximum loading on the ninth PC was 0.45, then the results from the 8 PC solutions were used (providing that solution fulfilled the criteria). Loadings 20.70 indicate that ca 50 O/O or more of the variance in a variable is explained by a PC. By using a loading of 0.70 a s a cut-off point, the amount of overlap in mid- level loadings is minimized. Thus, mutually exclusive

16 Climate Research 1: 13-21, 1990
drought regions are identified and the possibility of identifying non-meaningful drought regions is di- minished. After determining the appropriate rotated solution to use, the PC loadings were extracted to aid in the identification of spatially homogeneous drought regions.
The centroids of each climatic division were located and digitized to provide X-y coordinate pairs. These pairs were then merged with the corresponding load- ings, which served as the z coordinate. The X-y-z data were converted to a uniformly spaced grid with the kriging algorithm of Golden Software's SURFER pro- gram (Golden Software 1986). The SURFER program was then used to fit isolines to the grid and draft a map for each PC. For each index, the series of maps was overlaid to produce the final map of the regional drought patterns. To aid in interpretation the loadings were multiplied by 10 before the gridding procedure. To make the maps more readable, isolines were drawn only for values 2 6 using an interval of one.
RESULTS
Spatially homogeneous drought regions were iden- tified for the PREZ (Fig. 2) , ZINX (Fig. 3), PDSI (Fig. 4), and PHDI (Fig.5) on a seasonal basis. Those areas enclosed by the 0.60 loading isoline represent the core areas of the drought regions. In some instances no 0.70 loading isolines were drafted (e.g. PC? for the PREZ in autumn) because the gridding algorithm failed to assign loading values 20.70 in the creation of the uniformly spaced grid.
A general trend across all the analyses is that more PCs are needed to explain the variance in the data set using the faster responding indices (PREZ and ZINX) (Table 1). This is not surprising since conditions of hydrological drought generally begin and end slowly whereas agricultural drought conditions often exhibit large variations from month to month. Thus, the more slowly responding indices are less temporally volatile and the PCA can account for a larger portion of the
I I l I I 1 12V 1000 8 0 120D 1 0(P 8 P
PREZ: WINTER PREZ: SPRING
- 40"
- 30.
A B l l I I I l
I 1 I \
PREZ: SUMMER PREZ: AUTUMN
- 4 0
- 30.
I1W lm 8 0 1200 IW 8 V I I l I I I
Fig. 2. IsoIine maps of the VARIMAX orthogonally rotated PC loadings ( X 10) for winter (A) , spring ( R ) , summer (C), and autumn (D) for the PREZ PCAs. Drought regions are labeled according to the PC they are aligned with

Soule: Spatial patterns of drought in the USA l?
Fig. 3. As in Fig. 2, for the ZINX
- I I 1
1 2 0 1 0 0 80"
ZINX: WINTER
Table 1. Summary of PCs retained and percent variance explained for the seasonal PCAs
I 1 I 1 2 v l GQ' 80'
ZINX: SPRING
Index Season No. PC '10 Variance retained explained
PREZ
- 40'
- 30'
A B I I 1
I I
ZINX: SUMMER ZINX: AUTUMN
- 4u 400 -
‘ 3V 3 0 -
C D
ZINX
120- 1 O v 8M I 1 l
PDSI
1 2 0 l 0 0 80. I I l
PHDI
Winter Spring Summer Autumn
Winter Spring Summer Autumn
Winter Spring Summer Autumn
Winter Spring Summer Autumn
variance in these data sets with fewer PCs. The climatic implications of this comparison are also consistent. A greater degree of spatial homogeneity is expected with the PHDI drought regions (i.e. fewer, but larger re- gions) because it takes a greater deviation from normal synoptic conditions to elicit changes in hydrologic con- ditions (estimated by the PHDI) than it does to elicit the same magnitude of change in agricultural drought con- ditions (estimated by the ZINX). Because agricultural drought severity is more tightly coupled with localized synoptic variability (e.g. convectional activity), agricul- tural drought regions will tend to be smaller and more numerous. Conversely, synoptic anomalies responsible for severe hydrologic droughts will tend to be more broad-scale in nature (e.g. persistent anticyclonic activ- ity), resulting in more widespread deviations from nor- mal moisture conditions.
On average, the greatest amount of explained var- iance is in winter (66 %), the least in summer (57 %). This seasonal difference reflects the fact that cyclonic storms tend to follow recurring tracks during winter,

18 Climate Research 1. 13-21, 1990
Fig. 4. As in Fig. 2, for the PDSI
I I I 120. l ODD 80.
PDSI: W I N T E R
bringing homogeneous temperature and precipitation conditions over large regions. Thus, neighboring clima- tic divisions will tend to experience similar drought (moisture) conditions during winter and the PCA can more easily sort out the patterns. In summer, the spa- tially erratic nature of convectional precipitation pat- terns results in increased heterogeneity among climatic divisions and the PCA cannot easily distinguish re- gional clusters.
I I l 120. 1 0 0 80.
PDSI: S P R I N G
Mapped patterns for the PREZ and ZINX
For the PREZ (Fig. 2 ) , the greatest degree of seasonal persistence in the drought regions is in the Middle AtlantidNortheast, the Pacific Coast/Northern Inter- mountain, and the Southeast. This persistence is Likely a reflection of more homogeneous air mass conditions in these regions. For the remainder of the country there is a considerable amount of inter-seasonal variability in terms of the size, shape, and alignment of drought
- 40'
- 30'
A
regions. Progressing from winter to summer, the drought regions become increasingly more compact, an indication of the increased complexity in precipita- tion patterns.
Seasonal drought patterns for the ZINX (Fig.3) are almost identical with those for the PREZ. Although thermal conditions are included in the Palmer model (i.e, through evapotranspiration), the agreement in mapped patterns shows that precipitation is the domi- nant variable in the ZINX. The only substantive differ- ences occur in autumn, where an extra drought region is identified by the ZINX in the upper Mississippi valley, and in winter, when the southern, central, and northern Great Plains drought regions are more closely aligned north to south.
The regional drought patterns for both the ZINX and PREZ match closely with seasonal shifts in synoptic patterns. The January cyclone trajectory map of Bryson & Hare (1974, their Fig. 26), shows 3 principle storm paths in the contiguous United States and one just north of the Canadian border. If this map is super-
I I 1 I 1
P D S I : SUMMER
I I I 1 l
PDSI: AUTUMN
- 30. --
I D
120. 1WO 80. I I l
120° 1W 80. I I 1
Soule: Spatial patterns of drought in the USA 19
I I \ I l l 120' 1 W 80' 120" 100' BC+
PHDI: WINTER PHDI: S P R I N G
- 30. A
l I l I I l I I l I l
PHDI: SUMMER PHDI: AUTUMN
- 400
- 3u' A- 3v -
C <l D 'L J
12P 100. 801 120. 100. 80. I I I I I 1
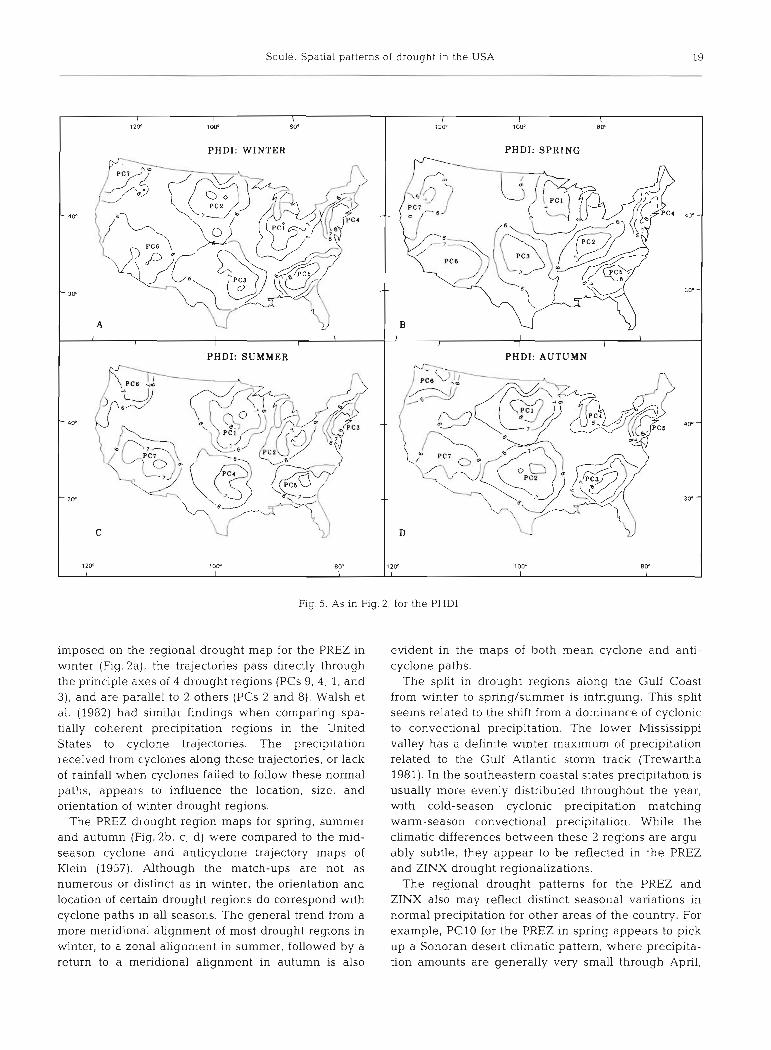
Fig. 5. As in Fig. 2, for the PHDI
imposed on the regional drought map for the PREZ in winter (Fig. 2a), the trajectories pass directly through the principle axes of 4 drought regions (PCs 9, 4, 1, and 3). and are parallel to 2 others (PCs 2 and 8). Walsh et al. (1982) had similar findings when con~paring spa- tlally coherent precipitation regions in the United States to cyclone trajectories. The precipitation received from cyclones along these trajectories, or lack of rainfall when cyclones failed to follow these normal paths, appears to influence the location, size, and orientation of winter drought regions.
The PREZ drought region maps for spring, summer and autumn (Fig. 2b, c, d) were compared to the mid- season cyclone and anticyclone trajectory maps of Klein (1957). Although the match-ups are not as numerous or distinct as in winter, the orientation and location of certain drought regions do correspond with cyclone paths in all seasons. The general trend from a more meridional alignment of most drought regions in winter, to a zonal alignment in summer, followed by a return to a meridional alignment in autumn is also
evident in the maps of both mean cyclone and anti- cyclone paths.
The split in drought regions along the Gulf Coast from winter to spring/summer is intriguing. This split seems related to the shift from a dominance of cyclonic to convectional precipitation. The lower Mississippi valley has a definite winter maximum of precipitation related to the Gulf Atlantic storm track (Trewartha 1981). In the southeastern coastal states precipitation is usually more evenly distributed throughout the year, with cold-season cyclonic precipitation matching warm-season convectional precipitation. While the climatic differences between these 2 regions are argu- ably subtle, they appear to be reflected in the PREZ and ZINX drought regionalizations.
The regional drought patterns for the PREZ and ZINX also may reflect distinct seasonal variations in normal precipitation for other areas of the country. For example, PC10 for the PREZ in spring appears to pick up a Sonoran desert climatic pattern, where precipita- tion amounts are generally very small through April,

20 Climate Resear
May, and June due to persistent subsidence from the Pacific anticyclone. Conversely, within the central Inter-mountain drought region on the same map (PC4) the spring climate is dominated by a southwesterly flow of maritime polar air around an upper level trough, resulting in a late spring maximum of precipita- tion (Trewartha 1981). A lack of inter-annual variability in precipitation also may influence the drought patterns, as illustrated by the stability of the Middle AtlantidNortheast drought region in all seasons.
Mapped patterns for the PDSI and PHDI
Because the PDSI of any given month is strongly controlled by moisture conditions in the previous months, Linking the PDSI patterns to intra-seasonal synoptic controls of climate is more difficult than with the PREZ or ZINX. Overall, there is considerable sea- sonal variability in the derived patterns for the PDSI (Fig.4). As with the ZINX and PREZ, the greatest amount of seasonal persistence is found in the Middle AtlantidNortheast and Southeast drought regions. The lack of a drought region centered in the Pacific North- west in winter is unusual. This is a consistent region in nearly all other instances. The more southerly location of PC Region 8 in winter (Fig. 4a) is possibly related to the timing of maximum yearly rainfall. The maximum rainfall generally occurs in late autumn (November) north of this region and in early winter (January) to the south of this region (Trewartha 1981). Because of the lag effect built into the PDSI, this region may be more representative of moisture conditions in December, when maximum precipitation is expected. PC Region 3 in spring (Fig. 4b) is also unusual because it extends from the central Inter-mountain region, across the Rocky Mountains, and into the northern Great Plains. The Rocky Mountains are generally not aligned with any drought region; they serve as a transition zone between the Pacific Coast and Great Plains drought regions. The large area enclosed by the 0.60 loading isolines for the southern and northern Great Plains drought regions in summer and autumn (Fig. 4c, d) shows that a large number of climatic divisions experi- enced similar drought conditions during these seasons over the climatic record.
Despite the unusual location of some drought re- gions, the overall PDSI patterns are consistent with synoptic knowledge, e.g. a southwest-northeast align- ment of drought regions in the eastern United States during winter and spring, and a more zonal alignment in summer. In addition, when the seasonal PDSI maps are overlaid on the seasonal ZINX maps, the core areas for the majority of regions match closely.
As a measure of hydrologic drought, the PHDI
responds slowly to changes in moisture supply and demand. Thus, it exhibits less temporal variability than the other 3 drought measures and produces more per- sistent inter-seasonal drought patterns (Fig. 5). In all seasons, 7 regions are identified, with very little differ- ence in the total amount of explained variance (Table 1). Particularly striking is the excellent match between summer and winter patterns. The greatest inter- seasonal variability is in the Northern Great Plains and Ohio Valley regions, while the least variability occurs in the southeast and Middle AtlantidNortheast re- gons . As with the PDSI, the Northern and Southern Great Plains drought regions include a large number of climatic divisions in summer and autumn, indicating homogeneous hydrologic drought history characteris- tics in these areas during these seasons.
CONCLUSIONS
There is a high degree of inter-regional variability in drought characteristics (e.g. frequency, duration, inten- sity, spatial coverage) within the contiguous United States (Diaz 1983, Karl 1983). This variability makes it difficult to develop drought contingency and water management plans that are applicable across the coun- try. Results from this study show that the degree of intra-regional variability in drought characteristics over the climatic record is small enough to allow for the identification of certain clusters of climatic divisions as spatially homogeneous, drought-type specific regions on a seasonal basis. Below, above, and normal moisture conditions were predominately in-phase (seasonally) over the course of the study period for each of these regions. Within a given season, the location, size and orientation of most drought regions is largely consistent across the drought types represented by the PREZ, ZINX, PDSI, and PHDI. Although the fast responding index (ZINX, PREZ) patterns are more discrete (i.e. the drought regions are smaller and more numerous), the general location and orientation of the regions conform to those for the more slowly responding indices (PDSI, PHDI). For the fast responding indices there is a consid- erable amount of inter-seasonal variability in the re- gional drought patterns. The amount of variability decreases for both the PDSI and PHDI, with most PHDI drought regions remaining stable throughout the year. While the location and alignment of drought regions can be circumstantially related to certain aspects of mesoscale synoptic meteorological patterns (e.g. cyclone trajectories), further analyses are needed to authenticate or refute these suspected causal links.
Planning and water management efforts designed to alleviate the negative impacts of drought are generally region specific (Yevjevich et al. 1978). A logical step to

Soule: Spatial patterns of drought in the USA 2 1
help improve drought contingency planning efforts would be to base the boundaries of administrative regions on climatically-based regionalization schemes, such as those developed in this study. Since the spatial characteristics of most drought types are intra-season- ally stable across the drought types , an administrative regionalization scheme based on the PDSI, with its intermediate rate of response to changes in supply and demand of moisture, would likely be appropriate in most situations.
Acknowledgements I thank the 3 anonymous reviewers of this paper for their suggestions. The University of Alabama Cartographic Laboratory helped produce the final figures.
LITERATURE CITED
Alley, W. M. (1984). The Palmer Drought Severity Index: limitations and assumptions. J. Climate appl. Meteorol. 23:llOO-1109
Alley, W. M. (1985). The Palmer Drought Severity Index as a measure of hydrologic drought. Wat. Resour Bull. 21: 104-1 14
Barring, L. (1987). Spatial patterns of daily rainfall in central Kenya: application of principal component analysis, com- mon factor analysis and spatial correlation. J. Climatol. 7: 267-289
Bryson, R. A., Hare, F. K. (1974). Climates of North America. Elsevier Scientlflc Publishing Co., Amsterdam
Cattell, R. B. (1966). The scree test for the number of factors. Multivariate Behavioral Res. 1. 245-276
Diaz, H. F. (1983). Some aspects of major dry and wet periods in the contiguous United States, 1895-1981. J. Climate appl. Meteorol. 22: 3-16
Dracup, J . A., Lee, K. S., Paulson E. G., J r (1980). On the definition of droughts. Water Resour Res. 16: 297-302
Dyer, T. G. J. (1975). The assignment of rainfall stations into homogeneous groups: an application of prlnclpal compo- nents analysis Q J. R Meteorol. Soc. 101. 100551013
Eder, B. K . , Davis, J M., Monahan, J. F. (1987). Spatial and temporal analysis of the Palmer Drought Severity lndex over the south-eastern United States. J. Climatol. 7, 31-56
Ehrendorfer, M. (1987). A regionalization of Austria's precipi- tation climate using principal components analysis. J . Climatol. 7. 71-89
Golden Software (1986). SURFER information manual. Golden Software, Inc., Golden, Colorado
Goossens, C. (1986). Regionalization of the Mediterranean climate. Theor. appl. Climatol. 37: 74-83
Editor: Professor V. Meentemeyer
Horel, J. D. (1981). A rotated principal component analysis of the inter-annual vanabllity of the northern hemisphere 500 mb height field Mon Weather Rev. 109. 2080-2093
Karl, T R. (1983). Some spatial characteristics of drought duration in the United States. J . Climate appl. Meteorol. 22: 1356-1366
Karl, T R. (1986). The sensitivity of the Palrner Drought Severity lndex and Palmer's 2-Index to their calibration coefficients including potential evapotranspiration. J . Climate appl. Meteorol. 25: 77-86
Karl, T R., Knight, R. W. (1985): Atlas of monthly Palmer Drought Severity Indices (1931-1983) for the contiguous United States. Climatic Data Center, Ashville, N. Carolina
Karl, T R., Koscielny, A. J . , Diaz, H. F. (1982). Potential errors in the application of principal component (eigenvector) analysis to geophysical data. J . appl. Meteorol. 21: 1183-1 186
Karl, T R., Koscielny, A. J. (1982). Drought in the United States: 1895-1981. J . Climatol. 2: 313-329
Klein, W. H. (1957). Principal tracks and mean frequencies of cyclones and anticyclones in the Northern Hemisphere. Res. Paper No. 40, U.S. Weather Bureau, 60 pp
Kutzbach, J. E. (1967). Empirical eigenvectors of sea-level pressure, surface temperature and precipitation complexes over North America. J . appl. Meteorol. 6: 791-802
National Climatic Data Center (1986). Time bias corrected divisional temp-precip-drought index: TD9640 tape documentation. National Climatic Data Center, Ashville, N. Carolina
Palmer, W. C. (1965). Meteorological drought. Res. Pap. No. 45, L.S. Weather Bureau, 58 pp.
Richman, M. B. (1981). Obliquely rotated principal compo- nents: an imp.roved meteorological map typing technique? J. appl. Meteorol. 20. 1145-1159
Richman, M. B. (1986). Rotation of principal components. J. Clirnatol. 6: 293-335
SAS (1985). SAS user's guide: statistics, version 5 edn. SAS Institute, Inc., Carp. N. Carolina
Steila, D (1972). Drought in Arizona. University of Arizona, Division of Econom~c and Business Research, Tucson, Arizona
Thurstone, L. L. (1947). hdultlple factor analysis. University of Chicago Press, Chicago
Walsh, J . E., Richman, M. B., Allen, D. W. (1982). Spatial coherence of monthly precipitation in the United States. Mon. Weather Rev. 110: 272-286
Trewartha, G. T (1981). The Earth's problem climates. Uni- versity of Wi.sconsin Press, Madison, Wi.sconsin
Yevjevich, V. M., Hall, W A., Salas, J. P. (eds.) (1978) Drought research needs. Proc. Conf on Drought Research Needs, Fort Collins, Colo., 276 pp Water Resources Publications, Fort Colllns
I\/lanuscript first received: August 21. 1989 Revised version accepted: February 22, 1990