Embed Size (px)
Citation preview
1
Spatial patterns of ectoenzymatic kinetics in relation to
biogeochemical properties in the Mediterranean Sea and the
concentration of the fluorogenic substrate used.
France Van Wambeke1, Elvira Pulido
1, Philippe Catala3
, Julie Dinasquet
2,3, Kahina Djaoudi
1,4, Anja
Engel5, Marc Garel
1, Sophie Guasco
1, Barbara Marie3, Sandra Nunige
1, Vincent Taillandier
6, Birthe 5
Zäncker6,7
, Christian Tamburini1.
1Aix-Marseille Université, CNRS/INSU, Université de Toulon, IRD, Mediterranean Institute of Oceanography (MIO)
UM 110, 13288, Marseille, France 2Marine Biology Research Division, Scripps Institution of Oceanography, UCSD, La Jolla, USA 10
3Sorbonne Universités, UPMC University Paris 6, Laboratoire d'Océanographie Microbienne (LOMIC), Observatoire
Océanologique, 66650, Banyuls/mer 4Molecular and Cellular Biology, The University of Arizona, Tucson, USA
5GEOMAR – Helmholtz-Centre for Ocean Research, Kiel, Germany
6CNRS, Sorbonne Universités, Laboratoire d’Océanographie de Villefranche (LOV), UMR7093, 06230 Villefranche-15
sur-Mer, France 7The Marine Biological Association of the UK, Plymouth, United Kingdom
Correspondence to: F. Van Wambeke ([email protected])
Abstract. Ectoenzymatic activity, prokaryotic heterotrophic abundances and production were 20
determined in the Mediterranean Sea. Sampling was carried out in the sub surface, the deep
chlorophyll maximum layer (DCM), the core of the Levantine Intermediate waters and in the deeper
part of the mesopelagic layers. Michaelis-Menten kinetics were assessed, using a large range of
concentrations of fluorogenic substrates (0.025 to 50 µM). As a consequence, Km and Vm
parameters were determined for both low and high affinity enzymes for alkaline phosphatase, 25
aminopeptidase (LAP) and glucosidase (GLU). Based on the constant derived from the high
LAP affinity enzyme (0.025-1 µM substrate concentration range), in-situ hydrolysis of N-protein
contributed 48% ± 30% to the heterotrophic bacterial nitrogen demand within the epipelagic layers
and 180% ± 154% in the Levantine Intermediate waters and the upper part of the mesopelagic
layers. The LAP hydrolysis rate was higher than bacterial N demand only within the deeper layer, 30
and only when considering the high affinity enzyme. Based on a 10% bacterial growth efficiency,
the cumulative hydrolysis rates of C-proteins and C-polysaccharides contributed on average 2.5% ±
1.3 % to the heterotrophic bacterial carbon demand in the epipelagic layers sampled (sub surface
and DCM). This study clearly reveals potential biases in current and past interpretations of the
kinetic parameters for the 3 enzymes tested based on the fluorogenic substrates concentration used. 35
In particular, the LAP/GLU enzymatic ratios, and some of the depth-related trends, differed
between the use of high or low concentrations of fluorogenic substrates.
1 Introduction
In aquatic environments, the organic matter compounds available for bacterial utilization are
dominated by polymeric material (Simon et al., 2002; Aluwihare et al., 1997). In order to be 40
assimilated, first they need to be hydrolyzed into smaller molecules by ectoenzymes. This
represents a limiting step in organic matter degradation, and in nutrient regeneration (Hoppe, 1983;
Chróst, 1991). Whether the ectoenzymatic activity should be considered as limiting the rate of
organic matter remineralization is a subject of debate since hydrolysis and consumption of the by-
products of hydrolysis are not always coupled (Smith et al., 1992). Bacterial ectoenzymatic 45
hydrolysis is usually determined using fluorogenic substrates (Hoppe, 1983) which, when cleaved
Supprimé: derived from a
Supprimé: of concentrations
Supprimé: of
Supprimé: of50
Supprimé: below
Supprimé: (
Supprimé: )
Supprimé: to the heterotrophic bacterial
demand, by 55
Supprimé: for
Supprimé: dcm
Supprimé: of
Supprimé: ir
Supprimé: sets60
Supprimé: aminopeptidase/glucosidas
e
Supprimé: the
2
by the ectoenzyme, triggers the release of a fluorescent by-product. The fluorescence increase is
monitored over time, thus allowing the determination of the hydrolysis rate. Kinetic experiments are 65
time-consuming and most studies reporting ectoenzymatic activity examined enzyme kinetic
patterns using one or two samples. A single presumably saturating substrate concentration is then
used to determine the activity of all the samples. Baltar et al. (2009b) cite 17 published studies on
ectoenzymatic activity from which 12 used a single substrate concentration, ranging from 0.02 to
1000 µM (with a median of 50 µM). Only 5 studies used a range of substrate concentrations to 70
determine enzyme kinetics. In these 5 studies the lowest substrate concentration used was 50 nM
(typically the lower concentration in the set is between 1 and 5 µM), while the highest concentration
was 1200 µM (range of the higher concentrations in the set 5 - 1200 µM, with a median of 200
µM). Another compilation of data from the Mediterranean Sea (Zaccone and Caruso; 2019) showed
that 6 out of 22 studies used a single concentration (assumed to be saturating) with a median of 125 75
µM for Leucine 7-amido 4-methyl coumarin and 50 µM for Methylumbellyferyl-phosphate.
Likewise, the remaining studies assessed enzyme kinetics with a highly variable range of substrate
concentrations (lowest concentrations 0.025-200 µM with a median of 0.1 µM, highest
concentrations 1- 4000 µM with a median of 20 µM). However, the combination of: i) non-
specificity in the enzymes, ii) the heterogeneity of enzymatic systems within single species, iii) the 80
diversity in species present and iv) the range and variability in concentrations of surrounding
substrates, will result in multiphasic kinetics (Chróst, 1991; Arnosti, 2011; Sinsabaugh and Follstad
Shah, 2012 and references therein). Ectoenzymes are produced by a diversity of microorganisms.
Their activity depends on a patchy distribution of natural substrates and a variety of natural
(potentially unknown) molecules which can be hydrolyzed by the same enzymes, with potentially 85
different affinities. For instance, cell-specific activities and types of activities were shown to be
very variable among 44 heterotrophic bacterial strains isolated from the Californian coast and
experimental phytoplankton blooms, both from particles and in the suspended phase (Martinez et
al., 1996). Arrieta and Herndl (2001) showed differences in Km and Vm in an assessment of the
diversity of marine bacterial -glucosidases taken from a natural community. In the water column 90
different kinetic systems were also observed which were generally attributed to attached or free-
living bacteria having different affinities for substrates: k-strategists-oligotrophic bacteria (with
both low Km and Vm) or r-strategists/copiotrophic bacteria (with both high Km and Vm, Koch,
2001). At depth, the combination of refractory DOM with recent and freshly sinking particles would
promote multiphasic kinetic for ectoenzymatic activity. Biphasic kinetic systems have been 95
described in areas where increasing gradients of polymeric material are expected due to the high
concentration of particles; e.g. near the bottom and sediments for aminopeptidase (Tholosan et al.,
1999), and in a shallow bay for phosphatases (Bogé et al., 2013). Most studies have shown that cell-
specific ectoenzymatic activities on aggregates are ~10 fold higher than those of the surrounding
assemblages (for example during a decaying bloom, Martinez et al., 1996). Biphasic kinetics were 100
also attributed to free-living bacteria versus attached heterotrophic bacteria, the latter adapted to
high substrate concentrations (with both higher Vm and Km; Unanue et al., 1999). Size
fractionation is commonly carried out prior to incubation with fluorogenic substrate in order to
determine in which size fraction the activity is dominant. However, size fractionation prior to
incubation biases ectoenzymatic activities, due to filtration artifacts and the disruption of trophic 105
relationships between primary producers, heterotrophic bacteria, protozoans and particulate matter.
Despite such biases, carbon budgets have shown that the prokaryotes attached to aggregates are a
likely source of by-products for free-living prokaryotes (Smith et al., 1992). Measurements in bulk
samples enable different enzymatic kinetics to be determined without disturbing relationships
between free/attached prokaryotes and DOM/POM interactions during the incubations. 110
Supprimé: Further,
Supprimé: a table with
Supprimé: I
Supprimé: varying
Supprimé: the115
Supprimé: Of
Supprimé: ,
Supprimé: that hydrolyze the added
fluorochrome
Supprimé: attached 120
Supprimé: assessed
Supprimé: , separated using capillary electrophoresis zymography, and showed
that they had different Km and Vm
Supprimé: a125
Supprimé: cope with
Supprimé: 1998
Supprimé: s
Supprimé: s
3
In the Mediterranean Sea, elemental C/N/P ratios of dissolved nutrients and organic matter are the 130
subject of particular interest to elucidate the impact of P-deficiency on DOC accumulation in
surface waters (Thingstad and Rassoulzadegan, 1995; Krom et al., 2004) given that the export of
organic carbon in dissolved vs. particulate forms is linked to the P-limitation in surface layers
(Guyennon et al., 2015). Since the epipelagic layers are P or N-P limited during most of the
stratification period, ectoenzymes such as phosphatase and aminopeptidase providing P and N 135
sources from organic matter have been intensively studied as indicators of these limitations (Sala et
al., 2001; Van Wambeke et al., 2002). However, the potential bias introduced by multiple kinetics
when comparing different types of ectoenzymes and using variable range of substrates is still poorly
understood.
In this study, we investigated the Michaelis-Menten kinetics of three series of enzymes targeting 140
proteins, phospho-mono esters and carbohydrates (leucine aminopeptidase, alkaline phosphatase
and -D –glucosidase, respectively) in the Mediterranean Sea. A wide range of substrate
concentrations was tested to evaluate potential multiphasic kinetics. Our aim was to evaluate
potential biases in the interpretation of past and current enzymatic kinetics based on studies
measuring rates with a reduced range of substrate concentration or with the use of too high substrate 145
concentrations. We also studied the links between ectoenzyme activities with the spatial (vertical
and horizontal) trends in the quality of the available organic matter. In the Mediterranean Sea, the
distribution of biogeochemical properties below the productive zone is the result of large-scale
dynamic transport systems associated with three distinct thermohaline circulation cells (Wust, 1961;
Hopkins, 1978; The Mermex Group, 2011 and references therein). These open cells convey fresh 150
and cool waters of Atlantic origin to the upper 150-200 m water layer extending into the eastern
part of the Levantine Sea. The return branch is composed of warm, saline waters, the Levantine
intermediate waters (LIW), which spreads over the whole Mediterranean Sea at depths of 200-500
m (Kress et al., 2003; Malanotte-Rizzoli et al., 2003; Schroeder et al., 2020). In addition, two closed
cells, within each Mediterranean sub-basin, are driven by deep water convection and spread below 155
the LIW (e.g., Lascaratos et al., 1999; Testor et al., 2018).
This study focuses on the open waters of the Mediterranean Sea, examining four water layers:
surface (generally P or N limited in stratification period), the deep chlorophyll maximum layer
(coinciding with nutricline depths), the LIW and the deep waters. Alongside marine biogeochemical
fluxes, atmospheric fluxes were quantified simultaneously during the same cruise. As a result of 160
these exceptional simultaneous measurements, the data used in this manuscript are also used in
another article of this special issue (Van Wambeke et al., 2020) where biogeochemical fluxes within
the mixed layers are compared to wet and dry N and P atmospheric fluxes.
2. Materials and Methods
2.1 Sampling strategy 165
The PEACETIME cruise (doi.org/10.17600/15000900) was conducted from May to June 2017,
along a transect extending from the Western Mediterranean Basin to the center of the Ionian Sea
(25°S 115 E – 15°S, 149°W, Fig. 1). For details on the cruise strategy, see Guieu et al. (2020).
Stations of short duration (< 8 h, 15 stations named SD1 to SD10, Fig. 1) and long duration (5 days,
3 stations named TYR, ION and FAST) were sampled. At least 3 casts were conducted at each short 170
station. One focused on the first 250 m and the second one on the whole water column. These 2
casts were sampled with a standard, CTD rosette equipped with 24 Niskin bottles (12 L), and a Sea-
Supprimé: fact
Supprimé: internal
Supprimé: to175
Supprimé: of fluxes on the same cruise
Supprimé: Generally, a
4
Bird SBE9 underwater unit equipped with pressure, temperature (SBE3), conductivity (SBE4),
chlorophyll fluorescence (Chelsea Acquatracka) and oxygen (SBE43) sensors. The third cast (from
surface to bottom) was carried out using a trace metal clean (TMC) rosette mounted on a Kevlar 180
cable and equipped with Go-Flo bottles that were sampled in a dedicated trace metal free-container.
The long stations situated in the center of the Tyrrhenian Sea (TYR), in the center of the Ionian Sea
(ION) and in the western Algerian Basin (FAST) were selected using satellite imagery, altimetry
and Lagrangian diagnostics to target dust deposition events (Guieu et al., 2020). At these stations,
repeated casts were performed, alternating CTD- and TMC- rosettes. 185
The water sampled with the conventional CTD-rosette was used for measurements of heterotrophic
bacterial production (BP, sensus stricto referring to heterotrophic prokaryotic production),
heterotrophic bacterial abundances (BA, sensus stricto referring to heterotrophic prokaryotic
abundances), ectoenzymatic activities (EEA), chlorophyll stocks, particulate organic carbon (POC),
nitrogen (PON), phosphorus (POP) and dissolved organic carbon (DOC). Dissolved inorganic 190
nitrogen (DIN) and phosphorus (DIP), dissolved organic nitrogen (DON) and phosphorus (DOP)
were measured in samples collected using the TMC-rosette
Details on sampling and analysis for the additional parameters presented in this paper (hydrographic
properties, total chlorophyll a (Tchl-a) are available in Taillandier et al. (2020), Guieu et al. (2020),
and Marañón et al. (2020), in this issue. 195
We focused on 4 layers of the water column; two in epipelagic waters: at 5 m near the surface
(SURF) and in the deep chlorophyll maximum layer (DCM) localized by the in vivo fluorescence
measured continuously during downcasts, and two in deeper layers: in the LIW characterized by a
sub-surface salinity maximum and oxygen minimum during downcasts (LIW), and at 1000 m, the
limit between meso and bathypelagic waters, (MDW), except at FAST and ION, where the MDW 200
samples were collected at 2500 m and 3000 m, respectively (Table 1).
2.2 Biochemistry
Nitrate (NO3), nitrite (NO2), and orthophosphate (DIP) concentrations were determined using a
segmented flow auto-analyzer (AAIII HR Seal Analytical) according to Aminot and Kérouel
(2007). The detection limits were 0.05 µM for NO3, 0.01 µM for NO2 and 0.02 µM for DIP. DON 205
and DOP were determined after high-temperature (120 °C) persulfate wet oxidation (Raimbault et
al., 1999) as follows: water sample was filtered through a 0.2 µm PES membrane and collected into
25 ml glass flasks. Samples were immediately poisoned with 100 µl H2SO4 5N and stored in the
dark until analysis in the laboratory. Samples (20 mL) were then transferred in Teflon vials for wet
oxidation. Nitrate and phosphate formed corresponding to the total N and P in the dissolved pool 210
(TDN and TDP) were determined as described for dissolved inorganic nutrients. DON and DOP
were obtained from the difference between TDN and DIN, and TDP and DIP, respectively. The
limits of detection were 0.5 and 0.02 μM for DON and DOP, respectively.
Particulate organic nitrogen and phosphate (PON, POP) were determined using the same wet
oxidation method (Raimbault et al., 1999). Samples (1.2 L) were collected into polycarbonate 215
bottles and filtered through pre-combusted (450 °C, 4 h) glass fiber filters (Whatman 47mm GF/F).
Filters were stored at -20°C until analysis. In the laboratory, samples were placed in Teflon vials
with 20 mL of ultrapure water (Milli-Q grade) and 2.5 mL of the wet oxidation reagent for
mineralization. The nitrate and orthophosphate produced were analyzed as described previously.
The limits of detection were 0.02 and 0.001 μM for PON and POP, respectively. 220
Supprimé: the
Supprimé: data
Supprimé: :
Supprimé: localized
Supprimé: named 225
Supprimé: (
Supprimé: named
Supprimé: 2 stations :
Supprimé: , 2500 m
Supprimé: , 3000 m230
Supprimé: abbreviated as
Supprimé: mineralization
Supprimé: Filtered s
Supprimé: and
Supprimé: n235
Supprimé: i
Supprimé: where they
Supprimé: quantification
5
In epipelagic samples from nutrient-depleted layers, DIP and NO3 were determined using the liquid
waveguide capillary cell method (LWCC) (Zhang and Chi, 2002) with enhanced sensitivity of the 240
spectrophotometric measurement by an increase in the length of the optical path of the measurement
cell to 2.5 m. For DIP, the detection limit was 0.8 nM and the response was linear up to about 150
nM, for NO3, the detection limit was 9 nM. Phospacline and nitracline depths were determined as
the layers where 50 nM concentration is reached.
Samples for dissolved organic carbon (DOC) were filtered through two pre-combusted (24 h, 245
450°C) glass fiber filters (Whatman GF/F, 25 mm) using a custom-made glass/Teflon filtration
syringe system. Samples (10 mL in duplicates) were collected into pre-combusted glass ampoules
and acidified to pH 2 with phosphoric acid (H3PO4). Ampoules were immediately sealed and stored
in the dark at room temperature. Samples were analyzed by high temperature catalytic oxidation
(HTCO) on a Shimadzu TOC-V-CSH analyzer (Cauwet, 1999). Prior to injection, DOC samples 250
were purged with CO2 -free air for 6 min to remove inorganic carbon. 100 μL of samples were
injected in triplicate and the analytical precision was 2%. Consensus reference materials
(http://www.rsmas.miami.edu/groups/biogeochem/CRM.html) were injected every 12 to 17 samples
to insure stable operating conditions. The nominal and measured DOC concentrations of the two
batches used in this study were 42-45 µM and 43-45 µM, respectively, for batch14-2014#07-14, 255
and 42-45 µM and 42-49 µM, respectively, for batch17-2017 #04-17. Particulate organic carbon
(POC) was measured using a CHN analyzer using the improved analysis proposed by Sharp (1974).
Samples (20 ml) for total hydrolysable carbohydrates (TCHO) > 1 kDa were collected into
precombusted glass vials (8 h at 500°C) and stored at -20°C until analysis. Samples were
desalinated using membrane dialysis (1 kDa MWCO, Spectra Por) at 1°C for 5 h. Samples were 260
then hydrolyzed for 20 h at 100°C with 0.8 M HCl final concentration with subsequent
neutralization using acid evaporation (N2, for 5 h at 50°C). TCHO was analyzed using high
performance anion exchange chromatography with pulsed amperometric detection (HPAEC-PAD)
which was applied on a Dionex ICS 3000 ion chromatography system (Engel and Händel, 2011).
Two replicates for each TCHO sample were analyzed. 265
Total hydrolysable amino acids (TAA) were determined from 5 mL water sample collected into
precombusted glass vials (8 h, 500°C) and stored at -20°C. Samples were measured in duplicates.
The samples were hydrolyzed at 100°C for 20 h with 1 mL 30% HCl (Suprapur®
, Merck) per 1 mL
of sample and neutralized by acid evaporation under vacuum at 60°C in a microwave. Samples
were analyzed using high performance liquid chromatography (HPLC) on an Agilent 1260 HPLC 270
system following a modified version of established methods (Lindroth and Mopper, 1979; Dittmar
et al., 2009). Prior to the separation of 13 amino acids with a C18
column (Phenomenex Kinetex,
2.6 µm, 150 x 4.6 mm), in-line derivatization with o-phthaldialdehyde and mercaptoethanol was
carried out. A gradient with solvent A containing 5 % acetonitrile (LiChrosolv, Merck, HPLC
gradient grade) in sodiumdihydrogenphosphate buffer (Suprapur®
, Merck, pH 7.0) and acetonitrile 275
as solvent B was used for analysis. A gradient from 100 % solvent A to 78 % solvent A was
produced in 50 min.
2.3 Bacterial production
BP was determined onboard using the 3H- leucine (
3H-Leu) incorporation technique (Kirchman,
1993) and the microcentrifuge method (Smith and Azam, 1992) for epipelagic water samples. The 280
filtration technique was used for deep water samples as the centrifuge technique (limited to
incubation volumes of 1.5 mL) is not sensitive for deep water communities. For SURF and DCM
Supprimé: the
Supprimé: whereby
Supprimé: the285
Supprimé: was improved
Supprimé: g
Supprimé: s
Supprimé: lowered to
Supprimé: s290
Supprimé: lowered to
Supprimé: storen
Supprimé:
Supprimé: sparged
Supprimé: ) buffer (295
Supprimé: (Smith and Azam, 1992)
Supprimé: ,
Supprimé: and t
Supprimé: ;
Supprimé: is 300
Supprimé: and
6
layers, triplicate 1.5 mL samples and a control killed with trichloracetic acid (TCA, 5 % final
concentration) were incubated with a mixture of 4,5-3H-leucine (Amersham, specific activity 112
Ci mmol-1
) and nonradioactive leucine at final concentrations of 7 and 13 nM, respectively.
Samples were incubated in the dark at the respective in situ temperatures for 1- 4 h. On 9 occasions 305
during the cruise transect, we checked that the incorporation of leucine was linear with time.
Incubations were ended by the addition of TCA to a final concentration of 5 %, followed by three
runs of centrifugation at 16000 g for 10 minutes. Bovine serum albumin (BSA, Sigma, 100 mg L-1
final concentration) was added before the first centrifugation. After discarding the supernatant, 1.5
mL of 5 % TCA was added before the second centrifugation, and after discarding the supernatant, 310
1.5 mL of 80 % ethanol was added. After the third centrifugation, the ethanol supernatant was then
discarded and 1.5 mL of liquid scintillation cocktail (Packard Ultimagold MV) was added. For the
LIW and MDW layers, 40 mL samples were incubated in the dark for up to 12 hours at in situ
temperature (triplicate live samples and one control fixed with 2% formalin), with 10 nM 4,5-3H-
leucine. After filtration of the sample through 0.2 µm polycarbonate filters, 5% final concentration 315
TCA was added for 10 minutes, subsequently the filter was rinsed with 10 mL 5% TCA and a final
rinse with 80% ethanol.
For both types of samples (centrifuge tubes and filters) the incorporated radioactivity was counted
using a Packard LS 1600 Liquid Scintillation Counter on board the ship. A factor of 1.5 kg C mol
leucine-1
was used to convert leucine incorporation to carbon, assuming no isotopic dilution 320
(Kirchman, 1993), as checked 4 times using concentration kinetics. Standard deviations from
triplicate measurements averaged 8 % and 25 % for BP values, estimated with the centrifugation
(surface layers) or the filtration technique (deep layers), respectively.
2.4 Ectoenzymatic activities
EEA were measured fluorometrically, using the following fluorogenic model substrates: L-leucine-325
7-amido-4-methyl-coumarin (Leu-MCA), 4 methylumbelliferyl – phosphate (MUF-P), 4
methylumbelliferyl – D-glucopyranoside (MUF-glu) to track aminopeptidase activity (LAP),
alkaline phosphatase activity (AP), and glucosidase activity (GLU), respectively (Hoppe, 1983).
Stock solutions (5 mM) were prepared in methycellosolve and stored at −20°C. The amounts of
MCA and MUF products released by LAP, AP and GLU activities after addition of substrate 330
concentrations ranging from 0.025 to 50 µM, were followed by measuring the increase in
fluorescence (excitation/emission wavelength 380/440 nm for MCA and 365/450 nm for MUF,
wavelength width 5 nm) in a VARIOSCAN LUX microplate reader. The instrument was calibrated
with standards of MCA and MUF solutions diluted in filtered (< 0.2 μm) boiled seawater. For
measurements, 2 mL of unfiltered seawater samples were supplemented with 100 µL of a 335
fluorogenic substrate solution in a black 24-well polystyrene plate in duplicate. Incubations were
carried out in the dark in thermostatically controlled incubators at in situ temperatures. Incubations
lasted up to 24 h, with fluorescence measurements every 1 to 3 h, depending on the expected
activities. The enzyme hydrolysis rate (V) was calculated from the linear part of the fluorescence
versus time relationship. Boiled-water blanks were run to check for abiotic activity. The parameters 340
Vm (maximum hydrolysis velocity) and Km (Michaelis-Menten half-saturation constant which
reflects enzyme affinity for the substrate) were estimated by fitting the Michaelis-Menten function
(V = Vm × S/(Km + S)), to the hydrolysis rate (V) as a function of the fluorogenic substrate
concentration (S) using non linear regression (PRISM4, Graph Pad software, San Diego, USA). Vm
and Km were determined using 3 series of substrate concentrations: Vmall and Kmall (global model) 345
Supprimé: then
Supprimé: using
Supprimé: occasional
Supprimé: em
Supprimé: Three plates were filled per 350 layer and analyzed with the different
substrates MUF-P, MCA-leu and MUF-
glu.
Supprimé: non-linear regression of
Supprimé: : 355
Supprimé: (
Supprimé: We determined
7
were calculated using a range of 11 concentrations (0.025, 0.05, 0.1, 0.25, 0.5, 1, 2.5, 5, 10, 25 and
50 µM) in duplicate, Vm1 and Km1 (model 1) were calculated using a restricted substrate
concentration set (0.025, 0.05, 0.1, 0.25, 0.5, 1 µM) in duplicate, and Vm50 and Km50 (model 50) 360
were calculated using the concentration set restricted to the high values of substrate (2.5, 5, 10, 25,
50 µM). The tunovertime was estimated as the ratio Km/Vm (Wright and Hobbie, 1966). We used
the term ‘ectoenzyme’ for all types of enzymes found outside the cell, including enzymes attached
on external membranes, within the periplasmic space, or free-dissolved enzymes, to broadly
encompasses all enzymes located outside of intact cells regardless of the process by which such 365
enzymes interact with the substrate.
We used an approach similar to Hoppe et al. (1993) to compute in situ hydrolysis rates for LAP and
GLU using total carbohydrates (TCHO) and total aminoacids (TAA) concentrations in water
samples as representative of dissolved carbohydrates and proteins, respectively. The calculation for
AP is presented in a companion paper from this issue (Pulido-Villena et al., in prep). These rates 370
were calculated based on both Vm1 and Km1, and on Vmall and Kmall. In situ hydrolysis rates
expressed in nmol substrate L-1
h-1
were converted into carbon and nitrogen units using C/TCHO,
C/TAA and N/TAA molar ratios.
2.5 Statistics
To assess biphasic ectoenzymatic activities, all kinetics where the coefficient of variation (standard 375
error/mean ratio) of Vm or Km was greater than 100% were rejected. For the remaining data we
used the F-test of Fisher-Snedecor as developed in Tholosan et al. (1999) to ascertain whether 2
additional parameters (Vm1, km1 and Vm50, Km50 instead of Vmall and Kmall) improved the model
significantly based on the following series of equations:
Cost (Vm, Km) = Σ [(Vdata-Vfit)/w]2
380
where Vdata is the experimental hydrolysis rate, Vfit the corresponding value of the fitted function,
w a weighting factor set to 1, as in Tholosan et al (1999). The cost function was determined for the
global model fitted with the entire set of concentrations (costall), model 1 (cost1), and model 50
(cost50) as:
Var (additional parameters) = (costall - cost1 - cost50) / 2 385
Var (biphasic) = (cost1 + cost50) / (n - 4)
Where n is the number of concentrations data in the entire data set. These 2 variances where finally
compared using the F test:
F(2, n-4) = var (additional parameters)/var (biphasic)
When the F test showed that the variances were significantly different at a probability of 0.1 we 390
assumed that the biphasic mode was meaningful enough to explain the kinetics of the entire data
set.
Trends with depth were estimated using a depth variation factor (DVF) estimated as the mean of
pooled SURF and DCM data divided by the mean of pooled LIW and MDW data. This decrease (or
increase), was considered as significant after a t-test comparing both series of data. The type of t 395
test used depended on the result of a preliminary F-test checking for variance. Coefficient of
variation (CV) was calculated as: standard deviation/mean x 100. Correlations among variables
Supprimé: up to 1 µM
Supprimé: or
Supprimé: )400
Supprimé: entered the environment
Supprimé: (the calculation for AP is presented in a companion paper from this
issue by Pulido-Villena et al., in prep),
Supprimé: on one hand 405
Supprimé: , for the other
Supprimé: then
Supprimé: trends within
Supprimé: firstly, we rejected
Supprimé: kinetics410
Supprimé: , secondly,
Supprimé: sigma
Supprimé: like assumed
Supprimé: the
Supprimé: with low concentrations 415
Supprimé: the
Supprimé: with large concentrations
8
were examined after log transformation of the data. All mean ratios cited in the text were computed
from means of ratios and not from the ratio of means.
3. Results 420
3.1 Physical properties
The physical properties at the sampled stations (Fig. 2), show pronounced longitudinal variation in
agreement with the thermohaline circulation features of the Mediterranean Sea (see Introduction).
The deep waters, formed by two separate internal convection cells, have distinct properties in the
Eastern basin (station ION, temperature 13.43°C, salinity 38.73) and the Western basin (the 425
remaining stations, temperature 12.91°C, salinity 38.48). The deep samples MDW were collected
within or in the upper limits of deep waters (Fig. 2). The intermediate layer samples LIW were
collected in the vicinity of the salinity maxima (Fig.2), which is used to identify the LIW core (e.g.,
Wust, 1961). Salinity maxima in the LIW core are particularly pronounced in the west due to the
presence of fresher and lighter waters of Atlantic origin above, this feature is progressively relaxed 430
eastward. LIW properties decrease from ION, the closest station from their source, to the
westernmost stations of the Algerian Basin (ST 10, FAST), concurrent with their westward spread
and progressive dilution. During the springtime expedition PEACTIME, the productive layer was
stratified with the development of a seasonal thermocline. This interface separated the warm surface
waters from the cool waters of Atlantic origin in which the DCM developed. As a consequence the 435
two sample types collected in the productive layer (SURF and DCM, Fig. 2), have similar salinity,
but different temperature. For the sake of clarity, the stations are presented according to their
longitudinal positions, from west to east in the following order: ST10, FAST, ST1, ST2, ST3, ST4,
ST5, TYR, ST6 and ION.
3.2 Biogeochemical properties 440
Nitrate and phosphate were depleted in the surface layers, with concentrations below the detection
limits of classical methods (0.01 µM, Table S1). However, using the LWCC technique which
allows to measure nanomolar variations of nutrients, DIP could be detected (Table S1) and ranged
between 4 and 17 nM at 5 m depth (Table S1). Phosphaclines were deeper than nitraclines and
deeper in the Eastern basin, particularly at ST 6 and ION. Chlorophyll standing stocks ranged from 445
18.7 to 35 mg Tchl-a m-2
at ST 6 and ST1, respectively (integrations down to 250 m, Table 1). The
depth of the DCM ranged from 49 to 83 m depth in the Western basin, exhibiting the deepest value
in the Ionian Sea (105 m depth at ION) while no obvious trend has been observed in the Tyrrhenian
Sea.
DOC ranged from 39 to 75 µM (Table S1). Highest DOC values were generally observed in the 450
surface layers and decreased by approximately 10 µM in each consecutive layer sampled. The DOC
depth variation factor ranged from x1.2 to x1.6. DON ranged from 2.5 to 10.4 µM. The DON depth
variation factor (DVF) was close to that of DOC (x1.2 to x1.8). DOP ranged from below our
detection limit to 0.09 µM. The mean value for the DOC/DON and DOC/DOP molar ratios from all
water layers were 14 ± 2 and 2112 ± 1644, respectively, with no significant change of these ratios 455
between epipelagic layers (SURF and DCM) and deeper layers (LIW and MDW) due to the
variability between stations. Deep DOP was not sampled at 3 stations. DOP estimate is subject to
large errors at depth (DIP is on average 10 times higher than DOP).
Supprimé: of ‘
Supprimé: ’460
Supprimé: (Vmall/Vm1, Kmall/Km1, DVF, Km/Vm, DOC/DOP, DOC/DON,
TAA/DON, TCHO/DOC… a
Supprimé: which is
Supprimé: other 465
Supprimé: layer
Supprimé: top
Supprimé: grey dots,
Supprimé: red dots,
Supprimé: s470
Supprimé: which is
Supprimé: ing
Supprimé: In this
Supprimé: period
Supprimé: apparition 475
Supprimé: with
Supprimé: in blue dots
Supprimé: in green dots
Supprimé: their thermohaline properties
Supprimé: in 480
Supprimé: clearly
Supprimé: iated in
Supprimé: ranked
Supprimé: with respect to these
Supprimé: variations485
Supprimé: U
Supprimé: however,
Supprimé: detected
Supprimé: to
Supprimé: Tchla 490
Mis en forme : Police :Non Italique
Supprimé: s
Supprimé: aking all the 4 water layers, t
Supprimé: layers compared to
Supprimé: layers
Supprimé: We observed a DOC/DOP 495 increase at the 2 deep layers sampled at 4
stations, a decrease at 2, and no trend at
another.
9
The mean values of TAA were similar in the SURF and DCM layers, around 210 nM (Table S1,
Fig. S1a) and then decreased in deep layers (LIW and MDW, p < 0.001). The mean DVF of TAA 500
(x3.4) was twice as high as that of DON (x1.5) and as a consequence to, TAA-N to DON ratio (Fig.
S1a) decreased significantly (p < 0.001) in the deep layers compared to the epipelagic layers (Fig
S1a). TCHO ranged from 111 to 950 nM and the contribution of TCHO-C to DOC from 1.3 to
9.7% (Fig. S1b). At 6 stations out of 10, a minimum TCHO value was obtained in the LIW (Fig.
S1b). The TCHO-C to TAA-C ratio increased significantly in the deep layers compared to the 505
epipelagic layers (p < 0.02) and exhibited particularly high ratios within the Tyrrhenian sea MDW
layer (ST5: 48, TYR: 24, ST6: 27).
3.3 Ectoenzymatic activities – kinetic trends
Examples of different types of kinetics are shown in Fig. 3. In general, the hydrolysis of LAP and
GLU did not completely saturate at 50 µM substrate concentration but started to reach the 510
asymptotic value Vm. The hydrolysis rate of AP reached a maximum around 1 µM MUF-P. In this
example, significant fits to Michaelis-Menten kinetic were obtained using all three models.
However, significant Michaelis-Menten kinetics were also obtained regardless of the upper limit in
the substrate concentration span used for the fit (Fig. S2 a, b, c). The Vm and Km characterizing
these kinetics increased with the highest concentration included in the set, reaching a plateau 515
towards the set with the largest span (more rapidly for AP, Fig. S2 c and f). In order to check for the
presence of biphasic kinetic, and the effect of choosing two extreme sets of concentrations ranges,
to determine EEA kinetic parameters we used systematically the 3 models described in section 2.4.
The set of model 1 in the lower range of substrate concentration represents a compromise between
having a sufficient set of substrate concentrations and significant enzymatic rates detected. Some 520
kinetics were discarded i) due to the detection limits at low concentration of substrates (it was the
case for all the GLU estimates in LIW and MDW layers, Table S2), ii) due to a significant
deviation from the model (in particular, when the rates did not increase between 2.5 and 50 µM
substrate concentration, leading to abnormally low values of Km50. This occurred in particular for
AP with only 25 kinetics over 40 showing significant Michaelis-Menten kinetic estimates of the 525
model based on high concentrations of substrates (see AP model 50, Table S2).
For LAP and GLU, Vmall and Vm50 were close, the distribution of these data fitted to the 1:1 axis
(Fig. 4). For LAP and AP, Vm50 were subjected to higher errors than those of their corresponding
Vmall (Fig. 4), as the percentage of standard error (se%; Table S2) of Vm50 was higher than that of
Vm1 in most cases (40/40 for LAP, 24/25 for AP). At the opposite, for GLU se% was higher only 530
in 6 out of 20 cases. The relationships between Km50 and Kmall showed the same trend, although
Km50 were generally slightly higher than their corresponding Kmall, in particular for GLU. As
noted for Vm, the se% was higher for Km50 than for Km1 in most of the cases for LAP (39/40) and
AP (25/25) and the opposite was seen for GLU (5/20). The standard errors of Km were higher than
those of their corresponding Vm (Table S2). For LAP and GLU, Vm1 was notably lower than 535
Vm50 and Vmall; Km1 was notably lower than Km50 and Kmall. For AP, the difference between Vm1
and Vm50 was not such evident, Vm1 being closer to Vm50. However, Km50 was generally still
much higher than Km1.
The biphasic mode itself explained the kinetics of the entire data set in 17 cases out of 40 for LAP,
in 18 cases out of 20 for GLU and in18 cases out of 24 for AP (Table S2). Thus, the biphasic 540
mode was enough on average to explain 60 % of the cases, with the highest proportions for GLU.
We estimated the degree of difference between the two kinetics using the ‘biphasic indicator’
Supprimé: stable between
Supprimé: .
Supprimé: At all stations TAA545
Supprimé: decreased from the 2 layers sampled in the epipelagic layers
Supprimé: compared to the 2 other
deeper layers
Supprimé: ) sampled (550
Supprimé: 2
Supprimé: 2
Supprimé: with
Supprimé: layer
Supprimé: at555
Supprimé: 2
Supprimé: 2
Supprimé: D
Supprimé: were obtained (see examples
Supprimé: )560
Supprimé: the substrate concentration
of
Supprimé: of
Supprimé: and t
Supprimé: stabilized 565
Supprimé: either the model 1, the
model 50 or the global
Supprimé: highest pair of values
(concentration, rate) included in
Supprimé: according 570
Supprimé: model
Supprimé: but tended to
Supprimé: to focus on
Supprimé: the
Supprimé: were then575
Supprimé: determined using the model 50 (Vm50, Km50), the model 1 (Km1, Vm1)
or the global model (Kmall, Vmall)
Supprimé: Our choice to use
Supprimé: corresponds to580
Supprimé: in the lowest range with
Supprimé: of detection of some rates, ...
Supprimé: were
Supprimé: ing585
Supprimé: addition of
Supprimé: was noted
Supprimé: as
Supprimé: were significant
Supprimé: Note however that the 595 ...
Supprimé: (Fig. 4, Table S2)
Mis en forme : Indice
Mis en forme : Indice
Supprimé: and in
Supprimé: greatest
10
developed in Tholosan et al. (1999). This index tracks the difference between the initial slopes
(Vm/Km) of Michaelis-Menten kinetics as (Vm1/Km1) / (Vm50/Km50). The biphasic indicator was
particularly marked for GLU (means of 87 in SURF and 47 in DCM layers), but it was highly
variable (Table S2). For LAP the mean index increased from ~9 in SURF and DCM layers to ~16 600
within LIW and MDW layers however due to the varability of the indicator (Table S2) this increase
was insignificant. For AP the biphasic indicator remained constant (p > 0.05) between epipelagic
layers (means 12 in SURF and 6 in the DCM) and deeper layers sampled (mean of 5 in LIW and 9
in the MDW, respectively, with overall lower variability than for the 2 other enzymes, Table S2).
As the constants Km and Vm provided by the global model were very close to those of model 50; as 605
the standard errors were mostly higher for model 50; and as the biphasic mode was not observed in
all samples, we present here the kinetic parameters for the global model and model 1 (Figs. 5, 6, 7
and Table 2). Moreover, the lowest concentration range is closer to natural substrate concentrations.
For each enzyme (LAP, GLU, AP) and the 2 models (model 1, global model), Vm was in the same
order of magnitude at the SURF and DCM layers (Figs 5, 6, 7). In all layers, the highest mean Vm 610
was obtained for AP, followed by LAP and then GLU, independent of the model used (Table 2).
For LAP (Fig. 5), Vmall was on average 3 times higher than Vm1 in both SURF and DCM layers,
but the differences between these two rates increased with depth (x8 in LIW, x12 in MDW layers).
Vmall decreased from epipelagic to mesopelagic layers by a factor of x8 on average, while Vm1
decreased by a factor x19 (Fig. 5a). However, the decrease was more prominent at stations ST10 to 615
ST5 in the Western Basin, while in Tyrrhenian waters (ST5, TYR and ST6) Vmall did not show
such a marked decrease with depth. The average Kmall/Km1 ratio for LAP was 132. Kmall of LAP
showed variable patterns with depth. Within the LIW and MDW layers, Kmall were in the same
order of magnitude as in the surface, sometimes even higher (FAST, ST 3, ST5, ST6, ION)
particularly in Tyrrhenian and Ionian seas (Fig. 5b). Km1 decreased with depth in the Western 620
stations (ST10 to ST3) whereas for stations 4, 6 and ION Km1 was in the same order of magnitude
at all depths.
For the LIW and MDW layers GLU kinetic could not be assesses since increase of fluorescence
versus time was found only for the higher substrate concentrations used. The means of GLU rates
measurable at depth were 0.010 ± 0.006 nmol L-1
h-1
in the LIW layer and 0.008 ± 0.006 nmol L-1
h-
625 1
in the MDW layer (Fig. 6, Table 2). In the epipelagic layers (Fig. 6), Vmall was on average 7 and 5
times higher than Vm1 in SURF and DCM layers, respectively. The ratio Vmall/Vm1 was greater
than those observed at the same layers for LAP or AP (Fig. 6a). The average Kmall/ Km1 ratio for
GLU was 311. While Kmall was in the same order of magnitude or slightly lower in the DCM
compared to the SURF layers, the opposite trend was observed for Km1 which tended to be higher 630
within the DCM layer (Fig. 6b). Among the 3 ectoenzymes, GLU showed the lowest longitudinal
variability within surface layers (the longitudinal coefficient of variation (CV) was 34% for Vmall,
45% for Vm1).
AP was the enzyme for which Vm1 and Vmall were the closest (average of Vmall /Vm1 ratio for the
whole data set was 1.9 ± 1.2) (Fig. 4c, 7a) Fits to model 50, using 2.5 to 50 µM concentration sets 635
were often not significant (Table S2), because the rates stayed constant when adding these
concentrations. AP within SURF layer showed pronounced relative longitudinal variability, with
longitudinal CV close to 100% for Vmall and Vm1 (Table 2). Within the SURF layers AP increased
towards the east, from a range of 0.5-0.9 nmol L-1
h-1
for Vmall at ST10 and FAST up to 8 nmol L-1
Supprimé: 68 …7 in SURF and 29 …7 740 ...
Supprimé: the
Supprimé: ,…and ...
Supprimé: s
Supprimé: systematically
Supprimé: using the…or model 50; 745 ...
Supprimé: .
Supprimé: This will allow do discuss then the biases introduced by choosing a
low (0.025-1 µM) set of concentration
compared to a set reaching much higher 750 concentration (here up to 50 µM) generally used by scientists making
enzymatic kinetics (see the first part of the
discussion)
Supprimé: each …he 2 models (model 755 ...
Supprimé:
Supprimé: the order of magnitude
reached for
Supprimé: 4,
Supprimé: of the 10 studied stations 760 ...
Supprimé: DVF…of x8 on average, ...
Supprimé: computation of GLU ...
Supprimé: , confirming that saturation rates occurred with 1 µM MUF-P addition
(…Figs. 3, S2) …and explained why f…ts 765 ...
Supprimé: a larger range ...
11
h-1
at ION. Both AP Vm1 and Vmall decreased with depth (Fig. 7a), although both AP Vmall and AP
Vm1 could be higher within the DCM layer than in the SURF layer (ST1, 2, 5 TYR, ION). At all
stations Vm in the MDW were equal or lower to those in the LIW. DVF was large, varying from
x1.8 to x71 for Vmall, with lower values at ST10 (x1.8) FAST (x3.2) and ST3 (x 2.4), and highest 770
DVF at ST1 (x34), ST2 (x71) and ION (x54). AP Kmall was on average 6 times higher than Km1.
Kmall increased more with depth (DVF > 0 at 8 stations and ranging from x1.4 to x19) than Km1
(DVF > 0 at 9 stations and ranging x1.9 to x3.8, see ST1 and ST5). However, these differences
between AP Km1 and AP Kmall were still the lowest compared to the two other enzymes.
The turnover time of ectoenzymes (Km/Vm ratio) drives the activity at low concentrations of 775
substrates. The incidence of the tested set of substrate concentration is very important on this
parameter, as turnover times are systematically lower for the 0.025-1 µM concentration set (Table
3). The turnover times were the shortest for AP and the longest for GLU.
3.4 Specific activities
Bulk heterotrophic prokaryotic production (BP) was of the same order of magnitude within SURF 780
and DCM layers (Fig. S3, Table 2) and decreased towards deeper layers (DVF 59 ± 23). BA varied
less than ectoenzyme Vm or BP longitudinally. Further, the decrease of BA with depth was less
pronounced (DVF 7 ± 2) than BP. Cell specific BP (cs-BP) ranged from 1 to 136 x 10-18
g C cell-1
h-
1 (Table 4), decreasing with depth at all stations (DVF ranged from x4 to x23). For enzymes and BP
(Fig. 8, Fig. 9, Table 2), the trend of specific activities was highly variable, with the highest DVF 785
(decrease with depth) observed for cs-BP or cs-AP.
For LAP, specific activities ranged from 0.1 - 2.1 x 10⁻¹⁸
to 0.7 - 8 x 10-18
mol leu cell-1
h-1
, based on
Vm1 and Vmall rates, respectively (Fig. 8 a, b; Table 4 for Vm1). A significant decrease with depth
from epipelagic waters to deep waters was only found for cs-Vm1 LAP, but not for cs-Vmall LAP (p
< 0.001, Fig 9a). While cell specific LAP Vm1 decreased with depth, the LAP Vm1 per unit BP 790
increased with depth at all stations (Table 4, Fig. 9a).
For AP, specific activities ranged from 0.11 to 32 x 10-18
mol P cell-1
h-1
and from 0.14 to 39 x 10-18
mol P cell-1
h-1
based on Vm1 and Vmall rates, respectively, not differing significantly due to the
small differences between AP Vm1 and AP Vmall (Fig. 8 c, d). Cs-AP exhibited either an increase
(DVF < 1) or a decrease (DVF >1) with depth (Fig. 9b). AP Vm1 per unit BP decreased with depth 795
at all stations except at ION, whereas AP Vm1 per unit cell increased in 7 cases over 10.
3.5 In situ hydrolysis rates
The in situ hydrolysis rates of TAA by LAP were higher; about ~3 times in epipelagic and about ~7
times in deep waters with the model 1 constants as compared to the global model (Fig. 10). Kmall
were much higher than TAA concentrations (26 to 300-fold depending on the layers, Table 2, Table 800
S1). This difference was also the case for Km1, but the ratio between Km1 and TAA differed by
factor of 2 to 3 depending on depth layer. Consequently, in situ TAA hydrolysis rates by LAP based
on global model represented a small percentage of Vmall (highest means of 11 % in the DCM and
minimum mean value 0.6 % in the MDW). However, in situ rates based on model 1 represented a
higher proportion of Vm1 (means 30 to 39 % depending on the layer). 805
The in situ hydrolysis rates of TCHO by GLU were higher by ~2.5 fold using model 1 than using
global model, in epipelagic layers (Fig. 11). Kmall were higher than in situ TCHO concentrations
(Table 2, Table S1), by a factor ~ 18 within SURF and 22 within the DCM. Consequently, in situ
Supprimé: sometimes …oth AP Vmall ...
Commentaire [F1]: an you please explain were this this concept comes from (reference?). I understand the term turnover number (but to estimate it you also need to know the enzyme concentration). RESPONSE : See our response in comments to the editor
Supprimé: was determined as the ...
Supprimé: Both BP and BA were used to compute specific activities (Table 2,
Fig S3). …ulk heterotrophic prokaryotic 890 ...
Supprimé: S
Supprimé: exhibiting a ...
Supprimé: per cell…or cs-AP per cell ...
Supprimé: per bacterial cell
Supprimé: obtained 895
Supprimé: cell-specific…s- …m1 LAP, ...
Supprimé: per cell-…pecific activities ...
Supprimé: using Vm1 and Km1
constants than using Kmall and Vmall
Supprimé: ,900
Supprimé: means ranged …6 to 300- ...
Supprimé: k
Supprimé: maximal means per layer
were…ighest means of 11 % in the DCM ...
Supprimé: n905
Supprimé: relatively …igher proportion ...
Supprimé: Vm1 and Km1 ...
Mis en forme : Police :Italique
Supprimé: about …y a factor ~ 18 ...
12
GLU hydrolysis rates based on global model were quasi proportional to the turnover rate
Vm1/Km1and represented a mean of 7% of the Vmall in epipelagic layers. Km1 were much lower 910
than in situ TCHO concentrations (by about ~ 31 times in SURF, 8 times at the DCM) and thus
most in situ rates based on model 1 were close to Vm1 (93% in SURF, 79% at the DCM).
4. Discussion
4.1 The use of a broader set of substrate concentrations changes our interpretation of 915
ectoenzymes kinetics
The idea that ectoenzyme kinetics are not monophasic is neither new nor surprising (Sinsabaugh
and Follstad Shah, 2012 and references therein). However, despite the ‘sea of gradients’
encountered by marine bacteria (Stocker, 2012), multiphasic kinetics are seldom considered. In this
work, we attempt to compare different concentration sets of fluorogenic substrates in order to 920
evaluate the consequences on the estimated kinetic parameters in relation to the in situ natural
concentrations of the substrates. In the coastal, epipelagic waters of the Mediterranean Sea, Unanue
et al. (1999) used a set of concentrations ranging from 1 nM to 500 µM to reveal biphasic kinetics
with a switch between the two phases at around 10 µM for LAP and 1-25 µM for GLU. They
referred to ‘low affinity’ enzymes' and ‘high affinity’ enzymes. In the Toulon Bay (NW 925
Mediterranean Sea), Bogé et al. (2012) used a MUF-P range from 0.03 to 30 µM and described
biphasic AP kinetics, with a switch between the 2 enzymatic systems around 0.4 µM. In our study,
the biphastic indicator (Km50/Vm50) / (Km1/Vm1) was used to determine the degree of difference
between the two Michaelis-Menten LAP kinetics. The differences between the two LAP enzymatic
systems in the water column increased with depth and could be as large as that found in sediment 930
(biphasic indicator 20, Tholosan et al., 1999), in which large gradients of organic matter
concentrations are found. However, this was not the case for all enzymes: for AP, the differences
were small and consistent with depth gradients. The differences between the high and low affinity
enzyme was greater for GLU.
By comparing model 1, model 50 and the global model, and from the analysis presented in Fig S2, 935
it is clear that the choice of the highest concentration used in the Michaelis-Menten kinetic is
crucial. We decided thus not to focus our discussion on the presence or not of biphasic kinetics.
Rather, we compared the effects of choosing a set of concentrations ranges sufficiently low to
obtain measurable rates but at the same time encompassing the natural range of substrates (model 1
representing the high affinity system). We discuss the enzymatic properties obtained with the global 940
model, which refers better the concentration generally used in the literature but also reflected a low
affinity system compared to model 1.
Enzymatic kinetic parameters are also relevant for the interpretation of the hydrolysis of the
substrate in terms of quality and quantity. For instance, the LAP Kmall is much higher than GLU
Kmall probably because LAP is not selected for low concentration ranges, in contrast to GLU 945
(Christian and Karl, 1995) and AP. It is also possible, however, that when the fluorogenic substrates
are in the same concentration range as the natural substrates, this leads to a competition for the
active sites. We can surmise that Km1 values, although lower than published values, are still
potentially overestimated. Another difference in the response to the tested range of concentrations
for each substrate is the Km/Vm ratio: lower ratio indicates the adaptation to hydrolyze substrates at 950
low concentrations. This should be considered carefully when comparing reported values.
Supprimé: Kmall and Vmall
Supprimé: At the opposite,
Supprimé: Km1 and Vm1
Supprimé: ly955
Supprimé: and this indicator increased with depth
Supprimé: observed
Supprimé: reach a difference
Supprimé: about 960
Supprimé: relatively
Supprimé: Finally, t
Supprimé: to
Supprimé: , setting the higher concentration to 50 µM965
Supprimé: reflects
Supprimé: and
Supprimé: . In addition the comparison
between kinetic parameters from model 1
and model 50 shows that it970
Supprimé: Ratios of e
Supprimé: information
Supprimé: largely
Supprimé: adapted
Supprimé: to face975
Supprimé: have
Supprimé: used by the enzyme of
interest
Supprimé: thus assumed
Supprimé: ,980
Supprimé: was
Supprimé: turnover time (
Supprimé: )
Supprimé: the
Supprimé: the Km/Vm, the better 985
13
We have shown that the differences between the Km and Vm of the low and high affinity enzymes
might change with the nature of the enzyme, with depth, and regionally. We will develop the
different interpretation emerging from i) the increase/decrease with depth ii) the use of enzymatic
ratio as indicators of nutrient availability or DOM quality and iii) the estimates of in situ hydrolysis
rates and their contribution to heterotrophic bacterial carbon or nitrogen demand. 990
4.2 How the set of concentration used affects ectoenzymatic kinetic trends with depth: possible
links with access to particles
As shown by this study, depending on the range of concentrations tested, different conclusions can
be drawn regarding increase or at least maintenance of specific levels of activity within deep layers
(Koike and Nagata, 1997; Hoppe and Ulrich, 1999; Baltar et al., 2009b). Many factors, such as the 995
freshness of the suspended particles, particle fluxes, a recent convection event, lateral advection, as
well as the seasonality and taxonomic composition of phytoplankton could influence dynamics at
depth, particularly in the mesopelagic layers (Tamburini et al. 2002; 2009; Azzaro et al., 2012;
Caruso et al 2013; Severin et al. 2016).
AP was the enzyme that showed the smallest contrasts between different kinetics. In this study, the 1000
use of MUF-P concentrations ranging between 0.025 and 50 µM highlighted that AP rates are well
described with the Michaelis-Menten Kinetic model 1, with saturation reached around 1 µM. We
thus assumed that this AP activity should belong to free-living bacteria and/or dissolved enzymes (<
0.2 µm fraction) adapted to low substrate concentrations. These results agree with DOP
concentrations measured, ranging between 12 and 122 nM in epipelagic waters (Pulido-Villena et 1005
al., this issue, in prep) and, when detectable, between 20 and 51 nM in deep layers. Using
fractionation-filtration procedures, it has been shown that more than 50 % of the AP activity could
be measured in the < 0.2 µm size fraction (Baltar, 2018 and references therein), whereas the
dissolved fraction of other enzymes is generally lower. Hoppe and Ulrich (1999) found a
contribution by the < 0.2 µm fraction of 41% for AP, 22 % for LAP and only 10 % for GLU. 1010
During the PEACETIME cruise we ran a few size fractionation experiments in SURF and DCM
samples (results not shown). The contribution of the < 0.2 µm fraction to the bulk activity was on
average 60 ± 34 % (n = 12) for AP, 25 ± 16 % (n = 12) for GLU and 41 ± 16 % (n = 12) for LAP,
confirming these trends in the Mediterranean Sea.
Increasing AP activities per cell with depth has been reported in the Indian Ocean (down to 3000 m-1015
depth; Hoppe and Ullrich,1999), in the subtropical Atlantic Ocean (down to 4500 m-depth; Baltar et
al., 2009b) and in the central Pacific Ocean (down to 4000 m-depth; Koike and Nagata,1997).
These authors used high concentrations of MUF-P (150 to 1200 µM) that could stimulate
ectoenzymes of cells attached on suspended or sinking particles, and thus adapted to higher
concentration ranges. However, these trends were also obtained using low concentrations (max 5 1020
µM MUF-P), at depths down to 3500 m in the Tyrrhenian Sea (Tamburini et al., 2009). In the
bathypelagic layers of the central Pacific, AP rates were up to half those observed in the epipelagic
layer but the fraction < 0.2 µm was not included in the AP measurements (Koike and Nagata,
1997). These authors suggested that the deep-sea AP activity is related to fragmentation and
dissolution of rapidly sinking particles. Indeed, it has been shown that the ratios of AP activity 1025
determined on particles to the AP activities in bulk seawater were highest among different tested
enzymes (Smith et al., 1992). Note, however, that our study sampled only the top of mesopelagic
layers (1000 m). Tamburini et al. (2002) obtained a different relative contribution of deep-sea
samples when using MUF-P concentrations of 25 nM or 5 µM at the DYFAMED station in the NW
Supprimé: We have shown that1030
Supprimé: the debate on
Supprimé: ing
Supprimé: from the margins
Supprimé: both
Supprimé: fit1035
Supprimé: t
Supprimé: with affinities
Supprimé: average
Commentaire [F2]: I am surprised by
this statement: The DOP values shown in Table S1 are similar everywhere and in all layers and around 50-40nM Response : these are ranges, not means
Supprimé: ~ 40
Supprimé: 1040
Supprimé: of
Supprimé: some
Supprimé: layers
Supprimé: ;
Supprimé: 250 µM, concentration 1045 kinetics from 0.6 to 1200 µM and 150
µM, respectively
Supprimé: face
Supprimé: accounted for as much
Supprimé: as1050
Supprimé: of
Supprimé: dissolved AP
Supprimé: due
Supprimé: concentrated
Supprimé: had the highest 1055 concentration factor compared
Supprimé: of
Supprimé: data generally
Supprimé: stops
Supprimé: in1060
14
Mediterranean Sea (down to 2000 m-depth), further showing the artefact of the concentration used.
The deep enzymatic activities could be x1.4 to x2.6 times higher due to the effect of hydrostatic
pressure. Specific AP decreased at 5 stations, increased in 3 other stations and at the 2 remaining
stations specific Vmall, increased while specific Vm1decreased (Fig. 9b). Similarly for the deepest
layers sampled (FAST: 2500 m and ION: 3000 m), results showed also no depth trend since specific 1065
AP decreased with depth at ION and increased at FAST. The POC/POP ratio did not change with
depth. However, the variability in the trend with depth seen for the specific AP activities was also
observed in the DOC/DOP ratio. In short, while we expected to see an increase in specific activities
with depth due to a preferential removal of P, this was not systematically the case.
LAP activities showed more pronounced trends with depth than AP. Cell-specific LAP showed 1070
contradictory results: at all stations cell-specific Vm1 decreases with depth (according to the DVF
criterion, Fig. 9a) whereas Vmall remained stable (2 stations over 10) or increased with depth (5
stations over 10). Using a high concentration of MCA-leu other authors have found an increase in
LAP activity per cell with depth in bathypelagic layers (Zaccone et al., 2012; Caruso et al., 2013).
The use of a large concentration set also impacts the Km values, because if only a high 1075
concentration range is used, the kinetic contribution of any enzyme with high affinity would be
hidden. Baltar et al. (2009b), using a concentration of substrates ranging from 0.6 to 1200 µM,
reported an increase in the Km of LAP (from ~400 to 1200 µM) and AP (from ~2 to 23 µM) with
depths down to 4500 m in the sub-tropical Atlantic. In contrast, Tamburini et al. (2002), using a
concentration of substrates ranging from 0.05 to 50 µM, obtained lower Km values (ranging 1080
between 0.4 and 1.1 µM) for LAP in the Mediterranean deep waters (down to 2000 m depth). It is
however difficult to come to a conclusion about the effect of the concentration set tested on Km
variability with depth by comparing 2 studies from different environments and using different sets
of substrate concentrations. In our study where both kinetics were determined in the same waters,
among the two parameters Vm and Km, Km showed the largest differences between the 2 types of 1085
kinetics. At many stations (TYR, ION, FAST and ST10), the Km1 of LAP was stable or decreased
with depth whereas Kmall increased, suggesting that within deep layers LAP activity was linked
more to the availability of suspended particles or fresh organic matter from sinking material, than to
DON. Thus, the difference between Km1 and Kmall might reflect adaptative strategies to spatial and/
or temporal patchiness in the distribution of suspended particles. Freshly sinking material was 1090
probably not present in our incubations, because of the small volume of water used, but could have
contributed to the release of free bacteria, small suspended particles and DOM within its associated
plume (Azam and Long, 2001; Tamburini et al., 2003; Grossart et al., 2007; Fang et al., 2014).
Baltar et al. (2009a) also suggested that hot spots of activity at depth were associated with particles.
The fact that the C/N ratio of particulate material increased with depth (from 11-12 to 22-25) but 1095
not so much for DOC/DON (from 13-12 to 14-15 from SURF and DCM to LIW and MDW,
respectively) also indicates a preferential utilization of protein substrates from particles. Recently,
Zhao et al. (2020) suggested that deep-sea prokaryotes and their metabolism are likely associated
with particles rather than DOC, based on the increasing contribution of genes encoding secretory
enzymes. In contrast to the results for AP, the higher differences between the two LAP enzymatic 1100
systems, suggest that the microorganisms responsible for the LAP activity face large gradients of
protein concentrations and are adapted to pulsed inputs of particles.
4.3 How the set of concentrations used affects interpretation of enzymatic properties as
indicators of nutrient imbalance of DOM quality and stoichiometry.
Supprimé: Furthermore, t1105
Supprimé: when not in the convective ...
Supprimé: Vm increased based on 1110
Supprimé: but
Supprimé: based on Vm1
Supprimé: Note that
Supprimé: are also
Supprimé: contrasting 1115
Supprimé: decreases
Supprimé: but
Supprimé: increases
Supprimé: particulate matter
Supprimé: 1120
Supprimé: with
Supprimé: We
Supprimé: however, it
Supprimé: enzymatic systems
Supprimé: differences 1125
Supprimé: and different trends with 1170 ...
Supprimé: , Vmall decreased with depth ...
Supprimé: systematically 1130
Supprimé: P Km
Supprimé: Km
Supprimé: Kmall in particular, increased ...
Supprimé: LAP
Supprimé: LAP 1140
Supprimé: it is LAP
Supprimé: which
Supprimé: greatest
Supprimé: LAP
Supprimé: LAP 1145
Supprimé: associated to
Supprimé: y to
Supprimé: adapt
Supprimé: a potential
Supprimé: is 1150
Supprimé: statistically not included in ...
Supprimé: incubated
Supprimé: that
Supprimé: confirms 1155
Supprimé: on the utilization of ...
Supprimé: the
Supprimé: Conversely to
Supprimé: results1160
Supprimé: 2
Supprimé: expressing
Supprimé: d
Supprimé: were
Supprimé: ¶1165
15
In epipelagic waters, both AP maximum rates (Vm1, Vmall) significantly increased by around 3 fold
from the Algerian/Ligurian Basins to the Tyrrhenian Basin (t test, p = 0.002 and p = 0.02,
respectively) and reached maximum values at ION. This longitudinal increase was also confirmed
by specific activities. This increase in cell-specific AP activities appears to follow a decrease in 1175
phosphate availability. While inorganic phosphate can be assimilated directly through a high
affinity absorption pathway, the assimilation of DOP requires its mineralization to free DIP which
is then assimilated. POP is an indicator of living biomass and enzyme producers, but the correlation
between VmAP and POP were negative in the surface layers (log-log relationship, r = - 0.86, -0.88
for Vmall and Vm1, respectively, p < 0.01 in both cases), suggesting the progressive eastward 1180
decline of living biomass and its and phosphate availability was accompanied by increased AP
expression. Vm in the surface did not correlate with DIP, however the relative DIP deficiency
increased eastward, suggested by the deepening of the phosphacline (Table 1), the decrease in
average DIP concentrations within the phosphate-depleted layer and the decrease in P diffusive
fluxes reaching the surface layer (Pulido-Villena et al. 2020, in prep, this issue). Along a trans-1185
Mediterranean transect, Zaccone et al. (2012), did not observe a relation between DIP and AP,
although they also found increased values of AP specific activities in the Eastern Mediterranean
Sea. Bogé et al. (2012), using a concentration set close to ours (0.03-30 µM MUF-P) obtained
biphasic kinetics with high differences in the two Vm values (contrary to our results) and described
different relationships between Vm and DOP or DIP depending on the low or high affinity enzyme. 1190
Such differences could be due to the large gradient of trophic conditions in their study, carried out
in an eutrophic bay where DOP and DIP concentration ranged from 0 to 185 nM, and from 0 to 329
nM, respectively. In contrast, the range of DIP concentrations in our surface water samples was
narrow and values were very low (4 - 17 nM).
The AP/LAP activity ratio can be used as an indicator of N - P imbalance as demonstrated in 1195
enrichment experiments (Sala et al., 2001). In this study using high concentrations of substrates
(200 µM) the authors described a decrease in the AP/LAP activity ratio following DIP addition and,
conversely, a large increase (10-fold) after the addition of 1 µM nitrate. In their initial experimental
conditions, the ratios ranged from 0.2 to 1.9. We observed a similar low ratio in the western
Mediterranean Sea, but in the Ionian Sea the AP/LAP activity ratio reached 17 (Vmall) and 43 1200
(Vm1,, Fig. S4a), suggesting that nutrient stresses and imbalances can be as important and variable
in different regions of the Mediterranean. Such imbalances are more visible in the high affinity
systems.
LAP/GLU activity ratio is used as an index of the ability of marine bacteria to preferentially
metabolize proteins rather than polysaccharides. Within epipelagic layers, the prevalence of LAP 1205
over GLU is common in temperate areas (Christian and Karl, 1995; Rath et al., 1993) and in high
latitudes (Misic et al., 2002, Piontek et al., 2014). The LAP/GLU activity ratio varied widely from
the Equator to the Southern Ocean, ranging from 0.28 to 593 (Sinsabaugh and Follstad Shah, 2012).
In the Ross Sea, this ratio exhibited a relationship with primary production (Misic et al., 2002). In
the Caribbean Sea, along an eutrophic to oligotrophic gradient, the LAP/GLU activity ratio 1210
increased in oligotrophic conditions (Rath et al.,, 1993). In the epipelagic zone, during our study, a
small westward gradient in productivity (18 to 35 mg TChla m-2
) was found., LAP /GLU activity
ratios ranged from east to west between 3 and 17 for Vmall, and from 8 to 34 for Vm1 (Fig. S4b) and
thus varied according to the productivity gradient but also to the concentration set tested, in
agreement with previous reported ratios (10 and 20 for the low concentration and high 1215
concentration range, respectively; Unanue et al., 1999). Finally, the LAP/GLU activity ratios
Supprimé: in AP activity
Supprimé: calculating
Supprimé: which also increased
towards ION1220
Supprimé: of
Supprimé: DIP
Supprimé: DIP
Supprimé: AP
Supprimé: that POP reflected 1225
Supprimé: increased capacity to
derepress AP genes.
Supprimé: AP rates
Supprimé: trend
Supprimé: also 1230
Supprimé: for the 2 types of kinetics
Supprimé: with
Supprimé: and
Supprimé: according to
Supprimé: and 1235
Supprimé: s
Supprimé: which studied
Supprimé: order to circumvent the
effect of depth, correlations are described
in our study only for 10 surface data 1240 where the DIP concentration range is
narrow
Supprimé: )
Supprimé: Sea, as observed after
manipulation of nutrients. We have shown 1245 that s
Supprimé: when using a low range of
concentrations
Supprimé: a recurrent observation
Supprimé: For example,1250
Supprimé: with values
Supprimé: -
Supprimé: toward
Supprimé: y
Supprimé: and Herndl1255
Supprimé: the degree of trophic
conditions exhibited
Supprimé: of
Supprimé:
Supprimé: along the Western to the 1260 Eastern Mediterranean Sea. Following this
gradient
Supprimé: to
Supprimé: range
16
reported here and other studies using low substrate ranges are lower than when using higher 1265
concentration sets: 20-200 in the subarctic Pacific (Fukuda et al., 2000, using 200 µM
concentration), 213 at station ALOHA in the equatorial Pacific (Christian and Karl, 1995, using L-
leucyl-naphtylamine instead of MCA-leu at 1000 µM and MUF-GLU at 1.6 µM), suggesting
that the LAP/GLU activity ratio is highly variable and with a non linear dependence on the
fluorogenic substrate concentration. As observed for AP/LAP, the LAP/GLU activity ratio showed 1270
much higher variations for the low affinity enzyme.
Throughout the water column, variations in the relative activity of different enzymes is also
suggested as a possible indicator of changes in bacterioplankton nutrition patterns. The LAP/GLU
activity ratio decreased with depth, following the decrease in the protein to carbohydrate ratio of
particulate material (Misic et al., 2002), as nitrogen is re-mineralized faster than carbon. However, 1275
the TAA-C/TCHO-C ratios were consistently higher within the DCM layer (~90 m) than at the
surface and the LAP/GLU activity ratio of both Vm1 and Vmall increased as a consequence,
revealing important DON cycling (relative to DOC) at the DCM in comparison to the mixed layers.
Below the DCM, the particulate C/N ratio increased with depth and TAA-C /TCHO-C decreased,
likewise indicating a faster hydrolysis of N rich compounds. We estimated Vmall LAP/Vmall GLU 1280
activity ratios from a few of the single rates measured at high concentration (most GLU kinetics at
depth were not available), and observed, in contrast to Misic et al. (2002), an increase of the ratio
within deep layers, as GLU decreased faster than LAP with depth. A bias could be due to the
absence of GLU kinetics at depth, nevertheless other authors have also shown an increase of
LAP/GLU activity ratios with depth (Hoppe and Ullrich, 1999 in Indian Ocean, Placenti et al., 1285
2018 in the Ionian Sea).
4.4 How the set of concentration used affects potential contribution of macromolecules
hydrolysis to bacterial production
Our results clearly showed the influence of the concentration set used to estimate in situ hydrolysis
rates... If the experimentally added substrate concentration is clearly above the possible range of 1290
concentrations found in the natural environment in situ rates could be largely overestimated. To
obtain a significant determination of the in situ rates, the added substrate concentrations should be
close to the range of variation expected in the studied environment (Tamburini et al., 2002).
We compared the in situ LAP hydrolysis rates to the N demand of heterotrophic prokaryotes (which
was based on BP data assuming no active excretion of nitrogen and a C/N ratio of 5). Similarly, the 1295
in situ rates of TAA plus TCHO were compared to the bacterial carbon demand (based on a
bacterial growth efficiency of 10% (Gazeau et al. 2021, Céa et al., 2014, Lemée et al., 2002). Using
the global model, in situ hydrolysis of TAA by LAP contributed only 25% ± 22% of the bacterial N
demand in epipelagic layers and 26% ± 24% in deep layers. This contribution increased using the
high affinity enzyme constants (48% ± 29% and 180% ± 154 % in epipelagic layers and deep layers, 1300
respectively). In the North Atlantic, the contribution of LAP hydrolysis rates of particles (0.3 µM
MCA-leucine added) to bacterial nitrogen demand varied between 63 and 87%, increasing at 200 m.
Crottereau and Delmas (1998) computed also in situ hydrolysis using combined amino-acid
concentrations and LAP kinetics and found a range of 6-121% contribution to bacterial N demand
in aquatic eutrophic ponds. A large variability of LAP hydrolysis contribution to bacterial N 1305
demand has also been detected in coastal-estuarine environments using a radiolabeled natural
protein as a substrate (2 - 44%, Keil and Kirchman, 1993). Piontek et al. (2014) used the turnover of
Supprimé: in this study
Supprimé: work
Supprimé: still 1310
Supprimé: s
Supprimé: 1995
Supprimé: ratio
Supprimé: according to
Supprimé: and not in a regular way1315
Supprimé: the
Supprimé: ratio
Supprimé: exacerbated
Supprimé: o
Supprimé: when using1320
Supprimé: over the high affinity
enzyme
Supprimé: being
Supprimé: here
Supprimé: was 1325
Supprimé: what occurred in
Supprimé: layer
Supprimé: supporting
Supprimé: organic sources than C
organic sources1330
Supprimé: compute
Supprimé: TAA concentrations were lower than Km1 and Kmall
Supprimé: The two Michaelis–Menten plots cross each other, at a substrate value
of about 1.8 ± 1.3 µM for LAP and 1.7 ± 1370 0.6 µM for GLU. Considering the TAA
range, and the high affinity enzyme (Km1
Vm1) with its low Km and high turnover rates, in situ rates are consequently higher
using the high affinity enzyme kinetics. 1375 Although TCHO ranges were lower than
Km1 but higher than Kmall, TCHO was
always lower than the crossing concentration point of the two types of
kinetics, and consequently, again, the use 1380 ...
Supprimé: bacterial production
Supprimé: biomass
Supprimé: , with no active excretion of ...
Supprimé: , and1355
Supprimé: ,
Supprimé: this issue, in prep
Commentaire [F3]: again clumsy and ...
Supprimé: low affinity enzyme ...
Supprimé: )1360
Mis en forme : Police :Italique
Supprimé: to
Supprimé: combined
Supprimé: kinetics of
Mis en forme : Police :Italique
Supprimé: LAP with
Supprimé: Pointek 1365
17
GLU and LAP determined with 1 µM analog substrate concentrations to compute in situ TCAA
and TCHO hydrolysis rates along a 79°N transect in the North Atlantic and showed that 134% and
52% of BP could be supported by peptide and polysaccharides hydrolyzed by enzyme activities,
respectively. Based on a bacterial growth efficiency of 10%, these fluxes will represent 10 times
less, i.e. 13 and 5 % of bacterial carbon demand, which is in the order of magnitude that we 1385
obtained. In our study, the contribution of TAA hydrolysis to bacterial N demand was higher in the
DCM than in the SURF (10 to 40% based on the high affinity enzyme). Nevertheless, this
calculation may be biased as marine cyanobacteria such as Synechococcus and Prochlorococcus,
which are dominating phytoplankton groups in the Mediterranean Sea (Siokou-Frangou et al.,
2010), can also express LAP (Martinez and Azam, 1993) to satisfy their N requirements. During our 1390
study, primary production (PP) peaked in the DCM (Marañón et al., 2020). Size fractionation of
primary production showed the importance of phytoplankton excretion, which contributed between
20 to 55% of the total PP depending on stations (Marañón et al, 2020). Within the surface mixed
layer, other sources of N such as atmospheric deposition could sustain a significant part of bacterial
N demand. The dry atmospheric deposition (inorganic+ organic) of N at all stations within the 1395
PEACETIME cruise corresponded to 25 ± 17% of bacterial N demand (Van Wambeke et al, 2020).
The in situ cumulated hydrolysis rates of TCHO by GLU, estimated only in epipelagic layers were
~3 times higher using the high affinity enzyme. We summed C sources coming from the hydrolysis
by LAP and by GLU in epipelagic layers (Fig. 11) and compared them to the bacterial carbon
demand. Dissolved proteins and combined carbohydrates contributed to only a small fraction of the 1400
bacterial carbon demand: 1.5% based on the low affinity enzyme and 3 % based on the high affinity
enzyme.
Only within deeper layers the hydrolysis rates of TAA at some stations were higher than bacterial N
demand, suggesting that proteolysis is one of the major sources of N for heterotrophic bacteria in
aphotic layers. However, this was only based on the high affinity enzymes where we found cases of 1405
over-hydrolysis of organic nitrogen (Fig. 10). This over-hydrolysis was particularly marked in the
LIW of the Tyrrhenian Basin, where over-hydrolysis up to 220% was obtained as well as higher
TAA concentrations in comparison to ‘older’ LIW waters in the Algerian Basin. TAA decreased
faster than DON along the LIW trajectory, indicating that the labile DON fraction (combined amino
acids) was degraded first. Sinking particles or large aggregates associated with attached bacteria are 1410
considered to be major providers of labile organic matter for free bacteria (Smith et al., 1992).
Within the 5 mL volume of water hydrolyzed for TAA analysis, and the 2 mL water volume used to
determine ectoenzymatic kinetics, most of this particulate detrital pool is underrepresented, and thus
the contribution of TAA hydrolysis to bacterial nitrogen demand is underestimated. However, there
is an increasing evidence of release from particles not only of monomers issued from hydrolysis, 1415
but also of ectoenzymes produced by deep-sea prokaryotes attached on particles themselves (Zhao
et al., 2020). This could explain why, in our small volumes, we still observe multiple kinetics.
Studying alkaline phosphatase activity in the Toulon Bay, Bogé et al. (2013) observed biphasic
kinetics only in the dissolved phase, which also suggests that low affinity AP originates from
enzyme secretion by prokaryotes attached to particles. Further, the study of size fractionated 1420
particulate material showed that the origin of the low affinity enzymes was mostly within the > 90
µm fraction (Bogé et al., 2017).
5 Conclusions
Commentaire [F4]: Assuming an given efficiency for C assimilation is necessary either when estimating growth rates or biomass accumulation. Here, since you discuss only C uptake the values you should look at are simply BP. RESPONSE See our response in comments to the editor
Supprimé: is increasing
Supprimé: with1425
Supprimé: compared to
Supprimé: layer
Supprimé: from means of
Supprimé: This is consistent, however, as some1430
Supprimé: and Synechococcus and
Prochlorococcus are dominant
Supprimé: phytoplankton groups in the
Mediterranean Sea (Siokou-Frangou et al.,
2010)1435
Supprimé: In
Supprimé: I
Supprimé: the DCM was an active
biomass layer where
Supprimé: the1440
Supprimé: Likewise, t
Supprimé: It is o
Supprimé: that
Supprimé: more important
Supprimé: Vm1 and Km1 kinetic 1445 parameters (i.e. the
Supprimé: )
Supprimé: water mass
Supprimé: in which
Supprimé: so 1450
Supprimé: We could consider that with
t
Supprimé: this
Supprimé: of big size or big density
(i.e. fast sinking particles) 1455
Supprimé: a
Supprimé: of bulk sea water sample not representative of big or fast sinking
particles
Supprimé: low affinity enzyme 1460
Supprimé: from
Supprimé: Afterwards
Supprimé: , this team focused their
research by
Supprimé: fractionation 1465
Supprimé: of
Supprimé: and they found
Supprimé: due
Supprimé: to
Supprimé: , i.e. big particles 1470
18
Vertical and regional variability in enzyme activities were found in the Mediterranean Sea, where
heterotrophic prokaryotes face not only carbon, but also N and P limitations. Although biased by
the use of artificial fluorogenic substrates, ectozenzymatic activity is an appropriate tool to study
the adaptation of prokaryotes to the environmental gradients in stoichiometry, chemical
characteristics and organic matter concentrations. We have shown that the relative increase or 1475
decrease of Vm or specific activities per depth are largely related to the choice of concentration set
used in the kinetic measurements. The activity ratios of AP/LAP or LAP/GLU used to track
nutrient imbalances in the DOMpool showed larger range of variation in low affinity enzymes.
Finally, to obtain robust determination of in situ enzymatic rates, the added substrate concentrations
should be close to the range of variation expected in the studied area. While the use of microplate 1480
titration technique greatly improved the simultaneous study of different enzymes, assessments of
enzyme kinetics should be performed systematically in enzymatic studies. Future combination of
such techniques with the chemical identification of DOC and DON pools, and meta-omics, as well
as the use of marine snow catchers, will help our understanding of the biodegradation of organic
matter in the ocean. 1485
Data availability
Data will be accessible once the special issue is published at the French INSU/CNRS LEFE
CYBER database: http://www.obs-vlfr.fr/proof/php/PEACETIME/peacetime.php, last access:
29 October 2020. Scientific coordinator: Hervé Claustre; data manager, webmaster:
Catherine Schmechtig. The policy of the database is detailed here: http://www.obs-1490
vlfr.fr/proof/dataconvention.php (last access: 29 October 2020).
Author contribution
FVW and CT designed the study. FVW, CT, MG and SG sampled and incubated samples for
ectoenzymatic activity on board, FVW and SG analyzed the ectoenzymatic data. FVW and MG
sampled and analyzed BP samples, BZ sampled and analyzed TAA and TCHO samples, AE 1495
managed the TCHO an TAA analysis and treatments, EP and KD sampled and analyzed DIP
analysis with the LWCC technique, SN sampled and analyzed nutrients and organic matter, VT
assisted in CTD operations and analyzed water masses, JD sampled for DOC and flow cytometry,
PC analyzed bacterial abundances, BM analyzed DOC, FVW prepared the ms with contribution
from all co-authors. 1500
Competing interests
The authors declare that they have no conflict of interest
Special issue statement
This article is part of the special issue ‘Atmospheric deposition in the low-nutrient–low-chlorophyll
(LNLC) ocean: effects on marine life today and in the future (ACP/BG inter-journal SI)’. It is not 1505
associated with a conference
Financial support
This study is a contribution of the PEACETIME project (http://peacetime-project.org), a joint
initiative of the MERMEX and ChArMEx components supported by CNRS-INSU, IFREMER,
CEA, and Météo-France as part of the programme MISTRALS coordinated by INSU (doi: 1510
Supprimé: of
Supprimé: shown
Supprimé: large
Supprimé: d quantities of
Supprimé: they face, especially when 1515 using high concentrations
Supprimé: debates about
Supprimé: s
Supprimé: s
Supprimé: of DOM quality changes 1520
Supprimé: s
Supprimé: using
Supprimé: rather than large
Supprimé: a significant
Mis en forme : Police :Non Italique
Supprimé: environment1525
Supprimé: EEAs
Supprimé: further
Supprimé: enzymatic
Supprimé: a ‘sea of gradients’
Supprimé: http://www.obs-1530 vlfr.fr/proof/php/PEACETIME/peacetime.
php
Supprimé: http://www.obs-vlfr.fr/proof/dataconvention.php
19
10.17600/17000300). The project leading to this publication has received funding from European 1535
FEDER Fund under project 1166-39417.
Acknowledgements: The authors thank also many scientists & engineers for their assistance with
sampling/analyses: J. Roa for TCHO, R. Flerus for TAA, J. Guittoneau for nutrients, T. Blasco for
POC, J. Uitz and C. Dimier for Chl a (analysed at the SAPIGH HPLC analytical service at the
IMEV, Villefranche), I. Obernosterer for DOC. We warmly thank C. Guieu and K. Deboeufs, as 1540
coordinators of the program PEACETIME. We are grateful to the two anonymous reviewers and
the editor C. Klass for their constructive and pertinent comments.
20
References 1545
Aminot, A., and Kérouel, R.: Dosage automatique des nutriments dans les eaux marines, in:
Méthodes d'analyses en milieu marin, edited by: IFREMER, 188 pp, 2007.
Aluwihare, L. I., Repeta, D. J., and Chen, R. F.: A major biopolymeric component to dissolved
organic carbon in surface sea water, Nature, 387, 166–169. doi : 10.1038/387166a0, 1997.
Arnosti, C.: Microbial Extracellular enzymes and the marine carbon cycle, Ann. Rev. Mar. Sci., 3, 1550
401-425, 2011.
Arrieta, J. M., and Herndl, G. J.: Assessing the diversity of marine bacterial -glucosidases by
capillary Electrophoresis Zymography, Appl. Environ. Microb., 67, 4896–4900, 2001.
Azam, F., and Long, R. A.:. Sea snow microcosms, Nature, 414, 495–498, 2001.
Azzaro, M., La Ferla, R., Maimone, G., Monticelli, L. S., Zaccone, R., and Civitarese, G.: 1555
Prokaryotic dynamics and heterotrophic metabolism in a deep convection site of Eastern
Mediterranean Sea (the Southern Adriatic Pit), Cont. Shelf Res., 44, 06–118, doi:
10.1016/j.csr.2011.07.011, 2012.
Baltar, F., Arístegui, J., Gasol, J. M., Sintes, E., and Herndl, G. J.: Evidence of prokaryotic
metabolism on suspended particulate organic matter in the dark waters of the subtropical 1560
North Atlantic, Limnol. Oceanogr., 54, 182–193, doi:10.4319/lo.2009.54.1.0182, 2009a.
Baltar, F., Aristegui, J., Sintes, E., van Aken, H. M., Gasol, J. M., and Herndl, G. J.: Prokaryotic
extracellular enzymatic activity in relation to biomass production and respiration in the meso-
and bathypelagic waters of the (sub)tropical Atlantic, Env. Microbiol., 11, 1998–2014, 2009b.
Baltar, F.: Watch Out for the “Living Dead”: Cell-Free Enzymes and Their Fate, Front. Microbiol., 1565
8, article 2438, doi: 10.3389/fmicb.2017.02438, 2018.
Bogé G., Lespilette, M., Jamet, D., and Jamet, J-L.: Role of sea water DIP and DOP in controlling
bulk alkaline phosphatase activity in N.W. Mediterranean Sea (Toulon, France), Mar. Pollut.
Bull., 64, 1989–1996, doi: 10.1016/j.marpolbul.2012.07.028, 2012.
Bogé, G., Lespilette, M., Jamet, D., and Jamet, J.-L.: The relationships between particulate and 1570
soluble alkaline phosphatase activities and the concentration of phosphorus dissolved in the
seawater of Toulon Bay (NW Mediterranean). Mar. Pollut. Bull., 74, 413–419, doi:
10.1016/j.marpolbul.2013.06.003, 2013.
Bogé, G., Lespilette, M., Jamet, D., and Jamet, J.-L.: Role of DOP on the alkaline phosphatase
activity of size fractionated plankton in coastal waters in the NW Mediterranean Sea (Toulon 1575
Bay, France), Mar. Pollut. Bull., 117, 264–273, doi:10.1016/j.marpolbul.2016.11.037, 2017.
Caruso, G., Monticelli, L., La Ferla, R., Maimone, G., Azzaro, M., Azzaro, F., Decembrini, F., De
Pasquale, F., Leonardi, M., Raffa, F., Zappal, G., and De Domenico, E.: Patterns of
Prokaryotic Activities and Abundance among the Epi-Meso and Bathypelagic Zones of the
Southern-Central Tyrrhenian Sea, Oceanography, 1, 1, doi: 10.4172/ocn.1000105, 2013. 1580
Cauwet, G.: Determination of dissolved organic carbon (DOC) and nitrogen (DON) by high
temperature combustion, in: Methods of Seawater analysis, edited by: Grashoff, K.,
Kremling, K. and Ehrhard, M., 3rd Ed., Wiley-VCH, Weinheim, 407–420, 1999.
Céa, B., Lefèvre, D., Chirurgien, L., Raimbault, P., Garcia, N., Charrière, B., Grégori, G.,
Ghiglione, J.-F., Barani, A., Lafont, M., and Van Wambeke, F.: An annual survey of bacterial 1585
production, respiration and ectoenzyme activity in coastal NW Mediterranean waters:
temperature and resource controls, Environ. Sci. Pollut. Res., doi: 10.1007/s11356-014-3500-
9, 2014.
Christian, J. R., and Karl, D. M.: Bacterial ectoenzymes in marine waters: Activity ratio and
temperature responses in three oceanographic provinces, Limnol. Oceanogr., 40, 1046–1053, 1590
1995.
Chróst, R.J. Microbial enzymes in aquatic environments, Springer-Verlag, New York, 1991.
Crottereau, C., and Delmas, D.: Exoproteolytic activity in an Atlantic pond (France): estimates of in
situ activity, Aquat. Microb. Ecol., 15, 217–224, 1998.
Supprimé: -1595
Supprimé: (2001)
Supprimé: -
Supprimé: .
Supprimé: -
Supprimé: Baklouti, M., Diaz, F., 1600 Pinazo, C., Faure, V., and Quéguiner,
B.: Investigation of mechanistic formulations depicting phytoplancton
dynamics for models of marine pelagic
ecosystems and description of a new 1605 model, Prog. Oceanogr., 71, 1–33,
doi:1016/j.pocean.2006.05.002, 2006.
Supprimé: -
Supprimé: -
Supprimé: -1610
Supprimé: -
Supprimé:
Supprimé: -
Supprimé: -
Supprimé: .1615
Supprimé: -
21
Dittmar, T.H., Cherrier, J., and Ludwichowski, K.-U: The analysis of amino acids in seawater, in:
Practical Guidelines for the Analysis of Seawater, edited by: Wurl, O., Boca Raton, FL: CRC-
Press, 67–78, 2009.
Engel, A., and Händel, N.: A novel protocol for determining the concentration and composition of 1620
sugars in particulate and in high molecular weight dissolved organic matter (HMW-DOM) in
seawater, Mar. Chem. 127, 180–191, 2011.
Fang, J., Zhang, L., Li, J., Kato, C., Tamburini, C., Zhang, Y., Dang, H., Wang, G., and Wang, F.:
The POM-DOM piezophilic microorganism continuum (PDPMC) - The role of piezophilic
microorganisms in the global ocean carbon cycle, Science China (Earth Sciences), 1–10, 1625
doi:10.1007/s11430-014-4985-2, 2014.
Fukuda, R., Sohrin, Y., Saotome, N., Fukuda, H., Nagata, T., and Koike, I.: East-west gradient in
ectoenzyme activity in the subartic Pacific: Possible regulation by zinc, Limnol. Oceanogr.,
45, 930–939, 2000. Gazeau, F., Van Wambeke, F., Marañón, E., Pérez-Lorenzo, M., Alliouane, S., Stolpe,
C., Blasco, 1630
T., Leblond, N., Zäncker, B., Engel, A., Marie, B., Dinasquet, J., and Guieu, C.: Impact of
dust addition on the metabolism of Mediterranean plankton communities under present and
future conditions of pH and temperature, Biogeosciences Discuss., bg-2021-20, 2021.
Grossart, H.-P., Tang, K. W., Kiørboe, T., and Ploug, H.: Comparison of cell-specific activity
between free-living and attached bacteria using isolates and natural assemblages, FEMS 1635
Microb. Lett., 266, 194–200, doi:10.1111/j.1574-6968.2006.00520.x, 2007.
Guieu, C., D'Ortenzio, F., Dulac, F., Taillandier, V., Doglioli, A., Petrenko, A., Barrillon, S.,
Mallet, M., Nabat, P., and Desboeufs, K.: Introduction: Process studies at the air-sea interface
after atmospheric deposition in the Mediterranean Sea - objectives and strategy of the
PEACETIME oceanographic campaign (May–June 2017), Biogeosciences, 17, 5563–5585, 1640
doi:10.5194/bg-17-5563-2020, 2020.
Guyennon, A., Baklouti, M., Diaz, Palmiéri, J., Beuvier, J., Lebeaupin-Brossier, C., Arsouze, T.,
Beranger, K., Dutay, J.-C., and Moutin, T.: New insights into the organic carbonexport in the
Mediterranean Sea from 3-D modeling, Biogeosciences, 12, 7025–7046, doi: 10.5194/bg-12-
7025-2015, 2015. 1645 Hopkins, T. S.: Physical processes in the Mediterranean Basin, In: Estuarine transport processes,
edited by Kjerfve, B.,, University of South Carolina, 269–310, 1978.
Hoppe, H.-G.: Significance of exoenzymatic activities in the ecology of brackish water:
measurements by means of methylumbelliferyl-substrates, Mar. Ecol. Prog. Ser., 11, 299–
308, 1983. 1650
Hoppe, H.-G., and Ullrich, S.: Profiles of ectoenzymes in the Indian Ocean: phenomena of
phosphatase activity in the mesopelagic zone, Aquat. Microb. Ecol., 19, 139–148, 1999.
Hoppe, H.-G., Ducklow, H., and Karrasch, B.: Evidence for dependency of bacterial growth on
enzymatic hydrolysis of particulate organic matter in the mesopelagic ocean, Mar. Ecol. Prog.
Ser,, 93, 277–283, 1993. 1655
Keil, R.G, and Kirchman, D.:Dissolved combined amino acids: Chemical form and utilization by
marine bacteria, Limnol. Oceanogr., 38: 1256–1270, 1993.
Kirchman, D. L.: Leucine incorporation as a measure of biomass production by heterotrophic
bacteria, in: Handbook of methods in aquatic microbial ecology, edited by: Kemp, P.F., Sherr,
B.F., Sherr, E.B. and Cole, J.J., Lewis, Boca Raton, 509–512, 1993. 1660
Koch, A.L.: Oligotrophs versus copiotrophs, BioEssays, 23, 657–661, 2001.
Koike, I., and Nagata, T.: High potential activity of extracellular alkaline phosphatase in deep
waters of the central Pacific, Deep-Sea Res. PT II, 44, 2283–2294, 1997.
Kress, N., Manca, B., Klein, B., and Deponte, D.: Continuing influence of the changed
thermohaline circulation in the eastern Mediterranean on the distribution of dissolved oxygen 1665
and nutrients: Physical and chemical characterization of the water masses, J. Geophys. Res.
Oceans, 108, 8109, doi:10.1029/2002JC001397, 2003.
Krom, M. D., Herut, B. and Mantoura, R. F. C.: Nutrient budget for the eastern Mediterranean:
Implication for phosphorus limitation, Limnol. Oceanogr, 49, 1582–1592,
doi:10.4319/lo.2004.49.5.1582, 2004. 1670
Supprimé: .
Supprimé: I
Supprimé: .
Supprimé: &
Supprimé: —1675
Supprimé: -
Supprimé: enrichment
Supprimé: carbon budget and
Supprimé: in prep., this issue.
Supprimé: -1680
Supprimé: -
Supprimé: .
Supprimé: B.
Supprimé: editor
Supprimé: -1685
Supprimé: -
Supprimé: -
Supprimé: -
Supprimé: -
Supprimé: .1690
Supprimé: I
Supprimé: -
Supprimé: -
Supprimé: -
22
Lascaratos, A., Roether, W., Nittis, K., and Klein, B.: Recent changes in deep water formation and 1695 spreading in the eastern Mediterranean Sea: a review, Prog. Oceanogr., 44, 5–36, 1999.
Lemée, R., Rochelle-Newall, E., Van Wambeke, F., Pizay, M.-D., Rinaldi, P., and Gattuso, J.-P.:
Seasonal variation of bacterial production, respiration and growth efficiency in the open NW
Mediterranean Sea., Aquat. Microb. Ecol., 29, 227–237, 2002
Lindroth, P., and Mopper, K.: High performance liquid chromatographic determination of 1700
subpicomole amounts of amino acids by precolumn fluorescence derivatization with o-
phthaldialdehyde, Anal. Chem. 51, 1667–1674, 1979
Malanotte‐Rizzoli P., Manca, B.B., Marullo,S., Ribera d'Alcalà,M., Roether, W., Theocharis, A.,
and Conversano, F.: The Levantine Intermediate Water Experiment (LIWEX) Group:
Levantine basin - A laboratory for multiple water mass formation processes, J. Geophys. Res-1705
Oceans, 108, doi:10.1029/2002JC001643, 2003.
Marañón, E., Van Wambeke, F., Uitz, J., Boss, E.S., Pérez-Lorenzo, M., Dinasquet, J., Haëntjens,
N., Dimier, C., and Taillandier, V.: Deep maxima of phytoplankton biomass, primary
production and bacterial production in the Mediterranean Sea during late spring,
Biogeosciences Discuss., https://doi.org/10.5194/bg-2020-261, in review, 2020. 1710
Martinez, J., and Azam, F.: Aminopeptidase activity in marine chroococcoid cyanobacteria, Appl.
Environ. Microb., 59, 3701–3707, 1993.
Martinez, J., Smith, D. C., Steward, G. F., and Azam, F.: Variability in ectohydrolytic enzyme
activities of pelagic marine bacteria and its significance for substrate processing in the sea,
Aquat. Microb. Ecol., 10, 223–230, 1996. 1715
Misic, C., Povero, P., and Fabiano, M.: Ectoenzymatic ratios in relation to particulate organic
matter distribution (Ross Sea, Antarctica), Microb. Ecol., 44, 224–234, doi:10.1007/s00248-
002-2017-9, 2002.
Piontek, J., Sperling, M., Nothig, E.-V., and Engel, A.: Regulation of bacterioplankton activity in
Fram Strait (Arctic Ocean) during early summer: The role of organic matter supply and 1720
temperature, J. Marine Syst., 132, 83–94, doi: 10.1016/j.jmarsys.2014.01.003, 2014.
Placenti, F., Azzaro, M., Artale, V., La Ferla, R., Caruso, G., Santinelli, C., Maimone, G.,
Monticelli, L. S., Quinci, E. M., and Sprovieri, M.: Biogeochemical patterns and microbial
processes in the Eastern Mediterranean Deep Water of Ionian Sea, Hydrobiologia, 815, 97–
112, doi: 10.1007/s10750-018-3554-7, 2018. 1725
Pulido-Villena, E., Van Wambeke, F., Desboeufs, K., Petrenko, A., Barrillon, S., Djaoudi, K.,
Doglioli, A., D’Ortenzio, F., Fu, Y., Gaillard, T., Guasco, S., Nunige, S., Raimbault, P.,
Taillandier, V., Triquet, S., and Guieu, C. Analysis of external and internal sources
contributing to phosphate supply to the upper waters of the Mediterranean Sea (Peacetime
cruise), in prep for Biogeosciences, special issue PEACETIME. 1730
Raimbault, P., Pouvesle W., Diaz F., Garcia N., and Sempere, R.: Wet-oxidation and automated
colorimetry for simultaneous determination of organic carbon, nitrogen and phosphorus
dissolved in seawater, Mar. Chem. 66, 161–169, 1999.
Rath, J., Schiller, C., and Herndl, G. J.: Ectoenzyme activity and bacterial dynamics along a trophic
gradient in the Caribbean Sea, Mar. Ecol. Prog. Ser., 102, 89–96, 1993. 1735
Sala, M. M., Karner, M., Arin, L., and Marrassé, C.: Measurement of ectoenzyme activities as an
indication of inorganic nutrient imbalance in microbial communities, Aquat. Microb. Ecol.,
23, 301–311, doi:10.3354/ame023301, 2001.
Severin, T., Sauret, C., Boutrif, M., Duhaut, T., Kessouri, F., Oriol, L., Caparros, J., Pujo-Pay, M.,
Durrieu de Madron, X., Garel, M., Tamburini, C., Conan, P., and Ghiglione, J. F.: Impact of 1740
an intense water column mixing (0–1500 m) on prokaryotic diversity and activities during an
open‐ocean convection event in the NW Mediterranean Sea, Environ. Microbiol., 18, 4378–
4390, doi:10.1111/1462-2920.13324, 2016.
Siokou-Frangou, I., Christaki, U., Mazzocchi, M. G., Montresor, M., Ribera d’Alcala, M., Vaque,
D., and Zingone, A.: Plankton in the open Mediterranean Sea: a review, Biogeosciences, 7, 1745
1543–1586, doi:10.5194/bg-7-1543-2010, 2010.
Stocker, R.: Marine Microbes See a Sea of gradients, Science, 38, 628-633, 2012.
Supprimé: -
Supprimé: .
Supprimé: .1750
Supprimé: -
Supprimé: -
Supprimé: -
Supprimé: -
Supprimé: -1755
Code de champ modifié
Supprimé: -
Supprimé: Rath, J., and Herndl, G.
J.: Characteristics and Diversity of ß-
D-Glucosidase (EC 3.2.1.21) Activity
in Marine Snow, Appl. Environ. 1760 Microbiol., 60, 807-813, 1994.
Supprimé: -
Supprimé: -
Supprimé: -
23
Sharp, J. H.: Improved analysis for "particulate" organic carbon and nitrogen from seawater, 1765 Limnol. Oceanogr., 19, 984–989, 1974.
Schroeder, K., Cozzi S., Belgacem, M., Borghini, M., Cantoni, C., Durante, S., Petrizzo, A., Poiana,
A., and Chiggiato, J.: Along-Path Evolution of Biogeochemical and Carbonate System
Properties in the Intermediate Water of the Western Mediterranean, Front. Mar. Sci., 7:375,
doi: 10.3389/fmars.2020.00375, 2020. 1770
Simon, M., Grossart, H., Schweitzer, B., and Ploug, H.: Microbial ecology of organic aggregates in
aquatic ecosystems, Aquat. Microb. Ecol., 28, 175-211, doi: 10.3354/ame028175, 2002.
Sinsabaugh, R., and Follstad Shah, J.: Ectoenzymatic Stoichiometry and Ecological Theory, Annu.
Rev. Ecol., Evol. S., 43, 313–343, doi:10.1146/annurev-ecolsys-071112-124414, 2012.
Smith, D. C. and Azam, F.: A simple,economical method for measuring bacterial protein synthesis 1775
rates in sea water using 3H-Leucine, Mar. Microb. Food Webs, 6, 107–114, 1992.
Smith, D. C., Simon, M., Alldredge, A. L., and Azam, F.: Intense hydrolytic activity on marine
aggregates and implications for rapid particle dissolution, Nature, 359, 139–142, 1992.
Taillandier, V., Prieur, L., D’Ortenzio, F., Riberad’Alcala, M., and Pulido-Villena, E.: Profiling
float observation of thermohaline staircases in the western Mediterranean Sea and impact on 1780
nutrient fluxes, Biogeosciences, 17, 3343–3366, doi: 10.5194/bg-17-3343-2020, 2020.
Tamburini, C., Garcin, J., Ragot, M., and Bianchi, A.: Biopolymer hydrolysis and bacterial
production under ambient hydrostatic pressure through a 2000 m water column in the NW
Mediterranean, Deep-Sea Res. PT II, 49, 2109–2123, doi:10.1016/S0967-0645(02)00030-9,
2002. 1785
Tamburini, C., Garcin, J., and Bianchi, A.: Role of deep-sea bacteria in organic matter
mineralization and adaptation to hydrostatic pressure conditions in the NW Mediterranean
Sea, Aquat. Microb. Ecol., 32, 209–218. Doi: 10.3354/ame032209, 2003.
Tamburini, C., Garel, M., Al Ali, B., Mérigot, B., Kriwy, P., Charrière, B., and Budillon, G.:
Distribution and activity of Bacteria and Archaea in the different water masses of the 1790
Tyrrhenian Sea, Deep Sea Res. PT II, 56, 700–714, doi: 10.1016/j.dsr2.2008.07.021, 2009.
Testor, P., Bosse, A., Houpert, L., Margirier, F., Mortier, L., Legoff, H., Dausse, D., Labaste, M.,
Kartensen, J., Hayes, D., Olita, A. Ribotti, A., Schroeder, K., Chiggiato, J., Onken, R.,
Heslop, R., Mourre, B., D’Ortenzio, F., Mayot, N., Lavigne, H., de Fommervault, O.,
Coppola, L., Prieur, L., Taillandier, V., Durrieu de Madron, X., Bourrin, F., Many, G., 1795
Damien, P., Estournel, C., Marsaleix, P., Taupier-Lepage, I., Raimbault, P., Waldman, R.,
Bouin, M-N., Giordani, H., Caniaux, G., Somot, S., Ducrocq, V. and Conan P.: Multiscale
observations of deep convection in the northwestern Mediterranean Sea during winter 2012–
2013 using multiple platforms, J. Geophys.Res. Oceans, 123, 1745–1776. doi:10.1002/
2016JC012671, 2018. 1800
The Mermex Group. Marine ecosystems’ responses to climatic and anthropogenic forcings in the
Mediterranean, Prog. Oceanogr., 91(2), 97–166, doi: 10.1016/j.pocean.2011.02.003, 2011.
Thingstad, T. F., and Rassoulzadegan, F.: Nutrient limitations, microbial food webs, and 'biological
C-pumps': suggested interactions in a P-limited Mediterranean, Mar. Ecol. Prog. Ser., 117,
299–306, 1995. 1805
Tholosan, O., Lamy, F., Garcin, J., Polychronaki, T., and Bianchi, A.: Biphasic extracellular
proteolytic enzyme activity in benthic water and sediment in the North Western
Mediterranean Sea, Appl. Environ. Microb., 65, 1619–1626, 1999.
Unanue, M., Ayo, B., Agis, M., Slezak, D., Herndl, G. J., and Iriberri, J.: Ectoenzymatic activity
and uptake of monomers in marine bacterioplankton described by a biphasic kinetic model, 1810
Microb. Ecol., 37, 36–48, doi:10.1007/s002489900128, 1999.
Van Wambeke, F., Christaki, U., Giannakourou, A., Moutin, T., and Souvemerzoglou, K.:
Longitudinal and vertical trends of bacterial limitation by phosphorus and carbon in the
Mediterranean Sea, Microb. Ecol., 43, 119–133, doi: 10.1007/s00248-001-0038-4, 2002.
Van Wambeke, F., Taillandier, V., Desboeufs, K., Pulido-Villena, E., Dinasquet, J., Engel, A., Marañón, 1815
E., Ridame, C., and Guieu, C.: Influence of atmospheric deposition on biogeochemical cycles in
an oligotrophic ocean system, Biogeosciences Discuss., https://doi.org/10.5194/bg-2020-411,
2020.
Supprimé: -
Supprimé: (2020) 1820
Supprimé: .
Supprimé: -
Supprimé: -
Supprimé: -
Supprimé: -1825
Supprimé: .
Supprimé: https://
Supprimé: .org/
Supprimé: .
Supprimé: -1830
Supprimé: -
Supprimé: Unanue, M., Azua, I., Arrieta, J. M., Labirua-Iturburu, A.,
Egea, L., and Iriberri, J.: Bacterial
colonization and ectoenzymatic activity 1835 in phytoplankton-derived model particles: Cleavage of peptides and
uptake of amino acids., Microb. Ecol.,
35, 136-146, ,1998.
Supprimé: -1840
24
Wright, R. T., and Hobbie, J. E.: Use of glucose and acetate by bacteria and algae in aquatic
ecosystems, Ecology, 47, 447–464, 1966.
Wust, G.: On the vertical circulation of the Mediterranean Sea, J. Geophys. Res., 66, 10, 3261-3271,
1961.
Zaccone, R., and Caruso, G.: Microbial enzymes in the Mediterranean Sea: relationship with 1845
climate changes, AIMS Microbiology, 5, 251–272, 2019.
Zaccone, R., Boldrin, A., Caruso, G., La Ferla, R., Maimone, G., Santinelli, C., and Turchetto, M.:
Enzymatic Activities and Prokaryotic Abundance in Relation to Organic Matter along a
West–East Mediterranean Transect (TRANSMED Cruise), Microb. Ecol., 64, 54–66, 2012.
Zhang, J.-Z., and Chi, J.:Automated analysis of nano-molar concentrations of phosphate in natural 1850 waters with liquid waveguide, Environ. Sci. Technol., 36, 1048–1053,
doi:10.1021/es011094v, 2002.
Zhao, Z., Baltar, B., and Herndl, G. J.: Linking extracellular enzymes to phylogeny indicates a
predominantly particle-associated lifestyle of deep-sea prokaryotes, Sciences Advances, 6,
eaaz4354, https://doi.org/10.1126/sciadv.aaz4354, 2020. 1855
Supprimé: -
Supprimé: -
Supprimé: -
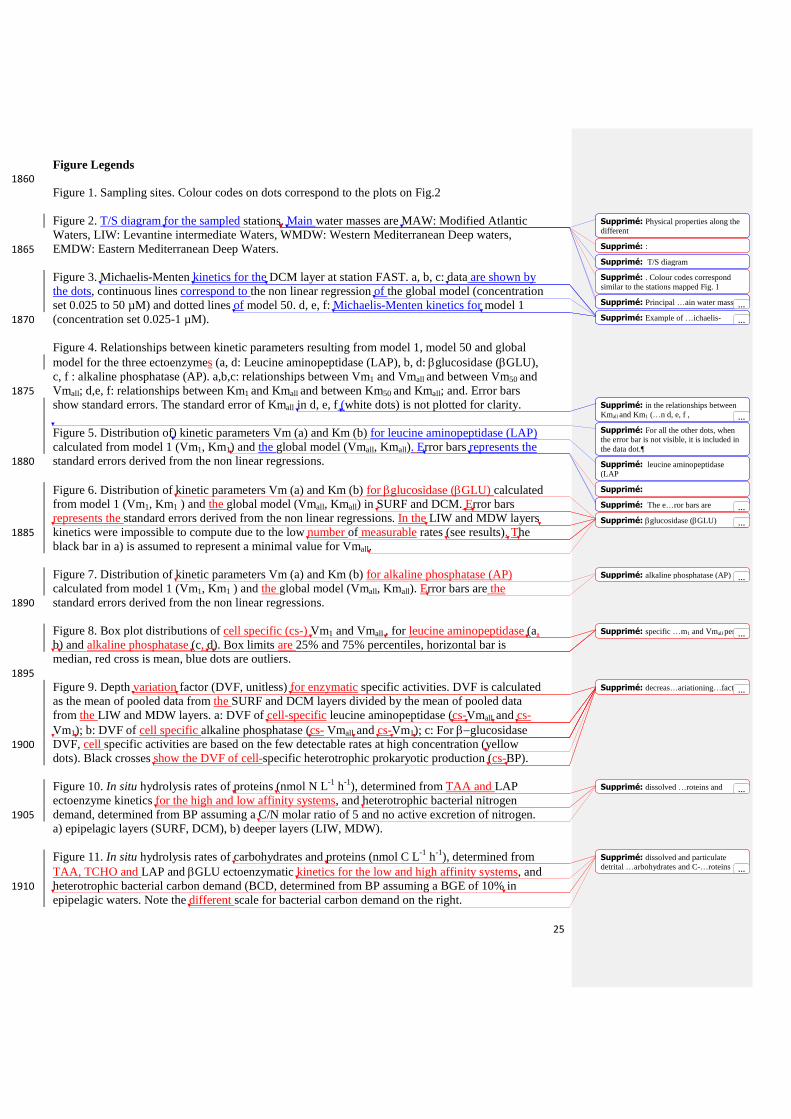
25
Figure Legends
1860
Figure 1. Sampling sites. Colour codes on dots correspond to the plots on Fig.2
Figure 2. T/S diagram for the sampled stations. Main water masses are MAW: Modified Atlantic
Waters, LIW: Levantine intermediate Waters, WMDW: Western Mediterranean Deep waters,
EMDW: Eastern Mediterranean Deep Waters. 1865
Figure 3. Michaelis-Menten kinetics for the DCM layer at station FAST. a, b, c: data are shown by
the dots, continuous lines correspond to the non linear regression of the global model (concentration
set 0.025 to 50 µM) and dotted lines of model 50. d, e, f: Michaelis-Menten kinetics for model 1
(concentration set 0.025-1 µM). 1870
Figure 4. Relationships between kinetic parameters resulting from model 1, model 50 and global
model for the three ectoenzymes (a, d: Leucine aminopeptidase (LAP), b, d: glucosidase (GLU),
c, f : alkaline phosphatase (AP). a,b,c: relationships between Vm1 and Vmall and between Vm50 and
Vmall; d,e, f: relationships between Km1 and Kmall and between Km50 and Kmall; and. Error bars 1875
show standard errors. The standard error of Kmall in d, e, f (white dots) is not plotted for clarity.
Figure 5. Distribution of) kinetic parameters Vm (a) and Km (b) for leucine aminopeptidase (LAP)
calculated from model 1 (Vm1, Km1) and the global model (Vmall, Kmall). Error bars represents the
standard errors derived from the non linear regressions. 1880
Figure 6. Distribution of kinetic parameters Vm (a) and Km (b) for glucosidase (GLU) calculated
from model 1 (Vm1, Km1 ) and the global model (Vmall, Kmall) in SURF and DCM. Error bars
represents the standard errors derived from the non linear regressions. In the LIW and MDW layers
kinetics were impossible to compute due to the low number of measurable rates (see results). The 1885
black bar in a) is assumed to represent a minimal value for Vmall.
Figure 7. Distribution of kinetic parameters Vm (a) and Km (b) for alkaline phosphatase (AP)
calculated from model 1 (Vm1, Km1 ) and the global model (Vmall, Kmall). Error bars are the
standard errors derived from the non linear regressions. 1890
Figure 8. Box plot distributions of cell specific (cs-) Vm1 and Vmall , for leucine aminopeptidase (a,
b) and alkaline phosphatase (c, d). Box limits are 25% and 75% percentiles, horizontal bar is
median, red cross is mean, blue dots are outliers.
1895
Figure 9. Depth variation factor (DVF, unitless) for enzymatic specific activities. DVF is calculated
as the mean of pooled data from the SURF and DCM layers divided by the mean of pooled data
from the LIW and MDW layers. a: DVF of cell-specific leucine aminopeptidase (cs-Vmall and cs-
Vm1); b: DVF of cell specific alkaline phosphatase (cs- Vmall and cs-Vm1); c: For glucosidase
DVF, cell specific activities are based on the few detectable rates at high concentration (yellow 1900
dots). Black crosses show the DVF of cell-specific heterotrophic prokaryotic production (cs-BP).
Figure 10. In situ hydrolysis rates of proteins (nmol N L-1
h-1
), determined from TAA and LAP
ectoenzyme kinetics for the high and low affinity systems, and heterotrophic bacterial nitrogen
demand, determined from BP assuming a C/N molar ratio of 5 and no active excretion of nitrogen. 1905
a) epipelagic layers (SURF, DCM), b) deeper layers (LIW, MDW).
Figure 11. In situ hydrolysis rates of carbohydrates and proteins (nmol C L-1
h-1
), determined from
TAA, TCHO and LAP and GLU ectoenzymatic kinetics for the low and high affinity systems, and
heterotrophic bacterial carbon demand (BCD, determined from BP assuming a BGE of 10% in 1910
epipelagic waters. Note the different scale for bacterial carbon demand on the right.
Supprimé: Physical properties along the different
Supprimé: :
Supprimé: T/S diagram
Supprimé: . Colour codes correspond 2000 similar to the stations mapped Fig. 1
Supprimé: Principal …ain water masses ...
Supprimé: Example of …ichaelis- ...
Supprimé: in the relationships between
Kmall and Km1 (…n d, e, f , 2005 ...
Supprimé: For all the other dots, when
the error bar is not visible, it is included in
the data dot.
Supprimé: leucine aminopeptidase (LAP2010
Supprimé:
Supprimé: The e…ror bars are ...
Supprimé: glucosidase (GLU) ...
Supprimé: alkaline phosphatase (AP) ...
Supprimé: specific …m1 and Vmall per 2015 ...
Supprimé: decreas…ariationing…facto...
Supprimé: dissolved …roteins and ...
Supprimé: dissolved and particulate
detrital …arbohydrates and C-…roteins ...

26
2020
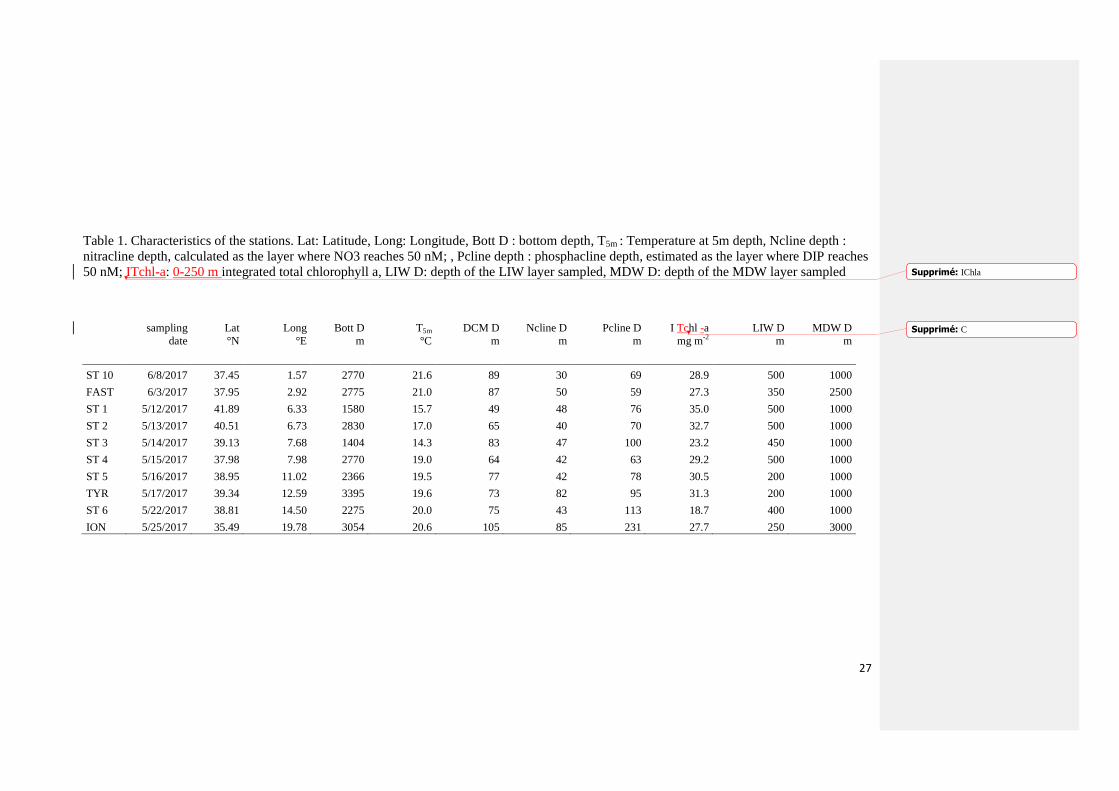
27
Table 1. Characteristics of the stations. Lat: Latitude, Long: Longitude, Bott D : bottom depth, T5m : Temperature at 5m depth, Ncline depth :
nitracline depth, calculated as the layer where NO3 reaches 50 nM; , Pcline depth : phosphacline depth, estimated as the layer where DIP reaches
50 nM; ITchl-a: 0-250 m integrated total chlorophyll a, LIW D: depth of the LIW layer sampled, MDW D: depth of the MDW layer sampled
sampling
date
Lat
°N
Long
°E
Bott D
m
T5m
°C
DCM D
m
Ncline D
m
Pcline D
m
I Tchl -a
mg m-2
LIW D
m
MDW D
m
ST 10 6/8/2017 37.45 1.57 2770 21.6 89 30 69 28.9 500 1000
FAST 6/3/2017 37.95 2.92 2775 21.0 87 50 59 27.3 350 2500
ST 1 5/12/2017 41.89 6.33 1580 15.7 49 48 76 35.0 500 1000
ST 2 5/13/2017 40.51 6.73 2830 17.0 65 40 70 32.7 500 1000
ST 3 5/14/2017 39.13 7.68 1404 14.3 83 47 100 23.2 450 1000
ST 4 5/15/2017 37.98 7.98 2770 19.0 64 42 63 29.2 500 1000
ST 5 5/16/2017 38.95 11.02 2366 19.5 77 42 78 30.5 200 1000
TYR 5/17/2017 39.34 12.59 3395 19.6 73 82 95 31.3 200 1000
ST 6 5/22/2017 38.81 14.50 2275 20.0 75 43 113 18.7 400 1000
ION 5/25/2017 35.49 19.78 3054 20.6 105 85 231 27.7 250 3000
Supprimé: IChla
Supprimé: C
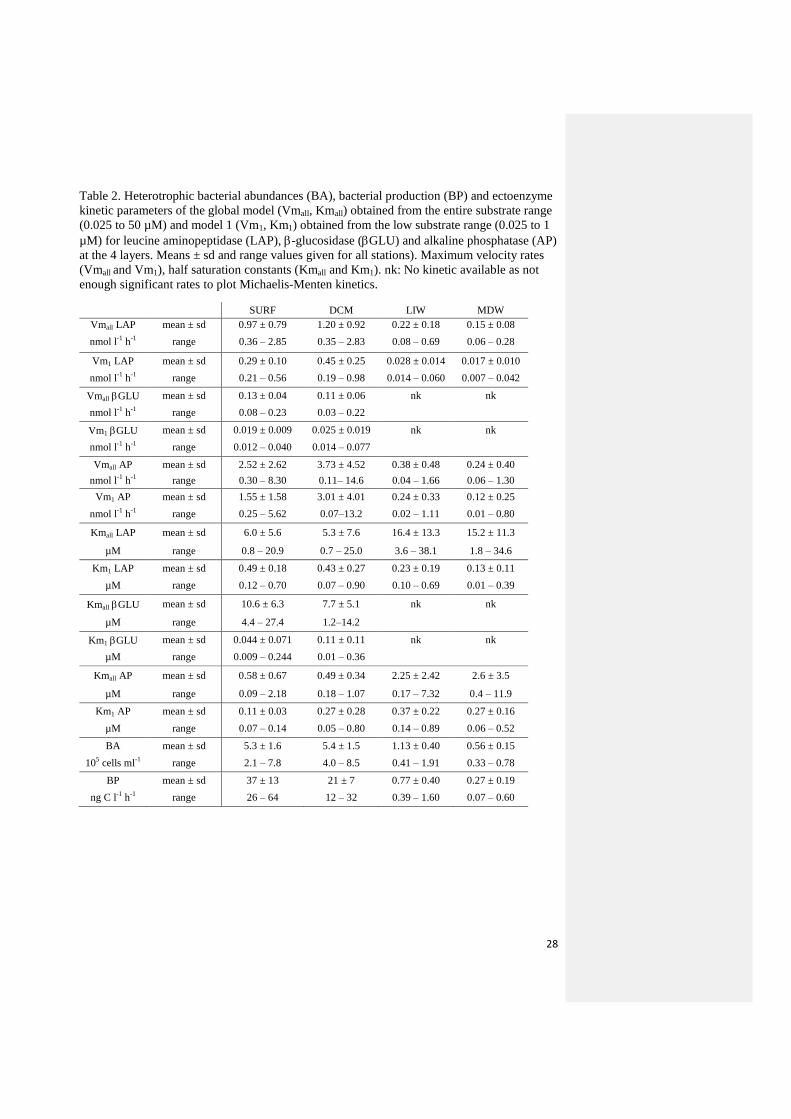
28
Table 2. Heterotrophic bacterial abundances (BA), bacterial production (BP) and ectoenzyme
kinetic parameters of the global model (Vmall, Kmall) obtained from the entire substrate range
(0.025 to 50 µM) and model 1 (Vm1, Km1) obtained from the low substrate range (0.025 to 1
µM) for leucine aminopeptidase (LAP), -glucosidase (GLU) and alkaline phosphatase (AP)
at the 4 layers. Means ± sd and range values given for all stations). Maximum velocity rates
(Vmall and Vm1), half saturation constants (Kmall and Km1). nk: No kinetic available as not
enough significant rates to plot Michaelis-Menten kinetics.
SURF DCM LIW MDW
Vmall LAP mean ± sd 0.97 ± 0.79 1.20 ± 0.92 0.22 ± 0.18 0.15 ± 0.08
nmol l-1
h-1
range 0.36 – 2.85 0.35 – 2.83 0.08 – 0.69 0.06 – 0.28
Vm1 LAP mean ± sd 0.29 ± 0.10 0.45 ± 0.25 0.028 ± 0.014 0.017 ± 0.010
nmol l-1
h-1
range 0.21 – 0.56 0.19 – 0.98 0.014 – 0.060 0.007 – 0.042
Vmall GLU mean ± sd 0.13 ± 0.04 0.11 ± 0.06 nk nk
nmol l-1
h-1
range 0.08 – 0.23 0.03 – 0.22
Vm1 GLU mean ± sd 0.019 ± 0.009 0.025 ± 0.019 nk nk
nmol l-1
h-1
range 0.012 – 0.040 0.014 – 0.077
Vmall AP mean ± sd 2.52 ± 2.62 3.73 ± 4.52 0.38 ± 0.48 0.24 ± 0.40
nmol l-1
h-1
range 0.30 – 8.30 0.11– 14.6 0.04 – 1.66 0.06 – 1.30
Vm1 AP mean ± sd 1.55 ± 1.58 3.01 ± 4.01 0.24 ± 0.33 0.12 ± 0.25
nmol l-1
h-1
range 0.25 – 5.62 0.07–13.2 0.02 – 1.11 0.01 – 0.80
Kmall LAP mean ± sd 6.0 ± 5.6 5.3 ± 7.6 16.4 ± 13.3 15.2 ± 11.3
µM range 0.8 – 20.9 0.7 – 25.0 3.6 – 38.1 1.8 – 34.6
Km1 LAP mean ± sd 0.49 ± 0.18 0.43 ± 0.27 0.23 ± 0.19 0.13 ± 0.11
µM range 0.12 – 0.70 0.07 – 0.90 0.10 – 0.69 0.01 – 0.39
Kmall GLU mean ± sd 10.6 ± 6.3 7.7 ± 5.1 nk nk
µM range 4.4 – 27.4 1.2–14.2
Km1 GLU mean ± sd 0.044 ± 0.071 0.11 ± 0.11 nk nk
µM range 0.009 – 0.244 0.01 – 0.36
Kmall AP mean ± sd 0.58 ± 0.67 0.49 ± 0.34 2.25 ± 2.42 2.6 ± 3.5
µM range 0.09 – 2.18 0.18 – 1.07 0.17 – 7.32 0.4 – 11.9
Km1 AP mean ± sd 0.11 ± 0.03 0.27 ± 0.28 0.37 ± 0.22 0.27 ± 0.16
µM range 0.07 – 0.14 0.05 – 0.80 0.14 – 0.89 0.06 – 0.52
BA mean ± sd 5.3 ± 1.6 5.4 ± 1.5 1.13 ± 0.40 0.56 ± 0.15
105 cells ml
-1 range 2.1 – 7.8 4.0 – 8.5 0.41 – 1.91 0.33 – 0.78
BP mean ± sd 37 ± 13 21 ± 7 0.77 ± 0.40 0.27 ± 0.19
ng C l-1
h-1
range 26 – 64 12 – 32 0.39 – 1.60 0.07 – 0.60
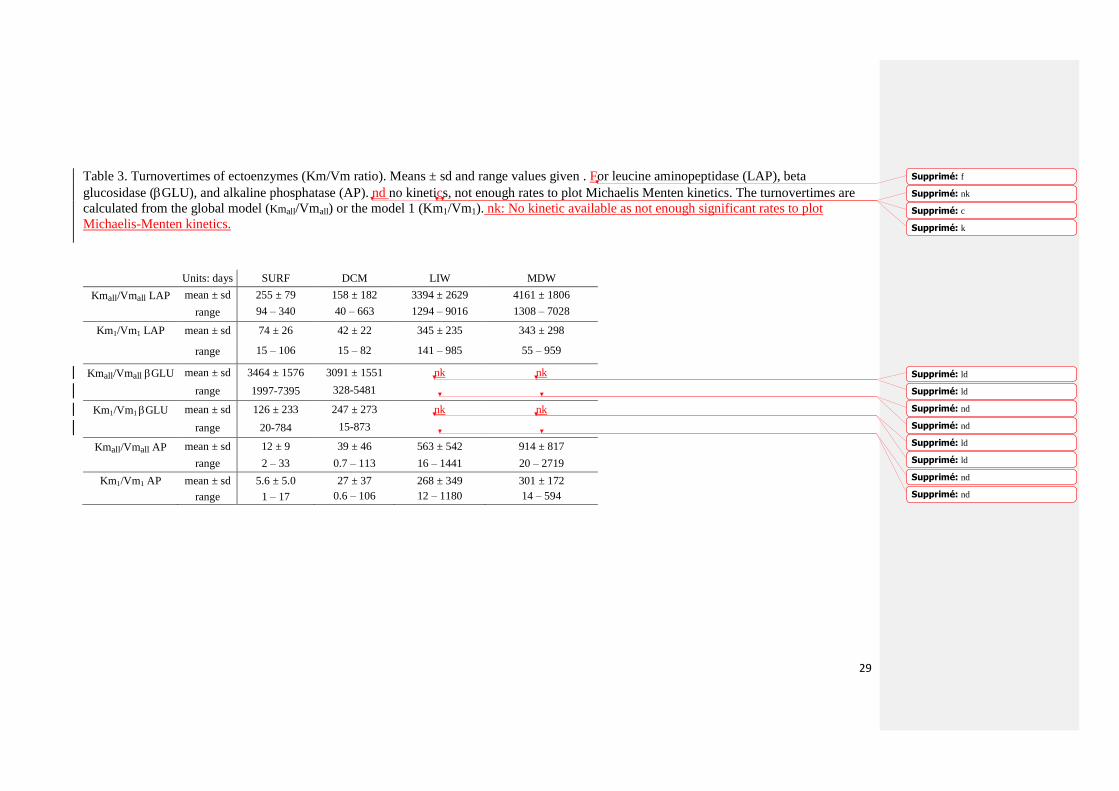
29
Table 3. Turnovertimes of ectoenzymes (Km/Vm ratio). Means ± sd and range values given . For leucine aminopeptidase (LAP), beta
glucosidase (GLU), and alkaline phosphatase (AP). nd no kinetics, not enough rates to plot Michaelis Menten kinetics. The turnovertimes are
calculated from the global model (Kmall/Vmall) or the model 1 (Km1/Vm1). nk: No kinetic available as not enough significant rates to plot
Michaelis-Menten kinetics.
Units: days SURF DCM LIW MDW
Kmall/Vmall LAP mean ± sd 255 ± 79 158 ± 182 3394 ± 2629 4161 ± 1806
range 94 – 340 40 – 663 1294 – 9016 1308 – 7028
Km1/Vm1 LAP mean ± sd 74 ± 26 42 ± 22 345 ± 235 343 ± 298
range 15 – 106 15 – 82 141 – 985 55 – 959
Kmall/Vmall GLU mean ± sd 3464 ± 1576 3091 ± 1551 nk nk
range 1997-7395 328-5481
Km1/Vm1 GLU mean ± sd 126 ± 233 247 ± 273 nk nk
range 20-784 15-873
Kmall/Vmall AP mean ± sd 12 ± 9 39 ± 46 563 ± 542 914 ± 817
range 2 – 33 0.7 – 113 16 – 1441 20 – 2719
Km1/Vm1 AP mean ± sd 5.6 ± 5.0 27 ± 37 268 ± 349 301 ± 172
range 1 – 17 0.6 – 106 12 – 1180 14 – 594
Supprimé: f
Supprimé: nk
Supprimé: c
Supprimé: k
Supprimé: ld
Supprimé: ld
Supprimé: nd
Supprimé: nd
Supprimé: ld
Supprimé: ld
Supprimé: nd
Supprimé: nd

30
Table 4. Range of different specific activities calculated using Vm1 and specific to either i) abundance of total heterotrophic prokaryotes (cell
specific activities, cs), ii) heterotrophic bacterial production (per bp LAP, per bp GLU, per bp AP). DVF is the ‘depth variation factor’,
calculated for each station as mean value in epipelagic water (SURF and DCM data) divided by the mean in deep waters (LIW and MDW). The
distribution of cs-Vm1 and cs-Vmall for AP and LAP are also presented on Fig 8.
enzyme units SURF DCM LIW MDW DVF
cs-LAP 10-18
mol leu bact-1
h-1
0.33 – 1.52 0.44 – 2.18 0.11-0.70 0.13 – 0.54 1.3 – 9.6
cs-GLU 10-18
mol glucose bact-1
h-1
0.02 – 0.11 0.02 – 0.17 nd nd nd
cs-AP 10-18
mole P bact-1
h-1
0.45 – 26 0.11 – 32 0.13-11 0.17-23 0.1 – 28
csBP 10-18
g C bact-1
h-1
46 – 136 25 – 60 3 – 17 1 – 14 4 – 23
per bp LAP nmol AA nmol C-1
0.04 – 0.24 0.12 – 0.44
0.21 –
1.08 0.36 – 3.03 0.09 – 0.76
per bp GLU nmol glucose nmol C-1
0.003 – 0.017 0.007 – 0.034 nd nd nd
per bp AP nmol P nmol C-1
0.09 – 2.3 0.05 – 11 0.46 – 8 0.6-40 0.04 – 1.7
Supprimé: potential
Supprimé: per cell
Supprimé: unit BP
Supprimé: decreasing
Supprimé:
Supprimé: cell specific
Supprimé:
Supprimé: cell specific
Supprimé:
Supprimé: 7
Supprimé: Per cell
Supprimé:
Supprimé: Per cell
Supprimé:
Supprimé: Per cell
Supprimé:
Supprimé: Per cell
Supprimé:
Supprimé: BP
Supprimé: BP
Supprimé: BP

31

32
Spatial patterns of ectoenzymatic kinetics in relation to
biogeochemical properties in the Mediterranean Sea and the
concentration of the fluorogenic substrate used.
France Van Wambeke, Elvira Pulido, Philippe Catala, Julie Dinasquet, Kahina Djaoudi,
Anja Engel, Marc Garel, Sophie Guasco, Barbara Marie, Sandra Nunige, Vincent
Taillandier, Birthe Zäncker, Christian Tamburini.
Supplementary Material
Figure S1. a) Distribution of total aminoacids (TAA, bars, lef scale) and TAA-N/DON
ratio (dots, right scale). b) Distribution of total combined carbohydrates (TCHO, bars, left
scale) and TCHO-C/DOC ratio (dots, right scale). At each station four data are presented,
corresponding to, from left to right, SURF, DCM, LIW and MDW layers, respectively. At
stations ST10, ST1 and ST2, DON data at MDW and LIW layers were not available
Figure S2. a, b, c: Non linear least squares regression fits of Michaelis-Menten kinetics
plotted for incremental ranges of substrate concentrations from 0.25 corresponding to a
0.025-0.25 µM substrate concentration set to 50 corresponding to a 0.025-50µM substrate
concentration set for a) LAP, b) GLU and c) AP. Dots correspond to the field
measurements. The dataset is the same as in Figure 3: (DCM at station FAST). d, e f :
corresponding distribution of the V and Km parameters plotted according to the
maximum concentration added.
Figure S3. Distribution of heterotrophic bacterial production (BP, a) and bacterial
abundances (BA, b). At each station four data are presented, corresponding to, from left
to right, SURF, DCM, LIW and MDW layers, respectively. BP data are not available for
LIW layer at stations ST2 and ST4, and MDW layer at station FAST, ST2, ST4, ST6.
Figure S4. Distribution of ectoenzyme activity ratios AP/LAP (a) and LAP/GLU (b).
Ratios calculated using Vm data from the global model (Vmall) or the model 1 (Vm1).
Supprimé: 1
Supprimé: 1,
Supprimé:
Supprimé: 2,3
Supprimé: 1,4
Supprimé: 5
Supprimé: 1
Supprimé: 1
Supprimé:
Supprimé: 1
Supprimé: 6
Supprimé: 6,7
Supprimé: 1
Supprimé: a range of data
concentrations including
Supprimé: ed new
Supprimé: (For example 0.25 is plotted
for a 0.025-0.25 concentration set, and 25 plotted for a 0.025-25 concentrationset).
Supprimé: This is the same data set
Supprimé: o
Supprimé: ,
Supprimé: DCM layer
Supprimé: m,
Supprimé: calculated
Supprimé: different concentrations
ranges
Supprimé: tested
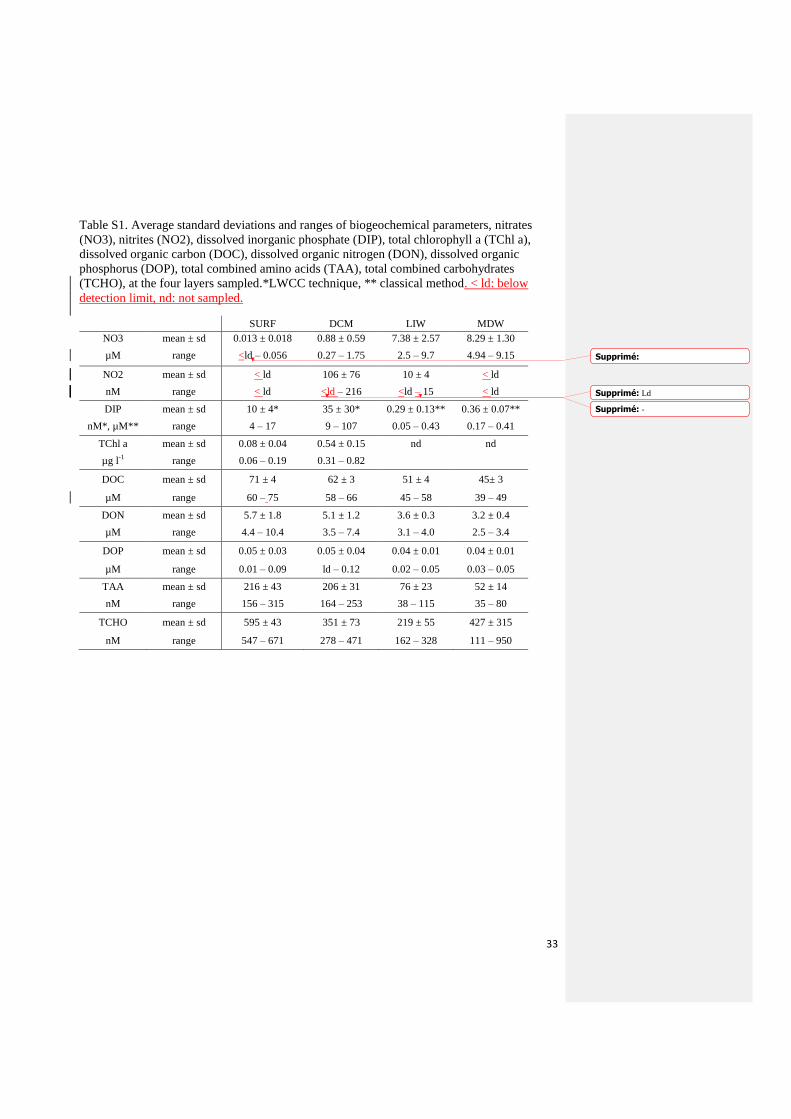
33
Table S1. Average standard deviations and ranges of biogeochemical parameters, nitrates
(NO3), nitrites (NO2), dissolved inorganic phosphate (DIP), total chlorophyll a (TChl a),
dissolved organic carbon (DOC), dissolved organic nitrogen (DON), dissolved organic
phosphorus (DOP), total combined amino acids (TAA), total combined carbohydrates
(TCHO), at the four layers sampled.*LWCC technique, ** classical method. < ld: below
detection limit, nd: not sampled.
SURF DCM LIW MDW
NO3 mean ± sd 0.013 ± 0.018 0.88 ± 0.59 7.38 ± 2.57 8.29 ± 1.30
µM range <ld – 0.056 0.27 – 1.75 2.5 – 9.7 4.94 – 9.15
NO2 mean ± sd < ld 106 ± 76 10 ± 4 < ld
nM range < ld <ld – 216 <ld – 15 < ld
DIP mean ± sd 10 ± 4* 35 ± 30* 0.29 ± 0.13** 0.36 ± 0.07**
nM*, µM** range 4 – 17 9 – 107 0.05 – 0.43 0.17 – 0.41
TChl a mean ± sd 0.08 ± 0.04 0.54 ± 0.15 nd nd
µg l-1
range 0.06 – 0.19 0.31 – 0.82
DOC mean ± sd 71 ± 4 62 ± 3 51 ± 4 45± 3
µM range 60 – 75 58 – 66 45 – 58 39 – 49
DON mean ± sd 5.7 ± 1.8 5.1 ± 1.2 3.6 ± 0.3 3.2 ± 0.4
µM range 4.4 – 10.4 3.5 – 7.4 3.1 – 4.0 2.5 – 3.4
DOP mean ± sd 0.05 ± 0.03 0.05 ± 0.04 0.04 ± 0.01 0.04 ± 0.01
µM range 0.01 – 0.09 ld – 0.12 0.02 – 0.05 0.03 – 0.05
TAA mean ± sd 216 ± 43 206 ± 31 76 ± 23 52 ± 14
nM range 156 – 315 164 – 253 38 – 115 35 – 80
TCHO mean ± sd 595 ± 43 351 ± 73 219 ± 55 427 ± 315
nM range 547 – 671 278 – 471 162 – 328 111 – 950
Supprimé:
Supprimé: Ld
Supprimé: -
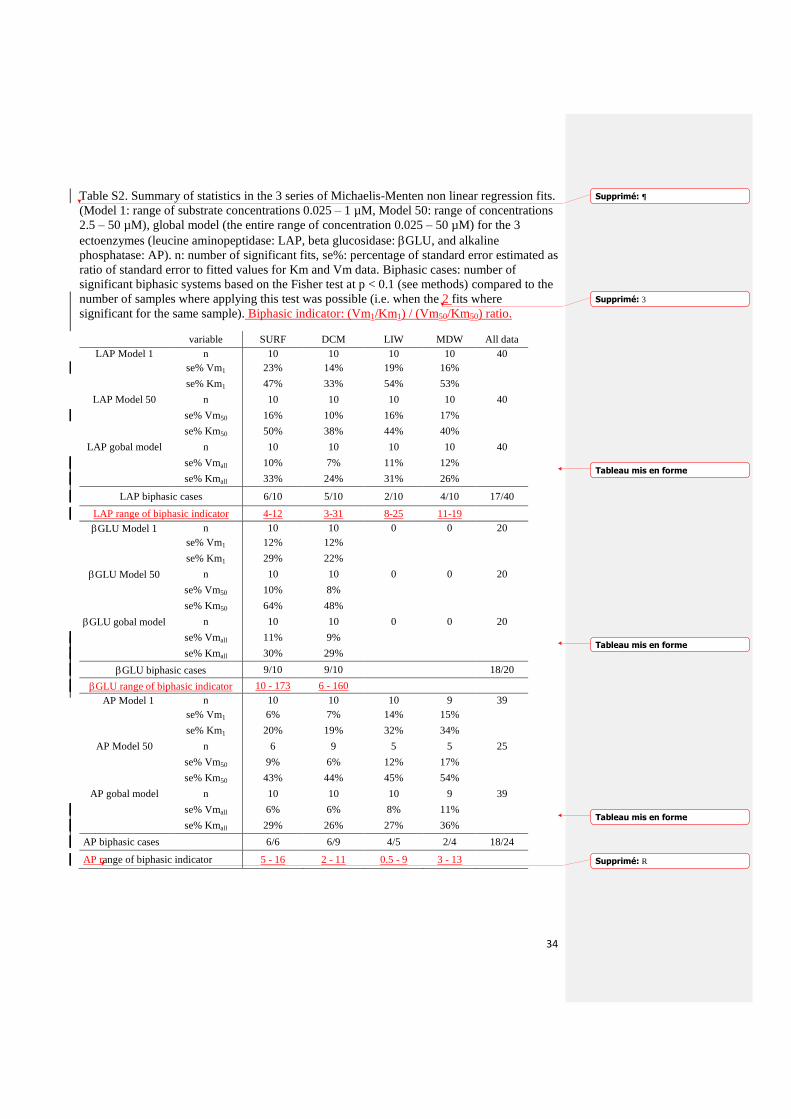
34
Table S2. Summary of statistics in the 3 series of Michaelis-Menten non linear regression fits.
(Model 1: range of substrate concentrations 0.025 – 1 µM, Model 50: range of concentrations
2.5 – 50 µM), global model (the entire range of concentration 0.025 – 50 µM) for the 3
ectoenzymes (leucine aminopeptidase: LAP, beta glucosidase: GLU, and alkaline
phosphatase: AP). n: number of significant fits, se%: percentage of standard error estimated as
ratio of standard error to fitted values for Km and Vm data. Biphasic cases: number of
significant biphasic systems based on the Fisher test at p < 0.1 (see methods) compared to the
number of samples where applying this test was possible (i.e. when the 2 fits where
significant for the same sample). Biphasic indicator: (Vm1/Km1) / (Vm50/Km50) ratio.
variable SURF DCM LIW MDW All data
LAP Model 1 n 10 10 10 10 40
se% Vm1 23% 14% 19% 16%
se% Km1 47% 33% 54% 53%
LAP Model 50 n 10 10 10 10 40
se% Vm50 16% 10% 16% 17%
se% Km50 50% 38% 44% 40%
LAP gobal model n 10 10 10 10 40
se% Vmall 10% 7% 11% 12%
se% Kmall 33% 24% 31% 26%
LAP biphasic cases 6/10 5/10 2/10 4/10 17/40
LAP range of biphasic indicator 4-12 3-31 8-25 11-19
GLU Model 1 n 10 10 0 0 20
se% Vm1 12% 12%
se% Km1 29% 22%
GLU Model 50 n 10 10 0 0 20
se% Vm50 10% 8%
se% Km50 64% 48%
GLU gobal model n 10 10 0 0 20
se% Vmall 11% 9%
se% Kmall 30% 29%
GLU biphasic cases 9/10 9/10
18/20
GLU range of biphasic indicator 10 - 173 6 - 160
AP Model 1 n 10 10 10 9 39
se% Vm1 6% 7% 14% 15%
se% Km1 20% 19% 32% 34%
AP Model 50 n 6 9 5 5 25
se% Vm50 9% 6% 12% 17%
se% Km50 43% 44% 45% 54%
AP gobal model n 10 10 10 9 39
se% Vmall 6% 6% 8% 11%
se% Kmall 29% 26% 27% 36%
AP biphasic cases 6/6 6/9 4/5 2/4 18/24
AP range of biphasic indicator 5 - 16 2 - 11 0.5 - 9 3 - 13
Supprimé: 
Supprimé: 3
Tableau mis en forme
Tableau mis en forme
Tableau mis en forme
Supprimé: R
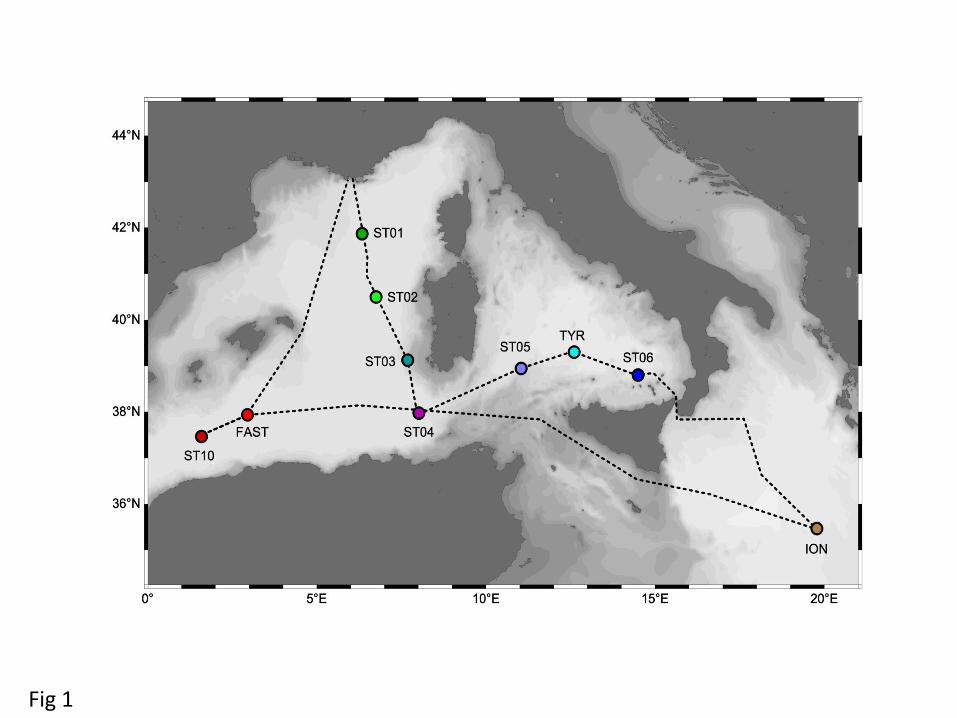
Fig 1
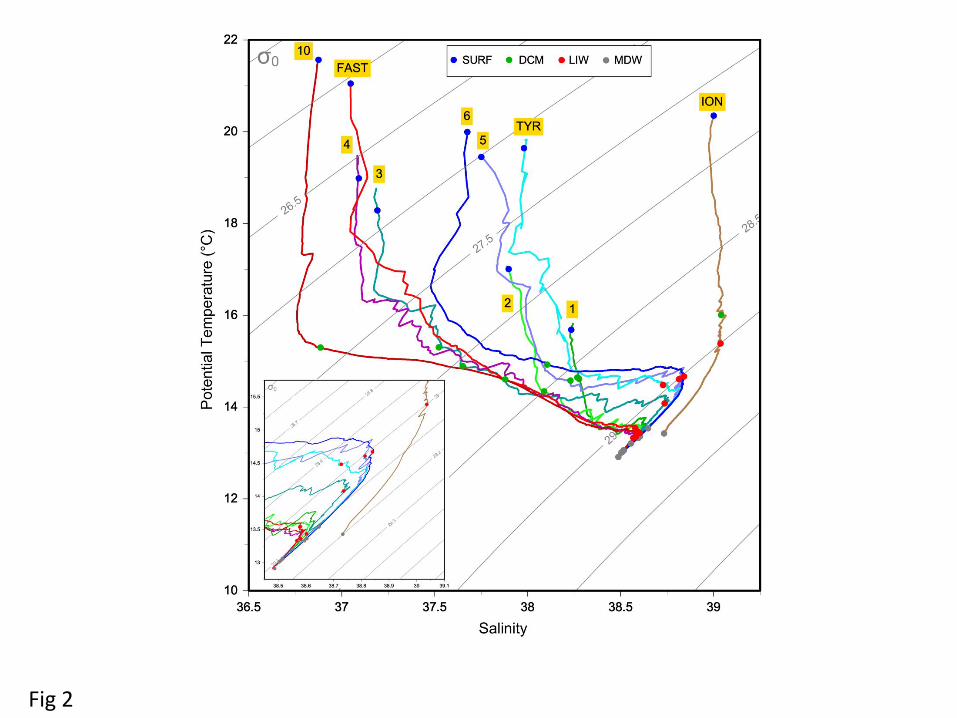
Fig 2
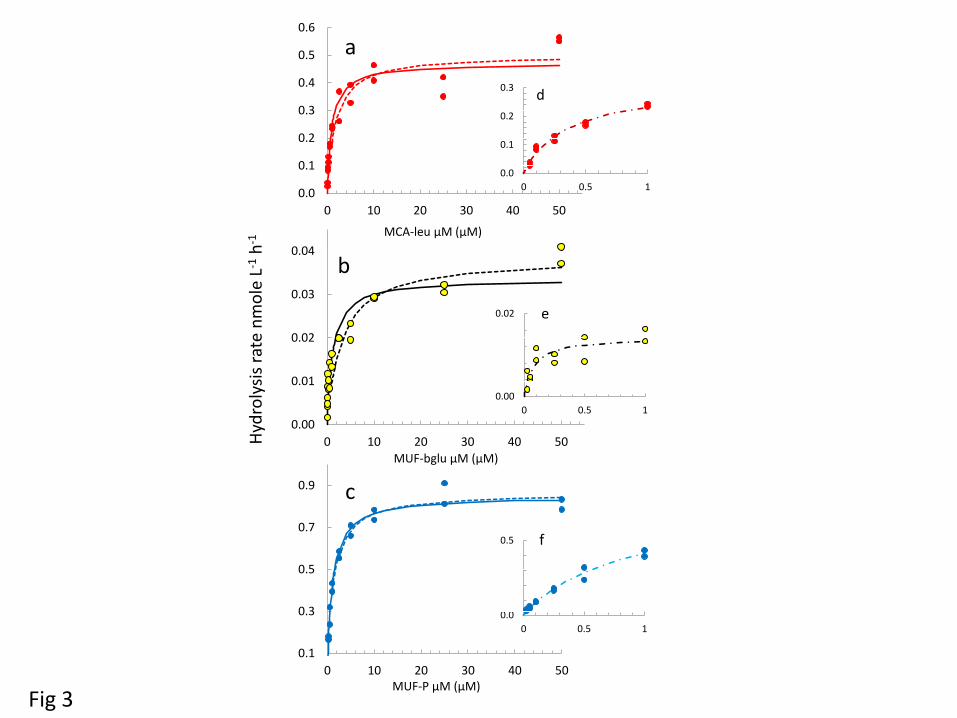
Fig 3
0.0
0.1
0.2
0.3
0 0.5 1
0.00
0.02
0 0.5 1
0.0
0.5
0 0.5 1
Hyd
roly
sis
rate
nm
ole
L-1
h-1
0.0
0.1
0.2
0.3
0.4
0.5
0.6
0 10 20 30 40 50
MCA-leu µM (µM)
0.00
0.01
0.02
0.03
0.04
0 10 20 30 40 50
MUF-bglu µM (µM)
0.1
0.3
0.5
0.7
0.9
0 10 20 30 40 50 MUF-P µM (µM)
a
b
c
d
e
f
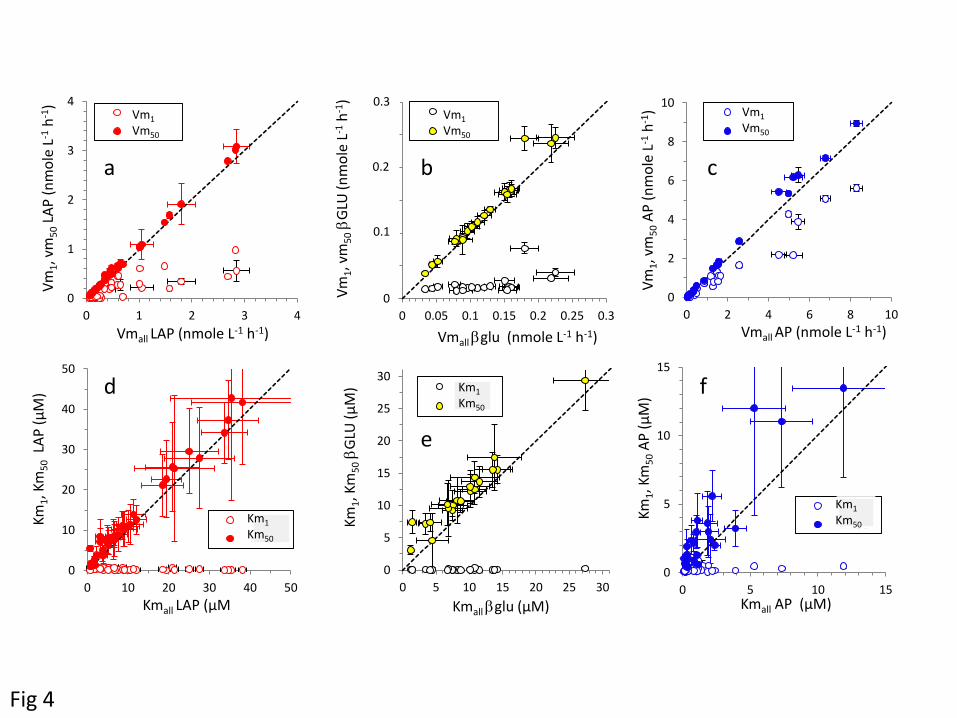
0
1
2
3
4
0 1 2 3 4
Vm
1, v
m5
0 L
AP
(n
mo
le L
-1 h
-1)
Vmall LAP (nmole L-1 h-1)
Vm1
Vm50
0
0.1
0.2
0.3
0 0.05 0.1 0.15 0.2 0.25 0.3
Vm
1, v
m5
0 b
GLU
(nm
ole
L-1
h-1
) Vmall bglu (nmole L-1 h-1)
Vm1
Vm50
0
2
4
6
8
10
0 2 4 6 8 10
Vm
1, v
m5
0 A
P (
nm
ole
L-1
h-1
)
Vmall AP (nmole L-1 h-1)
Vm1
Vm50
0
10
20
30
40
50
0 10 20 30 40 50
Km1, K
m5
0 L
AP
(µ
M)
Kmall LAP (µM
Km1
Km50
0
5
10
15
20
25
30
0 5 10 15 20 25 30
Km1, K
m5
0 b
GLU
(µ
M)
Kmall bglu (µM)
Km1
Km50
0
5
10
15
0 5 10 15
Km1, K
m5
0 A
P (
µM
)
Kmall AP (µM)
Km1
Km50
Fig 4
Vm1
Vm50
Vm1
Vm50
Vm1
Vm50
Km1
Km50
Km1
Km50
Km1
Km50
a b
d
c
e
f
0.1
0.2
0.3
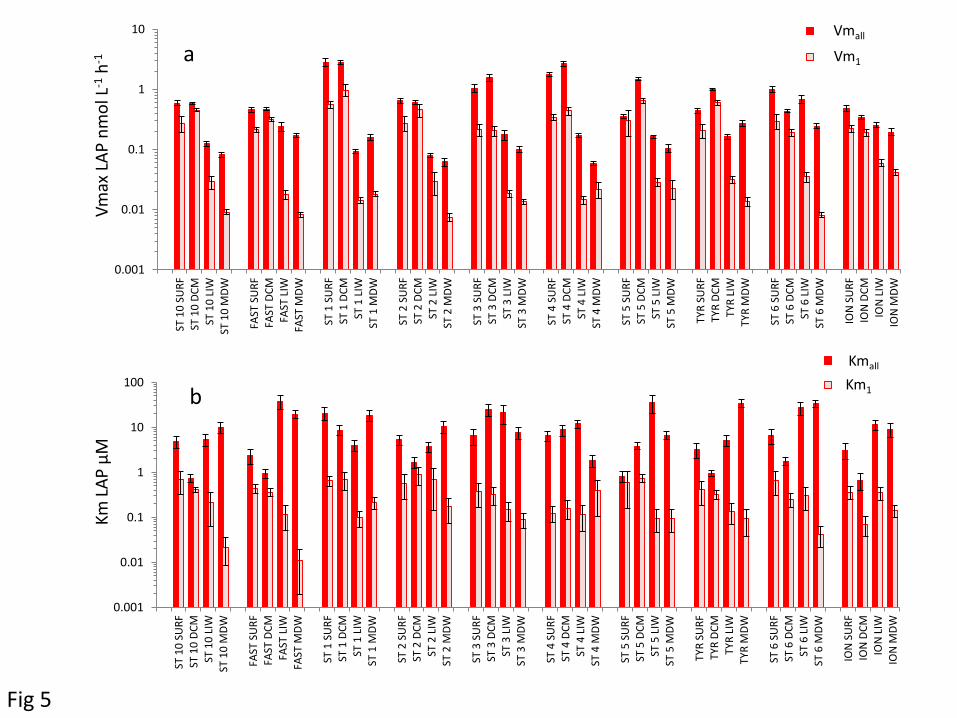
Vm
ax L
AP
nm
ol L
-1 h
-1
Km
LA
P µ
M
Fig 5
a
b
0.001
0.01
0.1
1
10
ST 1
0 S
UR
F ST
10
DC
M
ST 1
0 L
IW
ST 1
0 M
DW
FAST
SU
RF
FAST
DC
M
FAST
LIW
FA
ST M
DW
ST 1
SU
RF
ST 1
DC
M
ST 1
LIW
ST
1 M
DW
ST 2
SU
RF
ST 2
DC
M
ST 2
LIW
ST
2 M
DW
ST 3
SU
RF
ST 3
DC
M
ST 3
LIW
ST
3 M
DW
ST 4
SU
RF
ST 4
DC
M
ST 4
LIW
ST
4 M
DW
ST 5
SU
RF
ST 5
DC
M
ST 5
LIW
ST
5 M
DW
TYR
SU
RF
TYR
DC
M
TYR
LIW
TY
R M
DW
ST 6
SU
RF
ST 6
DC
M
ST 6
LIW
ST
6 M
DW
ION
SU
RF
ION
DC
M
ION
LIW
IO
N M
DW
Vmall
Vm1
0.001
0.01
0.1
1
10
100
ST 1
0 S
UR
F ST
10
DC
M
ST 1
0 L
IW
ST 1
0 M
DW
FAST
SU
RF
FAST
DC
M
FAST
LIW
FA
ST M
DW
ST 1
SU
RF
ST 1
DC
M
ST 1
LIW
ST
1 M
DW
ST 2
SU
RF
ST 2
DC
M
ST 2
LIW
ST
2 M
DW
ST 3
SU
RF
ST 3
DC
M
ST 3
LIW
ST
3 M
DW
ST 4
SU
RF
ST 4
DC
M
ST 4
LIW
ST
4 M
DW
ST 5
SU
RF
ST 5
DC
M
ST 5
LIW
ST
5 M
DW
TYR
SU
RF
TYR
DC
M
TYR
LIW
TY
R M
DW
ST 6
SU
RF
ST 6
DC
M
ST 6
LIW
ST
6 M
DW
ION
SU
RF
ION
DC
M
ION
LIW
IO
N M
DW
Kmall
Km1
Vmall
Vm1
Kmall
Km1
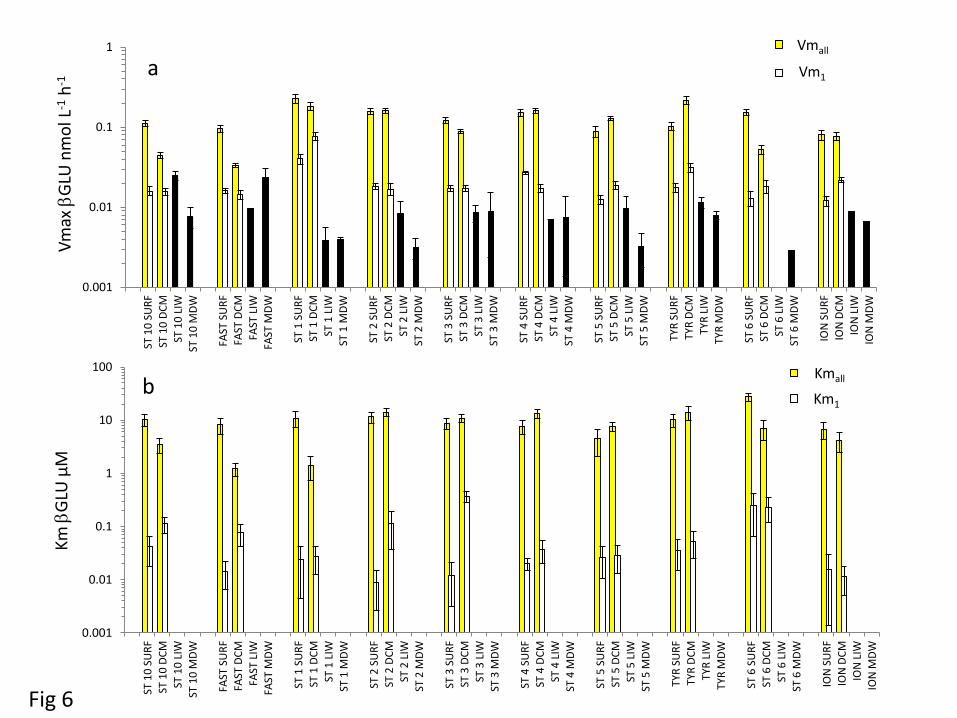
Vm
ax b
GLU
nm
ol L
-1 h
-1
Km
bG
LU µ
M
Fig 6
b
a
0.001
0.01
0.1
1
10
100
ST 1
0 S
UR
F
ST 1
0 D
CM
ST 1
0 L
IW
ST 1
0 M
DW
FAST
SU
RF
FAST
DC
M
FAST
LIW
FAST
MD
W
ST 1
SU
RF
ST 1
DC
M
ST 1
LIW
ST 1
MD
W
ST 2
SU
RF
ST 2
DC
M
ST 2
LIW
ST 2
MD
W
ST 3
SU
RF
ST 3
DC
M
ST 3
LIW
ST 3
MD
W
ST 4
SU
RF
ST 4
DC
M
ST 4
LIW
ST 4
MD
W
ST 5
SU
RF
ST 5
DC
M
ST 5
LIW
ST 5
MD
W
TYR
SU
RF
TYR
DC
M
TYR
LIW
TYR
MD
W
ST 6
SU
RF
ST 6
DC
M
ST 6
LIW
ST 6
MD
W
ION
SU
RF
ION
DC
M
ION
LIW
ION
MD
W
Kmall
Km1
0.001
0.01
0.1
1
ST 1
0 S
UR
F
ST 1
0 D
CM
ST 1
0 L
IW
ST 1
0 M
DW
FAST
SU
RF
FAST
DC
M
FAST
LIW
FAST
MD
W
ST 1
SU
RF
ST 1
DC
M
ST 1
LIW
ST 1
MD
W
ST 2
SU
RF
ST 2
DC
M
ST 2
LIW
ST 2
MD
W
ST 3
SU
RF
ST 3
DC
M
ST 3
LIW
ST 3
MD
W
ST 4
SU
RF
ST 4
DC
M
ST 4
LIW
ST 4
MD
W
ST 5
SU
RF
ST 5
DC
M
ST 5
LIW
ST 5
MD
W
TYR
SU
RF
TYR
DC
M
TYR
LIW
TYR
MD
W
ST 6
SU
RF
ST 6
DC
M
ST 6
LIW
ST 6
MD
W
ION
SU
RF
ION
DC
M
ION
LIW
ION
MD
W
Vmall
Vm1
Vmall
Vm1
Kmall
Km1
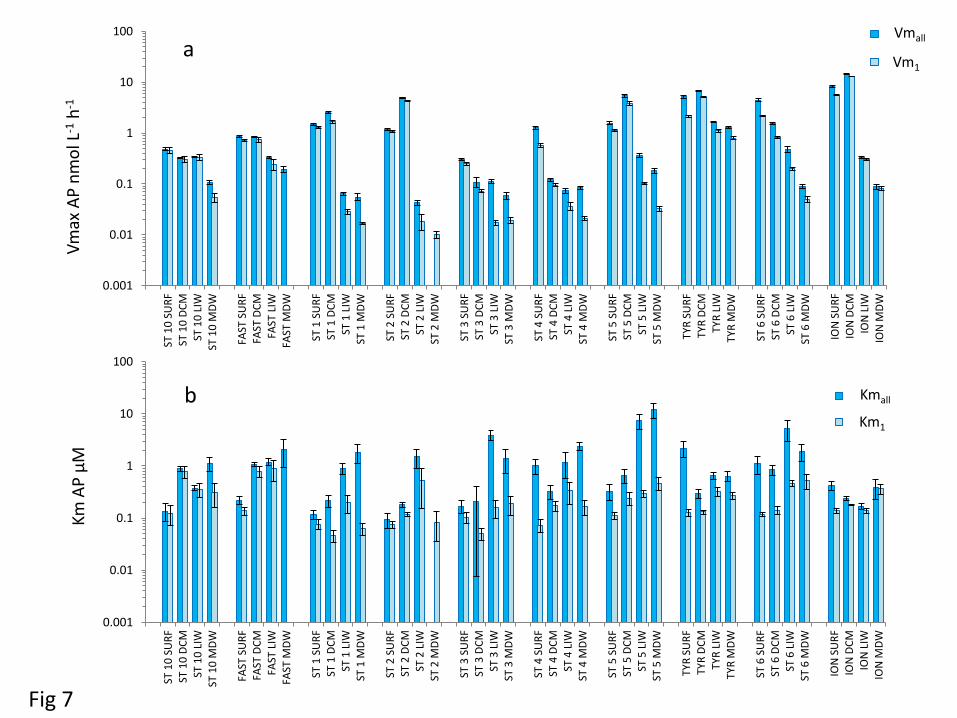
Vm
ax A
P n
mo
l L-1
h-1
K
m A
P µ
M
Fig 7
a
b
0.001
0.01
0.1
1
10
100
ST 1
0 S
UR
F ST
10
DC
M
ST 1
0 L
IW
ST 1
0 M
DW
FAST
SU
RF
FAST
DC
M
FAST
LIW
FA
ST M
DW
ST 1
SU
RF
ST 1
DC
M
ST 1
LIW
ST
1 M
DW
ST 2
SU
RF
ST 2
DC
M
ST 2
LIW
ST
2 M
DW
ST 3
SU
RF
ST 3
DC
M
ST 3
LIW
ST
3 M
DW
ST 4
SU
RF
ST 4
DC
M
ST 4
LIW
ST
4 M
DW
ST 5
SU
RF
ST 5
DC
M
ST 5
LIW
ST
5 M
DW
TYR
SU
RF
TYR
DC
M
TYR
LIW
TY
R M
DW
ST 6
SU
RF
ST 6
DC
M
ST 6
LIW
ST
6 M
DW
ION
SU
RF
ION
DC
M
ION
LIW
IO
N M
DW
Vmall
Vm1
0.001
0.01
0.1
1
10
100
ST 1
0 S
UR
F ST
10
DC
M
ST 1
0 L
IW
ST 1
0 M
DW
FAST
SU
RF
FAST
DC
M
FAST
LIW
FA
ST M
DW
ST 1
SU
RF
ST 1
DC
M
ST 1
LIW
ST
1 M
DW
ST 2
SU
RF
ST 2
DC
M
ST 2
LIW
ST
2 M
DW
ST 3
SU
RF
ST 3
DC
M
ST 3
LIW
ST
3 M
DW
ST 4
SU
RF
ST 4
DC
M
ST 4
LIW
ST
4 M
DW
ST 5
SU
RF
ST 5
DC
M
ST 5
LIW
ST
5 M
DW
TYR
SU
RF
TYR
DC
M
TYR
LIW
TY
R M
DW
ST 6
SU
RF
ST 6
DC
M
ST 6
LIW
ST
6 M
DW
ION
SU
RF
ION
DC
M
ION
LIW
IO
N M
DW
Kmall
Km1
Vmall
Vm1
Kmall
Km1

10
-18 m
ol P
cel
l-1 h
-1
10
-18 m
ol A
A c
ell-1
h-1
Fig 8
SUR
F
DC
M
LIW
MD
W
0.1
1
10
100
0.1
1
10
100
0.1
1
10
0.1
1
10
SUR
F
DC
M
LIW
MD
W
SUR
F
DC
M
LIW
MD
W
SUF
DC
M
LIW
MD
W
cs-Vm1AP cs-Vmall AP
cs-Vmall LAP
a b
c d
cs-Vm1LAP
0.1 0.1
0.1 0.1
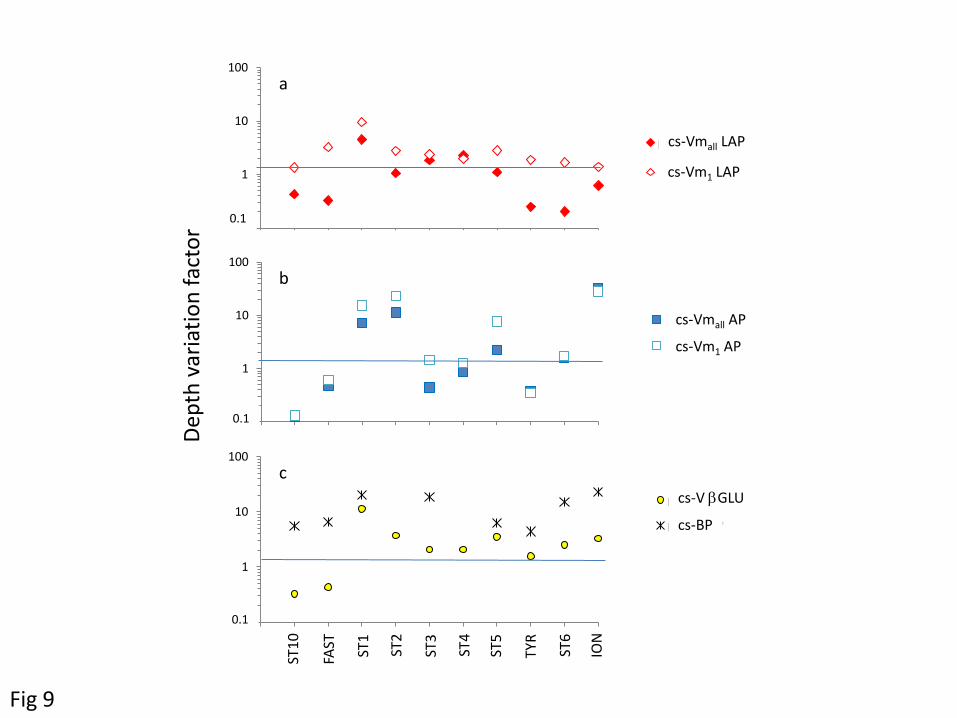
0
1
10
100
0 1 2 3 4 5 6 7 8 9 10
per cell Vmall LAP
per cell Vm1 LAP
Fig 9
Dep
th v
aria
tio
n f
acto
r 0.1
a
b
c
0
1
10
100
0 1 2 3 4 5 6 7 8 9 10
per cell Vmall AP
per cell Vm1 AP
0
1
10
100
0 1 2 3 4 5 6 7 8 9 10
per cell V Bglu
per cell BP
0.1
0.1
ST1
ST1
0
ST2
ST3
ST4
ST5
TYR
ST6
ION
FAST
cs-Vmall LAP
cs-Vm1 LAP
cs-Vmall AP
cs-Vm1 AP
cs-V bGLU
cs-BP
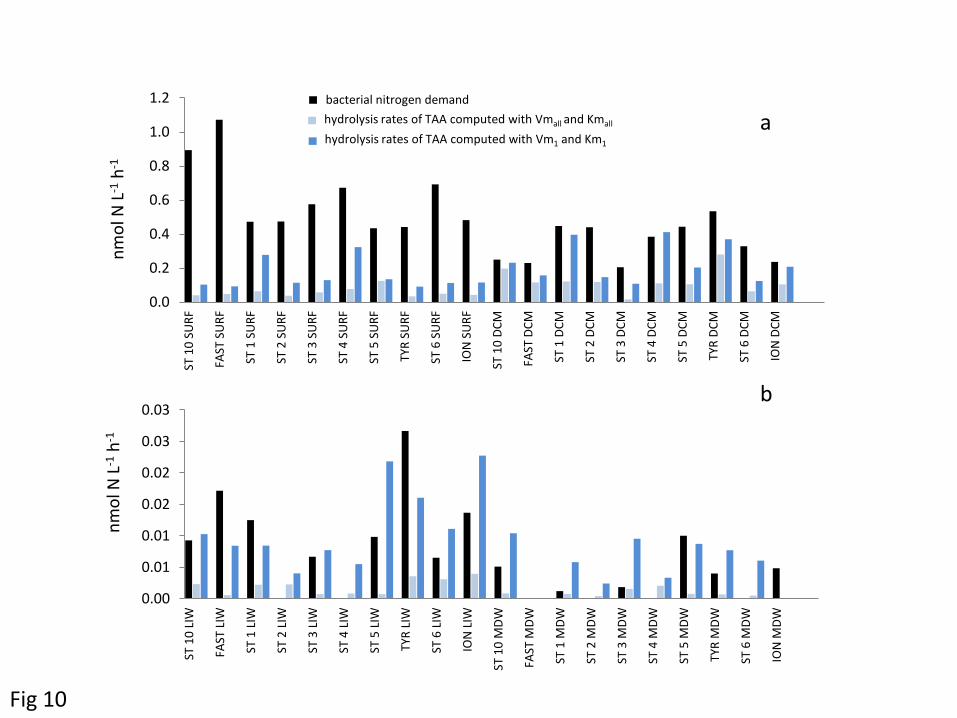
Fig 10
hydrolysis rates of TAA computed with Vmall and Kmall
hydrolysis rates of TAA computed with Vm1 and Km1
nm
ol N
L-1
h-1
bacterial nitrogen demand
nm
ol N
L-1
h-1
0.0
0.2
0.4
0.6
0.8
1.0
1.2
ST 1
0 S
UR
F
FAST
SU
RF
ST 1
SU
RF
ST 2
SU
RF
ST 3
SU
RF
ST 4
SU
RF
ST 5
SU
RF
TYR
SU
RF
ST 6
SU
RF
ION
SU
RF
ST 1
0 D
CM
FAST
DC
M
ST 1
DC
M
ST 2
DC
M
ST 3
DC
M
ST 4
DC
M
ST 5
DC
M
TYR
DC
M
ST 6
DC
M
ION
DC
M
0.00
0.01
0.01
0.02
0.02
0.03
0.03
ST 1
0 L
IW
FAST
LIW
ST 1
LIW
ST 2
LIW
ST 3
LIW
ST 4
LIW
ST 5
LIW
TYR
LIW
ST 6
LIW
ION
LIW
ST 1
0 M
DW
FAST
MD
W
ST 1
MD
W
ST 2
MD
W
ST 3
MD
W
ST 4
MD
W
ST 5
MD
W
TYR
MD
W
ST 6
MD
W
ION
MD
W
a
b
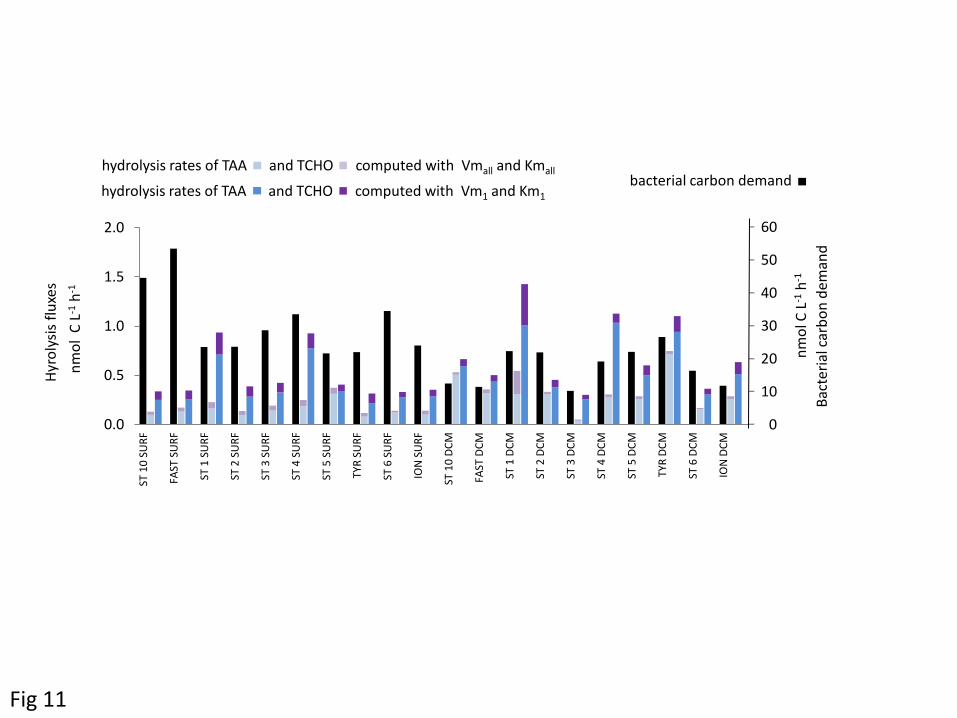
Fig 11
hydrolysis rates of TAA and TCHO computed with Vmall and Kmall bacterial carbon demand
hydrolysis rates of TAA and TCHO computed with Vm1 and Km1
Hyr
oly
sis
flu
xes
nm
ol
C L
-1 h
-1
0.0
0.5
1.0
1.5
2.0
ST 1
0 S
UR
F
FAST
SU
RF
ST 1
SU
RF
ST 2
SU
RF
ST 3
SU
RF
ST 4
SU
RF
ST 5
SU
RF
TYR
SU
RF
ST 6
SU
RF
ION
SU
RF
ST 1
0 D
CM
FAST
DC
M
ST 1
DC
M
ST 2
DC
M
ST 3
DC
M
ST 4
DC
M
ST 5
DC
M
TYR
DC
M
ST 6
DC
M
ION
DC
M 0
10
20
30
40
50
60
nm
ol C
L-1
h-1
Bac
teri
al c
arb
on
dem
and
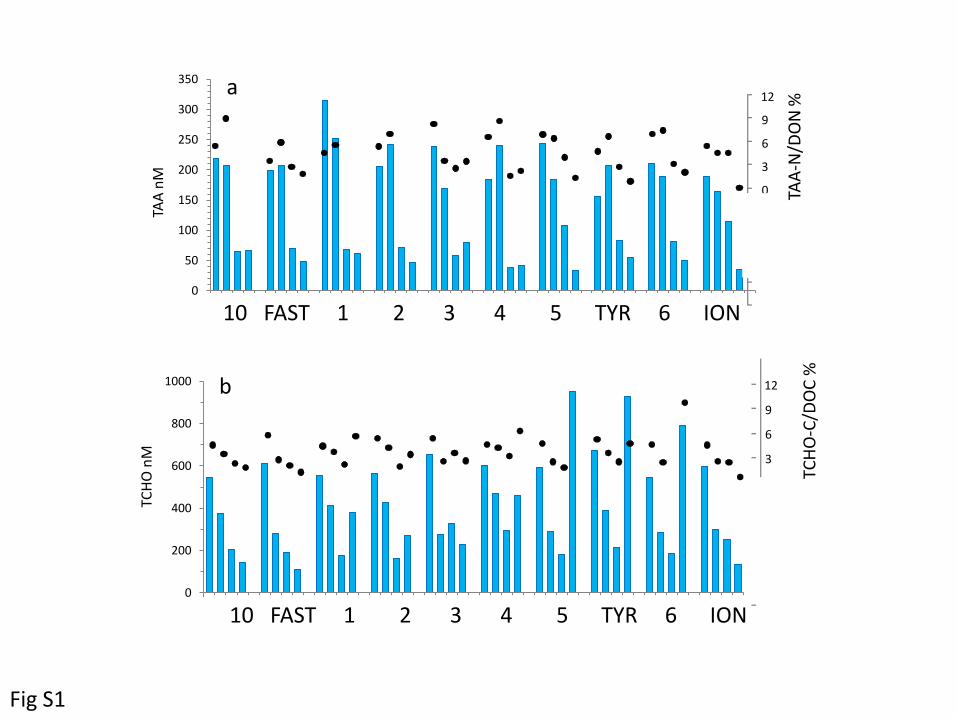
Fig S1
0
200
400
600
800
1000
ST 1
0 s
urf
ST
10
dcm
ST
10
liw
ST
10
dee
p
FAST
su
rf
FAST
dcm
FA
ST li
w
FAST
dee
p
ST 1
su
rf
ST 1
dcm
ST
1 li
w
ST 1
dee
p
ST 2
su
rf
ST 2
dcm
ST
2 li
w
ST 2
dee
p
ST 3
su
rf
ST 3
dcm
ST
3 li
w
ST 3
dee
p
ST 4
su
rf
ST 4
dcm
ST
4 li
w
ST 4
dee
p
ST 5
su
rf
ST 5
dcm
ST
5 li
w
ST 5
dee
p
TYR
su
rf
TYR
dcm
TY
R li
w
TYR
dee
p
ST 6
su
rf
ST 6
dcm
ST
6 li
w
ST 6
dee
p
ION
su
rf
ION
dcm
IO
N li
w
ION
dee
p
TCH
O n
M
0
50
100
150
200
250
300
350
ST 1
0 s
urf
ST
10
dcm
ST
10
liw
ST
10
dee
p
FAST
su
rf
FAST
dcm
FA
ST li
w
FAST
dee
p
ST 1
su
rf
ST 1
dcm
ST
1 li
w
ST 1
dee
p
ST 2
su
rf
ST 2
dcm
ST
2 li
w
ST 2
dee
p
ST 3
su
rf
ST 3
dcm
ST
3 li
w
ST 3
dee
p
ST 4
su
rf
ST 4
dcm
ST
4 li
w
ST 4
dee
p
ST 5
su
rf
ST 5
dcm
ST
5 li
w
ST 5
dee
p
TYR
su
rf
TYR
dcm
TY
R li
w
TYR
dee
p
ST 6
su
rf
ST 6
dcm
ST
6 li
w
ST 6
dee
p
ION
su
rf
ION
dcm
IO
N li
w
ION
dee
p
TAA
nM
10 FAST 1 2 3 4 5 TYR 6 ION
10 FAST 1 2 3 4 5 TYR 6 ION
0
3
6
9
12
TCH
O-C
/DO
C %
0
3
6
9
12
TAA
-N/D
ON
% a
b
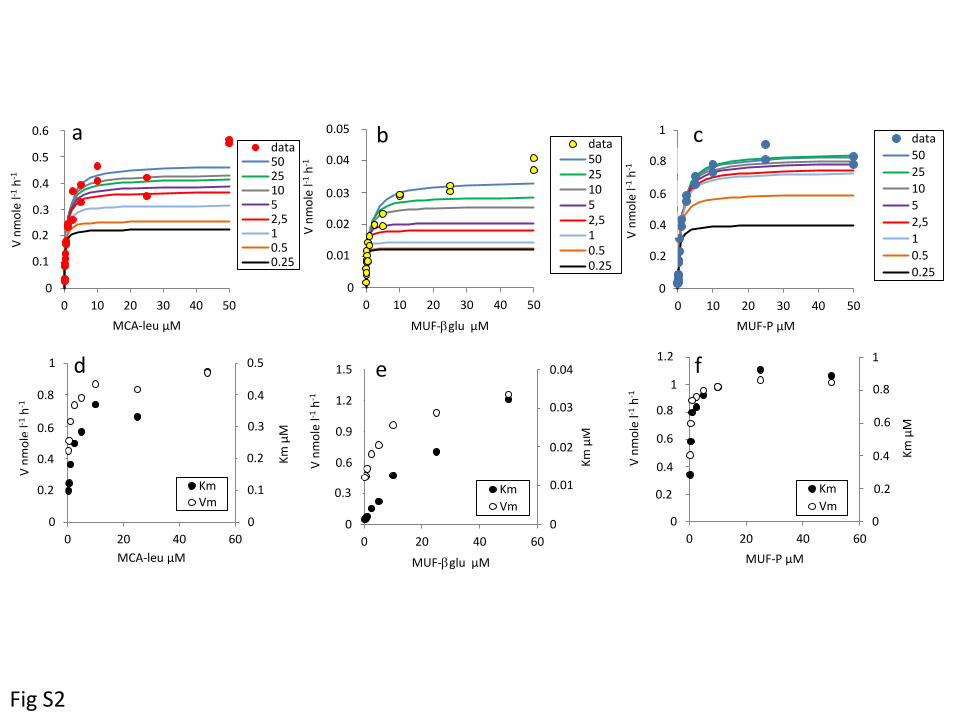
0
0.1
0.2
0.3
0.4
0.5
0.6
0 10 20 30 40 50
V n
mo
le l-1
h-1
MCA-leu µM
a data 50 25 10 5 2,5 1 0.5 0.25
0
0.01
0.02
0.03
0.04
0.05
0 10 20 30 40 50 V
nm
ole
l-1 h
-1
MUF-bglu µM
b data 50 25 10 5 2,5 1 0.5 0.25
0
0.2
0.4
0.6
0.8
1
0 10 20 30 40 50
V n
mo
le l-1
h-1
MUF-P µM
c data
50
25
10
5
2,5
1
0.5
0.25
0
0.1
0.2
0.3
0.4
0.5
0
0.2
0.4
0.6
0.8
1
0 20 40 60
Km
µM
V n
mo
le l-1
h-1
MCA-leu µM
d
Km Vm
0
0.01
0.02
0.03
0.04
0
0.3
0.6
0.9
1.2
1.5
0 20 40 60
Km
µM
V n
mo
le l-1
h-1
MUF-bglu µM
e
Km
Vm 0
0.2
0.4
0.6
0.8
1
0
0.2
0.4
0.6
0.8
1
1.2
0 20 40 60
Km
µM
V n
mo
le l-1
h-1
MUF-P µM
f
Km
Vm
Fig S2
0.05
0.01
0.02
0.03
0.04
0.6
0.5
0.4
0.3
0.1
0.2
0.2
0.4
0.6
0.8
0.2
0.4
0.6
0.8
0.5
0.4
0.3
0.1
0.2
0.3
0.6
0.9
1.2
1.5
0.01
0.02
0.03
0.04
0.2
0.4
0.6
0.8
0.2
0.4
0.6
0.8
1.2
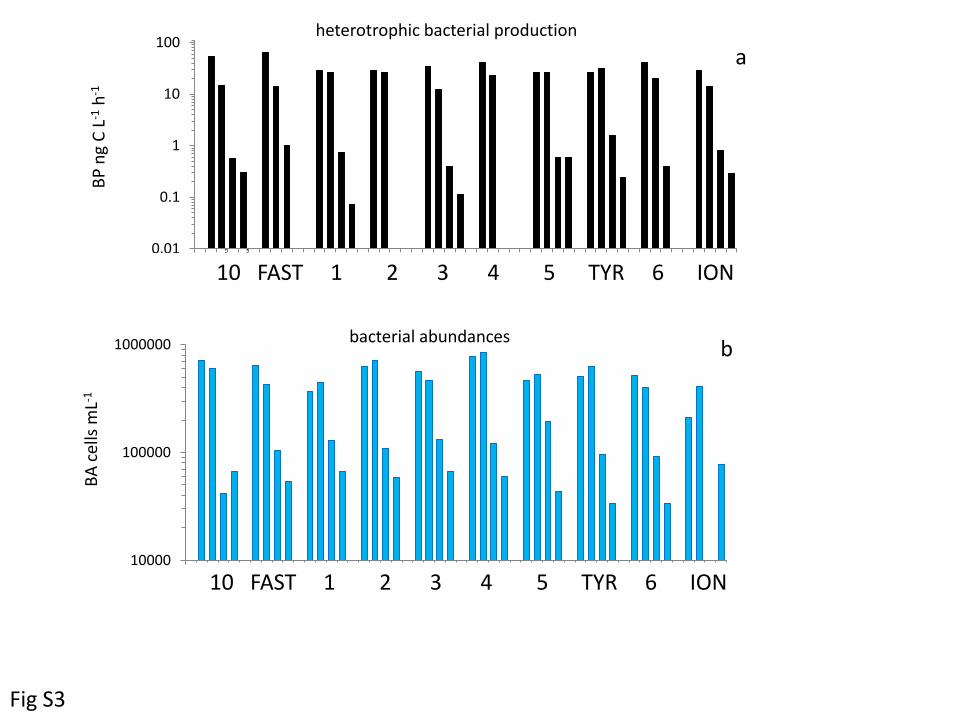
Fig S3
10000
100000
1000000
ST 1
0 d
cm
ST 1
0 d
eep
FAST
su
rf
FAST
liw
ST 1
dcm
ST 1
dee
p
ST 2
su
rf
ST 2
liw
ST 3
dcm
ST 3
dee
p
ST 4
su
rf
ST 4
liw
ST 5
dcm
ST 5
dee
p
TYR
su
rf
TYR
liw
ST 6
dcm
ST 6
dee
p
ION
su
rf
ION
liw
bacterial abundances
10 FAST 1 2 3 4 5 TYR 6 ION
BP
ng
C L
-1 h
-1
BA
cel
ls m
L-1
0.01
0.1
1
10
100
ST 1
0 …
ST 1
0 …
FAST
su
rf
FAST
liw
ST 1
dcm
ST 1
dee
p
ST 2
su
rf
ST 2
liw
ST 3
dcm
ST 3
dee
p
ST 4
su
rf
ST 4
liw
ST 5
dcm
ST 5
dee
p
TYR
su
rf
TYR
liw
ST 6
dcm
ST 6
dee
p
ION
su
rf
ION
liw
heterotrophic bacterial production
10 FAST 1 2 3 4 5 TYR 6 ION
a
b
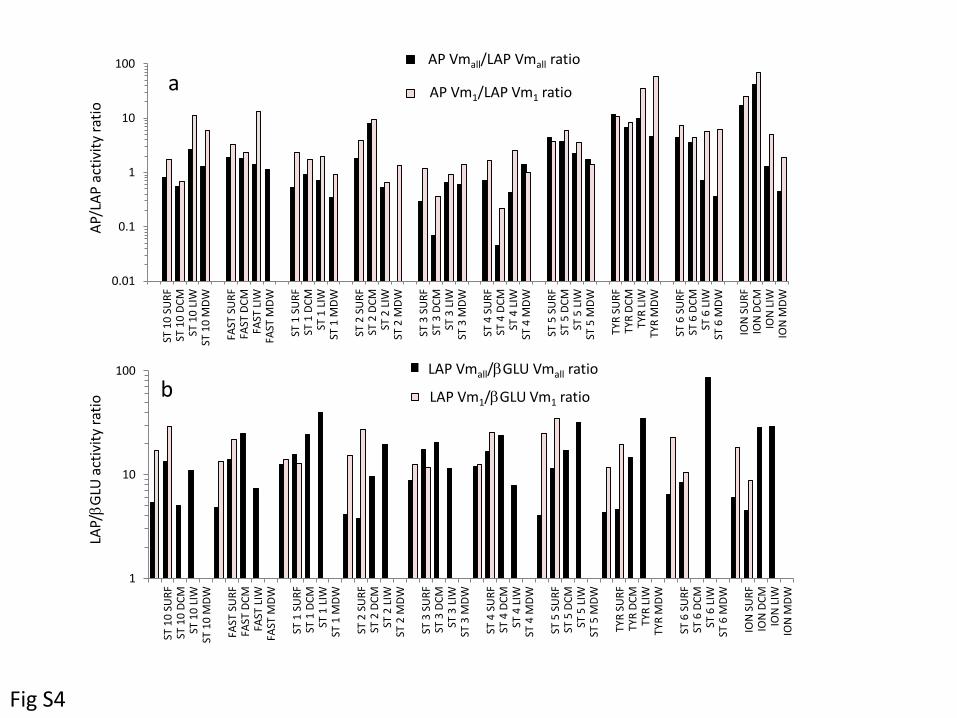
0.01
0.1
1
10
100
ST 1
0 S
UR
F ST
10
DC
M
ST 1
0 L
IW
ST 1
0 M
DW
FAST
SU
RF
FAST
DC
M
FAST
LIW
FA
ST M
DW
ST 1
SU
RF
ST 1
DC
M
ST 1
LIW
ST
1 M
DW
ST 2
SU
RF
ST 2
DC
M
ST 2
LIW
ST
2 M
DW
ST 3
SU
RF
ST 3
DC
M
ST 3
LIW
ST
3 M
DW
ST 4
SU
RF
ST 4
DC
M
ST 4
LIW
ST
4 M
DW
ST 5
SU
RF
ST 5
DC
M
ST 5
LIW
ST
5 M
DW
TYR
SU
RF
TYR
DC
M
TYR
LIW
TY
R M
DW
ST 6
SU
RF
ST 6
DC
M
ST 6
LIW
ST
6 M
DW
ION
SU
RF
ION
DC
M
ION
LIW
IO
N M
DW
Vmall ratio
Vm1 ratio
AP/
LAP
act
ivit
y ra
tio
LA
P/b
GLU
act
ivit
y ra
tio
AP Vmall/LAP Vmall ratio
AP Vm1/LAP Vm1 ratio
LAP Vmall/bGLU Vmall ratio
LAP Vm1/bGLU Vm1 ratio
a
b
Fig S4