Embed Size (px)
Citation preview

RESEARCH ARTICLE
Spatial land use trade-offs for maintenance of biodiversity,biofuel, and agriculture
Kathrine D. Behrman . Thomas E. Juenger .
James R. Kiniry . Timothy H. Keitt
Received: 19 December 2014 / Accepted: 29 May 2015 / Published online: 19 June 2015
� Springer Science+Business Media Dordrecht (outside the USA) 2015
Abstract
Context Expansion of bioenergy production is part
of a global effort to reduce greenhouse gas emissions
and mitigate climate change. Dedicated biomass crops
will compete with other land uses as most high quality
arable land is already used for agriculture, urban
development, and biodiversity conservation.
Objective First, we explore the trade-offs between
converting land enrolled in the U.S. Conservation
Reserve Program (CRP) to switchgrass for biofuel
production or preserving it for biodiversity. Next, we
examine the trade-offs between agriculture, biodiver-
sity, and biofuel across the central and eastern U.S.
Methods We compiled measures of biodiversity,
agriculture, and biofuel from land cover classifica-
tions, species range maps, and mechanistic model
output of switchgrass yield. We used a spatially-
explicit optimization algorithm to analyze the impacts
of small-to-large scale biomass production by identi-
fying locations that maximize biofuel produced from
switchgrass and minimize negative impacts on biodi-
versity and agriculture.
Results Using CRP land for switchgrass production
increases the land area required to meet biomass goals
and the species range area altered for birds, amphib-
ians, mammals, and reptiles. When conversion is not
limited to CRP, conversion scenarios including biodi-
versity and agriculture trade-offs require greater than
100 % more area for switchgrass to reach the same
production goals. When land conversion scenarios do
not include biodiversity, twice the range area for
reptiles and amphibians could be altered.
Conclusions Land-use trade-offs between biofuel
production, agriculture, and biodiversity exist and
alter optimum location of land conversion for low-to-
high biofuel levels. This highlights the need for
systematic land-use planning for the future.
Keywords Species richness � Ecosystem services �Switchgrass � Spatial optimization � ALMANAC
model � Panicum virgatum L.
Introduction
Human land-use and land-cover change have been
linked to decreases in biodiversity and degradation of
many ecosystem services (i.e. air and water quality,
Electronic supplementary material The online version ofthis article (doi:10.1007/s10980-015-0225-1) contains supple-mentary material, which is available to authorized users.
K. D. Behrman (&) � J. R. KiniryGrassland, Soil and Water Research Laboratory,
USDA-ARS, 808 East Blackland Road, Temple,
TX 76502, USA
e-mail: [email protected]
K. D. Behrman � T. E. Juenger � T. H. KeittDepartment of Integrative Biology, University of Texas at
Austin, 1 University Station C0930, Austin, TX 78712,
USA
123
Landscape Ecol (2015) 30:1987–1999
DOI 10.1007/s10980-015-0225-1

carbon sequestration, nutrient cycling, etc.) (Foley
et al. 2005). Landscapes are continually changing as a
result of human activities that convert natural land-
scapes or change management practices on previously
converted land. Human influenced landscapes, crop-
land and pasture, now cover approximately 40 % of
the earth’s terrestrial surface (Asner et al. 2004).
However, further expansion and intensification of
agriculture is still the biggest current threat to
biodiversity and ecosystem services (Rockstrom
et al. 2009; Foley et al. 2011).
Development of large-scale biofuel production is
predicted to require the largest amount of land-use
change since the formation of industrial agriculture
(Altieri 2009; Raghu et al. 2011). Most high quality
agricultural land is currently used for the production of
food, feed, fiber, forestry, nature conservation, and
urban development; the addition of bioenergy pro-
duction will compete with these current land uses
(Tilman et al. 2009). If pursued, there are many
unintended consequences of biofuel production at a
landscape scale (Tilman et al. 2009; Fargione et al.
2010). Concerns have been raised about the quality
and quantity of biomass that can be produced and the
potential impacts of large-scale biofuel production on
biodiversity and the current agricultural industry (Dale
et al. 2011; Mitchell et al. 2012). The amount of land
dedicated to bioenergy production is projected to
increase to 12.0–22.6 million ha for U.S. and Canada,
12.0–17.1 million ha for the European Union,
5.0–11.5 million ha for Asia, and 3.5–5 million ha
for Latin America by 2030 (IEA 2006).
A comprehensive understanding of biodiversity
patterns and landscape change must consider the
impact of agricultural intensification from biofuel
production. Modifying the distribution of habitat
quality and quantity will impact species diversity
and extinction patterns. Changes in species diversity
are of paramount concern because these shifts have
been linked to changes in the structure and function
of entire ecosystems (Chapin et al. 1997; Tilman
et al. 1997; Hooper et al. 2005). The quantity and
location of land conversion will depend on govern-
ment policy, society, and economics of biofuel
production. To help ensure proper ecosystem func-
tion, policy regarding biofuel production should try
to understand the potential trade-offs between land-
use for conservation of biodiversity and biofuel
production.
Current biofuel policy has been put into place as
part of a global effort to reduce greenhouse gas (GHG)
emissions and consequently global warming (Kyoto
Protocol 2009; IEA 2013). Growth of the biofuel
industry has been encouraged by an increasing number
of governments, which provide tax incentives and
subsidies to kick-start the industry. Many countries
have also set future production targets. Brazil has set
the highest goal to replace 30 % of fossils fuels used
for transportation with biofuel by 2030, the European
Union and the U.S. aim for 15 %, and China and India
4 % (IEA 2013).
There is concern that conversion of agricultural
lands to biofuel production could negatively impact
current agricultural infrastructure leading to food
shortages and rising food prices (Pimentel et al.
2008). Biofuel is a developing industry and in 2011
biofuel contributed only 2 % to worldwide transporta-
tion fuel (IEA 2013). If biofuel production increases
along with population size, meeting demands for food
and fuel will become more difficult. One proposed
solution to avoid potential negative impacts on the
current agriculture industry is to plant bioenergy crops
on land not used for agricultural production (Perlack
et al. 2005). However, non-agricultural lands provide
habitat for wildlife and could be critical for the
survival of some species that rely on these habitats in
highly fragmented landscapes (Reynolds et al. 2006;
Herkert 2007; Meehan et al. 2010).
Another option is to plant biomass crops on
erodible low quality farmland instead of clearing land
or sacrificing prime farmland (U.S. Department of
Energy 2011). Several countries have resource con-
servation and management strategies designed to
prevent erosion of agricultural land (Farm Services
Agency 2008; Towards a Thematic Strategy on Soil
Protection: Communication from the Commission of
the Council 2002). For example, in the U.S. farmers
enrolled in the Conservation Reserve Program (CRP)
are paid to remove highly erodible and environmen-
tally sensitive cropland from annual production agri-
culture for 10–15 years. The intended benefits are
conserving soil and preventing erosion while improv-
ing water quality and reducing the loss of wildlife
habitat (Johnson and Becker 2008). If biofuel produc-
tion is pursued on these low quality lands, it is unclear
how much biomass can be produced and what the
impact would be on the animals that rely on these
current plant-diverse communities.
1988 Landscape Ecol (2015) 30:1987–1999
123

The primary goal of this study is to analyze the
three-way interaction between land use for mainte-
nance of biodiversity, agriculture (including cropland,
pasture/hay, and forestry), and lignocellulosic biofuel
production from switchgrass, Panicum virgatum L.
We analyze trade-offs using machine-learning opti-
mization and generate optimal land allocation scenar-
ios that maximize simulated switchgrass biomass
production while simultaneously minimizing impacts
on biodiversity or agriculture (Ciarleglio et al. 2009).
First, we determine the quantity of land-use change
needed to meet a wide range of biomass production
levels while considering these trade-offs. Next, the
proportion of species range area altered by biofuel
production from all terrestrial amphibians, birds,
mammals, and reptiles are analyzed. Third, the land
area removed from farmland (land used for cropping
and pasture/hay) and forested land is analyzed. Lastly,
we identify locations where switchgrass cultivation
minimizes these impacts.
Materials and methods
Spatial data sources
To develop these trade-off scenarios, we defined
spatially continuous measures of biodiversity, agri-
culture, and biofuel from land cover classifications,
species range maps, and mechanistic model outputs.
The spatial extent of the analyses was limited to the
central and eastern U.S where rainfall is adequate to
support native tallgrass species. Each data source was
aggregated to a 0.25� grid cell (approximately
27.5 9 27.5 km) using ArcGIS 10.0. A 0.25� grid
cell was chosen to be small enough to capture the
effect of local variation in climatic conditions and
large enough to incorporate uncertainty in location and
variation of soil type on switchgrass yields (Behrman
et al. 2013).
Biodiversity data
For this study, we limit our use of the term ‘‘biodi-
versity’’ to reflect species diversity or alpha diversity
for four major taxon groups (amphibians, birds,
mammals, and reptiles). Because of the large spatial
extent and coarse resolution (0.25�) of our analysis,terrestrial species range maps were chosen to represent
the each species’ potential habitat area. Each biodi-
versity surface was estimated by counting the number
of terrestrial species range maps in each taxon group
that overlap each cell (BirdLife International, Natur-
eServe 2012; IUNC 2012) (Fig. S1). Species that are
exotic and invasive were excluded from the analysis.
Migratory, breeding, and wintering bird ranges were
included in the analysis but only counted once for each
species.
Land use data
We define agricultural lands as those primarily used
for current food, feed, fiber, and forestry. For
classification of agricultural land types, we chose
the 2011 National Land Cover Database (NLCD)
because it is the most recent and comprehensive
classification at a fine spatial resolution of 30 meters
(Homer et al. 2015). Three agricultural surfaces are
calculated as the proportion of land classified by the
NLCD as cultivated crops and pasture/hay, forest
(deciduous, mixed, and evergreen), and urban
development in each cell (Fig. S2). For each
surface, the proportion of area inside each 0.25�cell was calculated using ArcGIS 10.0. Farmland
was calculated as the proportional area classified as
cultivated cropland and lands used for the pasture/
hay production. Forested lands were defined as the
proportional area classified as deciduous, evergreen,
and mixed forest. Urban/impervious lands were
calculated as the proportional area classified as
open space development, low intensity development,
medium intensity development, high intensity devel-
opment, and barren land. The contribution of urban
and imperious land is included to avoid the
optimization algorithm mistakenly choosing these
areas for biomass production because they have low
proportion of agriculture and biodiversity. Since
switchgrass cannot be grown on urban or impervious
land, this contribution is removed from all reported
estimates of potential biomass production and land
conversion. In addition, cells that contained greater
than 75 percent of the area classified as national
parks, state parks, reserves, and Indian reservations
were excluded from the optimization analysis to
avoid the optimization algorithm choosing cells that
will most likely never be converted to biofuel
production (see electronic supplementary material,
Fig. S1, black dots).
Landscape Ecol (2015) 30:1987–1999 1989
123

Switchgrass biomass data
We define lignocellulosic biofuel production potential
as the spatially explicit switchgrass yield reported by
Behrman et al. (2013) for the central and eastern U.S.
where switchgrass is native. Yield values were esti-
mated by the ALMANAC model, an extensively
validated process-oriented crop growth model, param-
eterized for local adapted switchgrass ecotypes
(Fig. S3). A 0.25� grid cell was chosen to be small
enough to capture local variation in climatic condi-
tions and large enough to incorporate uncertainty in
location and variation of soil type. The biomass
potential estimated for each grid cell is the yearly
average biomass production of 20 randomly dis-
tributed fields that capture local variation in soil type
and climate. For each field, ALMANAC was run on a
daily time step for 10 years of simulated post estab-
lishment growth and harvesting. ALMANAC contains
a built in daily weather generator parameterized for
the average monthly conditions of 975 weather and
wind stations using daily data from the National
Climatic Data Center. The soil type at each field
location and the corresponding soil properties were
from the USDA-NRCS Soil Survey and Geographic
database (SSURGO). A unified management schedule
with no irrigation and adequate N and P fertilizer was
applied to all areas to allow for a more direct
comparison of environmental heterogeneity. The
modeled yield estimates show the highest switchgrass
production along the Gulf Coast, southern Atlantic
Coast, and in the East North Central Midwest (IA, IL,
IN, and OH). CRP biofuel production is defined as the
switchgrass biomass that can be produced on all active
CRP lands within each cell. This was calculated by
multiplying the land area enrolled in the Conservation
Reserve Program through 2013 by the corresponding
switchgrass yield for each cell (Farm Services Agency
2012).
Spatial optimization
Spatial optimizations using these surfaces were
obtained using CONSNET, which employs a tabu
search algorithm (Ciarleglio et al. 2009). CONSET
was developed to select optimum conservation reserve
placement from continuous estimates of the probabil-
ity of occurrence for many species. The software
selects a set of land parcels that maximize or minimize
a trade-off function within user-specified bounds. This
is novel use of the CONSET for biofuel applications.
CONSET was chosen because it has an advanced
search algorithm that can quickly search alternative
solutions across a large spatial extent. A general
weighted constraint was used to minimize the cost to
all layers grouped as agriculture and biodiversity
while maximizing biofuel production (see Table S1
for the weights). Each optimization was run for
500,000 iterations to ensure the optimum solution
was found. All optimizations were started with both all
cells and no cells selected. The scenarios analyzed
each differentially weight the relative importance of
biodiversity, biofuel production, and agriculture. For
each scenario, 72 optimizations were run encompass-
ing low-to-high switchgrass biomass production
targets.
We analyze two different sets of trade-off scenar-
ios. The first set of trade-offs termed, T1, assumes that
land available for biofuel production is limited to land
enrolled in the U.S. Conservation Reserve Program
(CRP). The spatial extent of the T1 analysis is limited
to grid cells that contained land enrolled in the CRP
and the only trade-off is between biodiversity and the
quantity of biomass production on CRP lands. The
second set of trade-offs, termed T2 assumes that all
land in the central and eastern U.S. is available for
biofuel production except areas that contain greater
than 75 % national parks, state parks, reserves, and
Indian reservations. We analyze the trade-offs
between all three entities: biodiversity, agriculture,
and biofuel production. For each trade-off analysis, we
specify a scenario or a set of relative weights to
maximize biofuel production while simultaneously
Fig. 1 A graphical representation showing the relatives
weights of the four T2 scenarios in parameter space (‘‘all
trade-offs’’, ‘‘agriculture-biofuel trade-off’’, ‘‘biodiversity-agri-
culture trade-off’’, ‘‘biofuel only’’)
1990 Landscape Ecol (2015) 30:1987–1999
123
minimizing the cost to biodiversity and agriculture
(Fig. 1). Next for each scenario, a biomass production
target is set and the optimization algorithm is run until
a stable solution is found. The optimum solutions
identified for three scenarios and three biomass
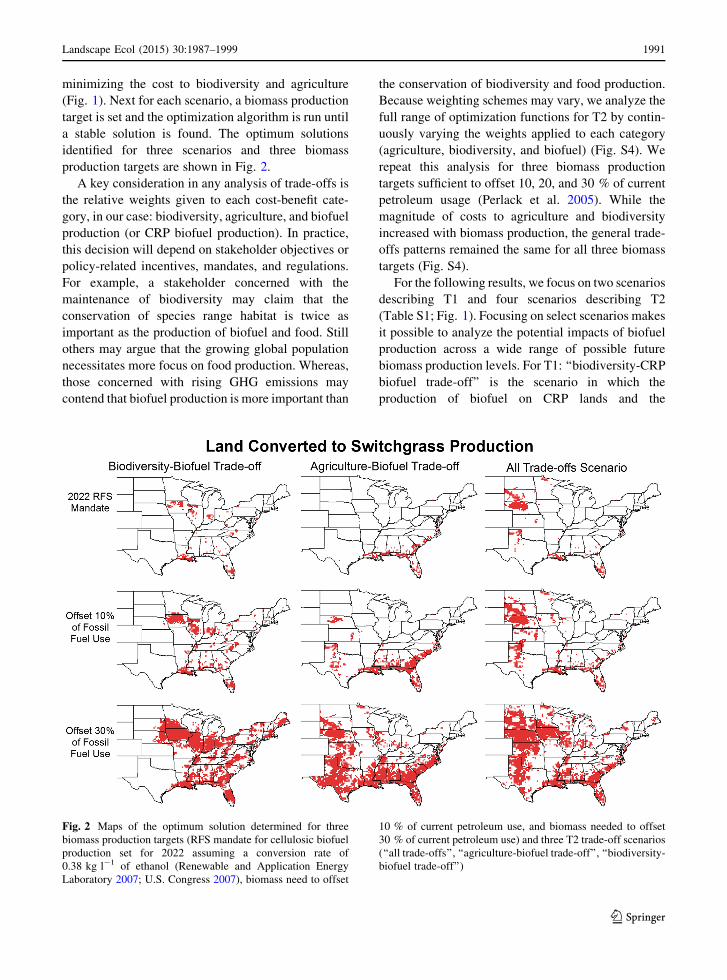
production targets are shown in Fig. 2.
A key consideration in any analysis of trade-offs is
the relative weights given to each cost-benefit cate-
gory, in our case: biodiversity, agriculture, and biofuel
production (or CRP biofuel production). In practice,
this decision will depend on stakeholder objectives or
policy-related incentives, mandates, and regulations.
For example, a stakeholder concerned with the
maintenance of biodiversity may claim that the
conservation of species range habitat is twice as
important as the production of biofuel and food. Still
others may argue that the growing global population
necessitates more focus on food production. Whereas,
those concerned with rising GHG emissions may
contend that biofuel production is more important than
the conservation of biodiversity and food production.
Because weighting schemes may vary, we analyze the
full range of optimization functions for T2 by contin-
uously varying the weights applied to each category
(agriculture, biodiversity, and biofuel) (Fig. S4). We
repeat this analysis for three biomass production
targets sufficient to offset 10, 20, and 30 % of current
petroleum usage (Perlack et al. 2005). While the
magnitude of costs to agriculture and biodiversity
increased with biomass production, the general trade-
offs patterns remained the same for all three biomass
targets (Fig. S4).
For the following results, we focus on two scenarios
describing T1 and four scenarios describing T2
(Table S1; Fig. 1). Focusing on select scenarios makes
it possible to analyze the potential impacts of biofuel
production across a wide range of possible future
biomass production levels. For T1: ‘‘biodiversity-CRP
biofuel trade-off’’ is the scenario in which the
production of biofuel on CRP lands and the
Fig. 2 Maps of the optimum solution determined for three
biomass production targets (RFS mandate for cellulosic biofuel
production set for 2022 assuming a conversion rate of
0.38 kg l-1 of ethanol (Renewable and Application Energy
Laboratory 2007; U.S. Congress 2007), biomass need to offset
10 % of current petroleum use, and biomass needed to offset
30 % of current petroleum use) and three T2 trade-off scenarios
(‘‘all trade-offs’’, ‘‘agriculture-biofuel trade-off’’, ‘‘biodiversity-
biofuel trade-off’’)
Landscape Ecol (2015) 30:1987–1999 1991
123

maintenance of species biodiversity are weighted
equally, and ‘‘CRP biofuel only’’ allocates land area
based on CRP biofuel production potential irrespec-
tive of either agricultural land use or biodiversity. For
T2, ‘‘all trade-offs’’ is the scenario in which all three
entities (biodiversity, agriculture, and biofuel) are
included and weighted as equally important, ‘‘biodi-
versity-biofuel trade-off’’ is the scenario in which the
production of biofuel and the maintenance of species
biodiversity are weighted equally, ‘‘agriculture-bio-
fuel trade-off’’ is the scenario in which the production
of biofuel and the maintenance of agriculture are given
equal weight, and ‘‘biofuel only’’ is where land
conversion is solely based on simulated biofuel
production potential irrespective of either agricultural
land use or biodiversity.
Biomass production guidelines
To provide a reference point for comparing these
trade-off scenarios across a wide range of biofuel
production levels, three biomass production levels
relevant to U.S. biofuel policy are explicitly com-
pared. These thresholds are guidelines to understand
how the magnitude of biomass production for ethanol
will contribute to offsetting fossil fuels use in the U.S.
We did not specifically frame our analysis based on
these recommendations and this comparison is not
meant to imply that switchgrass should be or is the
only biomass crop in this region that will contribute to
filling these production goals.
The first production goal is the U.S. Energy
Independence Security Act of 2007’s renewable fuel
standard (RFS), which mandates production of 60
billion liters of lignocellulosic ethanol per year by
2022 (Renewable and Application Energy Laboratory
2007). Assuming a biomass to ethanol conversion rate
of 0.38 l kg-1 of ethanol, that is equivalent to
159 million Mg of biomass production per year
(U.S. Congress 2007). In the second RFS (RFS2),
the environmental protection agency (EPA) further
qualifies that biomass cultivation must be on land that
is actively managed, fallow, and non-forested prior to
December 19, 2007 (US Environmental Protection
Agency 2010). This includes cropland, pasture/hay,
and land enrolled in the CRP. The NLCD is a spectral
classification product and it may not have the ability to
capture subtle changes between all managed land
types as specified by the RFS2. Because of this
uncertainty and to allow for analysis of the T2
scenarios across a wide range of biomass production
levels, we did not limit our scenario development to
only actively managed, fallow, and non-forested land
as specified by the RFS2. However to relate our
scenarios directly to the RSF2, we did additionally
calculate the land area necessary to meet the 2022
biomass production goal if only land classified as
cropland or pasture by the NLCD is allowed to be
converted to biomass production.
The second and the third biomass production goals
are both related to the future estimates made by the
Billion-Ton Study (BTS) of potential biomass avail-
able mid-century when large-scale biofuel refineries
may exist (Perlack et al. 2005; U.S. Department of
Energy 2011). This biomass will come from forest
biomass, agricultural biomass, waste resources, and
bioenergy crops. The second biomass production goal
is 393 millionMg, which was estimated as the biomass
production necessary to offset 10 percent of U.S. fossil
fuel use (Perlack et al. 2005). The third production
goal is 1179 million Mg of biomass to offset 30 % of
U.S. fossil fuel use.
Results
Total area requirements
Minimizing biodiversity impacts (‘‘diversity-CRP
biofuel trade-off’’) does not increase the land area
required compared to the ‘‘CRP biofuel only’’ scenario
(Fig. 3), possibly reflecting a relatively homogeneous
distribution of taxon species diversity in CRP lands. If
all current CRP land (6.7 million ha) in the central and
eastern U.S. is converted to switchgrass production, an
estimated 62.4 million Mg of biomass could be
produced each year. Although commercial-scale bio-
fuel production from switchgrass has not yet been
achieved, assuming a biomass to ethanol conversion
rate of 0.38 l kg-1 of ethanol, at most CRP land
conversion could produce 39 % of the biomass needed
to meet the 2022 RFS2 goal. However, if biofuel
production is not limited to CRP land (T2 scenarios),
then substantially less land area is needed to meet the
same biomass production levels for all four trade-off
scenarios (Fig. 3, left panel).
When all land is considered available for conver-
sion, optimizations minimizing the cost to both
1992 Landscape Ecol (2015) 30:1987–1999
123

biodiversity and agriculture require more land area
conversion for all biomass production levels (Figs. 2,
3). At low biomass production goals (\20 million Mg
per year) the amount of land conversion for the
‘‘biofuel only’’ and ‘‘biodiversity-biofuel trade-off’’
scenario is approximately the same (Fig. 3, left panel).
Scenarios with multiple constraints (‘all trade-offs’’,
‘‘agriculture-biofuel trade-off’’, ‘‘biodiversity-biofuel
trade-off’’) require more land conversion as biomass
production levels increase ([20 million Mg per year)
compared to the ‘‘biofuel only’’ scenario because areas
with lower switchgrass productivity are chosen to
avoid areas of high productivity that also contain high
levels of biodiversity or agricultural production
(Fig. 3, right panel). To meet the 2022 goal, a
minimum of 8.3 million ha of land will be needed to
produce switchgrass biomass, and this increases up to
15.1 million ha (82 %more land) when trade-offs with
both biodiversity and agriculture are considered (‘‘all
trade-offs’’ scenario) (Fig. 3; Table 1). When land
conversion is limited to land classified as cropland or
pasture/hay by the NLCD to emulate the guidelines
specified by the RFS2, then 9.5–15.6 million ha of land
will be required to meet the 2022 goal (Table 1,
parentheses).
However if cellulosic biofuel from switchgrass
expands to offset 30 % of current petroleum use, a
minimum of 79.1 million ha of land will be required
for biomass production, and this increases to 99.1,
99.2, and 109.1 million ha if land management
decisions incorporating trade-offs with both agricul-
ture, biodiversity, and both agriculture and biodiver-
sity are considered (Figs. 2, 3). By sacrificing one of
the three classifications (‘‘biodiversity-biofuel scenar-
io’’ or ‘‘agriculture-biofuel scenario’’), the land area
required to meet the 30 % goal can be reduced
(Table 1).
Potential biodiversity impact
When land conversion is limited to land enrolled in the
CRP, both the ‘‘CRP biofuel only scenario’’ and
‘‘biodiversity-CRP biofuel trade-off’’ scenario have
nearly the same proportion of range alternation for all
four diversity groups across production levels ranging
from 0 to 62.8 million Mg per year (Fig. S6). This
indicates that even though CRP lands harbor many
species, there is little variation in total taxon species
diversity in these areas and therefore a relatively
consistent cost to species diversity will always be
Fig. 3 The land area needed to meet small (right panel) and
large (left panel) biomass production levels for the two T1
(‘‘CRP biofuel only trade-off’’—solid gray line and ‘‘biodiver-
sity-CRP biofuel trade-off’’—dashed gray line) and four T2
(‘‘all trade-offs’’—dotted and dashed black line, ‘‘agriculture-
biofuel trade-off’’—dashed black line, ‘‘biodiversity-biofuel
trade-off’’—dotted black line, and ‘‘biofuel only’’—solid black
line) scenarios of land-use change. The gray dashed lines
highlight three biomass production goals (RFS mandate for
cellulosic biofuel production set for 2022 assuming a conversion
rate of 0.38 kg l-1 of ethanol (Renewable and Application
Energy Laboratory 2007; U.S. Congress 2007), biomass need to
offset 10 % of current petroleum use, biomass needed to offset
30 % of current petroleum use)
Landscape Ecol (2015) 30:1987–1999 1993
123
acquired when converting CRP land to switchgrass
monocultures. Furthermore, the proportion of poten-
tial range area altered for all taxon groups decreases
when land conversion is not confined to CRP land
(Fig. S6).
For the four T2 scenarios, there are clear trade-offs
between biodiversity and biofuel. The ‘‘biodiversity-
biofuel trade-off’’ scenario removes the smallest
cumulative proportion of species range area for all
taxon groups, and the proportion of range area altered
to offset 10 % of current petroleum production is close
to 5 % for all taxon groups (Table 2; Fig. S7). The
‘‘biofuel only’’ and ‘‘biodiversity-biofuel trade-off’’
scenarios require similar proportions of range area
removal for mammals and birds. The ‘‘all trade-offs’’
scenario removes the most mammal and bird range
area. Reptiles and amphibians will have the largest
proportion of their range area altered when species
diversity is ignored (‘‘agriculture-biofuel trade-off’’
and ‘‘biofuel only’’ scenario) in our optimization of
biofuel field placement (Fig. S7). The ‘‘agriculture-
biofuel trade-off’’ scenario has the largest impact on
reptiles when production levels are high ([700 million
Mg per year).
Potential impact to agriculture
The amount of farmland, area classified as cultivated
crops or pasture/hay, removed from agricultural
production and replaced by perennial switchgrass
monocultures is the highest in the ‘‘biodiversity-
biofuel trade-off’’ scenario (Table 1; Fig. S5). At
lower production targets (\160 million Mg per year),
optimization including agriculture (‘‘agriculture-bio-
fuel trade-off’’ scenario) does not lead to a substantial
decrease in the proportion of farmland (\0.2 million
ha difference). However at higher biomass production
goals ([400 million Mg per year), optimization
including agriculture reduces farmland conversion to
biofuel production (Fig. S5).
Avoiding regions with high species diversity (‘‘bio-
diversity-biofuel trade-off’’ scenario) reduces the
amount of forested land converted to biofuel produc-
tion and increases the amount of agricultural land
converted to biofuel production (Table 1; Fig. S5).
Minimizing the impact to both agriculture and diver-
sity (‘‘all trade-offs’’ scenario) requires conversion of
the least amount of forested land to biofuel production.
When the negative impacts on biodiversity and
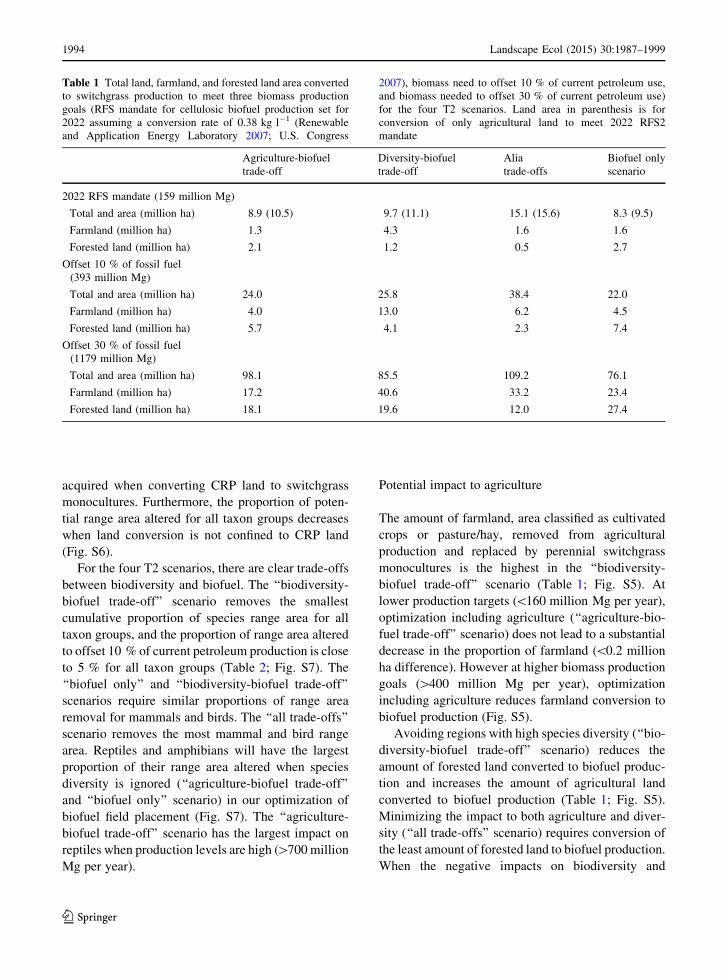
Table 1 Total land, farmland, and forested land area converted
to switchgrass production to meet three biomass production
goals (RFS mandate for cellulosic biofuel production set for
2022 assuming a conversion rate of 0.38 kg l-1 (Renewable
and Application Energy Laboratory 2007; U.S. Congress
2007), biomass need to offset 10 % of current petroleum use,
and biomass needed to offset 30 % of current petroleum use)
for the four T2 scenarios. Land area in parenthesis is for
conversion of only agricultural land to meet 2022 RFS2
mandate
Agriculture-biofuel
trade-off
Diversity-biofuel
trade-off
Alia
trade-offs
Biofuel only
scenario
2022 RFS mandate (159 million Mg)
Total and area (million ha) 8.9 (10.5) 9.7 (11.1) 15.1 (15.6) 8.3 (9.5)
Farmland (million ha) 1.3 4.3 1.6 1.6
Forested land (million ha) 2.1 1.2 0.5 2.7
Offset 10 % of fossil fuel
(393 million Mg)
Total and area (million ha) 24.0 25.8 38.4 22.0
Farmland (million ha) 4.0 13.0 6.2 4.5
Forested land (million ha) 5.7 4.1 2.3 7.4
Offset 30 % of fossil fuel
(1179 million Mg)
Total and area (million ha) 98.1 85.5 109.2 76.1
Farmland (million ha) 17.2 40.6 33.2 23.4
Forested land (million ha) 18.1 19.6 12.0 27.4
1994 Landscape Ecol (2015) 30:1987–1999
123

agriculture are ignored (‘‘biofuel only’’ scenario) the
amount of forested land converted to biofuel substan-
tially increases.
Spatial land use trade-offs
To analyze the spatial location of the optimum
solution, 72 optimizations were run for each scenario
from low to high biomass production levels to create a
‘‘frequency’’ surface (Fig. 4). Frequency refers to the
proportion of times that each location was chosen as
part of a stable optimum solution. Locations with high
frequency are consistently chosen as optimum solu-
tions for both low and high biomass production levels.
Whereas, low frequency locations are only chosen
when biomass production levels are high.
The locations targeted for the T1 and T2 trade-off
scenarios are mostly disjunct (Fig. 4). The regions
targeted for switchgrass biomass production under the
single T1 trade-off scenario (‘‘biodiversity-CRP bio-
fuel trade-off’’) are in regions with a high density of
CRP land (Fig. 4, top left, and Fig. S8). The only
regions frequently targeted for switchgrass biomass
production under all three T2 trade-off scenarios
(agriculture, biodiversity and all trade-offs) are the
highly productive lowland regions of southern gulf
coast and southern FL. This is because switchgrass
productivity is predicted to be the highest in this
region. The regions that minimize the quantity of
agriculture land displaced while maximizing switch-
grass yields (‘‘agriculture-biofuel trade-off’’) are
along the gulf coast of LA, GA, MS, AL and FL,
and the Atlantic coast in GA, SC, and NC (Fig. 4,
bottom left). The regions that minimize the cost to
biodiversity (‘‘biodiversity-biofuel trade-off’’) are
primarily located in the Corn Belt (IA, IL, and IN),
Gulf Coast of LA, and southern FL (Fig. 4, top right).
When both the removal of land from traditional
agriculture and biodiversity is minimized (‘‘all trade-
offs’’), the regions most frequently chosen as optimal
for conversion to switchgrass cropping systems are in
LA along the gulf coast, southern FL, and central NE
(Fig. 4, bottom right).
Discussion
Laud use change for biofuel production is already
occurring and is expected to continue (Altieri 2009;
Raghu et al. 2011). These changes will have contending
Table 2 Percentage of species range area in the central and
eastern U.S. converted to biofuel production for the four T2
scenarios to meet three biomass production goals (RFS
mandate for cellulosic biofuel production set for 2022
assuming a conversion rate of 0.38 kg l-1 (Renewable and
Application Energy Laboratory 2007; U.S. Congress 2007),
biomass need to offset 10 % of current petroleum use, and
biomass needed to offset 30 % of current petroleum use)
Agriculture-biofuel trade-off Diversity-biofuel trade-off All trade-offs Biofuel only scenario
2022 RFS mandate (159 million Mg)
Amphibian range area (%) 3.2 2.0 2.3 3.6
Bird range area (%) 2.1 2.1 3.2 2.2
Reptile range area (%) 3.3 2.0 2.7 3.5
Mammal range area (%) 1.8 1.9 3.1 2.1
Offset 10 % of fossil fuel (393 million Mg)
Amphibian range area (%) 8.2 5.5 6.0 9.3
Bird range area (%) 5.4 5.6 8.2 5.9
Reptile range area (%) 8.7 5.1 7.6 9.4
Mammal range area (%) 4.7 5.1 8.2 5.3
Offset 30 % of fossil fuel (1179 million Mg)
Amphibian range area (%) 24.7 19.5 19.5 27.9
Bird range area (%) 21.2 18.4 23.0 18.7
Reptile range area (%) 31.7 17.2 23.6 26.7
Mammal range area (%) 20.7 17.1 23.1 17.5
Landscape Ecol (2015) 30:1987–1999 1995
123

impacts on agriculture and biodiversity (Tilman et al.
2009). The patterns of land use changewill be driven by
the values given to these competing aspects by stake-
holders. Government regulations may direct some of
these changes, but further planning with a clear
understanding of value and trade-offs is needed tomake
informed decisions. Here we utilize a spatially explicit
optimization technique to formally explore trade-offs
between biofuel, biodiversity and agriculture under two
sets of trade-off scenarios.
The plant material needed to produce lignocellu-
losic biofuel can come from a variety of resources,
such as cellulosic waste, forest residues and thinning,
annual crop residues, perennial energy crops, and
short-rotation woody crops (Perlack et al. 2005). Here
we present a macro-ecological analysis of one poten-
tial feedstock, switchgrass, to allow for a more direct
comparison of impacts across landscape scale land use
patterns. Switchgrass is a leading second-generation
biofuel crops because it is adapted to a large range of
climatic conditions, can produce reasonable yields on
marginal lands without irrigation, and requires lower
agrochemical inputs (Sanderson et al. 1996; Casler
et al. 2004; Perlack et al. 2005; McLaughlin et al.
2006; Schmer et al. 2008; U.S. Department of Energy
2011). Perennial grasses take 3 years to reach full
yield potential therefore commitment to biofuel pro-
duction is considered long-term compared to annual
cropping systems. The goal of this study is identify
potential trade-offs for one potential feedstock that can
be grown throughout a large portion of the U.S.
However, we are not implying that one feedstock will
supply all the biomass to meet U.S. biofuel production
needs. From a practical standpoint if large-scale
biofuel production is pursued, biomass for biofuels
will likely come from a broad set of regionally adapted
plant material. The inclusion of other species or even
improved varieties of switchgrass will alter the yields
and the associated trade-offs explored here.
Land-use change has been documented as the
primary cause of biodiversity loss and is predicted to
be the leading cause of biodiversity loss in 2100 (Sala
et al. 2000). If only CRP land is used for biofuel
production from switchgrass, the proportion of biodi-
versity range area altered increases due to an increase
in the amount of land area needed to meet biomass
production levels. However, CRP land alone can
provide 40 percent of the biomass needed to meet the
2022 RFS2. The land-use conversion of 8.3–15.6
million ha of agricultural land to switchgrass produc-
tion will be needed to meet the RSF2. These estimates
are with in the range of agricultural land conversion
Fig. 4 A heat map showing the frequency of land conversion or
(the proportion of times each cell was chosen as part of an
optimum solution) for the one T1 trade-off scenario (‘‘biodi-
versity-CRP biofuel trade-off’’—top left) and three T2 trade-off
scenarios (‘‘all trade-offs’’—bottom right, ‘‘agriculture-biofuel
trade-off’’—bottom left, ‘‘biodiversity-biofuel trade-off’’—top
right). Cells that are bright red or close to one were chosen for
almost all production levels. Cells that are bright blue or close to
zero were never chosen or only chosen when the production
level was large
1996 Landscape Ecol (2015) 30:1987–1999
123
values for 2022, 5.3–17.8 million ha, reported for
perennial grasses for a range of prices assuming high
crop yield growth (U.S. Department of Energy 2011).
When all land uses are available for conversion,
minimizing conversion of high diversity areas (‘‘bio-
diversity-biofuel trade-off’’ scenario) greatly reduces
the proportion of reptile and amphibian range area
altered. Birds and mammals however do not benefit
greatly from optimization, as the proportion of range
area altered is similar under both the ‘‘biodiversity-
biofuel trade-off’’ and ‘‘biofuel only’’ scenarios. A
likely explanation is that lower diversity of birds and
mammals in the high-productivity agricultural land-
scapes are favored by our optimizations.
Minimizing the amount of agricultural land
removed from production (‘‘all trade-offs’’ or ‘‘agri-
culture-biofuel trade-off’’ scenario) reduces the quan-
tity of forested land cleared for biofuel production and
the quantity of GHGs emitted from direct land
conversion (Danielsen et al. 2008; Fargione et al.
2008; Searchinger et al. 2008). Increases in GHG
levels have been linked to global warming and
consequently the extinction or shifts in many species’
ranges (Thomas et al. 2004; Parmesan 2006). At low
biomass production goals (\400 million Mg year-1)
minimizing the conversion of agricultural land does
not reduce farmland conversion. This is because the
areas that have the highest predicted switchgrass
productivity are on prime farmland. Conversely at
high biomass production goals ([1.2 billion Mg per
year) the quantity of farmland and forested land
removed from production can be cut in half under the
‘‘agriculture-biofuel trade-off’’ scenario. Therefore
segregating biofuel production away from agricultural
land may be necessary to maintain stable food
production and prices and reduce GHG emissions
under high biofuel production levels.
The impacts of large-scale biofuel production can
be considered from many different perspectives. Our
study presents one in which the impact of land-use
change is measured as the area removed from
agriculture or the species range area altered and
replaced by switchgrass monocultures for biofuel
production. The consequences are assumed to be the
loss of biodiversity in that area and the potential
economic consequences of replacing food, fiber, or
feed production with biofuel. Other environmental
impacts of land-use conversion to biofuel cropping
include the release of GHGs, soil erosion, water
quality, soil organic carbon, nitrate leaching, etc.
(Renewable Fuels Agency 2008; Davis et al. 2010;
Robertson et al. 2011c). These indirect effects are
often assumed to be small because switchgrass is a
perennial grass with low fertilizer and pesticide
requirements (McLaughlin and Walsh 1998). How-
ever, management plays a big role in this assumption
and a variety of different management practices
should be extensively evaluated before large-scale
biofuel production from switchgrass is implemented
(Wang et al. 2010).
We defined the impact to biodiversity as the
cumulative species range area altered from each
taxon group. This measure of biodiversity is not
sensitive to the loss of an individual species and
does not identify a species that may become
threatened or endangered due to land-use change.
There are many other measures of biodiversity that
may provide a different set of solutions than the
ones presented here (Brooks et al. 2009). For
example, a large area in the Central Great Plains
was chosen as the optimum solution for the ‘‘all
trade-offs scenario’’. This area contains a high
number of endangered birds (Dobson et al. 1997).
If biodiversity was defined by endangered species
instead of total species diversity the biodiversity
value assigned and the corresponding solution for
each scenario would be altered.
Species diversity is a fairly conservative measure of
biodiversity because all land-use change is assumed to
have an equal negative impact on biodiversity. It is
possible that planting switchgrass could have a
positive effect on biodiversity, but may be specific to
the type of land conversion and species of interest.
Specifically, perennial grasses provide an increase in
post breeding and migratory stop over habitat com-
pared to traditional row crops resulting in increased
bird diversity (Robertson et al. 2011a, b). In addition,
land enrolled in the CRP has been documented to
increase the abundance of many declining bird species
and it is unclear if clearing and planting switchgrass
monocultures will negatively affect these species
(Reynolds et al. 2006; Herkert 2007). We also assume
that the magnitude of all land conversion is equal. That
is, converting pasture to switchgrass is the same as
converting row crops to switchgrass. In an area with
high land-use heterogeneity, species range maps may
not capture these fine-scale changes in community
composition between these different land uses.
Landscape Ecol (2015) 30:1987–1999 1997
123

Because of the relatively large spatial resolution of
our analysis we did not impose spatial constraints
influencing compactness or connectivity on the opti-
mization algorithm. That means a single cell has the
same probability of being selected as a group of cells.
Assuming a biomass productivity of 10 Mg ha-1 each
cell has the capacity to fuel a 190 million liter ethanol
plant using only 70 % of the area (U.S. Department of
Energy 2011). In reality, there will be costs associated
with transportation of biomass that will depend on
refinery locations and the network configuration of
roads and railways. Incorporating GHG emissions and
fuel cost associated with transportation to and from
biofuel refineries and related spatial constraints may
alter the perceived costs and benefits of land conver-
sion. Considering biomass transportation will be an
important next step in modeling land use trade-offs.
Land area for biomass production will be the factor
limiting large-scale biofuel production from switch-
grass. However, future research efforts focused on
improving conversion efficiency and enhancing bio-
mass production through genetic breeding and
advancements in agronomic management may reduce
the amount of land area needed for conversion.
Reducing land-use change will alleviate some of the
negative impacts on biodiversity and the agricultural
industry identified by our trade-off analysis.
Negative effects of biofuel expansion have already
been documented and the biofuel industry is still in its
infancy (Wanget al. 2010).Manydifficult decisionswill
need to be made to meet biofuel production goals. Any
efforts to assess risks of land-conversion strategies can
provide valuable input to potentially mitigate or lessen
the severity of these negative impacts on biodiversity.
Acknowledgments We thank Daren Harmel, Mari-Vaughn
Johnson, NormanMeki, andWayne Polley for helpful comments.
Funding for this works was provided by The National Science
Foundation Plant Genome Research Program award number NSF
IOS-0922457. USDA is an equal opportunity provider and
employer.
References
Altieri MA (2009) The ecological impacts of large-scale agro-
fuel monoculture production systems in the Americans.
Bull Sci Technol Soc 29(3):236–244
Asner GP, Elmore AJ, Olander LP,Martin RE, Harris AT (2004)
Grazing systems, ecosystem responses, and global change.
Annu Rev Environ Resour 29(1):261–299
Behrman KD, Kiniry JR, Winchell M, Juenger TE, Keitt TH
(2013) Spatial forecasting of switchgrass productivity
under current and future climate change scenarios. Ecol
Appl 23(1):73–85
BirdLife International, NatureServe (2012) Bird species distri-
bution maps of the world. Version 2.0. BirdLife Interna-
tional, Cambridge, UK and NatureServe, Arlington
Brooks TM, Mittermeier RA, Da Fonseca GAB, Gerlach J,
Hoffmann M, Lamoreux JF, Mittermeier CG, Pilgrim JD,
Rodrigues ASL (2006) Global biodiversity conservation
priorities. Science 313(5783):58–61
Casler MD, Vogel KP, Taliaferro CM, Wynia RL (2004) Lati-
tudinal adaptation of switchgrass populations. Crop Sci
44:293–303
Chapin FS,Walker BH, Hobbs RJ, Hooper DU, Lawton JH, Sala
OE, Tilman D (1997) Biotic control over the functioning of
ecosystems. Science 277(5325):500–504
Ciarleglio M, Wesley Barnes J, Sarkar S (2009) ConsNet: new
software for the selection of conservation area networks
with spatial and multicriteria analyses. Ecography 32(2):
205–209
Dale VH, Kline KL, Wright LL, Perlack RD, Downing M,
Graham RL (2011) Interactions among bioenergy feed-
stock choices, landscape dynamics, and land use. Ecol
Appl 21(4):1039–1054
Danielsen F, Beukema H, Burgess ND, Parish F, Bruhl CA,
Donald PF, Murdiyarso D, Phalan B, Reijnders L, Struebig
M, Fitzherbert EB (2008) Biofuel plantations on forested
lands: double jeopardy for biodiversity and climate. Con-
serv Biol 23(2):348–358
Davis S, Parton W, Dohleman F, Smith CM, Grosso SD, Kent
AD, DeLucia EH (2010) Comparative biogeochemical
cycles of bioenergy crops reveal nitrogen-fixation and low
greenhouse gas emissions in aMiscanthus giganteus agro-
ecosystem. Ecosystems 13(1):144–156
Dobson AP, Rodriguez JP, Roberts WM, Wilcove DS (1997)
Geographic distribution of endangered species in the
United States. Science 275(5299):550–553
Fargione JE, Hill JD, Tilman D, Polasky S, Hawthorne P (2008)
Land clearing and the biofuel carbon debt. Science
319(5867):1235–1238
Fargione JE, Plevin RJ, Hill JD (2010) The ecological impact of
biofuels. Annu Rev Ecol Evol Syst 41(1):351–377
Farm Services Agency (2008) Farm Bill 2008. Farm Services
Agency, Washington DC
Farm Services Agency (2012) Conservation Reserve Program.
Farm Services Agency, Washington DC
Foley JA,DefriesR,AsnerGP,BarfordC,BonanG, Carpenter SR,
Chapin FS, Coe MT, Daily GC, Gibbs HK, Helkowski JH,
Holloway T, Howard EA,Kucharik CJ,Monfreda C, Patz JA,
Prentice IC, Ramankutty N, Snyder PK (2005) Global con-
sequences of land use. Science 309(5734):570–574
Foley JA, Ramankutty N, Brauman KA, Cassidy ES, Gerber JS,
Johnston M, Mueller ND, O’Connell C, Ray DK, West PC,
Balzer C, Bennett EM, Carpenter SR, Hill J, Monfreda C,
Polasky S, Rockstrom J, Sheehan J, Siebert S, Tilman D,
Zaks DP (2011) Solutions for a cultivated planet. Nature
478(7369):337–342
Herkert JR (2007) Conservation reserve program benefits on
Henslow’s sparrows within the United States. J Wildl
Manag 71(8):2749–2751
1998 Landscape Ecol (2015) 30:1987–1999
123
Hooper DU, Chapin FS III, Ewel JJ, Hector A, Inchausti P,
Lavorel S, Lawton JH, Lodge DM, Loreau M, Naeem S,
SchmidB, Setala H, SymstadAJ,Vandermeer J,WardleDA
(2005) Effects of biodiversity on ecosystem functioning: a
consensus of current knowledge. Ecol Monogr 75(1):3–35
Homer CG, Dewitz JA, Yang L, Jin S, Danielson P, Xian G,
Coulston J, Herold ND, Wickham JD, Megown K (2015)
Completion of the 2011 National Land Cover Database for
the conterminous United States-Representing a decade of
land cover change information. Photogramm Eng Remote
Sens 81(5):345–354
IEA (2006) World energy outlook 2006. Organisation for eco-
nomic co-operation and development, Paris
IEA (2013) World energy outlook 2013. Organisation for Eco-
nomic Co-operation and Development, Paris
IUNC (2012) IUNC Red List of Threatened Species Version
2012.1
Johnson R, Becker GS (2008) The 2008 Farm Bill: major pro-
visions and legislative action. Congressional Research
Service, Library of Congress
Kyoto Protocol (2009) United Nations Framework Convention
on Climate Change
McLaughlin SB, Walsh ME (1998) Evaluating environmental
consequences of producing herbaceous crops for bioen-
ergy. Biomass Bioenergy 14(4):317–324
McLaughlin SB, Kiniry JR, Taliaferro CM, DeLaTorreUgarte D
(2006) Projecting yield and utilization potential of switch-
grass as an energy crop. In: Donald LS (ed) Advances in
agronomy. Academic Press, London, pp 267–297
Meehan TD, Hurlbert AH, Gratton C (2010) Bird communities
in future bioenergy landscapes of the Upper Midwest. Proc
Natl Acad Sci 107(43):18533–18538
Mitchell R, Vogel KP, Uden DR (2012) The feasibility of
switchgrass for biofuel production. Biofuels 3(1):47–59
Parmesan C (2006) Ecological and evolutionary responses to
recent climate change. Annu Rev Ecol Evol Syst
37:637–669
Perlack RD, Wright LL, Turhollow AF, Graham RL, Stokes BJ,
Erbach DC (2005) Biomass as feedstock for a bioenergy
and bioproducts industry: the technical feasibility of a
billion-ton annual supply, ORNL/TM-2005/66, DOE/GO-
102005-2135
Pimentel D, Marklein A, Toth MA, Karpoff M, Paul GS,
McCormack R, Kyriazis J, Krueger T (2008) Biofuel
impacts on world food supply: use of fossil fuel. Land
Water Resour Energy 1(2):41–78
Raghu S, Spencer JL, Davis AS, Wiedenmann RN (2011)
Ecological considerations in the sustainable development
of terrestrial biofuel crops. Curr Opin Environ Sustain
3(1–2):15–23
Renewable and Application Energy Laboratory (2007) Energy
and resources group biofuels analysis meta-model.
University of California, Berkley
Renewable Fuels Agency (2008) The Gallagher review of the
indirect effects of biofuels production. Renewable Fuels
Agency, London
Reynolds RE, Shaffer TL, Loesch CR, Cox RR (2006) The farm
bill and duck production in the prairie pothole region:
increasing the benefits. Wildl Soc Bull 34(4):963–974
Robertson BA, Doran PJ, Loomis ER, Robertson JR, Schemske
DW (2011a) Avian use of perennial biomass feedstocks as
post-breeding and migratory stopover habitat. PLoS One
6(3):16941
Robertson BA, Doran PJ, Loomis LR, Robertson JR, Schemske
DW (2011b) Perennial biomass feedstocks enhance avian
diversity. GCB Bioenergy 3(3):235–246
Robertson G, Hamilton S, Del Grosso S, Parton W (2011c) The
biogeochemistry of bioenergy landscapes: carbon, nitro-
gen, and water considerations. Ecol Appl 21:1055–1067
Rockstrom J, Steffen W, Noone K, Persson A, Chapin FS 3rd,
Lambin EF, Lenton TM, Scheffer M, Folke C,
Schellnhuber HJ, Nykvist B, deWit CA, Hughes T, van der
Leeuw S, Rodhe H, Sorlin S, Snyder PK, Costanza R,
Svedin U, Falkenmark M, Karlberg L, Corell RW, Fabry
VJ, Hansen J, Walker B, Liverman D, Richardson K,
Crutzen P, Foley JA (2009) A safe operating space for
humanity. Nature 461(7263):472–475
Sala OE, Chapin FS 3rd, Armesto JJ, Berlow E, Bloomfield J,
Dirzo R, Huber-Sanwald E, Huenneke LF, Jackson RB,
Kinzig A, Leemans R, Lodge DM, Mooney HA, Oester-
held M, Poff NL, Sykes MT, Walker BH, Walker M, Wall
DH (2000) Global biodiversity scenarios for the year 2100.
Science 287(5459):1770–1774
Sanderson MA, Reed RL, McLaughlin SB, Wullschleger SD,
Conger BV, Parrish DJ, Wolf DD, Taliaferro C, Hopkins
AA, Ocumpaugh WR, Hussey MA, Read JC, Tischler CR
(1996) Switchgrass as a sustainable bioenergy crop.
Bioresour Technol 56(1):83–93
Schmer MR, Vogel KP, Mitchell RB, Perrin RK (2008) Net
energy of cellulosic ethanol from switchgrass. Proc Natl
Acad Sci 105(2):464–469
Searchinger T, Heimlich R, Houghton RA, Dong F, Elobeid A,
Fabiosa J, Tokgoz S, Hayes D, Yu TH (2008) Use of U.S.
croplands for biofuels increases greenhouse gases through
emissions from land-use change. Science 319(5867):
1238–1240
Thomas CD, Cameron A, Green RE, Bakkenes M, Beaumont
LJ, Collingham YC, Erasmus BF, De Siqueira MF,
Grainger A, Hannah L, Hughes L, Huntley B, Van Jaars-
veld AS, Midgley GF, Miles L, Ortega-Huerta MA,
Peterson AT, Phillips OL, Williams SE (2004) Extinction
risk from climate change. Nature 427(6970):145–148
Tilman D, Knops J, Wedin D, Reich P, Ritchie M, Siemann E
(1997) The influence of functional diversity and composi-
tion on ecosystem processes. Science 277(5330):1300–1302
Tilman D, Socolow R, Foley JA, Hill J, Larson E, Lynd L (2009)
Beneficial biofuels—the food, energy, and environment
trilemma. Science 325(5938):270–271
Towards a Thematic Strategy on Soil Protection: Communica-
tion from the Commission of the Council (2002) The
Economic and Social Committee and the Committee of the
Regions, Brussels
U.S. Congress (2007) Energy Independence and Security Act of
2007. http://www.GovTrack.us
U.S. Department of Energy (2011) U.S. billion-ton update:
biomass supply for a bioenergy and bioproducts industry.
RD Perlack and BJ Stokes (Leads), ORNL/TM-2011/224.
Oak Ridge National Laboratory, Oak Ridge, TN. 227p
Wang D, Lebauer DS, Dietze MC (2010) A quantitative review
comparing the yield of switchgrass in monocultures and
mixtures in relation to climate and management factors.
GCB Bioenergy 2(1):16–25
Landscape Ecol (2015) 30:1987–1999 1999
123


![Synergies or Trade-Offs? Optimizing a Virtual Urban Region ...€¦ · and Asami[2011, follow-up inHaque and Asami(2014)] that investigate differences in spatial configuration when](https://img.pdfslide.us/doc/110x75/6050aa975ecb864653574da0/synergies-or-trade-offs-optimizing-a-virtual-urban-region-and-asami2011-follow-up.jpg)